Article

Ethylene Regulates Combined Drought and Low Nitrogen Tolerance in Wheat: Proteomic Analysis

1
College of Life Sciences, Shanxi Normal University, Taiyuan 030031, China
2
State Key Laboratory for Crop Gene Resources and Genetic Improvement, Institute of Crop Sciences, Chinese Academy of Agricultural Sciences, Key Laboratory of Biology and Genetic Improvement of Triticeae Crops, The Ministry of Agriculture and Rural Affairs, Beijing 100081, China
3
Modern College of Humanities and Sciences of Shanxi Normal University, Linfen 041000, China
*
Authors to whom correspondence should be addressed.
These authors contributed equally to this work.
Agronomy 2023, 13(7), 1950; https://doi.org/10.3390/agronomy13071950
Submission received: 2 July 2023 / Revised: 14 July 2023 / Accepted: 18 July 2023 / Published: 24 July 2023
(This article belongs to the Collection Crop Physiology and Stress)

Abstract

:
Wheat is a staple crop in China’s arid and semi-arid regions. Drought and low nitrogen (LN) are two major constraints to wheat growth and production. However, the molecular mechanism underlying wheat response to both drought and LN stress remains unknown. Accordingly, we conducted a proteomic study on the roots of two wheat varieties, Chang6878 (drought tolerant) and Shi4185 (drought sensitive) and compared the differences between drought and combined drought and LN stress treatments. In total, 5143 proteins were identified, of which 163 differentially abundant proteins (DAPs) were uniquely upregulated under drought and LN stress in Chang6878. Enrichment analysis showed that DAPs were mainly involved in mitogen-activated protein kinase signaling, phenylpropanoid biosynthesis, glutathione metabolism, ethylene biosynthesis, ethylene signal transduction, and oxidation–reduction reactions. These DAPs were verified via parallel reaction monitoring and quantitative real-time polymerase chain reaction. Chang6878 was treated with the ethylene synthesis precursor 1-aminocyclopropanecarboxylic acid, and its resistance to drought and LN stress improved. After treatment with the ethylene synthesis inhibitor silver nitrate and ethylene signal transduction inhibitor 1-methylcyclopropene, drought and LN stress resistance reduced. These results provide novel insights into the tolerance mechanisms of Chang6878 to drought and LN stress by altering ethylene synthesis and signal transduction. This study provides a reference for breeding drought- and low-nitrogen-tolerant wheat germplasm resources and a theoretical basis for maintaining food security in arid, barren areas.

1. Introduction

Food security and climate change are intricately linked [1], with the latter posing considerable challenges to the former. Long-term global warming accelerates soil desiccation [2]. The total global dryland area is expected to increase by 11–23% by 2050, accounting for 50–56% of the total land surface [3]. This will greatly impact agricultural production, particularly for crops such as wheat (Triticum aestivum L.) [4]. Wheat is an important food crop that plays a crucial role in food security; however, wheat planting regions are primarily located in arid and semi-arid agricultural production systems in which the spatiotemporal distribution of precipitation is highly erratic. This phenomenon severely constrains wheat production [5]. As water is a universal solvent, crops cannot efficiently absorb several macronutrients (e.g., nitrogen) from arid soil [6]. Therefore, drought and low-nutrient stresses may coexist under such conditions. Moreover, wheat’s low water-use capacity in barren soil aggravates drought stress [7]. To adapt to various stressors, plants have evolved response pathways that mitigate the damage caused by multiple simultaneous stressors and ensure normal growth, development, and fruit/seed production. Previous studies of plant resistance to abiotic stress have focused mainly on a single stressor, either drought or low nitrogen (LN). However, few studies have investigated the mechanisms through which plant responses to various simultaneous abiotic stressors are synergistically regulated. Understanding the synergistic regulation of drought and LN mechanisms in wheat may improve stress resistance and yield stability.
Previous studies have demonstrated interactions between drought and LN stresses at the physiological level. An appropriate increase in the soil water content may directly affect nitrate uptake from arid soil, promote nitrogen transfer from the vegetative organs to the fruits and seeds, improve nitrogen-use efficiency, and increase crop yields [8]. Nitrogen transport control under drought stress could also enhance drought resistance [9]. Nitrogen fertilization increases the leaf area index of wheat, as well as its dry matter, grain yield, and water-use efficiency, under drought conditions [10]. Nitrogen application in wheat plants upregulates antioxidant enzymes (i.e., superoxide dismutase, peroxidase, catalase, glutathione reductase, and ascorbate peroxidase); increases the soluble sugar, soluble protein, and proline contents; enhances osmoregulatory capacity; and improves drought resistance [11]. Nitrogen application also stimulates soil water absorption and utilization in winter wheat [12]. Appropriate fertilization promotes canopy growth, transpiration, and water uptake and transport [13], in addition to improving drought tolerance in wheat. The high-affinity nitrate transporter NRT2.1 positively regulates root water transport capacity, and may also play a role in plant drought tolerance [14]. A previous study found that overexpression of the DREB-like transcription factor GmTDN1 enhanced photosynthetic capacity, osmoregulation, antioxidant capacity, and root nitrogen uptake in transgenic wheat. Thus, GmTDN1 also synergistically improved drought tolerance and nitrogen-use efficiency [15]. However, the signaling pathways at the whole-protein level that regulate drought and LN tolerances in wheat remain to be elucidated.
This study subjected Chang6878 (drought tolerant, DT) and Shi4185 (drought sensitive, DS) wheat cultivars to combined drought and LN stress. We compared the proteomes of both wheat varieties under different stress conditions. Proteomic analysis showed that the mitogen-activated protein kinase (MAPK) pathway, including ethylene and hydrogen peroxide, is involved in response to drought and LN stress, as verified using parallel reaction monitoring (PRM), quantitative real-time polymerase chain reaction (qRT-PCR), and hydroponic experiments. Our study clarified the mechanism underlying drought and LN resistance in wheat, and these findings can help facilitate the breeding of wheat germplasm resources with superior tolerance to both drought and LN.

2. Materials and Methods

2.1. Plant Materials and Growth Conditions

The plants selected for this study were the Chang6878 and Shi4185 wheat varieties. Chang6878 is a winter type early maturing variety with strong drought resistance selected by the Millet Research Institute of Shanxi Academy of Agricultural Sciences. Shi4185 is bred by the Agricultural Science Research Institute of Shijiazhuang City, Hebei Province, and is suitable for cultivation under high-water and -fertilizer conditions. The plant height stress index (PSHI) was used to assess drought tolerance in the wheat seedlings and was calculated as follows:
PSHI = plant height under stress treatment − plant height under normal condition × 100%
PSHI values increase with increased drought tolerance. Newly harvested wheat seeds were oven-heated at 42 °C for 15 d to break their dormancy, rinsed thrice with deionized water, and germinated at 37 °C for 2 d. At the three lateral root stage, half of the seedlings were transplanted into a bottomless 96-well plate (Beijing Tao Heng Technology Co., Ltd., Beijing, China) and placed in water for 3 d to remove the nitrogen from the seeds in a light incubator with 16 h of light (28 °C)/8 h of darkness (24 °C) and a relative humidity of approximately 60%. They were then placed in a nutrient solution for 4 d and returned to the water until they reached the two-leaf, one-cord stage. After 4 d, the seedlings were placed in liquid media containing 25% (w/v) PEG 6000 and either 0.2 mM Ca(NO3)2 (LN treatment) or 2 mM Ca(NO3)2 (Normal N treatment). Wheat normal and LN nutrient solution formulations are shown in Supplementary Table S1. The treatment concentrations were based on long-term validation in our laboratory, and have been reported [15]. The root tips were excised 2 d after stress onset, pulverized in liquid nitrogen, weighed, and stored at −80 °C until protein extraction. Three independent biological replicates were set up per treatment. The same samples were used for RNA extraction and qRT-PCR analyses. Seedling shoot lengths, root lengths, fresh weights, and survival were measured after 8 d of the stress treatments. To verify the effects of ethylene synthesis and signal transduction pathways on wheat drought and LN stress tolerances, Chang6878 was chosen. After wheat was grown to two leaves and a heart in normal nutrient solution, the culture conditions were changed. A LN nutrient solution containing 25% PEG6000 was supplemented with 10 µM/L 1-aminocyclopropanecarboxylic acid (ACC) [16], 4 mg/L silver nitrate [17], and 100 µM/L 1-methylcyclopropene (1-MCP) pre-experimental determination. As a control, an LN nutrient solution containing 25% PEG6000 was used. After 7 d of treatment, the effect of the treatments on wheat resistance was observed. The shoot fresh weight, dry weight, survival rate, and relative water content of leaf were also counted. Three independent biological replicates were set up per treatment.

2.2. Proteomics Analysis and Targeted Protein Quantification by PRM

Total proteins in 0.1 g wheat seedling roots were extracted and digested (each sample had four independent biological replicates), and the mass spectrometer (MS) parameters were set according to the methods of Zhu et al. [18]. The raw MS/MS files were processed using MaxQuant v. 1.6.0 (https://www.maxquant.org/download_asset/maxquant/latest accessed on 8 March 2017) and searched in the UniProt database (https://www.uniprot.org accessed on 17 December 2021) under Triticum aestivum (UP000019116, 2022). Proteins were identified and label-free quantitation and PRM analyses were performed according to the methods of Wang et al. [19]. The MS proteomics data were deposited in the ProteomeXchange Consortium (http://proteomecentral.proteomexchange.org accessed on 9 October 2022) via the iProX partner repository under dataset identifier PXD037408. The minimum value replaced the missing values in the label-free quantitation data. The differentially abundant proteins (DAPs) were defined as those with fold change (FC) > 1.2 or <0.83, while significant differences were indicated by p < 0.05. A principal component analysis was conducted using the ggplot2_3.3.0 and ggfortify_0.4.9 packages in R (R Core Team, Vienna, Austria). Pearson’s correlation coefficient analyses were performed using the corrplot_0.84 package in R. Volcano plots were generated using the ggplot2 package in R.

2.3. Total RNA Extraction and qRT-PCR

Total RNA was extracted from the frozen root samples, reverse-transcribed, and subjected to qRT-PCR as described by Xu et al. [20]. To verify the gene-level expressions of the differential proteins, samples of both varieties subjected to drought alone and drought and LN conditions for 48 h were used for qRT-PCR. The relative expression levels were normalized to the expression of the TaACTIN gene [21] and determined using the 2−ΔΔCT method [22]. All samples were stored at −80 °C, and three replicates were analyzed per sample. The PCR primers used in this study are listed in Supplementary Table S2.

2.4. Physiological Assays

The activities of NR, GST, and POD were measured using an assay kit (Suzhou Kemin Biotechnology Co., Ltd., Suzhou, China) in three technical and three biological replicates according to the manufacturer’s instructions.

3. Results

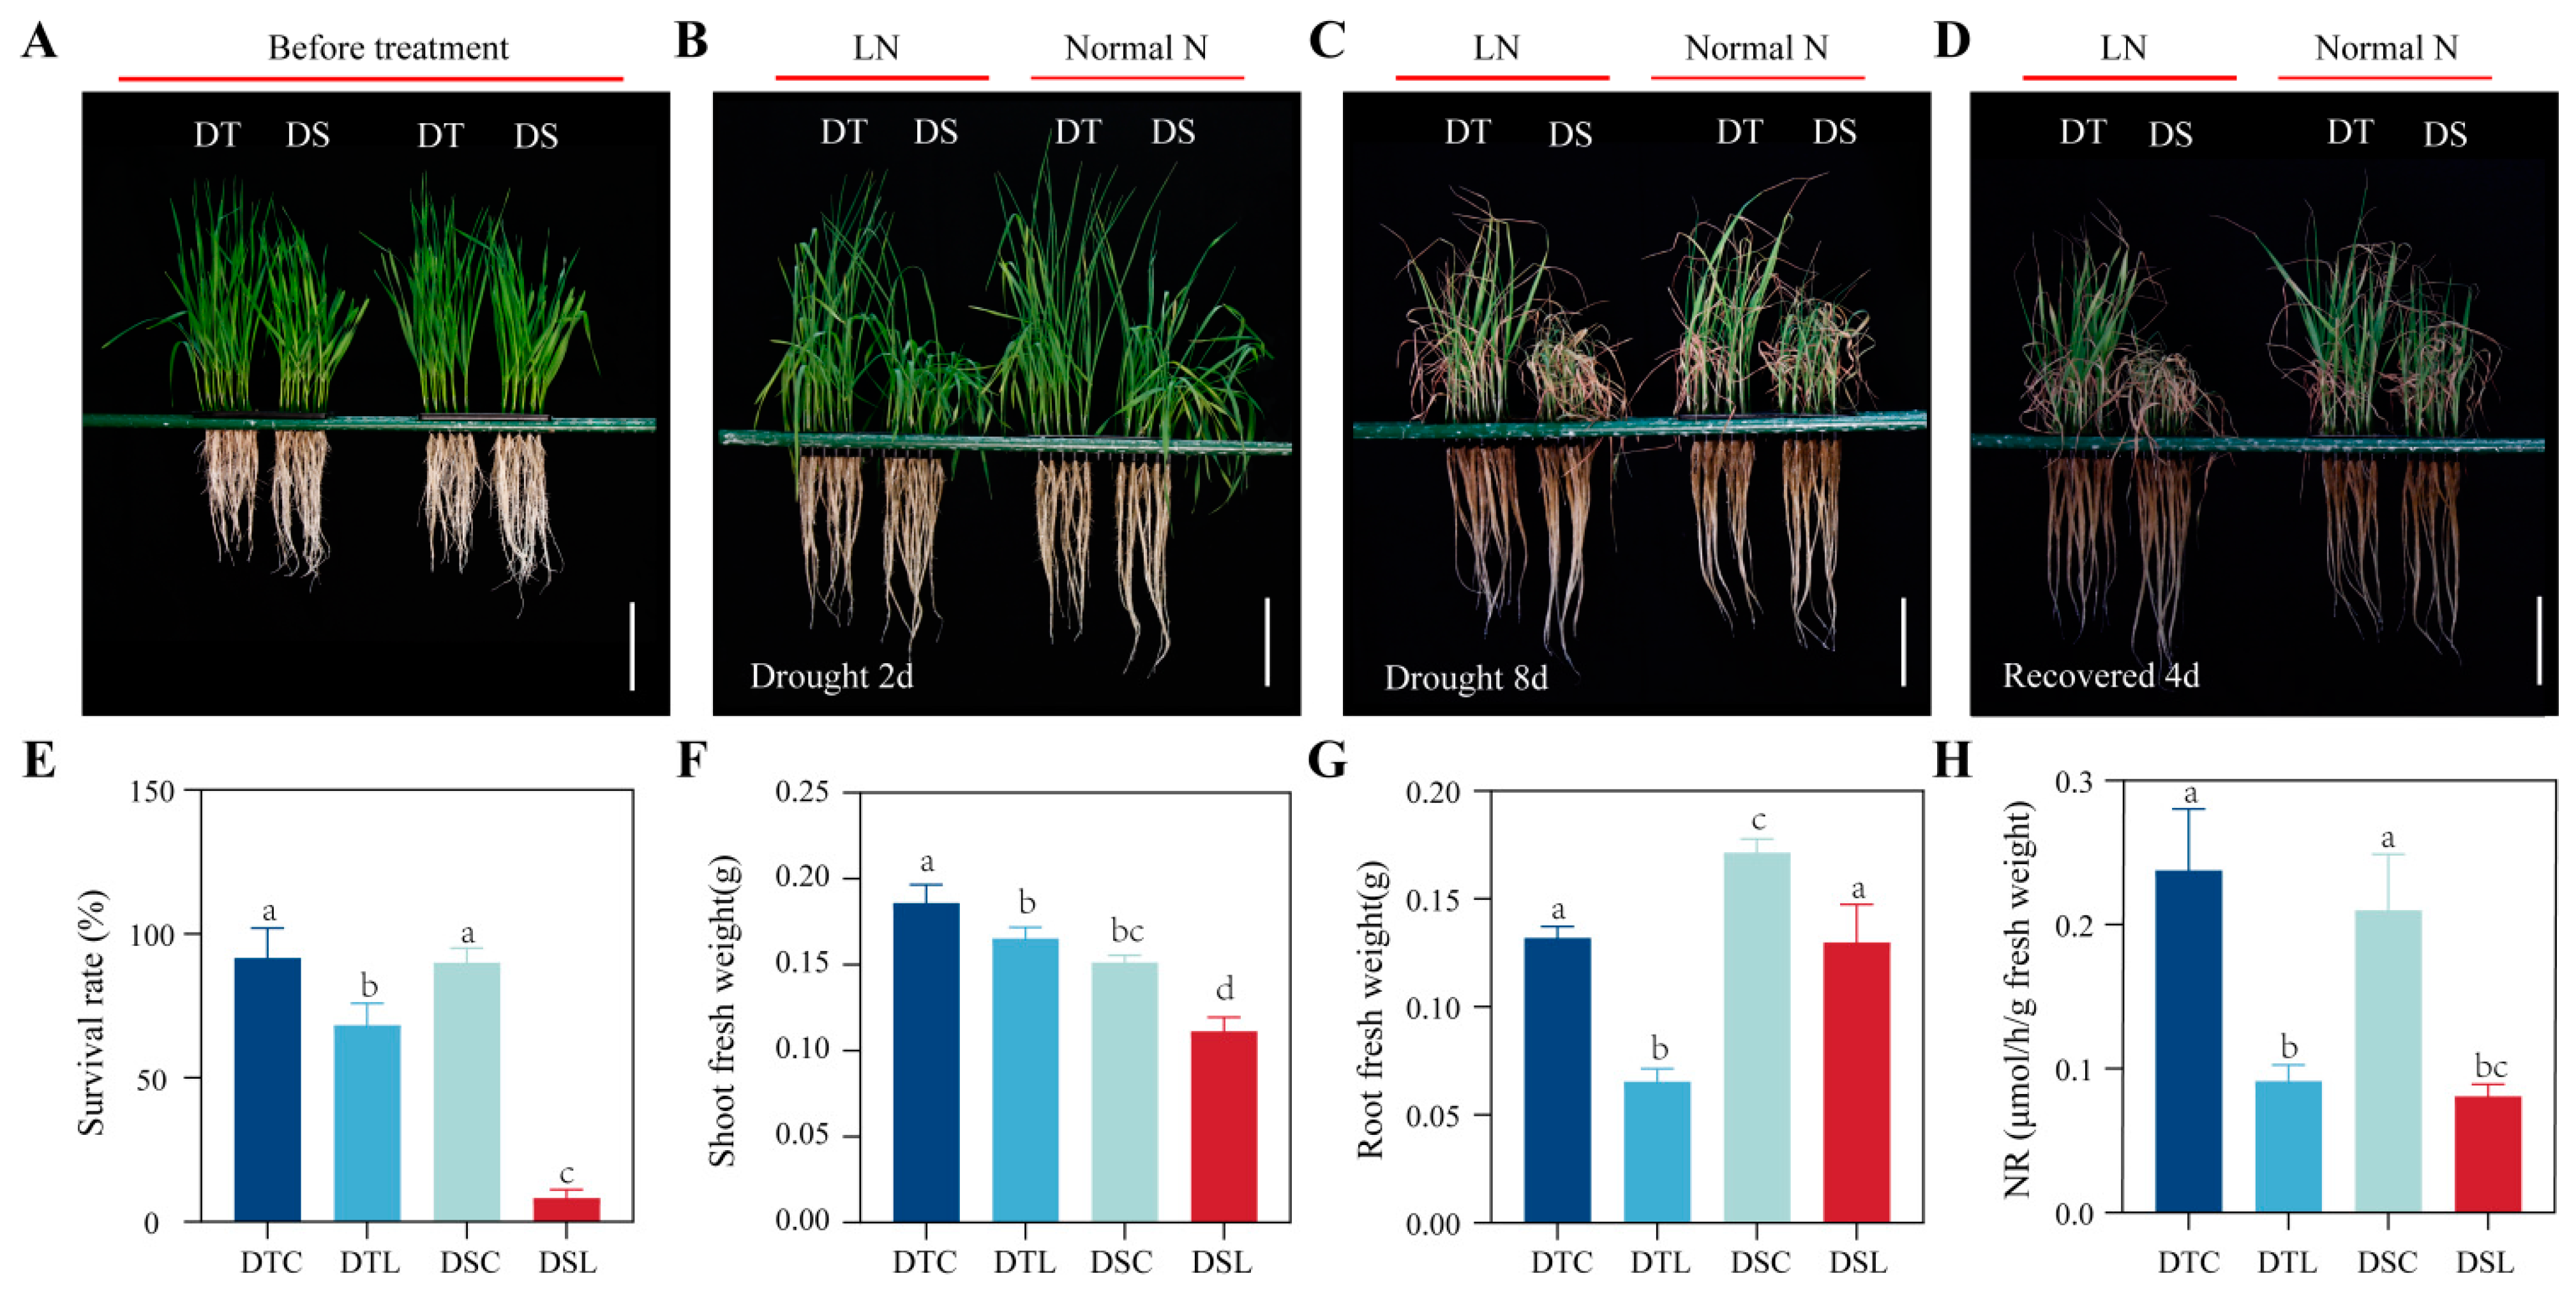
3.1. Various Nitrogen Concentration Treatments Significantly Affected Drought Tolerance

We selected the DT Chang6878 and DS Shi4185 wheat varieties for this study. The PSHI values of the DT and DS varieties were 95.97 and 88.90, respectively. Hence, the DT variety was more tolerant to drought than the DS variety (Supplementary Figure S1). We subjected both wheat varieties to drought stress (PEG treatment), LN (0.2 mM NO3), and normal N (2 mM NO3; Normal N) conditions. After 2 d, for the combined PEG and LN stress, both the DT and DS varieties exhibited varying degrees of wilting and growth inhibition. However, the DT variety wilted significantly less than the DS variety (Figure 1B). Compared with the plants subjected to LN conditions, those of the same variety performed better under Normal N conditions. After 8 d of drought treatment, the survival rate of the DS plants under LN conditions (DSL; 8.3%) was significantly lower (p < 0.05) than that of the DS plants under Normal N conditions (DSC; 90%). For the DT variety, the survival rates of the DT plants under LN (DTL) and Normal N (DTC) conditions also differed significantly (75.0% and 91.7%, respectively). Nevertheless, this difference was smaller than that of the DS variety. The survival rate of the DT variety was significantly higher than that of the DS variety under combined LN and drought conditions (p < 0.05). In contrast, no significant difference was observed in the survival rate between the two varieties under Normal N conditions (Figure 1). The shoot fresh weights of both varieties under combined drought and LN stress were similar (Figure 1F). The root fresh weights of both varieties under combined drought and LN stress were lower than those of both varieties under drought stress alone. However, the root fresh weight of the DS variety was significantly higher than that of the DT variety under the same treatment conditions (Figure 1G). The nitrate reductase (NR) activity levels of both varieties under combined LN and drought stresses were lower than those under drought stress alone. Under the same conditions, no significant difference was observed between the varieties regarding NR activity (Figure 1H). Therefore, nitrogen supply significantly affected wheat tolerance to drought stress. Furthermore, the DT variety exhibited a higher tolerance to combined drought and LN stress than the DS variety.

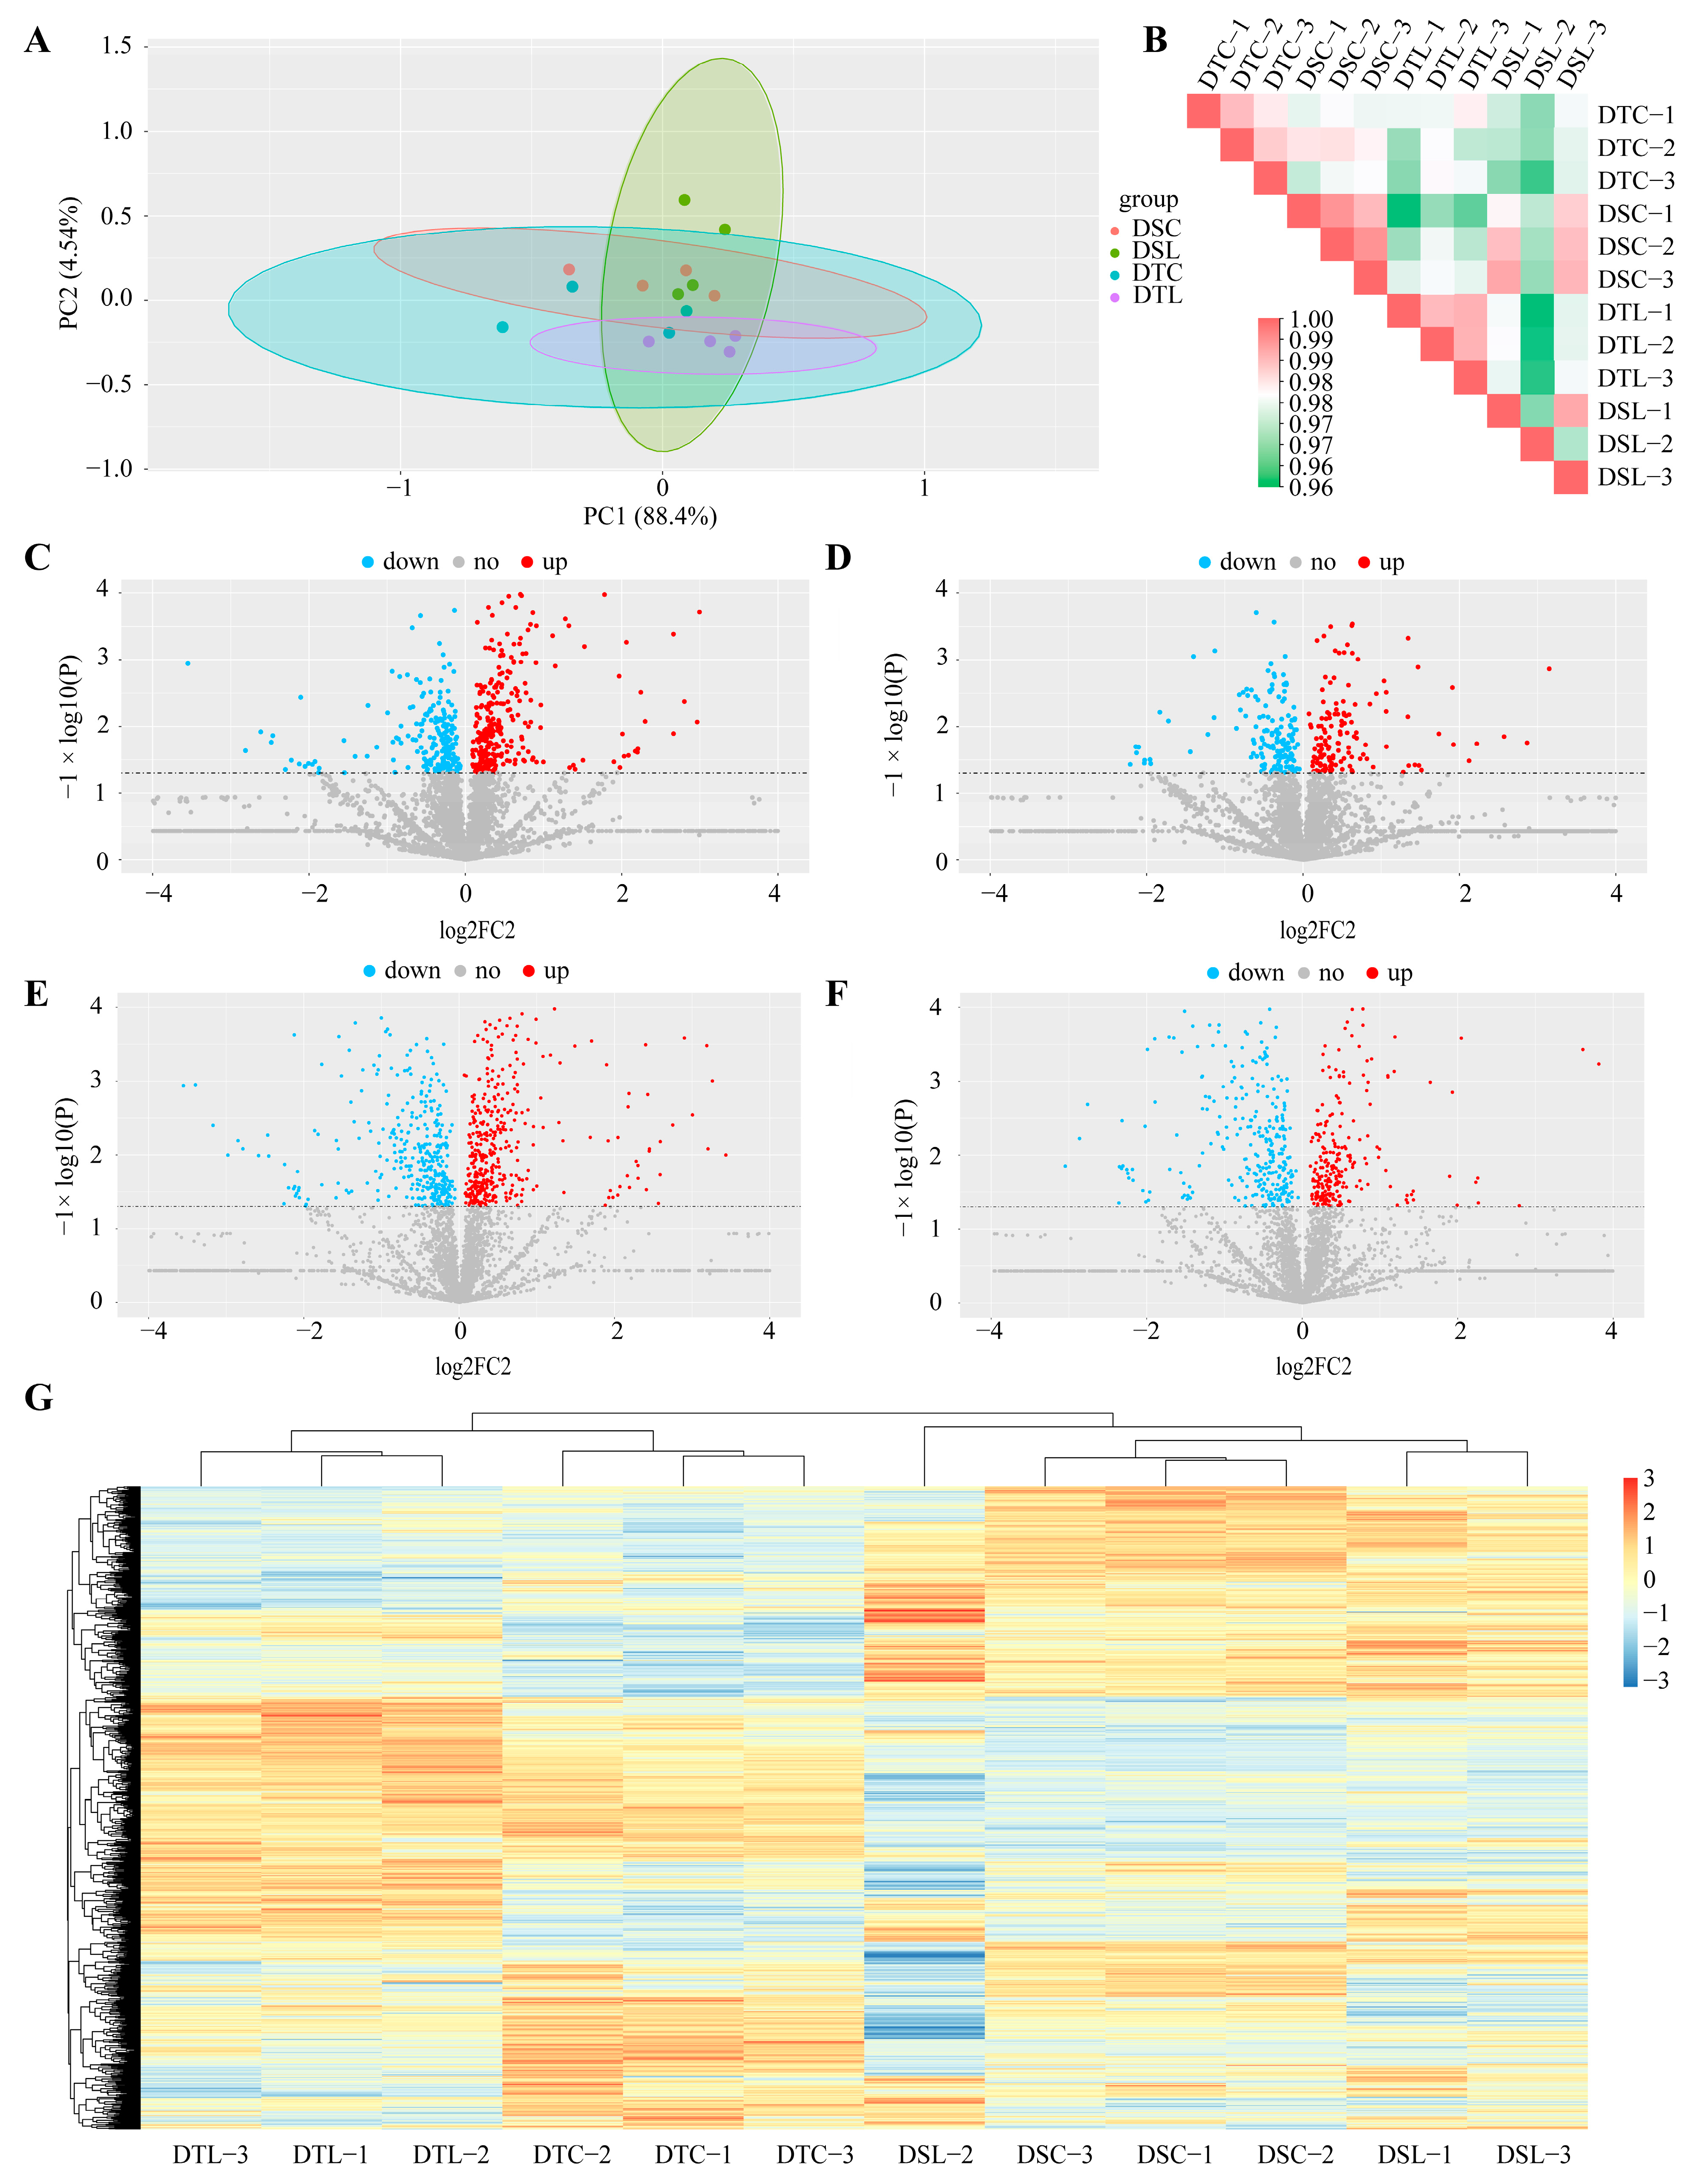
3.2. Responses to Combined Drought and LN Stress and Drought Stress Alone

Quantitative proteomic analysis was performed to investigate the responses of the wheat roots to combined drought and LN stress. The quantitative data searched using Maxquant are listed in Supplementary Table S3. We identified 5431 proteins. Principal component analysis was applied to determine the responses of the DS and DT wheat varieties to combined LN and drought stresses. The DTC and DTL groups were separated in PC1, while the DSC and DSL groups were separated in PC2. Thus, there were significant differences between the groups (Figure 2A). Based on the principal component analysis results, three similar replicates per sample were selected for Pearson’s correlation analysis. Strong correlations were obtained among all three replicates per sample (R > 0.96). However, the DS and DT varieties under LN stress had more differences (Figure 2B). According to the heatmap, the difference between the two varieties was bigger than the difference between treatments for the same variety (Figure 2G). Moreover, the sequence coverage and intensity distribution indicated a high repeatability, and the data could be used for further analysis (Figure S2A,B).
Between the DTL and DTC groups, 532 proteins significantly differed (p < 0.05), of which 221 (41.5%) were downregulated and 311 (58.5%) were upregulated. Of the 221 downregulated proteins, 150 were DAPs (p < 0.05, FC < 0.83). Of the 311 upregulated proteins, 221 were DAPs (p < 0.05; FC > 1.2). For the DT variety, more significantly changed proteins were upregulated in response to combined drought and LN stress than to drought stress alone (Figure 2C). Between the DSL and DSC groups, 323 proteins differed significantly, of which 177 were downregulated and 146 were upregulated. Of the 177 downregulated proteins, 119 were DAPs, and of the 146 upregulated proteins, 108 were DAPs (Figure 2D). The Venn diagram indicated that the DTL vs. DTC groups had more unique upregulated DAPs than the DSL vs. DSC groups (Figure 3A).
We also compared varieties of DAPs under the same treatment. In the DSC vs. DTC groups, 391 proteins were significantly downregulated (p < 0.05), while 433 were significantly upregulated (p < 0.05). Of the 391 downregulated proteins, 316 were DAPs (p < 0.05, FC < 0.83), and of the 433 upregulated proteins, 322 were DAPs (p < 0.05, FC > 1.2) (Figure 2E). In the DSL vs. DTL groups, 320 proteins were significantly downregulated, while 262 were significantly upregulated. Of the 320 downregulated proteins, 264 were DAPs. Of the 262 upregulated proteins, 203 were DAPs (Figure 2F). In the DSC vs. DTC groups, 20.7% of the DAPs were unique and downregulated, whereas 24.9% were unique and upregulated. The DSC vs. DTC groups had substantially more unique DAPs than the DSL vs. DTL groups (Figure 3B).
The unique DAPs of both varieties under the same treatment were then subjected to Kyoto Encyclopedia of Genes and Genomes (KEGG) analysis. The upregulated DAPs in the DTL vs. DTC groups were enriched in mitogen-activated protein kinase (MAPK) signaling–plant, tryptophan metabolism, ubiquinone, other terpenoid-quinone biosynthesis, plant–pathogen interactions, and carbon fixation in photosynthetic organisms, but the DAPs of the other groups were infrequently enriched in these pathways (Figure 3C). The DAPs in these pathways are shown in the heatmap (Figure 3E). These pathways were enhanced in the DT variety in response to combined drought and LN stress.
The unique DAPs that were only upregulated or downregulated in the DSC vs. DTC and DSL vs. DTL groups were then subjected to KEGG analysis. Glyoxylate and dicarboxylate metabolism, MAPK signaling–plant, and citrate cycle (TCA cycle) were enriched mainly by the upregulated DAPs in the DSC vs. DTC groups. Carbon metabolism, carbon fixation in photosynthetic organisms, and protein processing in endoplasmic reticulum were enriched mainly by the downregulated DAPs in the DSL vs. DTL groups (Figure 3D). These DAPs are illustrated in a heatmap (Figure 3F).
Twenty-six DAPs were selected for PRM verification based on the results of the KEGG analysis. Of these, 13 were associated with phenylpropanoid biosynthesis and MAPK signaling–plant, while the other 13 were common upregulated DAPs. However, only 11 target proteins were quantified: one CHIB (Figure 4E), five pathogenesis-related proteins (Figure 5E), five peroxidases (Figure 5F–J), and one glutathione sulfotransferase (Figure 5K). These DAPs were upregulated in the DTL vs. DTC groups. The five pathogenesis-related proteins and CHIB belonged to the MAPK signaling pathway.

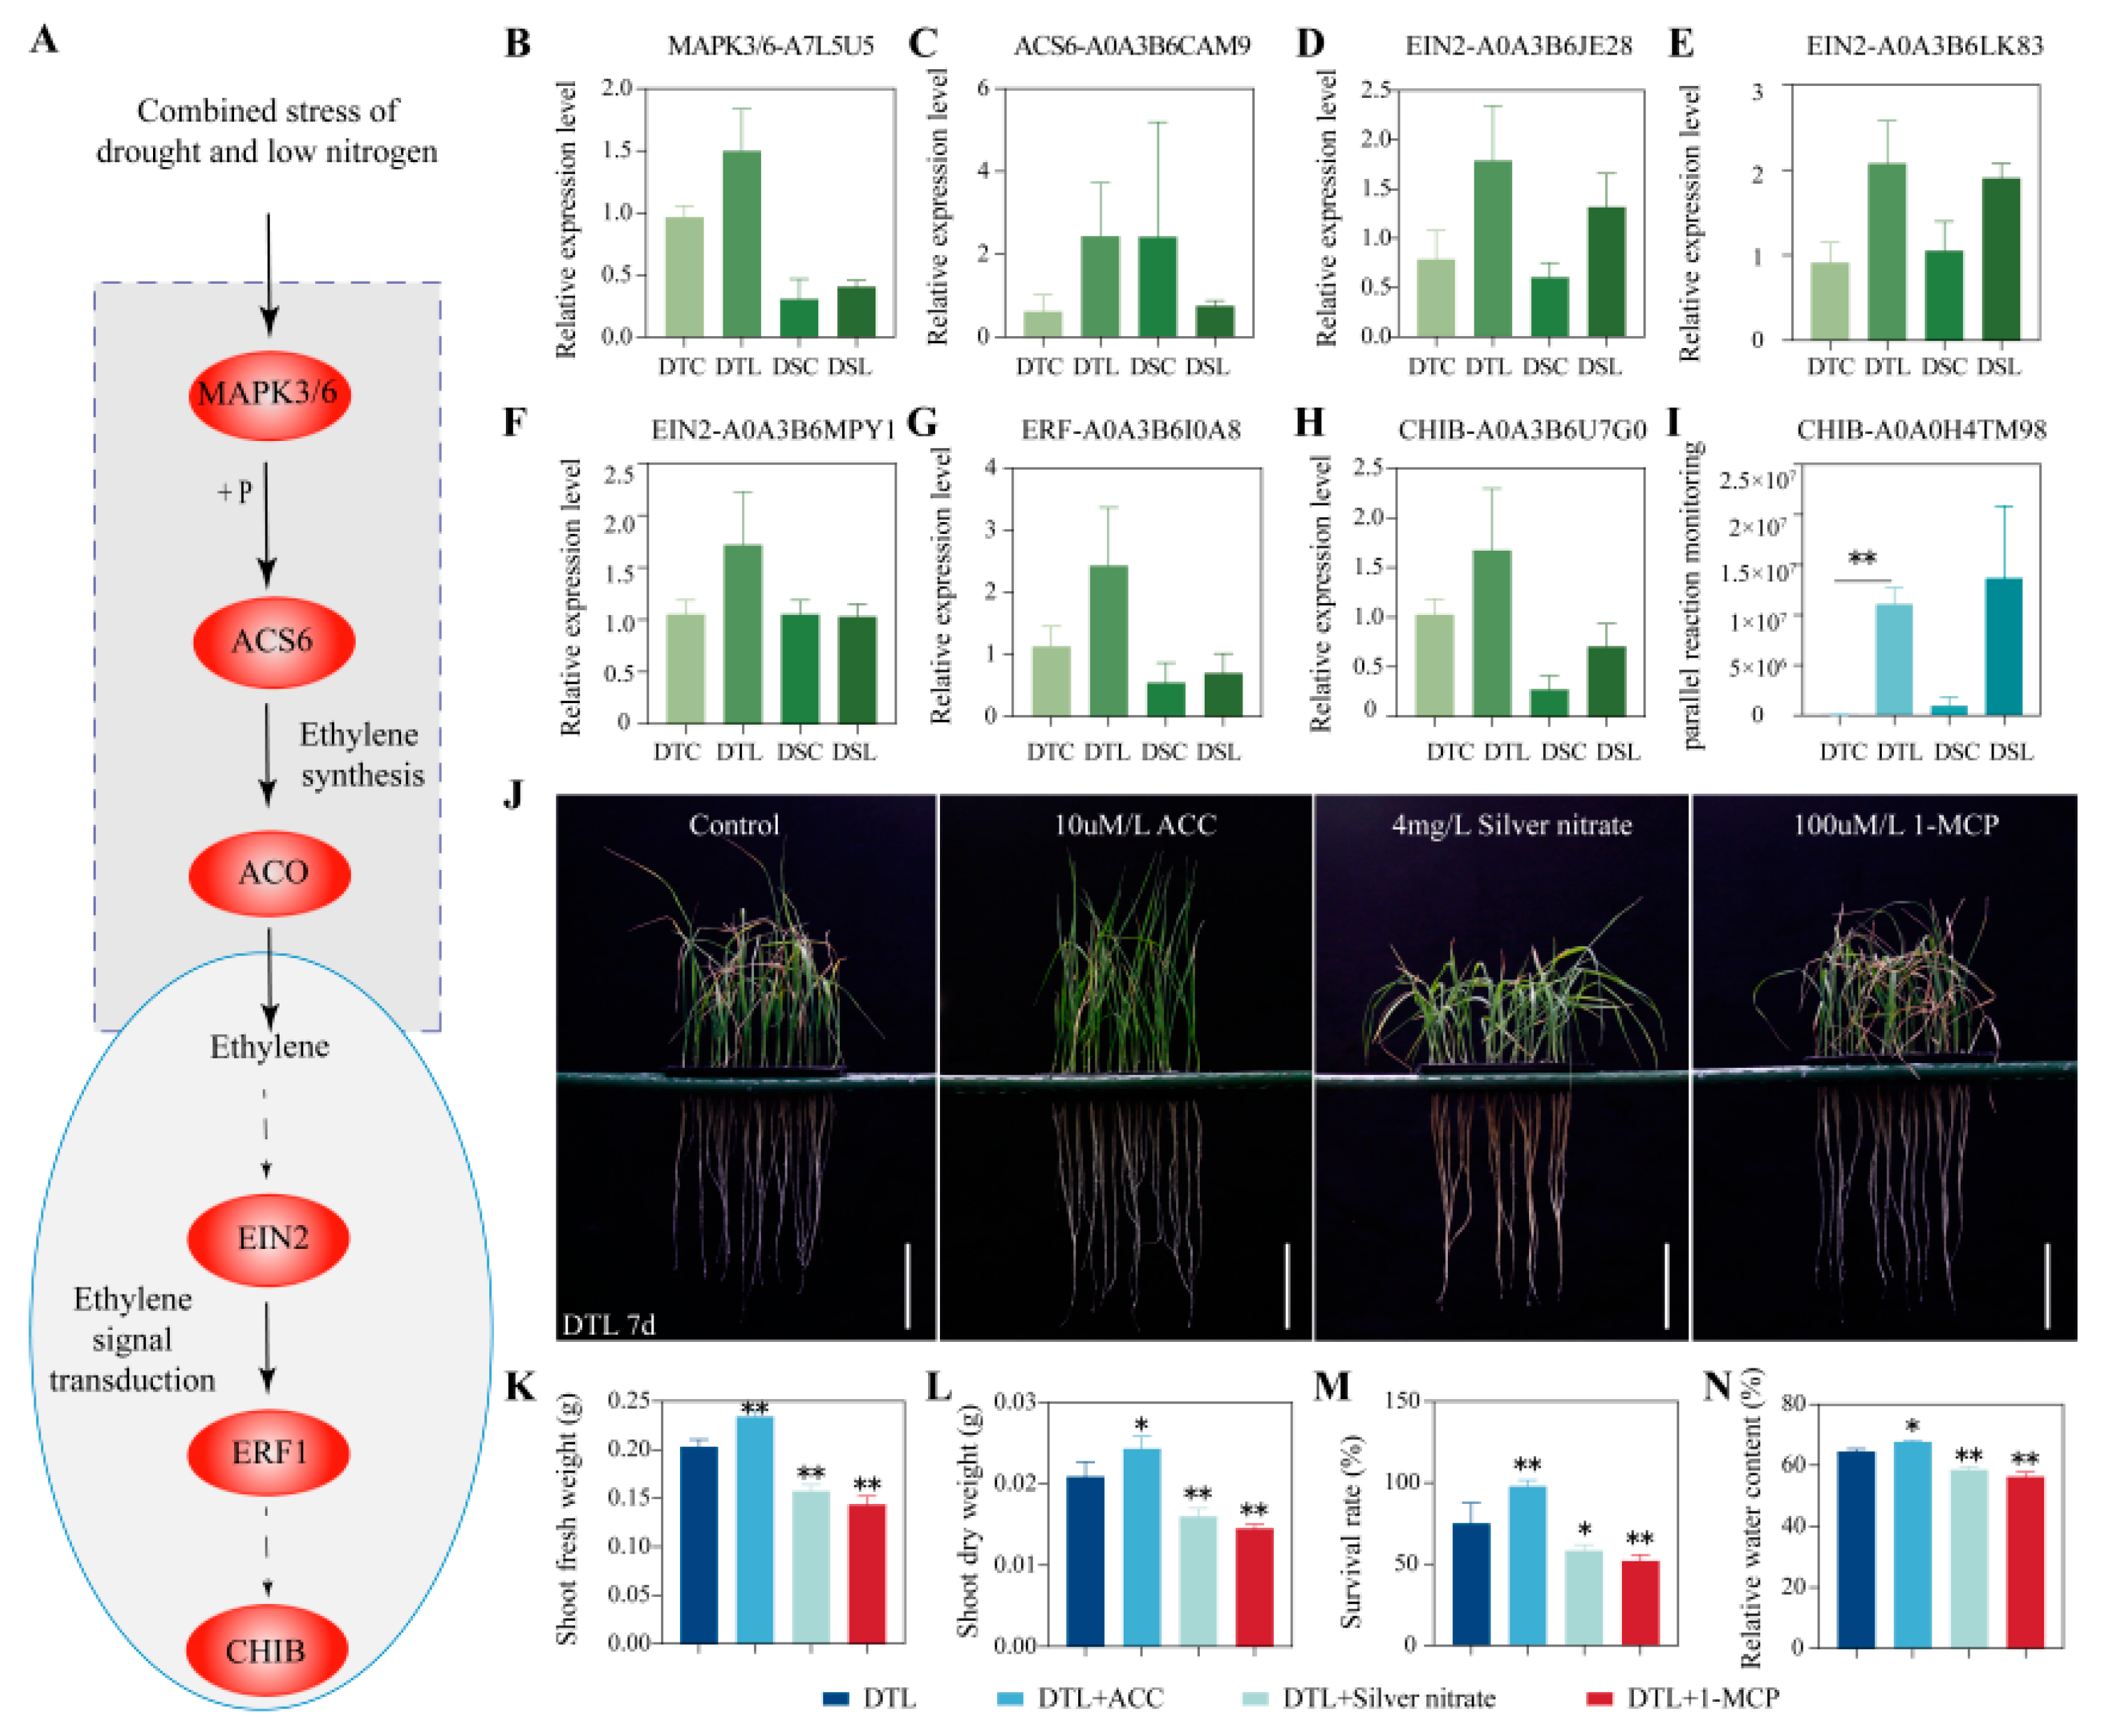
3.3. In Chang6878, Ethylene Biosynthesis-Related and Signal Transduction Proteins Were Significantly Upregulated in the MAPK Signaling Pathway

CHIB (A0A0H4TM98) was quantified and upregulated in the DTL vs. DTC groups by PRM (Figure 4I). Based on proteomic analysis and PRM verification results, we further evaluated the changes in these key DAPs at the gene expression level through qRT-PCR. The expression levels of MAPK3/6 (A7L5U5), ACS6 (A0A3B6CAM9), EIN2 (A0A3B6HYK7), EIN2 (A0A3B6LK83), EIN2 (A0A3B6MPY1), ERF (A0A3B6I0A8), and CHIB (A0A3B6U7G0) in the MAPK signaling pathway were all upregulated in the DTL vs. DTC groups (Figure 4B–H). These results suggest that the proteins and genes in the ethylene biosynthesis-related and signal transduction proteins are significantly upregulated in the DTL vs. DTC groups (Figure 4A), indicating that these key genes are important in the response of Chang6878 to drought and LN stress. Further hydroponic experiments indicated that the topical application of ACC improved Chang6878 resistance to combined drought and LN stress (Figure 4J). After ACC application, the shoot fresh weight and survival rate of Chang 6878 under combined drought and LN stress increased to a highly significantly extent (Figure 4K,M). Shoot dry weight and leaf relative water content increased significantly (Figure 4L,N). In contrast, under topical application of silver nitrate, an ethylene synthesis inhibitor, Chang 6878 showed a highly significant decrease in shoot fresh weight, dry weight, and relative water content of leaves under combined drought and LN stress (Figure 4K,L,N), and there was a significant decrease in survival rate and reduced stress tolerance in the DT plants (Figure 4M). The topical application of ethylene signal transduction inhibitor 1-methylcyclopropene also reduced the stress tolerance of wheat (Figure 4J). Chang 6878 showed highly significant reductions in shoot fresh weight, dry weight, survival, and relative leaf water content under combined drought and LN stress (Figure 4K–N). Therefore, both ethylene signal synthesis and transduction pathways respond to combined drought and LN stress in Chang6878.

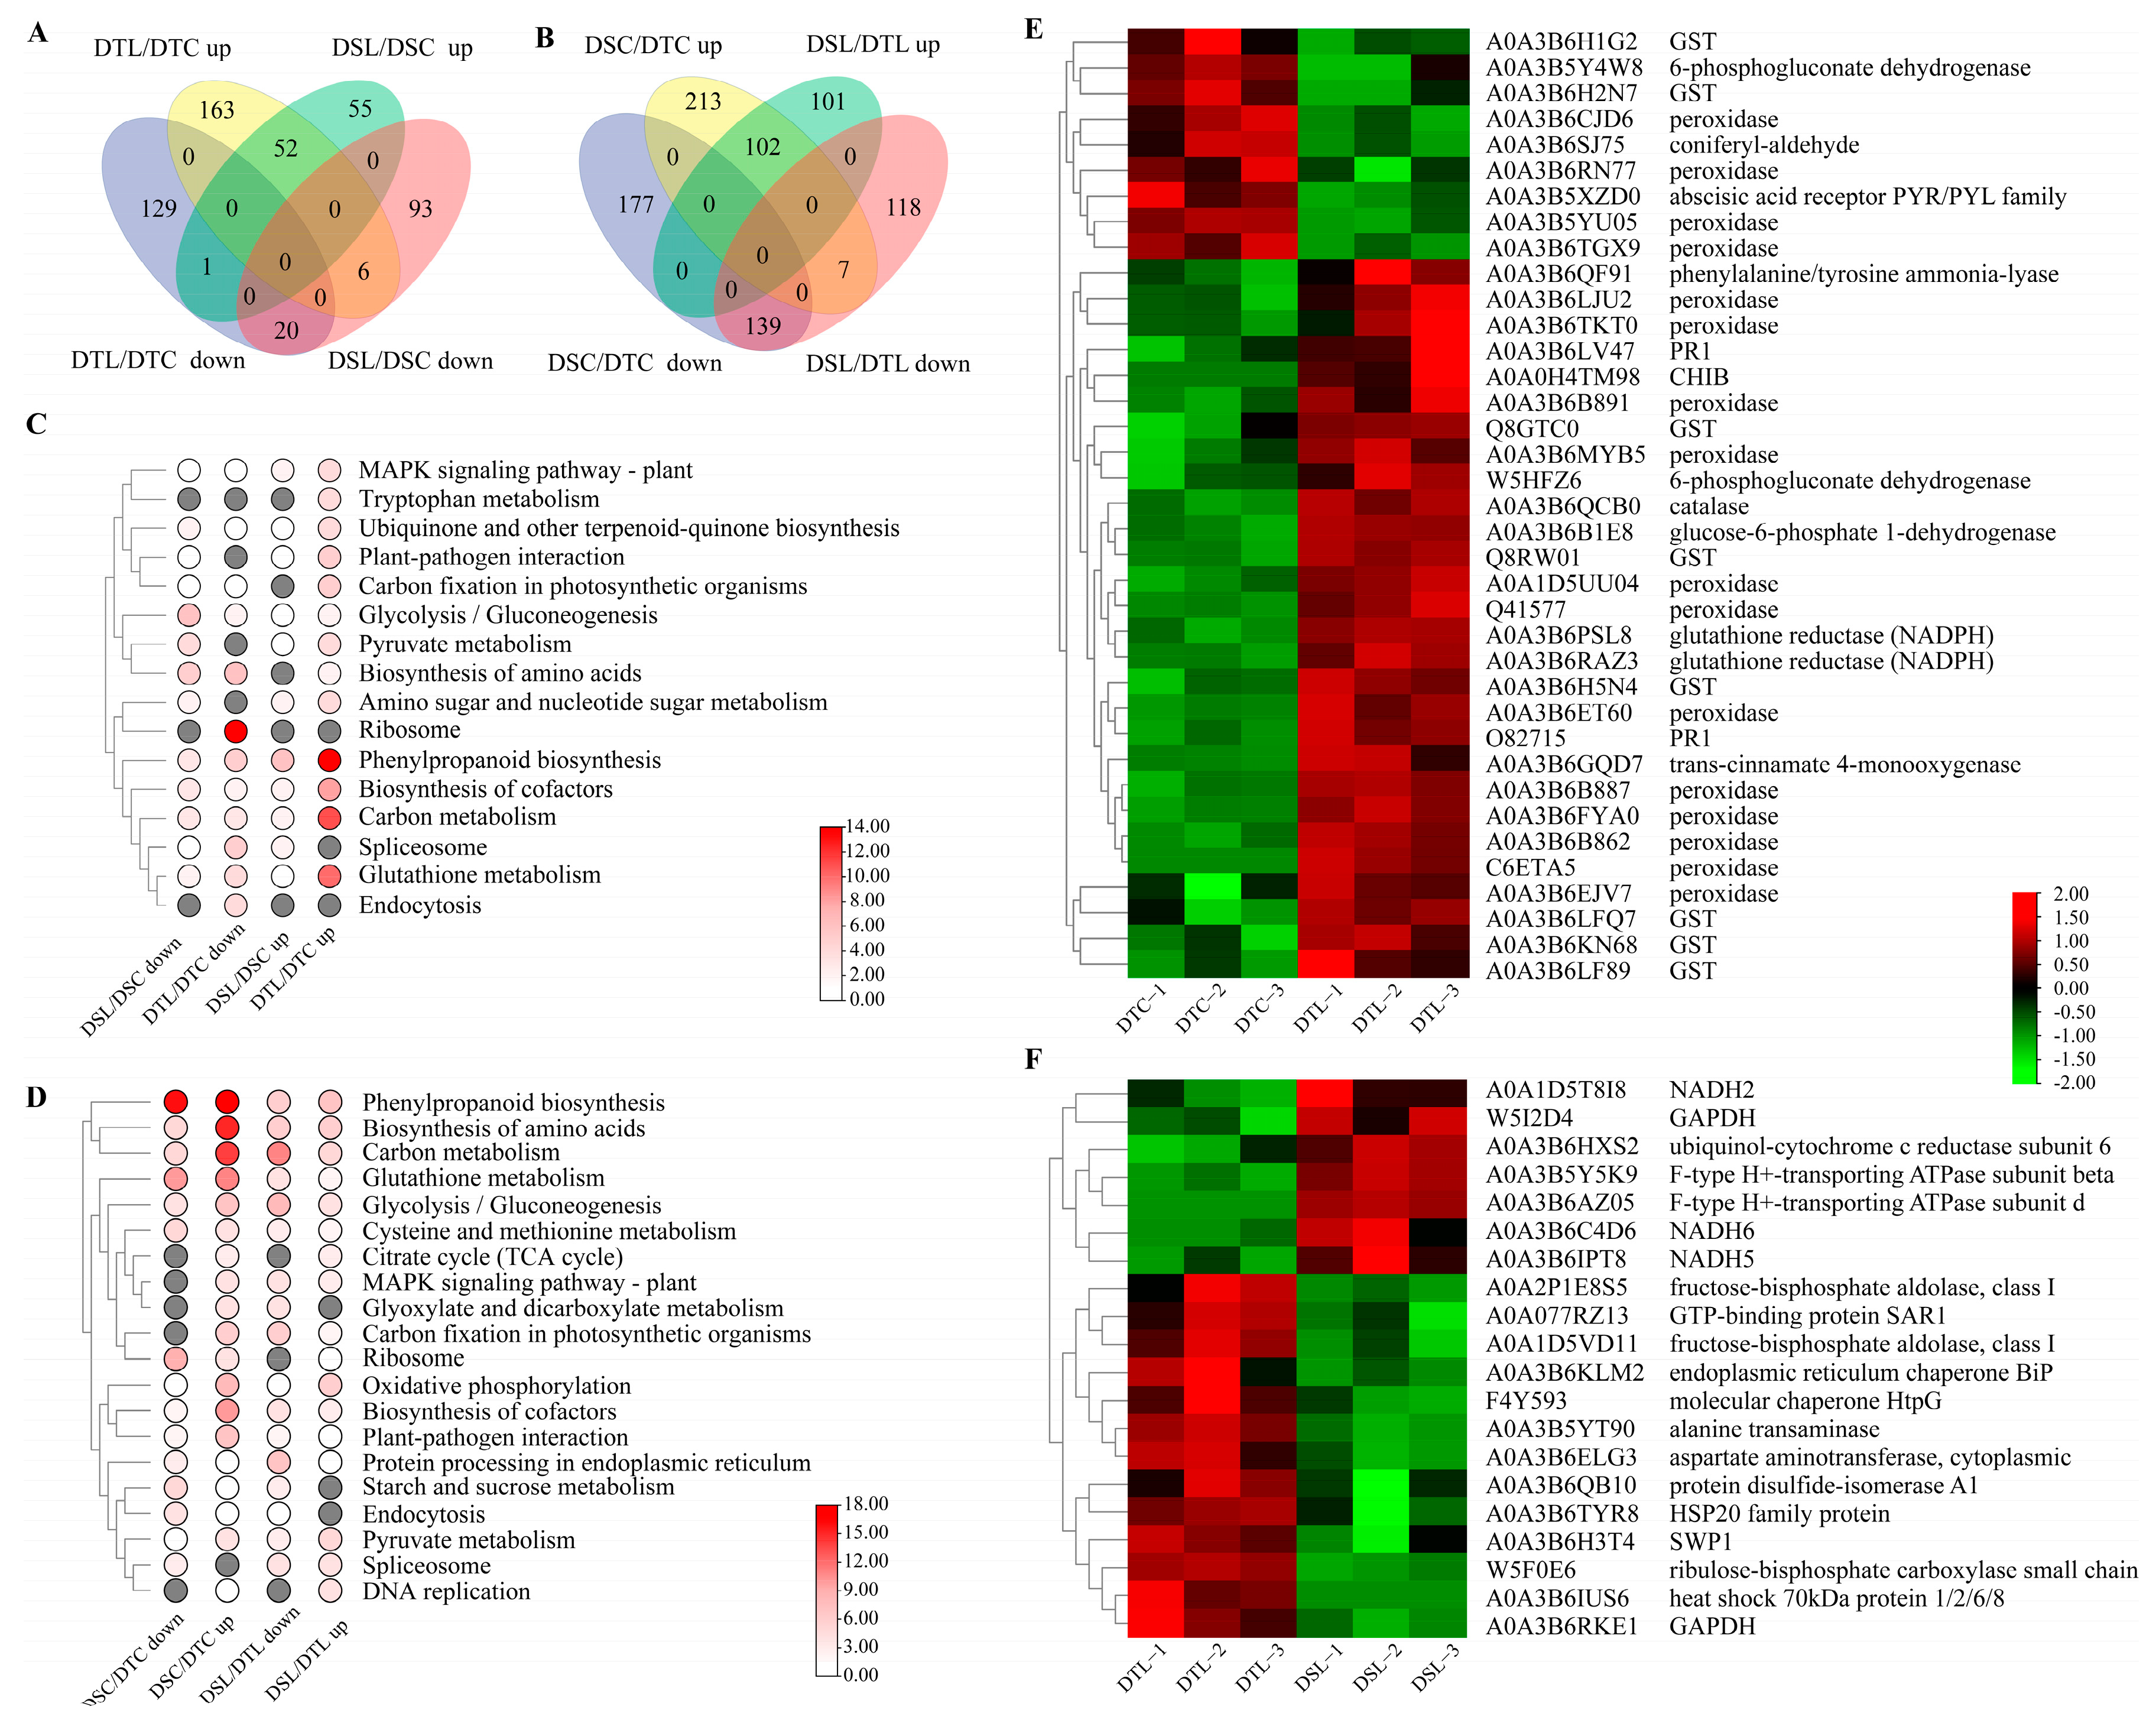
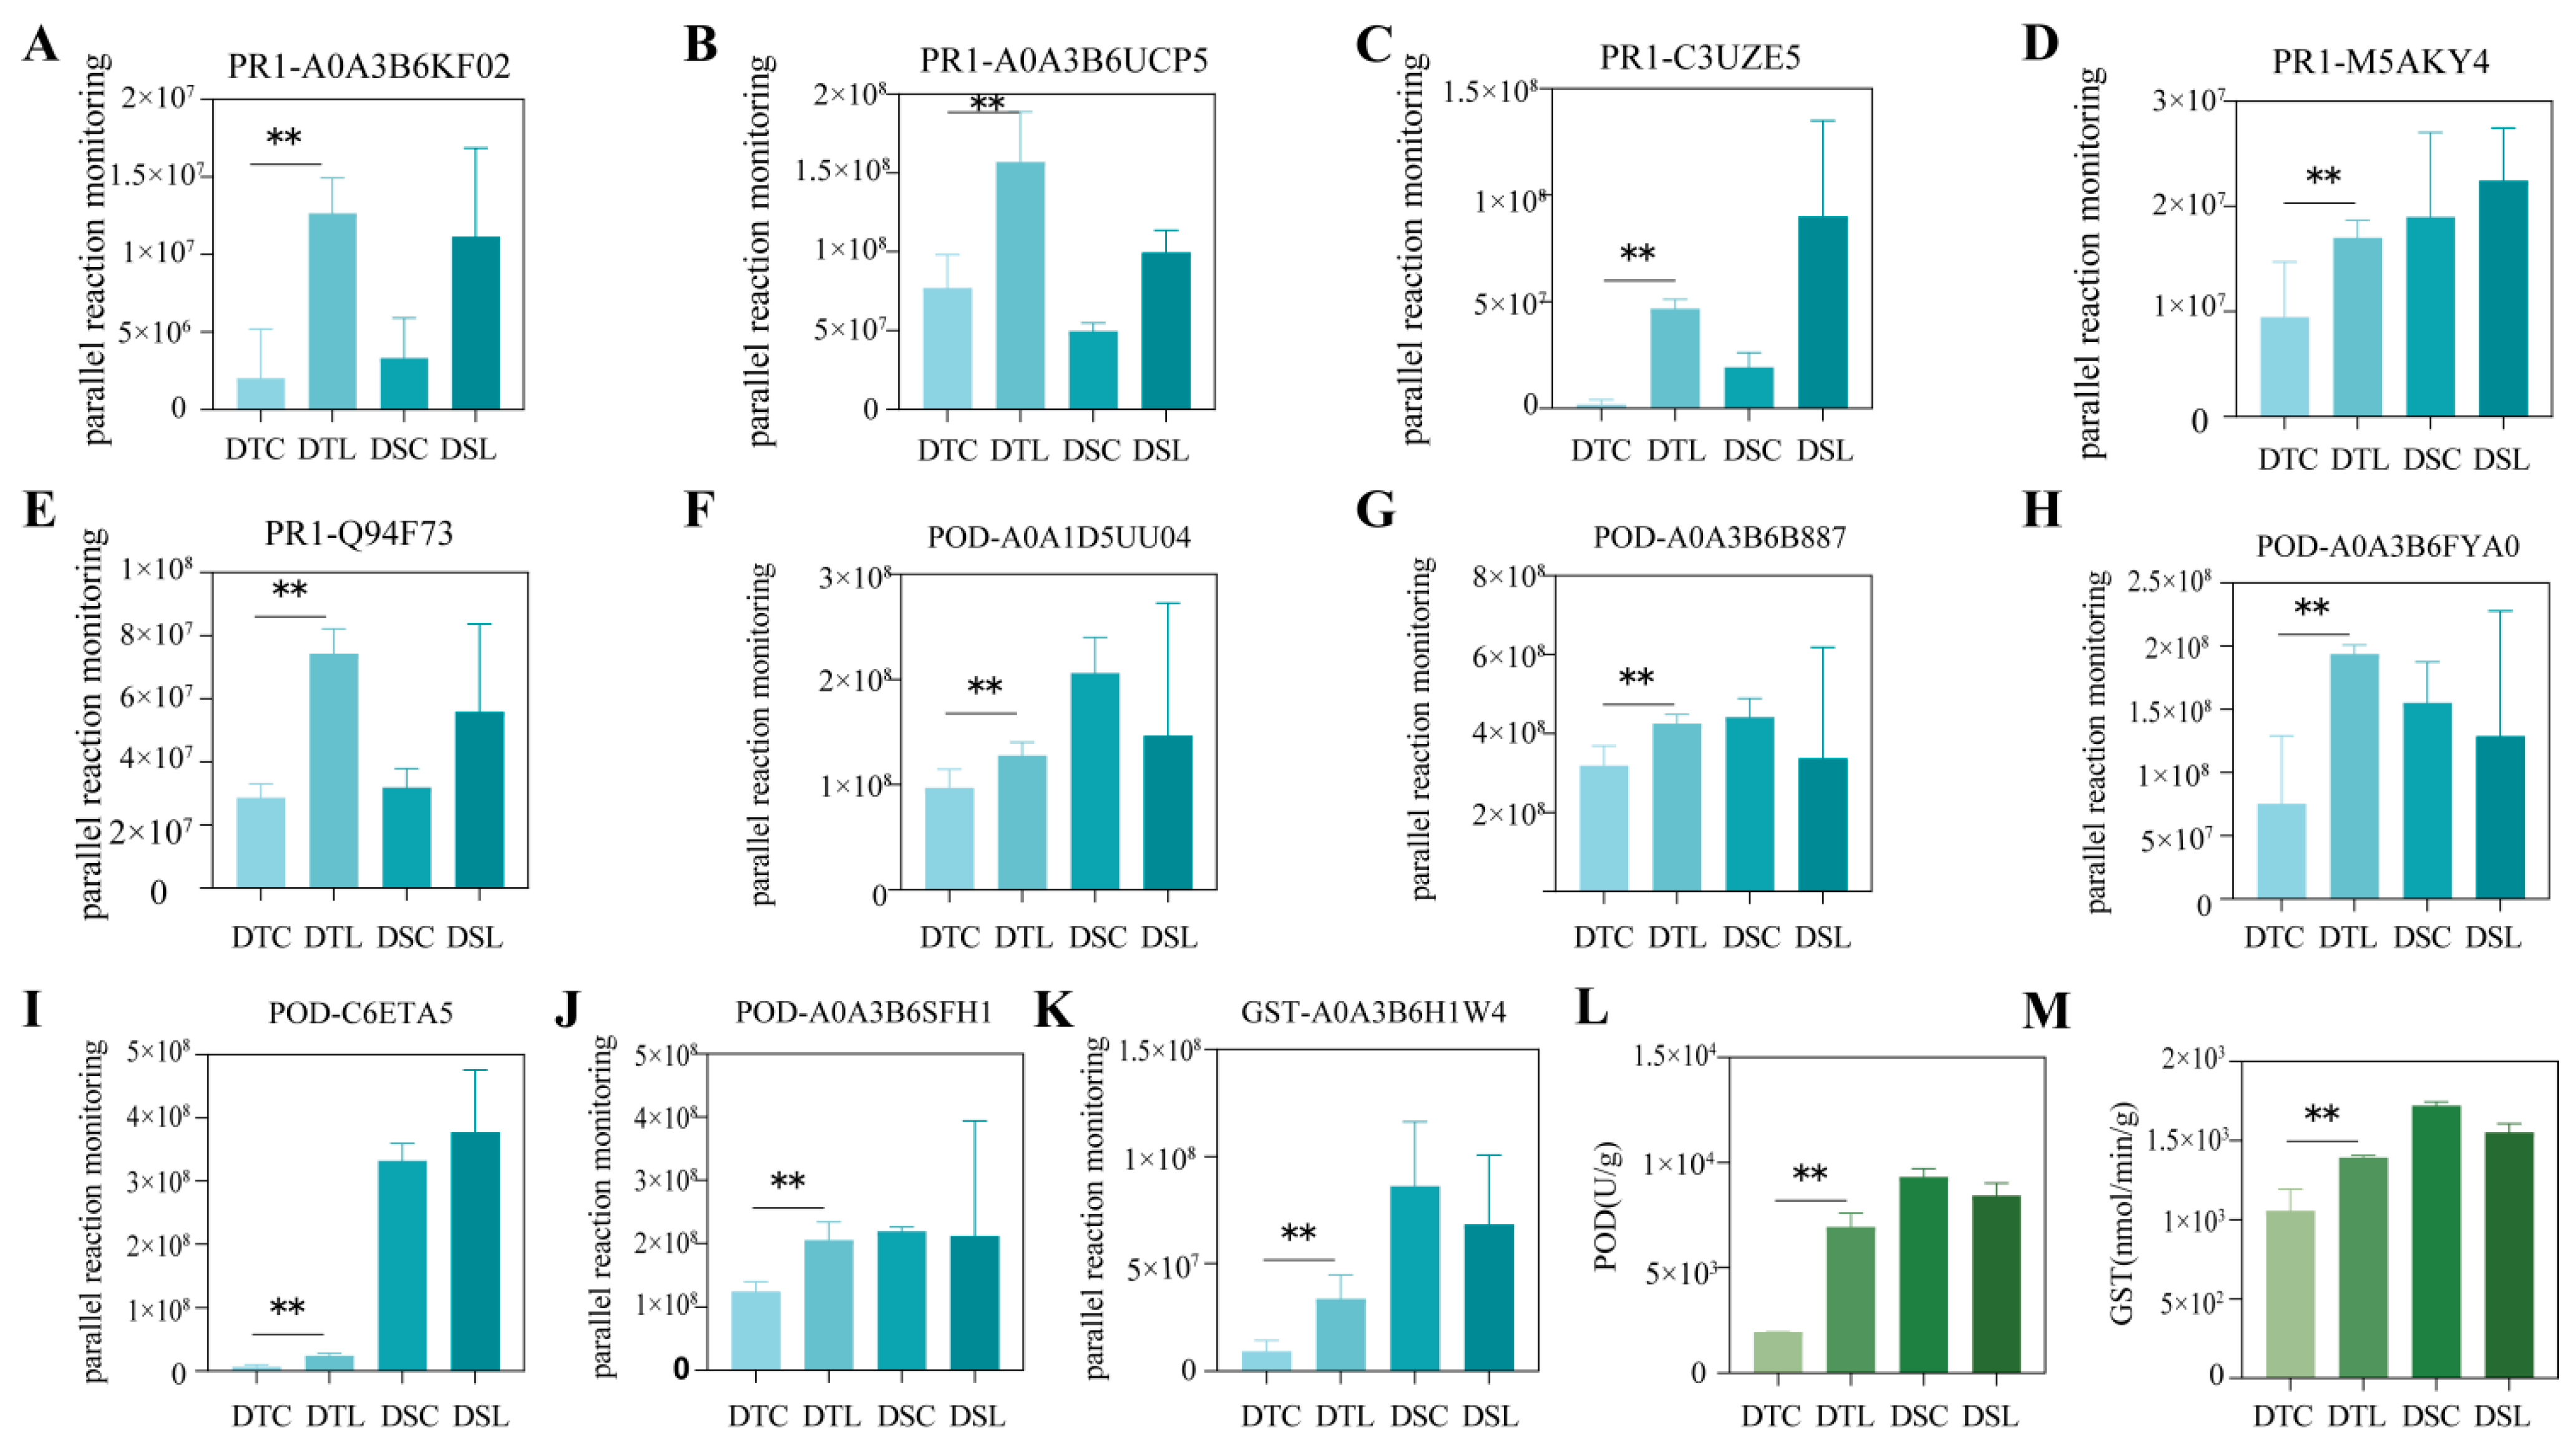
3.4. Enhancement of Oxidation Reaction-Related DAPs in Response to Combined Drought and LN Stress

Five pathogenesis-related proteins (Figure 5A–E), five peroxidases (Figure 5F–J), and one glutathione sulfotransferase (Figure 5K) were upregulated in the DTL vs. DTC groups, as shown via PRM. In addition, peroxidase and glutathione transferase activities were significantly enhanced in the DTL vs. DTC groups (Figure 5L,M).

4. Discussion

Drought intensification, decline in the biological regulation of the nitrogen cycle, and soil available nitrogen input have shown a downward trend as a result of the combined effects of climate change and human activities [23,24]. As a result, drought and LN stress have affected wheat growth and development. Li and Wang [25] studied the barley leaf proteome under drought and nitrogen deficiency stress using label-free proteomics techniques. The combined stress from drought and nitrogen deficiency led to an increase in the expression of proteins related to energy, carbohydrate, and amino acid metabolism, which resulted in the development of broader signaling pathways. Barley sustained growth under the combined stresses by producing more energy through enhanced aerobic respiration. In the present study, we used proteomic analysis to compare the differences between two wheat varieties under drought and combined drought and LN stress in roots. Previous proteomic studies on plants primarily focused on the effects of a single stress [26,27]. In this study, our quantitative proteomic analysis identified 5431 proteins. We discovered that the DT variety had more upregulated DAPs under combined drought and LN stress than the DS variety. By analyzing DAPs, we found that MAPK signaling–plant, tryptophan metabolism, ubiquinone, other terpenoid-quinone biosynthesis, plant–pathogen interactions, and carbon fixation in photosynthetic organisms were only enriched by the upregulated DAPs in Chang6878 (Figure 3C).
In this study, in the MAPK signaling pathway, ethylene biosynthesis-related and signal transduction proteins were significantly upregulated (Figure 4A). The MAPK signaling pathway is involved in plant responses to abiotic stress, and its critical function in boosting plant stress resistance has been previously reported [28]. MAPK3/6 (A7L5U5) was upregulated in the DTL vs. DTC groups (Figure 4B). ACC-synthase (ACS), the rate-limiting enzyme in ethylene biosynthesis, was significantly upregulated in the DTL vs. DTC groups (Figure 4C). Li et al. [29] showed that the MPK3/MPK6 cascade is implicated in ethylene production under injury stress by differently regulating the transcription of four ACS genes (ACS2, ACS6, ACS7, and ACS8). In the present study, ethylene-insensitive protein 2 (EIN2: A0A3B6JE28, A0A3B6LK83, A0A3B6MPY1), ethylene response factor ERF (A0A3B6I0A8) and ethylene signal transduction protein (CHIB: A0A3B6U7G0, A0A3B6HYK7) were significantly upregulated under combined drought and LN stress (Figure 4D–I). Wan et al. [30] identified the ERF family gene OsDER1 in rice induced by drought and ethylene. Overexpression of OsDER1 caused drought and osmotic stress hypersensitivity, whereas the OsDER1 knockout had the opposite effect. In contrast, exogenous ACC application reversed the drought-hypersensitive phenotype in OsDER1-overexpressing plants. Thus, OsDER1 may control drought response in plants by regulating ethylene biosynthesis. Ma et al. [31] systematically summarized the effects of external nitrogen supply on ethylene biosynthesis and signal transduction, as well as the morphophysiological responses of plants to various ethylene-mediated nitrogen stressors. Under normal growth and stress conditions, changes in nitrogen availability and/or form can alter ethylene production and sensitivity [32]. EIN2, a crucial component of ethylene signal transduction [33], is involved in response to drought stress. The mannitol-induced osmotic stress hypersensitive Arabidopsis EIN2 mutant Ein2-5 has been identified. Additional research demonstrated the potential involvement of EIN2 in abscisic acid signal transduction [34]. Plants usually increase their ethylene biosynthesis in response to both nitrogen deficiencies and abundances. Low nitrate availability rapidly induces ethylene production and enhances ethylene signaling by upregulating EIN3 [35]. Nutrient deficiency-induced ethylene production plays a vital role in plant adaptive responses [36]. A comparative study of 20 Arabidopsis varieties found natural variations among their ethylene production levels in response to nitrate deficiencies. Therefore, nitrogen-use efficiency could be improved by manipulating the ethylene pathway [37]. Chen et al. [38] performed transcriptome sequencing and quantitative proteomic analyses of ramie subjected to combined water and nitrogen stresses and reported that water and nitrogen interactions altered photosynthesis, the ethylene response, glycolysis, and nitrogen metabolism in this crop. Ethylene signal transduction plays an essential role in plant drought and nitrogen stress responses. This is consistent with our results, as confirmed via hydroponics experiments. The ethylene synthesis precursor ACC improved Chang6878′s tolerance to drought and LN stress, but the ethylene synthesis inhibitors silver nitrate and 1-methylcyclopropene had the opposite effect (Figure 4J). Therefore, both the ethylene biosynthesis and ethylene signal transduction pathways were implicated in the responses of Chang6878 to drought and LN stresses.
In addition, five pathogenesis-related proteins in the MAPK signaling pathway were quantified (Figure 5A–E). These DAPs were upregulated in the DTL vs. DTC groups. The PR gene family has been widely exploited in plant defensive responses as molecular markers. Additionally, PR1 protein participates in the response of plants to abiotic stress and is crucial for plant growth or development. Studies have revealed that the disease course-related protein 1 gene ScPR1 is crucial for sugarcane and transgenic Arabidopsis thaliana to respond to diverse abiotic stressors [39]. By promoting PR1 expression, GhMYB36 participates in the response of cotton and A. thaliana to drought stress [40]. Another study demonstrated that salicylic acid and hydrogen peroxide strongly induced the mRNA level of both OsPR1 genes [41]. Peroxidase (Figure 5F–J) and glutathione hydroxyl transferase (GST) (Figure 5K) were significantly upregulated in the DT wheat variety subjected to combined drought and LN stress. The results were further supported by peroxidase activity and GST activity (Figure 5L,M). Zhong et al. [42] applied 10% (w/v) PEG 6000 to rice to simulate the effects of nitrogen application under moderate drought conditions on photosynthesis. The authors found that the enzyme content differed between low and moderate nitrogen levels. Plants upregulate the expression of antioxidant enzyme genes under abiotic stress to lessen oxidative damage attributed to reactive oxygen species. In conclusion, oxidation–reduction reaction related enzymes and proteins are involved in combined drought and LN stress.

5. Conclusions

This study performed proteomic analysis on the roots of two wheat varieties under combined drought and LN stress. The results revealed that the ethylene synthesis and signal transduction pathways were upregulated in the DTL vs. DTC groups, which was verified by PRM and qRT-PCR. Hydroponic experiments showed that treatment with ethylene inhibitor silver nitrate and 1-methylcyclopropene reduced DTL resistance. DTL resistance increased when ACC was applied externally. These findings support the notion that the ethylene biosynthesis and ethylene signal transduction pathways respond to combined drought and LN in Chang6878. Furthermore, in Chang6878, the oxidation–reduction reaction related to hydrogen peroxide was enhanced. This study provides novel insights into the molecular mechanisms underlying wheat stress response to drought and LN. In the future, we aim to further develop these candidate genes or signaling pathways and determine how they regulate plant tolerance under combined drought and LN stress.

Supplementary Materials

The following supporting information can be downloaded at: https://www.mdpi.com/article/10.3390/agronomy13071950/s1, Figure S1, Identification of drought tolerance of two wheat cultivars; Figure S2, Distribution of the sequence coverages and the intensities of the identified proteins; Table S1, Wheat nutrient solution formulations; Table S2, Primer sequences used in this study; and Table S3, Quantitative raw data.

Author Contributions

C.P. and M.C. designed the research; J.Y., D.W., S.K., Z.H., X.L., W.T., K.C., Y.P., Z.X., Y.Z., J.C. and Y.M. conducted the analyses; J.Y. performed data analysis and collection; J.Y., C.P. and M.C. wrote the manuscript. All authors have read and agreed to the published version of the manuscript.

Funding

This research was funded by the National Key Research and Development Program of China (grant number 2022YFD1200202) and Henan Provincial Science and Technology Research and development Program Joint Fund (grant number 222301420025).

Data Availability Statement

The data that support the findings of this study are available from the corresponding author upon reasonable request.

Conflicts of Interest

The authors declare no conflict of interest.

References

  1. Lucertini, G.; Giustino, G.D. Urban and peri-urban agriculture as a tool for food security and climate change mitigation and adaptation: The case of Mestre. Sustainability 2021, 13, 5999. [Google Scholar] [CrossRef]
  2. Trenberth, K.E.; Dai, A.; Schrier, G.; Jones, P.D.; Barichivich, J.; Briffa, K.R.; Sheffield, J. Global warming and changes in drought. Nat. Clim. Change 2014, 4, 17–22. [Google Scholar] [CrossRef]
  3. Huang, J.; Yu, H.; Guan, X.; Wang, G.; Guo, R. Accelerated dryland expansion under climate change. Nat. Clim. Change 2015, 6, 166–171. [Google Scholar] [CrossRef]
  4. Paymard, P.; Yaghoubi, F.; Nouri, M.; Bannayan, M. Projecting climate change impacts on rainfed wheat yield, water demand, and water use efficiency in northeast Iran. Theor. Appl. Climatol. 2019, 138, 1361–1373. [Google Scholar] [CrossRef]
  5. Lhn, A.; Rins, A.; Gidst, A.; Dgda, B.; Wvds, B.; Hap, A. Leaf gas exchange, photochemical responses and oxidative damages in assai (Euterpe oleracea Mart.) seedlings subjected to high temperature stress. Sci. Hortic. 2019, 257, 108733. [Google Scholar]
  6. Ramond, J.B.; Jordaan, K.; Díez, B.; Heinzelmann, S.M.; Cowan, D.A. Microbial biogeochemical cycling of nitrogen in arid ecosystems. Microbiol. Mol. Biol. Rev. 2022, 86, e0010921. [Google Scholar] [CrossRef]
  7. Gupta, A.; Rico-Medina, A.; Caño-Delgado, A.I. The physiology of plant responses to drought. Science 2020, 368, 266–269. [Google Scholar] [CrossRef]
  8. Wu, J.; Huang, M.; Li, Y.; Fu, G.; Tian, W. Effects of water-limited irrigation on grain yield, protein content and water nitrogen utilization efficiency of extremely late sowing densely planted wheat. J. Wheat Crops 2017, 10, 1349. [Google Scholar]
  9. Han, M.; Lv, Q.; Zhang, J.; Wang, T.; Zhang, C.; Tan, R.; Wang, Y.; Zhong, L.; Gao, Y.; Chao, Z. Decreasing nitrogen assimilation under drought stress by suppressing DST-mediated activation of Nitrate Reductase 1.2 in rice. Mol. Plant 2021, 15, 167–178. [Google Scholar] [CrossRef]
  10. Saneoka, H.; Moghaieb, R.; Premachandra, G.S.; Fujita, K. Nitrogen nutrition and water stress effects on cell membrane stability and leaf water relations in Agrostis palustris Huds. Environ. Exp. Bot. 2004, 52, 131–138. [Google Scholar] [CrossRef]
  11. Ru, C.; Wang, K.; Hu, X.; Chen, D.; Wang, W.; Yang, H. Nitrogen modulates the effects of heat, drought, and combined stresses on photosynthesis, antioxidant capacity, cell osmoregulation, and grain yield in winter wheat. J. Plant Growth Regul. 2022, 14, 1407. [Google Scholar] [CrossRef]
  12. Si, Z.; Zain, M.; Mehmood, F.; Wang, G.; Gao, Y.; Duan, A. Effects of nitrogen application rate and irrigation regime on growth, yield, and water-nitrogen use efficiency of drip-irrigated winter wheat in the North China Plain. Agric. Water Manag. 2020, 231, 106002. [Google Scholar] [CrossRef]
  13. Wang, Y.; Zhang, X.; Chen, J.; Chen, A.; Wang, L.; Guo, X.; Niu, Y.; Liu, S.; Mi, G.; Gao, Q. Reducing basal nitrogen rate to improve maize seedling growth, water and nitrogen use efficiencies under drought stress by optimizing root morphology and distribution. Agric. Water Manag. 2019, 212, 328–337. [Google Scholar] [CrossRef]
  14. Li, G.; Tillard, P.; Gojon, A.; Christopher, M. Dual regulation of root hydraulic conductivity and plasma membrane aquaporins by plant nitrate accumulation and high-affinity nitrate transporter NRT2.1. Plant Cell Physiol. 2016, 57, 733–742. [Google Scholar] [CrossRef] [Green Version]
  15. Zhou, Y.; Liu, J.; Guo, J.; Wang, Y.; Ji, H.; Chu, X.; Xiao, K.; Qi, X.; Hu, L.; Li, H.; et al. GmTDN1 improves wheat yields by inducing dual tolerance to both drought and low-N stress. Plant Biotechnol. J. 2022, 20, 1606–1621. [Google Scholar] [CrossRef]
  16. Yang, C.; Ma, B.; He, S.J.; Xiong, Q.; Duan, K.X.; Yin, C.C.; Chen, H.; Lu, X.; Chen, S.Y.; Zhang, J.S. MAOHUZI6/ETHYLENE INSENSITIVE3-LIKE1 and ETHYLENE INSENSITIVE3-LIKE2 regulate ethylene response of roots and coleoptiles and negatively affect salt tolerance in rice. Plant Physiol. 2015, 169, 148–165. [Google Scholar] [CrossRef] [Green Version]
  17. Li, P.; Lu, X.; Li, M.; Yang, S.; Wen, M.; Zhao, Y.; Liu, Y.; Ma, F. Effects of ethylene inhibitors on cotton growth and yield formation. Xinjiang Agric. Sci. 2020, 57, 1009–1017. [Google Scholar]
  18. Zhu, L.; Wang, D.; Sun, J.; Mu, Y.; Pu, W.; Ma, B.; Ren, F.; Yan, W.; Zhang, Z.; Li, G.; et al. Phenotypic and proteomic characteristics of sorghum (Sorghum bicolor) albino lethal mutant sbe6-a1. Plant Physiol. Biochem. 2019, 139, 400–410. [Google Scholar] [CrossRef] [PubMed]
  19. Wang, D.; Mu, Y.; Hu, X.; Ma, B.; Pan, Y. Comparative proteomic analysis reveals that the heterosis of two maize hybrids is related to enhancement of stress response and photosynthesis respectively. BMC Plant Biol. 2020, 21, 34. [Google Scholar] [CrossRef] [PubMed]
  20. Xu, C.; Luo, M.; Sun, X.; Yan, J.; Shi, H.; Yan, H.; Yan, R.; Wang, S.; Tang, W.; Zhou, Y.; et al. SiMYB19 from foxtail millet (Setaria italica) confers transgenic rice tolerance to high salt stress in the field. Int. J. Mol. Sci. 2022, 23, 756. [Google Scholar] [CrossRef]
  21. Yang, J.; Wang, M.; Li, W.; He, X.; Teng, W.; Ma, W.; Zhao, X.; Hu, M.; Li, H.; Zhang, Y.; et al. Reducing expression of a nitrate-responsive bZIP transcription factor increases grain yield and N use in wheat. Plant Biotechnol. J. 2019, 17, 1823–1833. [Google Scholar] [CrossRef] [PubMed]
  22. Livak, K.J.; Schmittgen, T. Analysis of relative gene expression data using real-time quantitative PCR and the 2−ΔΔCT method. Methods 2001, 25, 402–408. [Google Scholar] [CrossRef] [PubMed]
  23. Mason, R.E.; Craine, J.M.; Lany, N.K.; Jonard, M.; Ollinger, S.V.; Groffman, P.M.; Fulweiler, R.W.; Angerer, J.; Read, Q.D.; Reich, P.B. Evidence, causes, and consequences of declining nitrogen availability in terrestrial ecosystems. Science 2022, 376, eabh3767. [Google Scholar] [CrossRef]
  24. Delgado-Baquerizo, M.; Maestre, F.T.; Gallardo, A.; Bowker, M.A.; Wallenstein, M.D.; Quero, J.L.; Ochoa, V.; Gozalo, B.; García-Gómez, M.; Soliveres, S.; et al. Decoupling of soil nutrient cycles as a function of aridity in global drylands. Nature 2013, 502, 672–676. [Google Scholar] [CrossRef]
  25. Li, L.; Wang, Y. Independent and combined influence of drought stress and nitrogen deficiency on physiological and proteomic changes of barley leaves. Environ. Exp. Bot. 2023, 210, 105346. [Google Scholar] [CrossRef]
  26. Jin, K.; Chen, G.; Yoo, M.J.; Zhu, N.; Chen, S. Comparative proteomic analysis of Brassica napus in response to drought stress. J. Proteome Res. 2015, 14, 3068–3081. [Google Scholar]
  27. Wen, D.; Xu, H.; He, M.; Zhang, C. Proteomic analysis of wheat seeds produced under different nitrogen levels before and after germination. Food Chem. 2020, 340, 127937. [Google Scholar] [CrossRef] [PubMed]
  28. Kumar, K.; Raina, S.K.; Sultan, S.M. Arabidopsis MAPK signaling pathways and their cross talks in abiotic stress response. J. Plant Biochem. Biotechnol. 2020, 29, 700–714. [Google Scholar] [CrossRef]
  29. Li, S.; Han, X.; Yang, L.; Deng, X.; Wu, H.; Zhang, M.; Liu, Y.; Zhang, S.; Xu, J. Mitogen-activated protein kinases and calcium-dependent protein kinases are involved in wounding-induced ethylene biosynthesis in Arabidopsis thaliana. Plant Cell Environ. 2018, 41, 134–147. [Google Scholar] [CrossRef]
  30. Wan, L.; Zhang, J.; Zhang, H.; Zhang, Z.; Quan, R.; Zhou, S.; Huang, R. Transcriptional activation of OsDERF1 in OsERF3 and OsAP2-39 negatively modulates ethylene synthesis and drought tolerance in rice. PLoS ONE 2011, 6, e25216. [Google Scholar] [CrossRef] [Green Version]
  31. Ma, B.; Ma, T.; Xian, W.; Hu, B.; Chu, C. Interplay between ethylene and nitrogen nutrition: How ethylene orchestrates nitrogen responses in plants. J. Integr. Plant Biol. 2022, 65, 399–407. [Google Scholar] [CrossRef]
  32. Khan, M.I.; Trivellini, A.; Fatma, M.; Masood, A.; Francini, A.; Iqbal, N.; Ferrante, A.; Khan, N.A. Role of ethylene in responses of plants to nitrogen availability. Front. Plant Sci. 2015, 6, 927. [Google Scholar] [CrossRef] [PubMed] [Green Version]
  33. Fu, L.; Liu, Y.; Qin, G.; Wu, P.; Zi, H.; Xu, Z.; Zhao, X.; Wang, Y.; Li, Y.; Yang, S.; et al. The TOR–EIN2 axis mediates nuclear signalling to modulate plant growth. Nature 2021, 591, 288–292. [Google Scholar] [CrossRef]
  34. Wang, Y.; Liu, C.; Li, K.; Sun, F.; Hu, H.; Li, X.; Zhao, Y.; Han, C.; Zhang, W.; Duan, Y.; et al. Arabidopsis EIN2 modulates stress response through abscisic acid response pathway. Plant Mol. Biol. 2007, 64, 633–644. [Google Scholar] [CrossRef]
  35. Zheng, D.; Han, X.; An, Y.I.; Guo, H.; Xia, X.; Yin, W. The nitrate transporter NRT2.1 functions in the ethylene response to nitrate deficiency in Arabidopsis. Plant Cell Environ. 2013, 36, 1328–1337. [Google Scholar] [CrossRef]
  36. Iqbal, N.; Trivellini, A.; Masood, A.; Ferrante, A.; Khan, N.A. Current understanding on ethylene signaling in plants: The influence of nutrient availability. Plant Physiol. Biochem. 2013, 73, 128–138. [Google Scholar] [CrossRef]
  37. De Gernier, H.; De Pessemier, J.; Xu, J.; Cristescu, S.M.; Van Der Straeten, D.; Verbruggen, N.; Hermans, C. A comparative study of ethylene emanation upon nitrogen deficiency in natural accessions of Arabidopsis thaliana. Front. Plant Sci. 2016, 7, 70. [Google Scholar] [CrossRef] [Green Version]
  38. Chen, J.; Gao, G.; Chen, P.; Chen, K.; Wang, X.; Bai, L.; Yu, C.; Zhu, A. Integrative transcriptome and proteome analysis identifies major molecular regulation pathways involved in ramie (Boehmeria nivea (L.) Gaudich) under nitrogen and water co-limitation. Plants 2020, 9, 1267. [Google Scholar] [CrossRef]
  39. Chu, N.; Zhou, J.R.; Rott, P.C.; Li, J.; Fu, H.Y.; Huang, M.T.; Zhang, H.L.; Gao, S.J. ScPR1 plays a positive role in the regulation of resistance to diverse stresses in sugarcane (Saccharum spp.) and Arabidopsis thaliana. Ind. Crops Prod. 2022, 180, 114736. [Google Scholar] [CrossRef]
  40. Liu, T.; Chen, T.; Kan, J.; Yao, Y.; Guo, D.; Yang, Y.; Ling, X.; Wang, J.; Zhang, B. The GhMYB36 transcription factor confers resistance to biotic and abiotic stress by enhancing PR1 gene expression in plants. Plant Biotechnol. J. 2022, 20, 722–735. [Google Scholar] [CrossRef] [PubMed]
  41. Agrawal, G.K.; Rakwal, R.; Jwa, N.S.; Agrawal, V.P. Signaling molecules and blast pathogen attack activates rice OsPR1a and OsPR1b genes: A model illustrating components participating during defence/stress response. Plant Physiol. Biochem. 2001, 39, 1095–1103. [Google Scholar] [CrossRef]
  42. Zhong, C.; Bai, Z.G.; Zhu, L.F.; Zhang, J.H.; Zhu, C.Q.; Huang, J.L.; Jin, Q.Y.; Cao, X.C. Nitrogen-mediated alleviation of photosynthetic inhibition under moderate water deficit stress in rice (Oryza sativa L.). Environ. Exp. Bot. 2019, 157, 269–282. [Google Scholar] [CrossRef]
Figure 1. Nitrogen supply affected the tolerance of wheat to drought stress. Representative images of drought-tolerant (DT) and drought-sensitive (DS) varieties grown hydroponically (A) under normal conditions, (B) followed by 2 d of treatment with 25% PEG 6000 and low nitrogen (LN) and normal nitrogen (Normal N) conditions, respectively, (C) subjected to the same treatment for 8 d, and (D) with recovered growth for 4 d after PEG 6000 treatment. (E) Survival rates of (C). (F) Shoot fresh weights. (G) Root fresh weights. (H) Nitrate reductase (NR) activity. (DTC, DT cultivar Chang6878 subjected to drought and Normal N stresses; DTL, DT cultivar Chang6878 subjected to drought and LN stresses; DSC, DS cultivar Shi4185 subjected to drought and Normal N stresses; and DSL, DS cultivar Shi4185 subjected to drought and LN stresses. Scale bar represents 5 cm). Different letters indicate significant differences among treatment times of seedlings based on one-way ANOVA (p < 0.05).
Agronomy 13 01950 g001
Figure 2. Proteomic data analysis of wheat seedling roots. (A) Principal component analysis of wheat seeding roots. (B) Pearson’s correlation analysis of proteome data. (C) Volcano plots of DAPs in the DTL vs. DTC groups. (D) Volcano plots of the DAPs in the DSL vs. DSC groups. (E) Volcano plots of DAPs in the DSC vs. DTC groups. (F) Volcano plots of the DAPs in the DSL vs. DTC groups. (G) Heatmap of the DAPs. Red indicates higher protein intensities, and blue indicates lower intensities.
Agronomy 13 01950 g002
Figure 3. KEGG analysis of unique differentially abundant proteins (DAPs). (A) Venn diagrams showing commonly shared and unique DAPs in the groups of DTL vs. DTC and DSL vs. DSC. Four color respectively represent the number of protein in four groups, purple (number of down−regulated proteins in group DTL vs. DTC), yellow(number of up−regulated proteins in group DTL vs. DTC), green (number of up−regulated proteins in group DSL vs. DSC), and red (number of down−regulated proteins in group DSL vs. DSC). (B) Venn diagrams showing commonly shared and unique DAPs in the groups of DSL vs. DTL and DSC vs. DTC. Four color respectively represent the number of protein in four groups, purple (number of down−regulated proteins in group DSC vs. DTC), yellow (number of up−regulated proteins in group DSC vs. DTC), green (number of up−regulated proteins in group DSL vs. DTC), and red (number of down−regulated proteins in group DSL vs. DTC). The non−overlapping parts on the way represent specific proteins for each group, while the overlapping parts represent the proteins shared by multiple groups. The corresponding numbers are marked in the figure. (C) KEGG analysis of unique upregulated and downregulated DAPs in groups of DTL vs. DTC and DSL vs. DSC. (D) KEGG analysis of unique upregulated and downregulated DAPs in groups of DSL vs. DTL and DSC vs. DTC. Red indicates more proteins, white indicates fewer proteins, and gray indicates no proteins were enriched in the pathway. (E) Heatmap of the differentially changed proteins involved in MAPK signaling pathway-plant, phenylpropanoid biosynthesis, and glutathione metabolism in the DTL vs. DTC groups. (F) Heatmap of the differentially changed proteins involved in protein processing in the endoplasmic reticulum, carbon fixation in photosynthetic organisms, and oxidative phosphorylation in the DSL vs. DTL groups. Red indicates higher protein intensities, and green indicates lower intensities. (DTC: DT cultivar Chang6878 subjected to drought and Normal N stresses; DTL: DT cultivar Chang6878 subjected to drought and low N (LN) stresses; DSC: DS cultivar Shi4185 subjected to drought and Normal N stresses; DSL: DS cultivar Shi4185 subjected to drought and LN stresses).
Agronomy 13 01950 g003
Figure 4. Validation of important differentially abundant proteins (DAPs) in ethylene synthesis and ethylene signal transduction pathway using parallel reaction monitoring (PRM) and qRT-PCR. (A) Signal pathway model of the mitogen-activated protein kinase (MAPK) pathway in response to combined drought and low nitrogen (LN) stress. Red circles indicate upregulation. (B) MAPK3/6 (A7L5U5), (C) ACS6 (A0A3B6CAM9), (D) EIN2 (A0A3B6HYK7), (E) EIN2 (A0A3B6LK83), (F) EIN2 (A0A3B6MPY1), (G) ERF (A0A3B6I0A8), (H) CHIB (A0A3B6U7G0), and (I) CHIB (A0A0H4TM98). The qRT-PCR data were analyzed using the 2−ΔΔCt method. Each experiment contained three independent biological and five technical replicates. Blue represents the PRM validation results and green represents the qRT-PCR validation results. ** p < 0.01 (two-tailed Student’s t-test). (J) Representative images of hydroponic cultivars of drought-tolerant varieties under drought and low nitrogen compliance stress (DTL) applied with ethylene synthesis precursor ACC, ethylene synthesis inhibitor silver nitrate, and ethylene signal transduction inhibitor 1-methylcyclopropene. Drought and low nitrogen stress were used as controls. Scale bars correspond to 5 cm. (K) Shoot fresh weight of F. (L) Shoot dry weight of F. (M) Survival rate of F. (N) Leaf relative water content (RWC) of F. RWC % = (Original fresh weight − dry weight)/(saturated fresh weight − dry weight) × 100%. Asterisks indicate significant differences as determined by t-tests (* 0.01< p < 0.05, ** p < 0.01).
Agronomy 13 01950 g004
Figure 5. Validation of important DAPs in oxidation–reduction reaction using PRM and physiological index detection. (A) PR1 (A0A3B6KF02), (B) PR1 (A0A3B6UCP5), (C) PR1 (C3UZE5), (D) PR1 (M5AKY4), (E) PR1 (Q94F73), (F) POD (A0A1D5UU04), (G) POD (A0A3B6B887), (H) POD (A0A3B6FYA0), (I) POD (C6ETA5), (J) POD (A0A3B6SFH1), (K) GST (A0A3B6H1W4), (L) POD activity, (M) GST activity. ** p < 0.01 (two-tailed Student’ s t-test).
Agronomy 13 01950 g005
Disclaimer/Publisher’s Note: The statements, opinions and data contained in all publications are solely those of the individual author(s) and contributor(s) and not of MDPI and/or the editor(s). MDPI and/or the editor(s) disclaim responsibility for any injury to people or property resulting from any ideas, methods, instructions or products referred to in the content.

