Article

Using Ecological Stoichimetric Characteristies to Inform Grassland Management in the Karst Desertification Area

School of Teacher Education, State Engineering Technology Institute for Karst Desertification Control, Guizhou Normal University, Guiyang 550001, China
*
Authors to whom correspondence should be addressed.
Agronomy 2023, 13(7), 1841; https://doi.org/10.3390/agronomy13071841
Submission received: 18 June 2023 / Revised: 11 July 2023 / Accepted: 11 July 2023 / Published: 12 July 2023
(This article belongs to the Special Issue Grassland and Pasture Ecological Management and Utilization)

Abstract

:
C, N and P play an important indicator role in explaining the material cycles and elemental balances of living and non-living systems. In order to control karst rocky desertification, China has established a large number of artificial grasslands for the development of herbivorous animal husbandry, which has played an important role in ecological restoration and economic development. However, the effects of different use patterns on the ecological stoichiometry of the carbon (C), nitrogen (N) and phosphorus (P) of the grassland plant–soil–microorganism are not clear. In this study, the effects of grazing grassland (GG), mowing grassland (MG) and enclosed grassland (EG) on C, N and P and their ecological stoichiometry in the artificial grassland plant–soil–microbe were investigated in the karst desertification control area in Southern China. The results showed that (1) the C content was EG > GG > MG. The N content was GG > EG > MG, while the P content was MG > GG > EG. C:N, C:P and N:P were shown as EG > GG > MG. The plant N:P was more than 20, indicating a P deficiency and limitation, especially in EG. (2) The content of C and P in soil was EG > GG > MG. The N content was GG > EG > MG. The soil C:N showed EG > MG > GG, while C:P and N:P were shown as MG > GG > EG. The soil N:P ratios were all less than 14, indicating that all of them had an obvious N limitation. (3) Soil microbial biomass carbon (MBC) was GG > MG > EG. Soil microbial biomass nitrogen (MBN) was GG > EG > MG. Soil microbial biomass phosphorus (MBP) showed EG > GG > MG. MBC:MBN was MG > EG > GG. MBC:MBP was MG > EG > GG. MBN:MBP was GG > MG > EG. The MBN:MBP in GG and MG was greater than 9.6, which is P-limited, while the MBN:MBP in EG is less than 8.9, which is N-limited. (4) Plant C and N were significantly correlated with soil C and N, but plant P was significantly negatively correlated with soil P, while MBP was significantly positively correlated with soil TP. Soil microorganisms had the tendency to assimilate available P in GG and MG treatments, but the potential of releasing P from mineralized soil organic matter was higher in EG treatment. The results showed that the chemical properties and stoichiometric characteristics of the plant–soil–microorganism were significantly changed by different grassland-use methods, which provided scientific guidance for the management of C, N and P elements and the further optimization of soil microbial environment for artificial grassland in the karst rocky desertification area.

1. Introduction

Nitrogen (N) and phosphorus (P) are the most essential nutrients affecting plant growth and development, and they are the main limiting elements in terrestrial ecosystems [1]. At the same time, N and P elements will affect the fixation of plant carbon (C), and C, N and P interact with each other to regulate plant physiological activities [2]. Soil is the basis for plant growth, and the nutrients needed for plant growth mainly come from soil, while microorganisms are important drivers of the soil nutrient cycle, which can reflect the growth conditions of organisms [3]. Differences in soil parent material, microbial activities, plant types, litter return and human utilization methods result in the obvious different characteristics of plants, soil and microorganisms, thus increasing the complexity of their relationship with the environment [4,5]. C, N and P play important indicative roles in explaining the material cycle and elemental balance of biological and abiotic systems [6,7]. Therefore, it is of great significance for understanding the coupling relationship between the material cycling process of the biological system and environment to study the dynamic balance of C, N and P nutrients in the “plant–soil–microbe” system.
Ecological stoichiometry emphasizes the balance of C, N and P ratios and focuses on revealing the quantitative relationship and law of element interaction and process balance in an ecosystem [8]. Ecological stoichiometry is a useful tool to reveal the ability of plants, soils and microorganisms to maintain a relatively constant nutrient composition in response to changes in available soil resources [9] and to understand the variation of nutrients and their interactions in the plant–soil–microorganisms [10]. Therefore, understanding the nutrient balance in the plant–soil–microorganism is very important for the restoration of degraded ecosystems. Studies have shown that C, N and P in the plant–soil–microorganisms are distinctly affected by different ecological processes, such as grassland degradation and mining recovery [11,12], so their ratio changes are highly valued globally [13]. At present, the study of ecological stoichiometry on vegetation mainly focuses on regional and ecosystem scales, and the research results are mostly on forest, grassland and wetland ecosystems [14]. These studies also showed that the ecological stoichiometry of C, N and P in plants and soil had spatial variability in different regions and habitats. For perennial plants (e.g., grassland plants), their different utilization methods will result in differences in C assimilation and accumulation capacity, nutrient absorption efficiency and litter return ability, which will definitely lead to changes in the C, N and P contents of plants, soils and soil microorganisms. Therefore, it is necessary to study the ecological stoichiometry of plant–soil–microbe relationships from the perspective of different utilization methods [5].
Karst landform accounts for about 15% of the total global land area and is home to more than 1 billion people [15]. However, due to its special geological structure, under the interference of natural and human activities, soil erosion is serious, and it is easy to cause a landscape similar to desertification, namely karst desertification [16]. Previous studies in the karst region of Southern China have shown that the “Grain for Green” project (refers to the control mode of stopping cultivation of sloping farmland, changing it into artificial grassland establishment, restoring vegetation and controlling soil erosion in order to prevent and control soil erosion) is an important measure to rapidly repair the damages to the ecological environment in the karst desertification area [17] and that it is of great significance to promote ecological reconstruction and economic development. The implementation of a large number of rocky desertification control engineering projects will inevitably lead to differences in soil nutrient consumption and return and make the changes of C, N, P nutrient cycle in the “plant–soil–microorganism” system, while ecological stoichiometry can reveal its internal relationship, thus guiding practice. The most important utilization methods of artificial grasslands are grazing and mowing, and different utilization methods may change the long-tern evolution of soil–plant–microbial nutrient relationships in grassland [18], thus exerting far-reaching impacts on ecosystem functions [19]. Currently, the studies of ecological stoichiometry in karst areas mainly focus on forests or different land uses [20,21,22,23,24], while the research on ecological stoichiometry characteristics, change law and internal correlation of grassland plants, soil and microorganisms under different measures of rocky desertification control project is still insufficient. Therefore, it is urgent to clarify the ecological stoichiometry characteristics of the soil–plant–microorganism and their inner correlations, revealing the nutrient utilization methods in grassland under different utilization methods in the karst desertification areas to provide a scientific basis for the restoration and reconstruction of degraded karst ecosystems. For this purpose, we proposed a scientific hypothesis: is there an effect of different utilization patterns on the ecological stoichiometry characteristics of the soil–plant–microorganisms in the grasslands of karst rocky desertification areas? To address the hypothesis, this study took the artificial grassland under different utilization methods (grazing, mowing and enclosure) in the karst desertification area as the research object and studied the contents of C, N P and their ecological stoichiometry characteristics and correlation of the plant–soil–microorganism under different grassland utilization methods in order to provide theoretical support for the sustainable utilization and ecological restoration of artificial grassland in the karst desertification control area.

2. Materials and Methods

2.1. Research Area

The study area is located in Salaxi Town and Yejiao Township, Qixingguan District, Bijie City, Guizhou Province, China (105°02′01′–105°08′09′ E, 27°11′36′–27°16′51′ N), belonging to the Upper Liuchong River Basin of Wujiang River, which is a karst desertification control with typical karst plateau–mountain and potential/light karst desertification. Karst is widely distributed in the study area, and the karst desertification area in the study area is 55.931 km2, accounting for 64.93% of the total area of the demonstration area. The soil is mainly yellow loam, which was mainly planted by traditional agriculture such as corn and potato for a long time, and soil erosion is serious, so the soil thickness is generally about 20–50 cm. The study area has a subtropical monsoon climate zone, with an average annual rainfall of about 1000 mm, average annual temperature of about 12 °C, frost-free period of 245 days and average annual sunshine hours of 1360 h. Due to the influence of the karst geological structure, the storage of groundwater is extremely complex, so it is difficult to utilize and exploit groundwater resources. The main production and living waters are spring and surface water, with sufficient water in summer but serious water shortage in the dry season. The vegetation of trees and shrubs is dominated by Pinus yunnanensis, Rhododendron simsii, Pyracantha fortuneana, Cyclobalanopsis glauca, Rosa roxburghii and Juglans regia. Herbaceous plants include Artemisia lavandulaefolia, Chenopodium glaucum, Stellaria media, Digitaria sanguinalis, Trifolium repens, Trifolium pratense, Lolium perenne, Dactylis glomerata and Bromus catharticus.

2.2. Sample Plot Setting

In April 2012, the research team established an artificial grassland by mixed seeding in the study area, namely Lolium perenne + Dactylis glomerata + Trifolium repens, with the seed quantity of 2:2:1. The grassland has been mainly used for free grazing after the establishment, and the carrying capacity was 600 m2/sheep unit. In order to reveal the difference of ecological stoichiometry characteristics of grassland plant–soil–microorganism under different use patterns, we established three different types of grassland usage in August 2019, namely grazing grassland (GG), mowing grassland (MG) and enclosed grassland (EG), among which EG was the control group. Three replicates were set for each plot, and the distance between the plot boundaries was more than 50 cm. Each plot of enclosed grassland was about 100 m2, and none shall be used for any purpose.
Each plot of grazing grassland was about 3000 m2. The average grazing quantity of each plot in grazing grassland was 5 (basically consistent with the local grazing situation), and the grazing livestock were Guizhou semi-fine wool sheep, about 1 year old. The grazing time was 300 days per year, except in extreme weather.
Each plot of mowing grassland was about 3000 m2. When the grass height reached about 40 cm, the mowing was carried out, and it was cut 4 times a year; the stubble height was about 5 cm.

2.3. Sample Collection

In mid-August 2021, three 1 m × 1 m quadrates were set up in each sample plot, and the aboveground plants in the small quadrate were harvested with a stubble height of 5 cm. The plant samples harvested in the quadrat of each plot were fully mixed and evenly bagged back to the laboratory, and a total of 9 plant samples were obtained. In order to reduce the spatial heterogeneity of the soil, the S-shaped sampling method was used in each plot afterward, and 15 sampling points were uniformly set. After removing the litter layer on the soil surface, soil samples (0–10 cm) were collected with a soil drill. Soil samples from 15 sampling points in each plot were mixed into one sample and brought back to the laboratory. A total of 9 soil samples were obtained. The plant samples brought back were inactivated at 105 °C for 30 min and then dried at 65 °C to constant weight. After drying, the contents of C, N and P of the plants were determined after passing through a 2 mm sieve. The impurities in the soil samples were removed and divided into two parts. One part of the soil samples was naturally air-dried indoors and then passed through a 2 mm sieve for the determination of soil C, N and P contents. The other part was placed in dry ice at −78.5 °C and returned to the laboratory for the determination of soil microbial C, N and P contents.

2.4. Determination of Samples

According to the method of Hu et al. [14], the contents of organic carbon, total nitrogen and total phosphorus in the soil and plants were determined. The organic carbon content and total nitrogen content of plants and soil were determined by an automatic elemental analyzer (FlashSmart, Thermo Fisher, Waltham, WA, USA). The total phosphorus content of plants was digested with H2SO4-H2O2, and the total phosphorus (TP) of soil was fused with NaOH and colored with molybdenum–antimony resistance and then determined with an ultraviolet spectrophotometer (Specord 200 PLUS, Analytik, Jena, Germany). Soil microbial biomass carbon (MBC) was measured via the CHCl3 fumigation-K2SO4 method, soil microbial biomass nitrogen (MBN) was measured via the CHCl3 fumigation–K2SO4 extraction–nitrogen automatic analyzer method and soil microbial biomass phosphorus (MBP) was measured via the CHCl3 fumigation–NaHCO3 extraction–Pi determination–Pi correction method [14,25]. The stoichiometric characteristics of carbon, nitrogen and phosphorus and of plants, soils and microorganisms were expressed by mass ratio.

2.5. Data Processing

Excel 2013 was used to make the statistics and preliminary analysis of the experimental data. A one-way ANOVA, LSD multiple comparison and Person correlation analysis were conducted in SPSS 22 to study the effects of different land-use patterns on the ecological stoichiometry characteristics of grassland soil–plant–microorganism, and the figures were plotted with Origin 2018.

3. Results

3.1. C, N and P Contents and Stoichiometric Ratios of Grassland Plants under Different Utilization Methods

According to Table 1, the C content of grassland plants under the three different utilization methods was EG > GG > MG, and the C content of plants under the three treatments was significantly different (p < 0.05). The N content of plants was GG > EG > MG, and the N content of plants in GG was significantly higher than that in MG and EG (p < 0.05), but there was no significant difference between MG and EG. The results showed that EG increased the C content, GG increased the N content, and MG increased the P content.
The C:N of grassland plants under three different utilization methods showed EG > MG > GG, and there were significant differences among the three treatments (p < 0.05). The C:P and N:P showed EG > GG > MG, and the EG treatment was significantly higher than GG and MG (p < 0.05). The average values of the C:N, C:P and N:P of grassland plants under three different utilization methods were 21.94, 713.15 and 31.93, respectively.

3.2. C, N and P Contents and Stoichiometric Ratio of Grassland Soil under Different Utilization Methods

According to Table 2, the C content of grassland soil under three different utilization methods was shown as EG > GG > MG, and the C content of soil in EG was significantly higher than that in MG (p < 0.05). The N content of soil was GG > EG > MG, and the N content of soil in GG was significantly higher than that in MG and EG (p < 0.05). The P content of soil was EG > GG > MG, and the difference among the three treatments was significant (p < 0.05). The average values of C, N and P contents in grassland soil under three different utilization methods were 19.77 g/kg, 1.92 g/kg and 0.88 g/kg, respectively. The results showed that EG increased the C and P content, while GG increased the N content.
The C:N of grassland soil under the three different utilization methods was EG > MG > GG, and the difference among the three treatments was significant (p < 0.05). The C:P and N:P showed MG > GG > EG, and there were significant differences among the three treatments (p < 0.05). The average values of the C:N, C:P and N:P of grassland soil under three different utilization methods were 10.42, 24.52 and 2.44, respectively.

3.3. MBC, MBN and MBP Contents and Stoichiometric Ratio of Grassland Soil under Different Utilization Methods

According to Table 3, the MBC, MBN and MBP contents of grassland soil under three different utilization methods are significantly different. The average values of MBC, MBN and MBP of grassland soil under three different utilization methods were 312.25 mg/kg, 106.97 mg/kg and 12.42 mg/kg, respectively. The MBC content of grassland soil was GG > MG > EG, and GG was significantly higher than EG (p < 0.05), but there was no significant difference between GG and MG or between MG and EG. The MBN content was GG > EG > MG, and there were significant differences among the three treatments (p < 0.05). The MBP content showed EG > GG > MG, and there were significant differences among the three treatments (p < 0.05). The results showed that GG increased the content of MBC and MBN, while EG increased the MBP content.
The stoichiometric ratios of soil microorganisms in grassland under three different utilization methods were also significantly different. The MBC:MBN was MG > EG > GG, and there were significant differences among the three treatments (p < 0.05). The MBC:MBP showed MG > GG > EG, and there were significant differences among the three treatments (p < 0.05). The MBN:MBP showed GG > MG > EG, but there was no significant difference between GG and MG (p > 0.05).

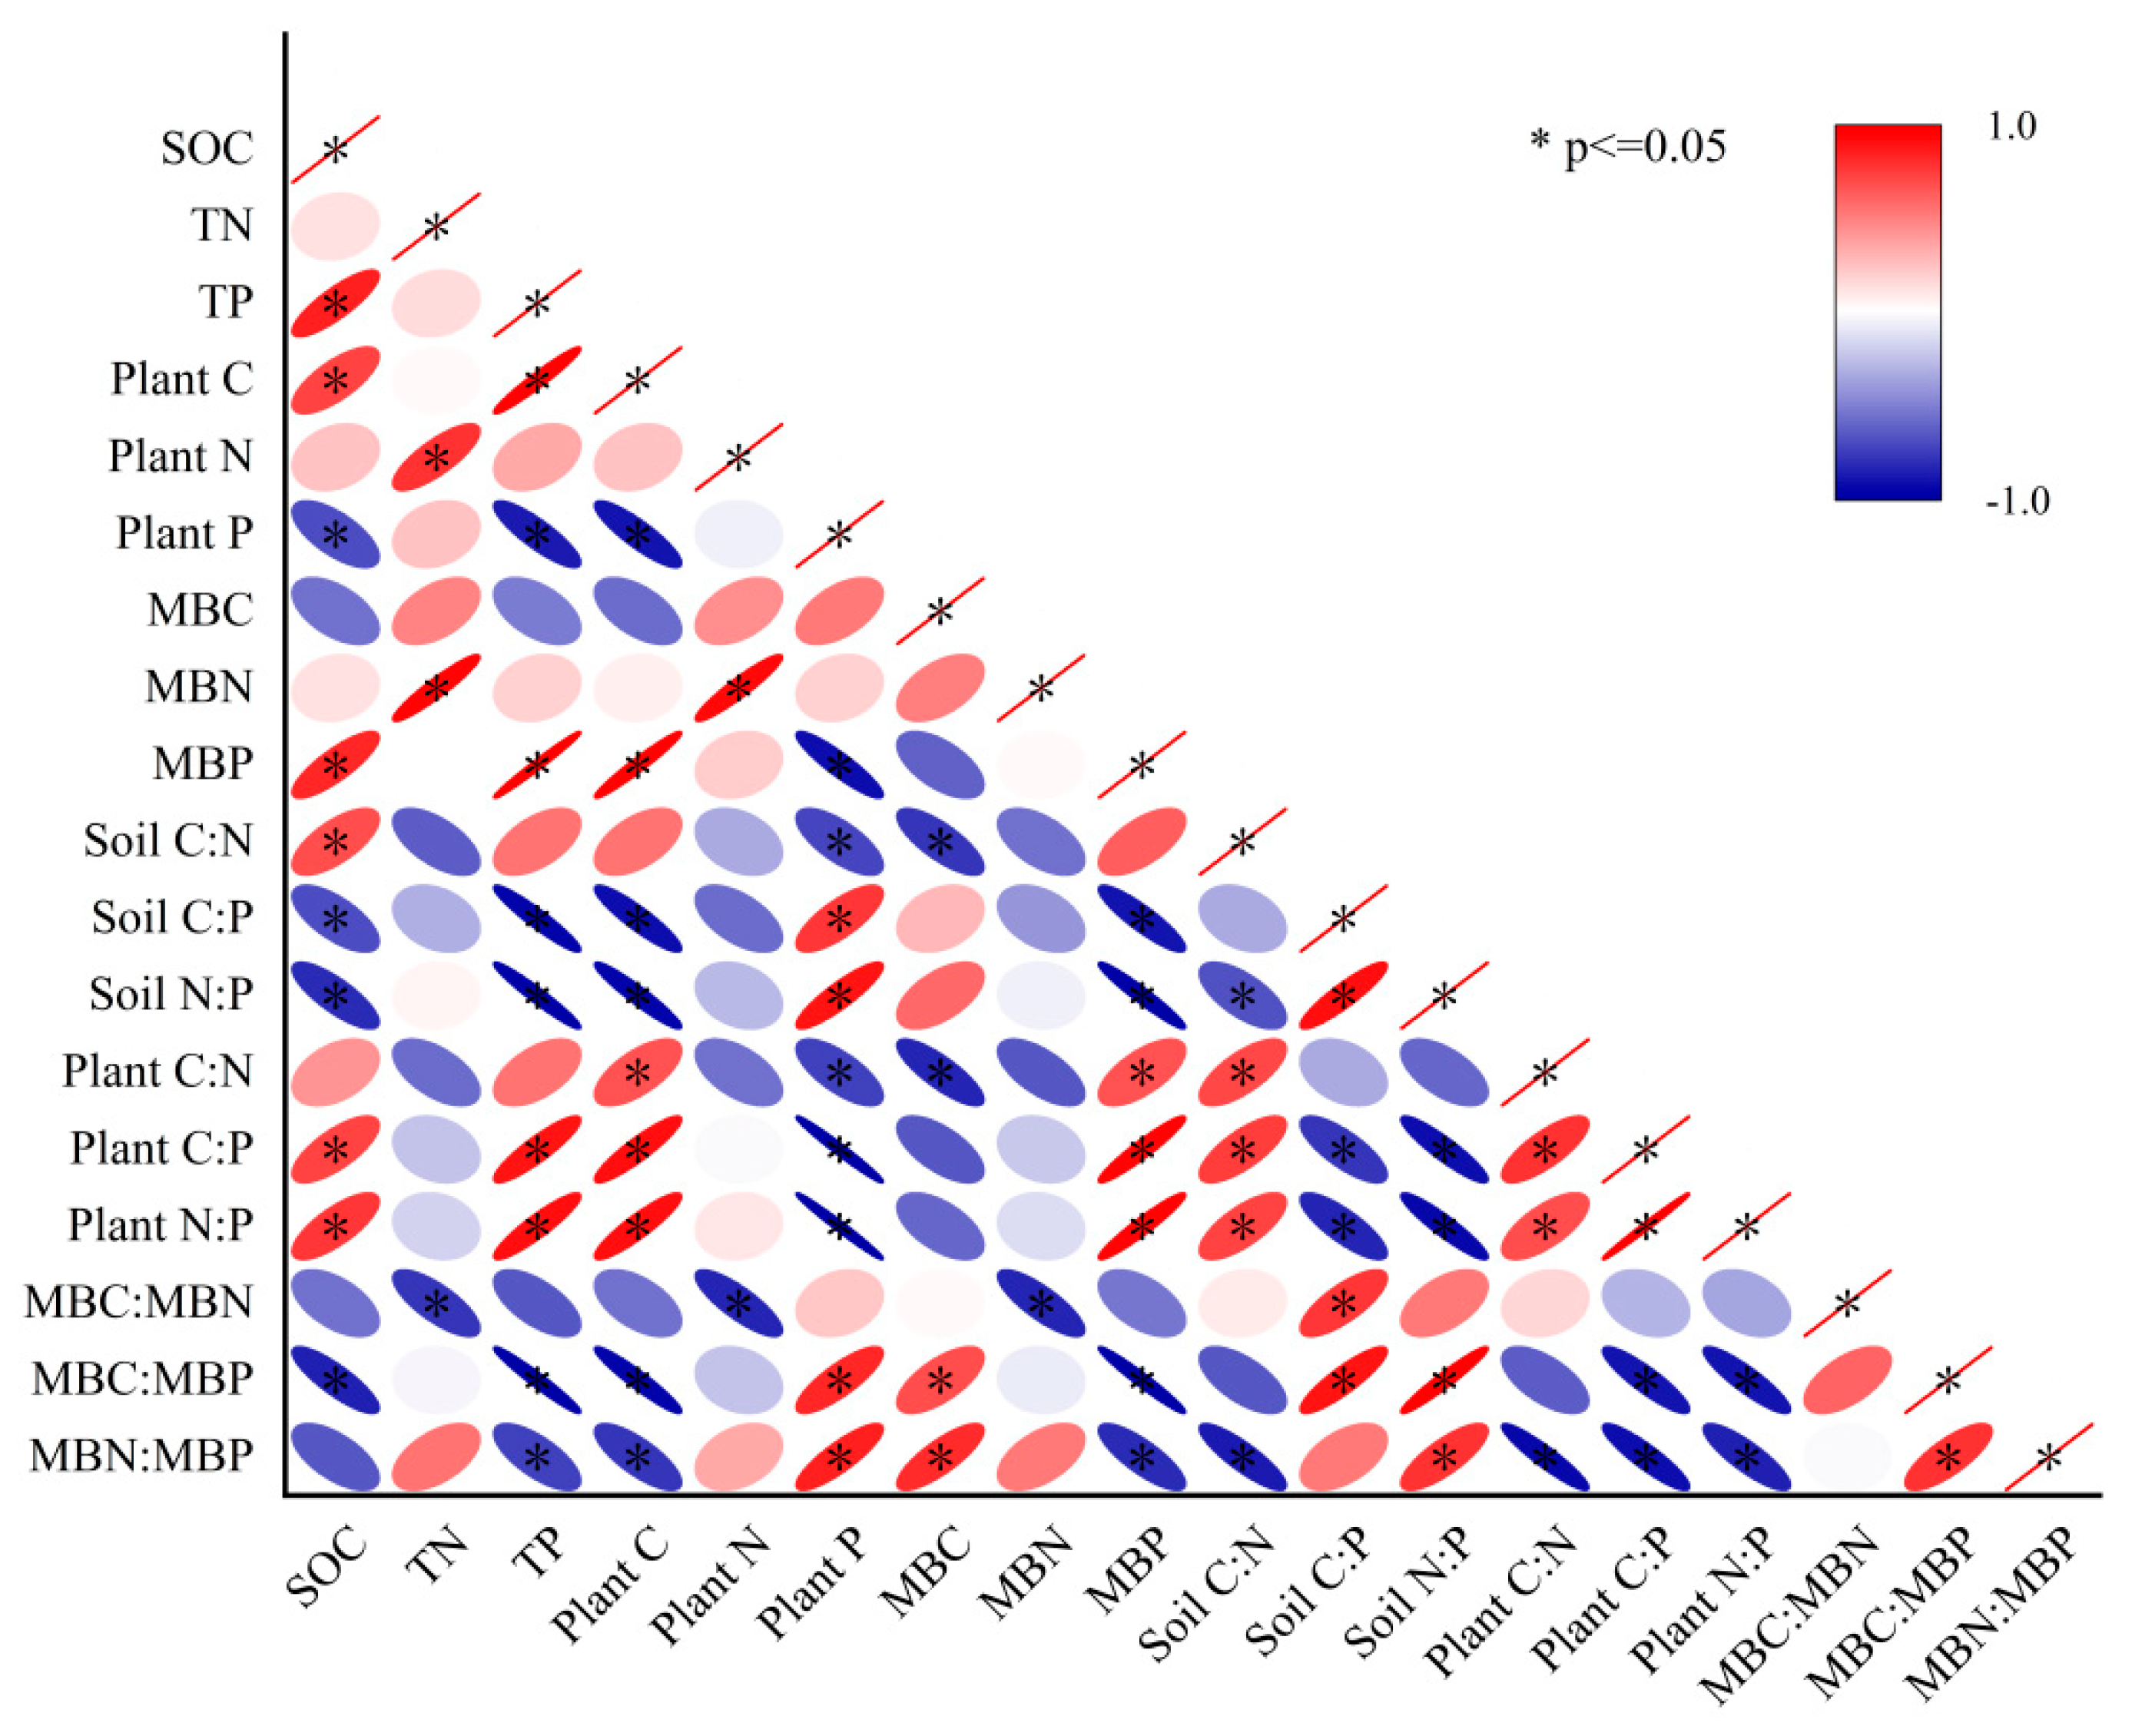
3.4. Correlation Analysis of C, N, P Contents and Stoichiometric Ratios in Plant–Soil–Microorganism

The correlation analysis results showed that SOC was significantly positively correlated with TP, plant C, MBP, soil C:N, plant C:P and plant N:P. It was negatively correlated with plant P, soil C:P, soil N:P and MBC:MBP (Figure 1). TN was positively correlated with plant N and MBN and negatively correlated with MBC:MBN. TP was significantly positively correlated with plant C, MBP, plant C:P and plant N:P. It was significantly negatively correlated with plant P, soil C:P, soil N:P, MBC:MBP and MBN:MBP. Plant C was significantly positively correlated with MBP, plant C:N, plant C:P and plant N:P. It was significantly negatively correlated with plant P, soil C:P, soil N:P, MBC:MBP and MBN:MBP. Plant N was positively correlated with MBN and negatively correlated with MBC:MBN. Plant P was significantly positively correlated with soil C:P, soil N:P, MBC:MBP and MBN:MBP. It was significantly negatively correlated with MBP, soil C:N, plant C:N, plant C:P and plant N:P. MBC was positively correlated with MBC:MBP and MBN:MBP and negatively correlated with soil C:N and plant C:N. MBN was negatively correlated with MBC:MBN. MBP was significantly positively correlated with plant C:N, plant C:P and plant N:P. It was significantly negatively correlated with soil C:P, soil N:P, MBC:MBP and MBN:MBP.
Soil C:N was significantly positively correlated with plant C:N, plant C:P and plant N:P and significantly negatively correlated with soil N:P and MBN:MBP. Soil C:P was significantly positively correlated with soil N:P, MBC:MBN and MBC:MBP. It was significantly positively correlated with plant C:P and plant N:P. Soil N:P was significantly positively correlated with MBC:MBP and MBN:MBP. It was significantly negatively correlated with plant C:P and plant N:P. Plant C:N was positively correlated with plant C:P and plant N:P, and it was negatively correlated with MBN:MBP (p < 0.05). Plant C:N was positively correlated with plant C:P and plant N:P, and it was negatively correlated with MBN:MBP. Plant C:P was positively correlated with plant N:P, and it was negatively correlated with MBC:MBP and MBN:MBP. Plant C:P was positively correlated with plant N:P, and it was negatively correlated with MBC:MBP and MBN:MBP. Plant N:P was negatively correlated with MBC:MBP and MBN:MBP. There was a significant positive correlation between MBC:MBP and MBN:MBP.

4. Discussion

4.1. Plant C, N and P Content and Stoichiometric Ratio

Previous studies have shown that the contents of C, N and P in plants are often different under different utilization patterns or at different growth stages [26,27,28,29,30]. In this study, the plant C content was highest in EG and lowest in MG, showing EG > GG > MG. N and P are important components that affect the synthesis of proteins, nucleic acids, enzymes and other important compounds in plants, and they also affect all physiological activities of a plant’s life cycle [27]. Forage requires large amounts of protein and nucleic acids to support the rapid growth of plant tissues due to being harvested and mowed by livestock, so the P content of forage in GG and MG was significantly higher than that in EG (p < 0.05). The plant N content in GG was significantly higher than the other two treatments due to factors such as the excretion of feces and urine from grazing livestock, while the MG, which was mowed and utilized for a long time, had the lowest N content (p < 0.05). The forage in EG was degraded because of not being used for a long time, and the nutrients such as P were diluted; thus, as the P content decreases, the pasture biomass decreases, the tissue structure is stabilized and the C content increases obviously. C mainly exists in the form of organic matter in the plant, and it accumulates in the process of forage growth, which was also the reason why the C content in EG was the highest and the MG content decreased rapidly, which might be related to the long-term removal of a large amount of C from forage; meanwhile, the MG treatment was the lowest, and this result might be related to the increase of long-term unused C content, which is consistent with the previous research results [31,32].
The C:N, C:P and N:P ratios of plants can indicate the ability of plants to assimilate C for nutrient absorption and the nutrient limitation of plants. Some studies showed that grazing reduces some senescent tissues of plants through livestock feeding, and the growth rate of young tissues is faster, resulting in a lower leaf C:N [33], which is consistent with the findings of this paper; that is, GG significantly reduced plant C:N compared with EG (p < 0.05). At the same time, GG increased the C:P and P:N, a result which is consistent with previous research results [34]. In terrestrial ecosystems, N and P are the main nutrient elements that limit plant growth, and the N:P can effectively predict the nutrient limitations of individual plants or ecosystems [35]. Some studies have suggested that when plant N:P is <10 or 14, plant growth is limited by N, and when plant N:P is > 16 or 20, plant growth is limited by P [36,37]. He et al. studied the main grassland vegetation types in China and concluded that the grassland vegetation in China is generally P-limited [37], and Han et al. also reached the same conclusion by studying 753 species of higher terrestrial plants in China [4]. In this study, the N:P values in three treatments were all greater than 20, meaning that they exceeded the average value of N:P in China herbaceous (13.5) [4]. The N:P in EG was the highest, and that in MG was the lowest; EG was 1.79 times and 2.20 times of GG and MG, respectively, indicating that P restriction exists in the three treatments, and the P restriction in EG is the most serious, while the P restriction in MG is the least. We believe that this may be related to the fact that the grass on the ground of MG is cleaned after each cutting, the relatively smooth ground is more conducive to the decomposition of soil P, and the decomposition and turnover rate of soil P is higher than that of N, results which are basically consistent with the previous research results of our team [38]. However, the factors that affect the nutrient limitation of plants are complex and diverse, and the threshold values of the N and P elements are different in different ecosystem types, different regions and different evolution stages [33]. Using the plant N:P ratio to characterize the limiting effect of N and P nutrients is more important to reflect the relative size and mutual transformation trend of N and P elements, and its significance is mainly used as an indication. To refine the threshold value of N and P elements in specific grassland ecosystems in karst areas, further in-depth verification is needed.

4.2. Soil C, N and P Nutrient Content and Stoichiometric Ratio

Soil nutrients are an important source of plant nutrients, and different utilization methods often lead to changes in soil nutrient status, which affects plants’ absorption of soil C, N and P, resulting in changes in plant C, N and P stoichiometric ratios and microbial communities and ultimately affecting the stability of the grassland ecosystem [33,39]. In this study, we found some differences in soil nutrients under the three different treatments. EG may be more conducive to SOC accumulation, and its content was 1.15 times that of GG and 1.29 times that of MG, a result which may be related to the long-term enclosure to restore the vegetation characteristics and maintain or improve the soil carbon sequestration capacity, as is consistent with the previous research results [40]. Soil nitrogen is the largest mineral element absorbed by plants from soil, and it is also a major limiting factor for vegetation growth in grassland [41], as it can affect community diversity and ecological function [42]. In this study, the TN content of grassland soil in GG was 2.19 g/kg, which was 1.26 times higher than that of MG and 1.20 times higher than that of EG. This may be related to the excretion of livestock, indicating that the manure of grazing livestock can promote the improvement of TN in grassland soil to a certain extent, which is consistent with the previous results of our research group [38,43]. In this study, the TP content in EG was the highest, which was 1.48 times of GG and 2.38 times of MG. To a certain extent, it also indicated that enclosure had a promoting effect on the increase of soil TP, a result which is consistent with the research in the desert grassland of Northwest China [44]. It may be mainly related to the fact that EG can increase the P content of soil through the cycle of litter compared with GG and MG by human disturbance. However, some studies suggest that after 6–8 years of fencing, there is no difference in soil P content between unfenced grassland and fenced grassland, a result which may be related to the time of fencing [45]. Some studies also consider that with the increase of fence years, the adverse effects of fences become increasingly prominent, which may gradually reduce the content of P [46]. Therefore, Ahmad et al. suggested that biological and abiotic environmental and human factors together determine the changes of soil C, N and P contents [47]. The results of this study also showed that different artificial utilization methods increased the heterogeneity of the grassland soil environment and affected the development trend of soil C, N, P and other elements. Therefore, corresponding restoration strategies should be formulated to adapt to grassland utilization in ecological restoration areas to improve ecosystem productivity.
The ecological stoichiometric ratio of soil C, N and P is a key index to estimate soil quality [48]. Soil C:N and C:P are commonly used to evaluate the availability of soil N and P. Generally, the lower the C:N and C:P, the higher the content of soil available N and P [49]. In this study, the average values of C:N in GG, MG and EG were 8.91, 10.04 and 12.31, respectively. Compared with the average value of C:N of Chinese land surface soil (14.4) [50], EG was closer to the average level of China. The higher the soil C:N ratio, the slower the decomposition rate of SOC, which could maintain soil fertility for a long time. Therefore, the decomposition rate of SOC in EG was lower than that in GG and MG, and the available N and P contents were relatively lower. Some studies suggested that when the C:P is > 300, soil nutrients are net fixed; when the C:P is <200, the P element experiences net mineralization; and when the C:P is 200 < C:P < 300, the soluble phosphorus concentration has little change [51]. In this study, the C:P in GG, MG and EG was 22.78, 32.88 and 17.91, respectively, far lower than the average value in China (136) [52], also indicating that the net mineralization of soil P element in MG is stronger than that in GG and EG, which may be related to the long-term removal of forage material by MG. Plant growth requires the soil to accelerate the provision of P, which intensifies the net mineralization of P and the abundance of P in the soil, a result which is consistent with the previous research results [53]. Soil N:P is an important predictor of nutrient limitation. It is generally believed that plant growth is limited by N when the N:P is <14, plant growth is limited by P when the N:P is >16, and plant growth is limited by both N and P when 14 < N:P < 16 [54]. In this study, the N:P of grassland soil was less than 14 under three different utilization modes, indicating that there was an obvious N limitation, a result which is consistent with previous similar research results [54,55,56,57]. However, some studies suggest that soil nutrients in karst areas are mainly restricted by the P element [58]. The reason for the low N:P in EG may be that the higher soil P element has net mineralization and a moderately abundant N element, which reduces its ratio, a result which is consistent with that of the study of Wan et al. [59]. The main reason for the higher N:P ratio in MG than that in GG may be that the higher net mineralization of P in MG soil counteracts the advantage of N emission from livestock manure in GG. Therefore, we believe that the reasons for the limitation of soil N:P may be related to environmental and human factors such as soil type, vegetation characteristics and utilization methods. Meanwhile, the rational application of N fertilizer should be considered under the three different grassland uses in order to alleviate the limitation of N on soil nutrients and promote the balance of soil nutrients.

4.3. Microorganisms C, N and P Content and Stoichiometric Ratio

Microorganisms are the most active components in the soil ecosystem [60]. Soil microorganisms affect the decomposition rate of soil organic matter by adjusting the productivity of mineralization enzymes for soil nutrient availability, which is an ideal indicator to measure soil quality [61]. In this study, there were some differences in soil microbial biomass under different grassland-utilization methods. The MBC in GG and MG under human intervention was higher than that in EG, while the MBN in EG was between that of GG and MG, and the MBP in EG was the highest, which may be closely related to the nutrient demand of grassland and the nutrient supply of soil under different utilization methods.
Soil microorganisms can adapt to changes of the surrounding environment by adjusting their ecological stoichiometric ratio and resource-utilization efficiency [62]. The ecological stoichiometry of soil microorganisms is significantly affected by the ecological stoichiometry of soil [63], which can reflect the microbial community’s structure and microbial activity, and it is an important indicator to determine the direction of microbial activity, the release of organic matter nutrients [64] and the change of the microbial community’s structure [65]. In this study, the MBC:MBN ranged from 2.48 to 3.88 under three different grassland utilization modes and was significantly lower than the global average range (4.6–10.3) [66]; it was also lower than the average value of desert grassland soil in China (8.55 ± 3.79) [67]. This may be due to the fact that the study area is located in the karst rocky desertification area, and the surface engineering water shortage is serious, resulting in low soil MBC and MBN content, coupled with phosphate mineralization and other factors, thus reducing the ratio of MBC:MBN. There were also significant differences in the MBC:MBP under the three different grassland-utilization modes (p < 0.05), with the highest being in MG and the lowest in EG, which may be related to soil water content and soil texture to a certain extent. MG is a relatively strong human disturbance due to the removal of all aboveground plants, as this will reduce the mineralization rate and content of P, only to meet the needs of microorganisms, thus leading to the decrease of MBC:MBP, a result which is consistent with the research results of degraded desert grassland [40]. The MBN:MBP can be used to evaluate the nutrient restriction of soil [68]. Gonzalez-Chavez et al. consider that soil is limited by P when MBN:MBP > 9.6 [69], and soil is limited by N when MBN:MBP < 8.9 [70]. In this study, the MBN:MBP in GG and MG were 13.11 and 10.86, respectively, indicating that P is limited. Meanwhile, the MBN:MBP in EG was only 5.14, indicating that its N is limited; moreover, the value is much higher than the average value of MBN:MBP in the desert grassland of China (0.20 ± 0.20) [67]. The research results also showed that there were some differences in the MBC:MBN, MBC:MBP and MBN:MBP of grassland under different utilization methods, and there were also differences in nutrient requirements for forage growth under different utilization patterns, which ultimately reflected the different microbial activity and material metabolism.

4.4. Plant–Soil–Microbial Stoichiometric Correlation Analysis

The chemical elements of plant–soil–microorganism circulate and flow with each other [25]. In this study, plant C and N were significantly correlated with soil C and N (p < 0.05), but plant P was significantly negatively correlated with soil P (p < 0.05), indicating that soil P supply has little influence or even a negative influence on plant P absorption. Meanwhile, MBP was significantly positively correlated with soil P (p < 0.05), indicating that the P of microbial biomass is more closely related to soil P, as is consistent with the results of Hu et al. [14]. The average content of soil P in the three treatments in this study was 0.88 g/kg, which is not significantly different from that in the previous studies [5,14,71], but the P content of plants (0.70 g/kg) was higher than that in previous studies [14], indicating that the absorption and utilization rate of soil P by forage in the study area is not too low, which may be related to forage species and planting years. Current studies have shown that the ratio of MBC:MBP can be used as an index to measure the potential of releasing P from soil organic matter by microbial mineralization or absorbing P from soil. The ratio of MBC:MBP is generally between 7 and 30. The smaller the ratio is, the greater the potential of microorganisms to release P in mineralized soil organic matter is, and MBP can supplement the soil available phosphorus pool [72]. The higher the ratio of MBC:MBP, the more it indicates that soil microorganisms have a tendency to assimilate soil available phosphorus, and it is easy for microorganisms to compete with crops to absorb soil available phosphorus, which has a strong phosphorus fixation potential [72]. Our results showed that the MBC:MBP in GG, MG and EG was 32.34, 42.09 and 14.39, respectively. In contrast to the those in EG, soil microorganisms have a tendency to assimilate soil available phosphorus in GG and MG, making it easy to compete with crops to absorb soil available phosphorus; CC and MG also have a strong phosphorus fixation potential. Meanwhile, the potential of releasing P from mineralized soil organic matter by soil microorganisms was higher in EG, and MBP could supplement the available P pool of the soil. The reason for this phenomenon may be related to utilization measures such as mowing and grazing, which also fully reflect the complexity of the “plant–soil–microbial” system in the nutrient cycle under different utilization methods. Therefore, we should further deepen the research on the transformation relationship among plants, soils and microbials in the future; enhance the ecosystem service function; and provide theoretical support for the artificial grassland in karst fragile ecological areas to cope with the pressure brought on by global climate change.

5. Conclusions

(1)
There were significant differences in C, N, P and the ecological stoichiometric characteristics of plants under different grassland utilization methods. Among the three treatments, the EG treatment had the highest plant C content, while the MG treatment had the lowest. The plant P of GG and MG was significantly higher than that of EG. The plant N content in GG was significantly higher than that in MG and EG. The ratio of plant N:P in the three treatments was higher than 20, and P deficiency and P limitation existed in the three treatments. The P limitation of EG was the most serious, and that of MG was the least.
(2)
There were some differences in soil nutrients and ecological stoichiometry among the three treatments. EG may be more beneficial to accumulate SOC and increase TP content. The C:N in EG was higher than that in GG and MG, and the decomposition rate of SOC in EG was slower, which was beneficial to the long-term maintenance of soil fertility. The C:P ratio of MG was the highest, and the net mineralization of P in MG was stronger than that of GG and EG. Soil N:P ratios under three different grassland-use patterns were all lower than 14, indicating that there was obvious N limitation.
(3)
There were some differences in soil microbial biomass under different grassland-utilization methods. The MBC of GG and MG was higher than that of EG, but the MBN of EG was between that of GG and MG, and the MBP of EG was the highest. The MBC:MBN under the three different grassland-utilization methods ranged from 2.48 to 3.88, which was lower than the global average range. The MBC:MBP also showed significant differences, with MG being the highest and EG the lowest. The MBN:MBP ratios of GG and MG were both higher than 9.6, indicating that they were P-limited, while the MBN:MBP of EG was lower than 8.9, indicating that it was N-limited.
(4)
Plant C and N were significantly correlated with soil C and N (p < 0.05). Plant P was significantly negatively correlated with soil P (p < 0.05), but MBP was significantly positively correlated with soil TP (p < 0.05). The results of MBC:MBP showed that soil microorganisms in GG and MG had a tendency to assimilate soil available phosphorus, and there was a tendency for microorganisms to compete with crops to absorb soil available phosphorus, which had a strong phosphorus fixation potential. Meanwhile, soil microorganisms in EG had a greater potential to release P from mineralized soil organic matter, and MBP could supplement soil available phosphorus pool.
In summary, this study described the element cycle and nutrient limitation from the perspective of the plant–soil–microorganism system, which can provide some basis for the fertilization management of artificial grassland in the karst rocky desertification area, such as necessary fertilization management or other measures to supplement elements according to the limitation of N and P, so as to solve the element limitation problem. However, due to the relationship between the experimental time, this study is still not systematic and perfect; the later period should be long-term observation to form systematic research results to provide the necessary theoretical support for the scientific management of grasslands in the ecological restoration area.

Author Contributions

Conceptualization, G.P. and S.S.; methodology, X.W. and Y.C.; software, X.W. and Y.C.; validation, Y.C., S.S. and G.P.; formal analysis, X.W. and Y.C.; investigation, G.P.; resources, Y.C.; data curation, X.W.; writing—original draft preparation, G.P.; writing—review and editing, S.S.; visualization, S.S.; supervision, Y.C. and G.P.; project administration, Y.C.; funding acquisition, Y.C. and G.P. All authors have read and agreed to the published version of the manuscript.

Funding

This research was funded by the Natural Science Research Project of Education Department of Guizhou Province (Qianjiaohe KY Zi (2022) 157), the Academic New Seedling Fund Project of Guizhou Normal University (Qianshi Xinmiao B15) and Special Research Project on Cadre Training for Rural Revitalization in Cooperation between East and West of Tongren City in 2022 (12004/0622051).

Data Availability Statement

Not applicable.

Acknowledgments

The authors thank the reviewers and editor for their insightful comments and constructive suggestions.

Conflicts of Interest

The authors declare no conflict of interest.

References

  1. Reich, P.B.; Walters, M.B.; Ellsworth, D.S. From tropics to tundra: Global convergence in plant functioning. Proc. Natl. Acad. Sci. USA 1997, 94, 13730–13734. [Google Scholar] [CrossRef] [PubMed]
  2. Reich, P.B.; Tjoelker, M.G.; Machado, J.L.; Oleksyn, J. Universal scaling of respiratory metabolism, size and nitrogen in plants. Nature 2006, 439, 457–461. [Google Scholar] [CrossRef] [PubMed]
  3. Wang, C.; Hou, Y.; Zheng, R.L.; Hu, Y.X.; Li, X.N. Plant diversity and nitrogen addition affect the architecture of plant–soil–microbe stoichiometric networks. Plant Soil 2023. [Google Scholar] [CrossRef]
  4. Han, W.X.; Fang, J.Y.; Reich, P.B.; Ian Woodward, F.; Wang, Z.H. Biogeography and variability of eleven mineral elements in plant leaves across gradients of climate, soil and plant functional type in China. Ecol. Lett. 2011, 14, 788–796. [Google Scholar] [CrossRef]
  5. Song, S.Z.; Wang, X.L.; He, C.; Chi, Y.K. Effects of utilization methods on C, N, P rate and enzyme activity of artificial grassland in karst desertification area. Agronomy 2023, 13, 1368. [Google Scholar] [CrossRef]
  6. Sun, B.; Barnes, A.D. Editorial: Soil-root-microbe interactions promote soil and plant health. Front. Microbiol. 2023, 14, 1155234. [Google Scholar] [CrossRef]
  7. Chen, Z.J.; Li, Y.; Hu, M.; Xiong, Y.W.; Huang, Q.Z.; Jin, S.; Huang, G.H. Lignite bioorganic fertilizer enhanced microbial co-occurrence network stability and plant–microbe interactions in saline-sodic soil. Sci. Total Environ. 2023, 879, 163113. [Google Scholar] [CrossRef]
  8. Elser, J.J.; Fagan, W.F.; Kerkhof, A.J.; Swenson, N.G.; Enquist, B.J. Biological stoichiometry of plant production: Metabolism, scaling and ecological response to global change. New Phytol. 2010, 186, 593–608. [Google Scholar] [CrossRef] [Green Version]
  9. Zhang, C.P.; Li, Q.; Feng, R.Q.; Zhang, Z.H.; Yang, Y.F.; Liu, J. C:N:P stoichiometry of plant-soil-microbe in the secondary succession of zokor-made mounds on Qinghai-Tibet Plateau. Environ. Res. 2023, 222, 115333. [Google Scholar] [CrossRef]
  10. Isles, P.D.F. The misuse of ratios in ecological stoichiometry. Ecology 2020, 101, e03153. [Google Scholar] [CrossRef]
  11. Oldroyd, G.E.D.; Leyser, O.A. Plant’s diet, surviving in a variable nutrient environment. Science 2020, 368, eaba0196. [Google Scholar] [CrossRef] [PubMed]
  12. Wang, Y.; Ren, Z.; Ma, P.; Wang, Z.; Elser, J.J. Effects of grassland degradation on ecological stoichiometry of soil ecosystems on the Qinghai-Tibet Plateau. Sci. Total Environ. 2020, 722, 137910. [Google Scholar] [CrossRef] [PubMed]
  13. Cleveland, C.C.; Liptzin, D. C:N:P stoichiometry in soil: Is there a “Redfield ratio” for the microbial biomass? Biogeochemistry 2007, 85, 235–252. [Google Scholar] [CrossRef]
  14. Hu, P.L.; Wang, K.L.; Zeng, Z.X.; Zhang, H.; Li, S.S.; Song, X.J. Ecological stoichiometric characteristics of plants, soil, and microbes of Pennisetum purpureum cv. Guimu-1 pastures at different rehabilitation ages in a karst rocky desertification region. Acta Ecol. Sin. 2017, 37, 896–905. [Google Scholar]
  15. Garousi, F.; Shan, Z.J.; Ni, K.; Yang, H.; Shan, J.; Cao, J.H.; Jiang, Z.C.; Yang, J.L.; Zhu, T.B.; Müller, C. Decreased inorganic N supply capacity and turnover in calcareous soil under degraded rubber plantation in the tropical karst region. Geoderma 2021, 381, 114754. [Google Scholar] [CrossRef]
  16. Xiong, K.N.; Chi, Y.K.; Shen, X.Y. Research on photosynthetic leguminous forage in the karst rocky desertification regions of Southwestern China. Pol. J. Environ. Stud. 2017, 26, 2319–2329. [Google Scholar] [CrossRef]
  17. Wang, K.L.; Yue, Y.M.; Chen, H.S.; Zeng, F.P. Mechanisms and realization pathways for integration of scientifific poverty alleviation and ecosystem services enhancement. Bull. Chin. Acad. Sci. 2020, 35, 1264–1272. [Google Scholar]
  18. Pei, G.T.; Sun, J.F.; He, T.X.; Hu, B.Q. Effects of long-term human disturbances on soil microbial diversity and community structure in a karst grassland ecosystem of northwestern Guangxi, China. Chin. J. Plant Ecol. 2021, 45, 74–84. [Google Scholar] [CrossRef]
  19. Liu, M.; Bai, X.Y.; Tan, Q.; Luo, G.J.; Zhao, C.W.; Wu, L.H.; Hu, Z.Y.; Ran, C.; Deng, Y.H. Monitoring impacts of ecological engineering on ecosystem services with geospatial techniques in karst areas of SW China. Geocarto. Int. 2022, 7, 5091–5115. [Google Scholar] [CrossRef]
  20. Lu, M.; Liu, K.; Zhang, L.; Zeng, F.; Song, T.; Peng, W.; Du, H. Stoichiometric variation in soil carbon, nitrogen, and phosphorus following cropland conversion to forest in Southwest China. Forests 2022, 13, 1155. [Google Scholar] [CrossRef]
  21. Wen, L.; Li, D.; Xiao, X.; Tang, H.M. Alterations in soil microbial phospholipid fatty acid profile with soil depth following cropland conversion in karst region, southwest China. Environ. Sci. Pollut. Res. 2023, 30, 1502–1519. [Google Scholar] [CrossRef] [PubMed]
  22. Song, M.; Peng, W.X.; Du, H.; Xu, Q.G. Responses of soil and microbial C:N:P stoichiometry to vegetation succession in a karst region of Southwest China. Forests 2019, 10, 755. [Google Scholar] [CrossRef] [Green Version]
  23. Chen, H.J.; Peng, W.X.; Du, H.; Song, T.Q.; Zeng, F.P.; Wang, F. Effect of different grain for green approaches on soil bacterial community in a karst region. Front. Microbiol. 2020, 11, 577242. [Google Scholar] [PubMed]
  24. Xiao, S.Z.; He, J.H.; Zeng, C.; Wang, J.L. Soil chemical properties under various land-use types in the karst area with a case study in Shibing County of China. J. Chem. 2021, 2021, 5523060. [Google Scholar] [CrossRef]
  25. Lin, X.G. Principles and Methods of Soil Microbiology Research; Higher Education Press: Beijing, China, 2010. [Google Scholar]
  26. Bradshaw, C.; Kautsky, U.; Kumblad, L. Ecological stoichiometry and multi-element transfer in a coastal ecosystem. Ecosystems 2012, 15, 591–603. [Google Scholar] [CrossRef] [Green Version]
  27. Chen, X.; Chen, H.Y.H.; Chang, S.X. Meta-analysis shows that plant mixtures increase soil phosphorus availability and plant productivity in diverse ecosystems. Nat. Ecol. Evol. 2022, 6, 1112–1121. [Google Scholar] [CrossRef]
  28. Kohmann, M.M.; Silveira, M.L.; da Silva Cardoso, A.; Bracho, R. Short-term impacts of prescribed fire on C, N, and P dynamics in a subtropical rangeland. Plant Soil 2023. [Google Scholar] [CrossRef]
  29. Dai, M.; Wang, T.; Wang, Y.; Xu, J. Effects of warming and phosphorus enrichment on the C:N:P stoichiometry of Potamogeton crispus organs. Front. Plant Sci. 2022, 13, 814255. [Google Scholar] [CrossRef]
  30. Taggart, C.B.; Muir, J.P.; Brady, J.A.; Kan, E.; Mitchell, A.B.; Obayomi, O. Impacts of biochar on Trifolium incarnatum and Lolium multiflorum: Soil nutrient retention and loss in sandy loam amended with dairy manure. Agronomy 2023, 13, 26. [Google Scholar] [CrossRef]
  31. Xu, H.; Qu, Q.; Wang, Z.; Xue, S.; Xu, Z. Plant-soil-enzyme C-N-P stoichiometry and microbial nutrient limitation responses to plant-soil feedbacks during community succession: A 3-year pot experiment in China. Front. Plant Sci. 2022, 13, 1009886. [Google Scholar] [CrossRef]
  32. Wang, J.; He, K.; Bao, G.; He, L.; Xu, H.; Song, M.; Jin, L.; Wei, X. Effects of increased phosphorus fertilizer on C, N, and P stoichiometry in different organs of bluegrass (Poa L.) at different growth stages. Front. Ecol. Evol. 2023, 11, 1092840. [Google Scholar] [CrossRef]
  33. Xie, L.L.; Wang, X.L.; Ma, Y.; MA, Y.S.; Wang, Y.L.; Zhou, X.B. Effect of the no-grazing practice in regreening period on the quality and stoichiometric ratio of C, N, P of plant community in alpine meadow. Acta Agrestia Sin. 2023, 31, 1454–1460. [Google Scholar]
  34. Wang, M.; Zhang, Y.; Li, R.Q.; Xin, X.P.; Zhu, X.Y.; Cao, J.; Zhou, Z.Y.; Yan, R.R. Effects of Grazing Disturbance on the Stoichiometry of Nitrogen and Phosphorus in Plant Organs of Leymus chinensis Meadow Steppe. Sci. Agric. Sin. 2022, 55, 1371–1384. [Google Scholar]
  35. Tessier, J.T.; Raynal, D.J. Use of nitrogen to phosphorus ratios in plant tissue as an indicator of nutrient limitation and nitrogen saturation. J. Appl. Ecol. 2003, 40, 523–534. [Google Scholar] [CrossRef]
  36. Güsewell, S. N:P ratios in terrestrial plants: Variation and functional significance. New Phytol 2004, 164, 243–266. [Google Scholar] [CrossRef]
  37. He, J.S.; Wang, L.; Flynn, D.F.B.; Wang, X.P.; Ma, W.H.; Fang, J.Y. Leaf nitrogen:phosphorus stoichiometry across Chinese grassland biomes. Oecologia 2008, 155, 301–310. [Google Scholar] [CrossRef] [PubMed]
  38. Song, S.Z. Study on Coupling of Degraded Grassland Improvement and Semi-House Feeding Cattle and Sheep in the Karst Rocky Desertification Area. Master’s Thesis, Guizhou Normal University, Guiyang, China, 2019. [Google Scholar]
  39. Peco, B.; Navarro, E.; Carmona, C.P.; Medina, N.G.; Marques, M.J. Effects of grazing abandonment on soil multifunctionality: The role of plant functional traits. Agr. Ecosyst. Environ. 2017, 249, 215–225. [Google Scholar] [CrossRef]
  40. Li, S.Y.; Cui, Y.X.; Sun, Z.J.; Liu, H.X.; Ye, H.W. Effect of grazing exclusion on soil organic carbon and stoichiometry characteristics of soil microbial biomass in sagebrush desert. Acta Pratacul. Sin. 2023, 32, 58–70. [Google Scholar]
  41. Hali, A.; Sun, Z.J.; He, P.X.; Liu, H.X. Effects of grazing exclusion on soil nitrogen content and its component characteristics in sagebrush desert grassland. J. Soil Wat. Conserv. 2022, 36, 222–230. [Google Scholar]
  42. Li, W.; Su, T.; Shen, Y.; Ma, H.; Zhou, Y.; Lu, Q.; Wang, G.; Liu, Z.; Li, J. Effects of warming seasonal rotational grazing on plant communities’ structure and diversity in desert steppe. Ecol. Evol. 2023, 13, e9748. [Google Scholar] [CrossRef]
  43. Chi, Y.K.; Song, S.Z.; Zhao, D.G.; Wu, J.H. Effects of fertilization on plant-soil ecological stoichiometric characteristics of degraded artificial grassland in karst area. Fresen. Environ. Bull. 2022, 31, 10190–10198. [Google Scholar]
  44. Fan, D.D.; Liu, Y.J.; Cao, H.L.; Chen, H.; Kong, W.D.; Li, X.Z. On the effect of fencing on physicochemical property and microbial community of grassland soils. Sci. Technol. Rev. 2022, 40, 41–51. [Google Scholar]
  45. Lu, X.; Yan, Y.; Sun, J.; Zhang, X.; Chen, Y.; Wang, X.; Cheng, G. Short-term grazing exclusion has no impact on soil properties and nutrients of degraded alpine grassland in Tibet, China. Solid Earth 2015, 6, 1195–1205. [Google Scholar] [CrossRef] [Green Version]
  46. Wu, G.L.; Du, G.Z.; Liu, Z.H.; Thirgood, S. Effect of fencing and grazing on a Kobresia-dominated meadow in the QinghaiTibetan Plateau. Plant Soil 2009, 319, 115–126. [Google Scholar] [CrossRef]
  47. Ahmad, E.H.; Demisie, W.; Zhang, M. Effects of land use on concentrations and chemical forms of phosphorus in different-size aggregates. Eurasian Soil Sci. 2017, 50, 1435–1443. [Google Scholar] [CrossRef]
  48. Wang, S.Q.; Yu, G.R. Ecological stoichiometry characteristics of ecosystem carbon, nitrogen and phosphorus elements. Acta Ecol. Sin. 2008, 28, 3937–3947. [Google Scholar]
  49. Shu, M.; Jiang, T.; Wang, D.L.; Lian, Z.; Tang, J.X.; Kong, T.; Xu, Y.Y.; Han, X.M. Soil ecological stoichiometry under the planted of Pinus sylvestris var. mongolica forests with different stand ages in the Horqin Sandy Land. Arid Zone Res. 2018, 35, 789–795. [Google Scholar]
  50. Tian, H.Q.; Chen, G.S.; Zhang, C.; Melillo, J.M.; Hall, C.A.S. Pattern and variation of C:N:P rations in China’s soils: Synthesis of observational data. Biogeochemistry 2010, 98, 139–151. [Google Scholar] [CrossRef]
  51. Jia, Y.; Xu, B.C.; Li, F.M.; Wang, X.L. Availability and contributions of soil phosphorus to forage production of seeded alfalfa in semiarid Loess Plateau. Acta Ecol. Sin. 2007, 27, 42–47. [Google Scholar]
  52. Zhu, Q.L.; Xing, X.Y.; Zhang, H.; An, S.S. Soil ecological stoichiometry under different vegetation area on loess hilly gully region. Acta Ecol. Sin. 2013, 33, 4674–4682. [Google Scholar]
  53. He, J.; Wei, Q.Q.; Zhong, Y.X.; Luo, L.L. Eco-stoichiometry characteristics of grape fields with different planting years in the east foothills of Helan Mountain. Agric. Res. Arid Areas 2020, 38, 23–30. [Google Scholar]
  54. Zhao, D.; Li, F.; Yang, Q.; Wang, R.; Song, Y.; Tao, Y. The influence of different types of urban land use on soil microbial biomass and functional diversity in Beijing, China. Soil Use Manag. 2013, 29, 230–239. [Google Scholar] [CrossRef]
  55. Wu, L.F.; Wang, Z.Q.; Wang, Y.; Liu, Y.G.; Yang, B.; Zhang, Y.F. Relationship between soil C, N, P stoichiometric characteristics and enzyme activity in karst plateau soils with different degree of rocky desertification. Ecol. Environ. Sci. 2019, 28, 2332–2340. [Google Scholar]
  56. Yang, X.W.; Liu, J.; Hou, M.Y.; Cheng, X.M.; Huang, X.X. Enzyme activities and stoichiometric characteristics of rhizometric and non-rhizosphere soil in different ancient tea gardens in Fengqing County. Chin. J. Appl. Eco. 2023, 29, 1368. [Google Scholar]
  57. Tian, J.; Sheng, M.Y.; Wang, P.; Wen, P.C. Influence of land use change on litter and soil C, N, P stoichiometric characteristics and soil enzyme activity in karst ecosystem, Southwest China. Environ. Sci. 2019, 40, 4278–4286. [Google Scholar]
  58. Liu, L.B.; Zhong, Q.L.; Ni, J. Ecosystem C:N:P stoichiometry and storages of a secondary plateau-surface karst forest in Guizhou Province, southwestern China. Acta Ecol. Sin. 2019, 39, 8606–8614. [Google Scholar]
  59. Wan, F.; Meng, Z.J.; Dang, X.H.; Wang, R.D.; Zhang, H.M. C, N and P ecological stoichiometry characteristics of a Stipa species plant–soil system subject to grazing exclusion in a desert steppe. Acta Pratacul. Sin. 2020, 29, 49–55. [Google Scholar]
  60. Zhang, J.H.; Li, M.X.; Xu, L.; Zhu, J.X.; Dai, G.H.; He, N.P. C:N:P stoichiometry in terrestrial ecosystems in China. Sci. Total Environ. 2021, 795, 148849. [Google Scholar] [CrossRef]
  61. Arunachalam, A.; Pandey, H.N. Ecosystem restoration of jhum fallows in northeast india: Microbial C and N along altitudinal and successional gradients. Restor. Ecol. 2003, 11, 168–173. [Google Scholar] [CrossRef]
  62. Manzoni, S.; Trofymow, J.A.; Jackson, R.B.; Porporato, A. Stoichiometric controls on carbon, nitrogen, and phosphorus dynamics in decomposing litter. Ecol. Monogr. 2010, 80, 89–106. [Google Scholar] [CrossRef] [Green Version]
  63. Mooshammer, M.; Wanek, W.; Zechmeister-Boltenstern, S.; Richter, A. Stoichiometric imbalances between terrestrial decomposer communities and their resources: Mechanisms and implications of microbial adaptations to their resources. Front. Microbiol. 2014, 5, 22. [Google Scholar] [CrossRef] [Green Version]
  64. Heuch, C.; Weig, A.; Spohn, M. Soil microbial biomass C:N:P stoichiometry and microbial use of organic phosphorus. Soil Biol. Biochem. 2015, 85, 119–129. [Google Scholar] [CrossRef]
  65. Li, J.W.; Liu, Y.L.; Hai, X.Y.; Shangguan, Z.P.; Deng, L. Dynamics of soil microbial C:N:P stoichiometry and its driving mechanisms following natural vegetation restoration after farmland abandonment. Sci. Total. Environ. 2019, 693, 133613. [Google Scholar] [CrossRef] [PubMed]
  66. Tischer, A.; Potthast, K.; Hamer, U. Land-use and soil depth affect resource and microbial stoichiometry in a tropical mountain rainforest region of southern Ecuador. Oecologia 2014, 175, 375–393. [Google Scholar] [CrossRef] [PubMed]
  67. Pan, Y.; Fang, F.; Tang, H. Patterns and internal stability of carbon, nitrogen, and phosphorus in soils and soil microbial biomass in terrestrial ecosystems in China: A Data Synthesis. Forests 2021, 12, 1544. [Google Scholar] [CrossRef]
  68. Hartman, W.H.; Richardson, C.J. Differential nutrient limitation of soil microbial biomass and metabolic quotients(qCO2): Is there a biological stoichiometry of soil microbes. PLoS ONE 2013, 8, 57127. [Google Scholar] [CrossRef]
  69. González-Chávez, M.C.A.; Aitkenhead-Peterson, J.A.; Gentry, T.J.; Zuberer, D.; Hons, F.; Loeppert, R. Soil microbial community, C, N, and P responses to long-term tillage and crop rotation. Soil Till. Res. 2016, 106, 285–293. [Google Scholar] [CrossRef]
  70. Wang, B.R.; Yang, J.J.; An, S.S.; Zhang, H.X.; Bai, X.J. Effects of vegetation and topography features on ecological stoichiometry of soil and soil microbial biomass in the hilly-gully region of the Loess Plateau, China. Chin. J. Appl. Ecol. 2018, 29, 247–259. [Google Scholar]
  71. Yu, Y.F.; Peng, W.X.; Song, T.Q.; Zeng, F.P.; Wang, K.L.; Wen, L.; Fan, F.J. Stoichiometric characteristics of plant and soil C, N and P in different forest types in depressions between karst hills, southwest China. Chin. J. Appl. Ecol. 2014, 25, 947–954. [Google Scholar]
  72. Peng, P.Q.; Zhang, W.J.; Tong, C.L.; Qiu, S.J.; Zhang, W.C. Soil C, N and P contents and their relationships with soil physical properties in wetlands of Dongting Lake floodplain. Chin. J. Appl. Ecol. 2005, 16, 1872–1878. [Google Scholar]
Figure 1. Correlation analysis of plant–soil–microorganism in grassland under different utilization methods.
Agronomy 13 01841 g001
Table 1. C, N and P contents and stoichiometric ratios of grassland plants under different utilization methods.
Utilization MethodsC/(g/kg)N/(g/kg)P/(g/kg)C:NC:PN:P
Grazing grassland429.56 ± 9.92 b21.47 ± 0.16 a0.81 ± 0.08 a20.01 ± 0.61 c531.74 ± 42.68 b26.61 ± 2.62 b
Mowing grassland406.70 ± 5.25 c18.54 ± 0.13 bc0.87 ± 0.10 a21.93 ± 0.22 b474.63 ± 61.02 bc21.63 ± 2.67 bc
Enclosed grassland472.45 ± 12.90 a19.79 ± 0.03 b0.42 ± 0.02 b23.88 ± 0.68 a1133.09 ± 40.40 a47.49 ± 2.38 a
Mean value (mean ± standard error, n = 3). Different lowercase letters indicate the difference between treatments reaching a significant level (p < 0.05).
Table 2. C, N and P contents and stoichiometric ratios of grassland soil under different utilization methods.
Utilization MethodsC/(g/kg)N/(g/kg)P/(g/kg)C:NC:PN:P
Grazing grassland19.48 ± 1.12 ab2.19 ± 0.09 a0.85 ± 0.05 b8.91 ± 0.97 c22.78 ± 0.83 b2.58 ± 0.36 b
Mowing grassland17.37 ± 0.42 b1.74 ± 0.10 bc0.53 ± 0.01 c10.04 ± 0.67 b32.88 ± 0.79 a3.29 ± 0.27 a
Enclosed grassland22.45 ± 1.39 a1.83 ± 0.09 b1.26 ± 0.020 a12.31 ± 1.91 a17.91 ± 2.07 c1.46 ± 0.08 c
Mean value (mean ± standard error, n = 3). Different lowercase letters indicate the difference between treatments reaching a significant level (p < 0.05).
Table 3. C, N and P contents and stoichiometric ratios of soil microorganisms in grassland under different utilization methods.
Utilization MethodsMBC (mg/kg)MBN (mg/kg)MBP (mg/kg)MBC:MBNMBC:MBPMBN:MBP
Grazing grassland350.24 ± 37.56 a142.46 ± 10.45 a10.95 ± 37.56 b2.48 ± 0.41 bc32.34 ± 5.93 b13.11 ± 1.81 a
Mowing grassland315.61 ± 31.44 ab81.53 ± 7.23 c7.50 ± 0.20 c3.88 ± 0.32 a42.09 ± 3.98 a10.86 ± 0.71 a
Enclosed grassland270.89 ± 11.44 b96.93 ± 10.14 b18.82 ± 0.65 a2.81 ± 0.19 b14.39 ± 0.20 c5.14 ± 0.37 b
Mean value (mean ± standard error, n = 3). Different lowercase letters indicate the difference between treatments reaching a significant level (p < 0.05).
Disclaimer/Publisher’s Note: The statements, opinions and data contained in all publications are solely those of the individual author(s) and contributor(s) and not of MDPI and/or the editor(s). MDPI and/or the editor(s) disclaim responsibility for any injury to people or property resulting from any ideas, methods, instructions or products referred to in the content.

