
Does Precision Technologies Adoption Contribute to the Economic and Agri-Environmental Sustainability of Mediterranean Wheat Production? An Italian Case Study

 ,
,  ,
,  , , and
Abstract
:1. Introduction
- How does the durum wheat profitability evolve if a farm adopts or does not adopt precision agriculture technologies?
- Could the application of precision agriculture technologies improve and make more efficient the nitrogen use within the context under investigation?
2. Materials and Methods
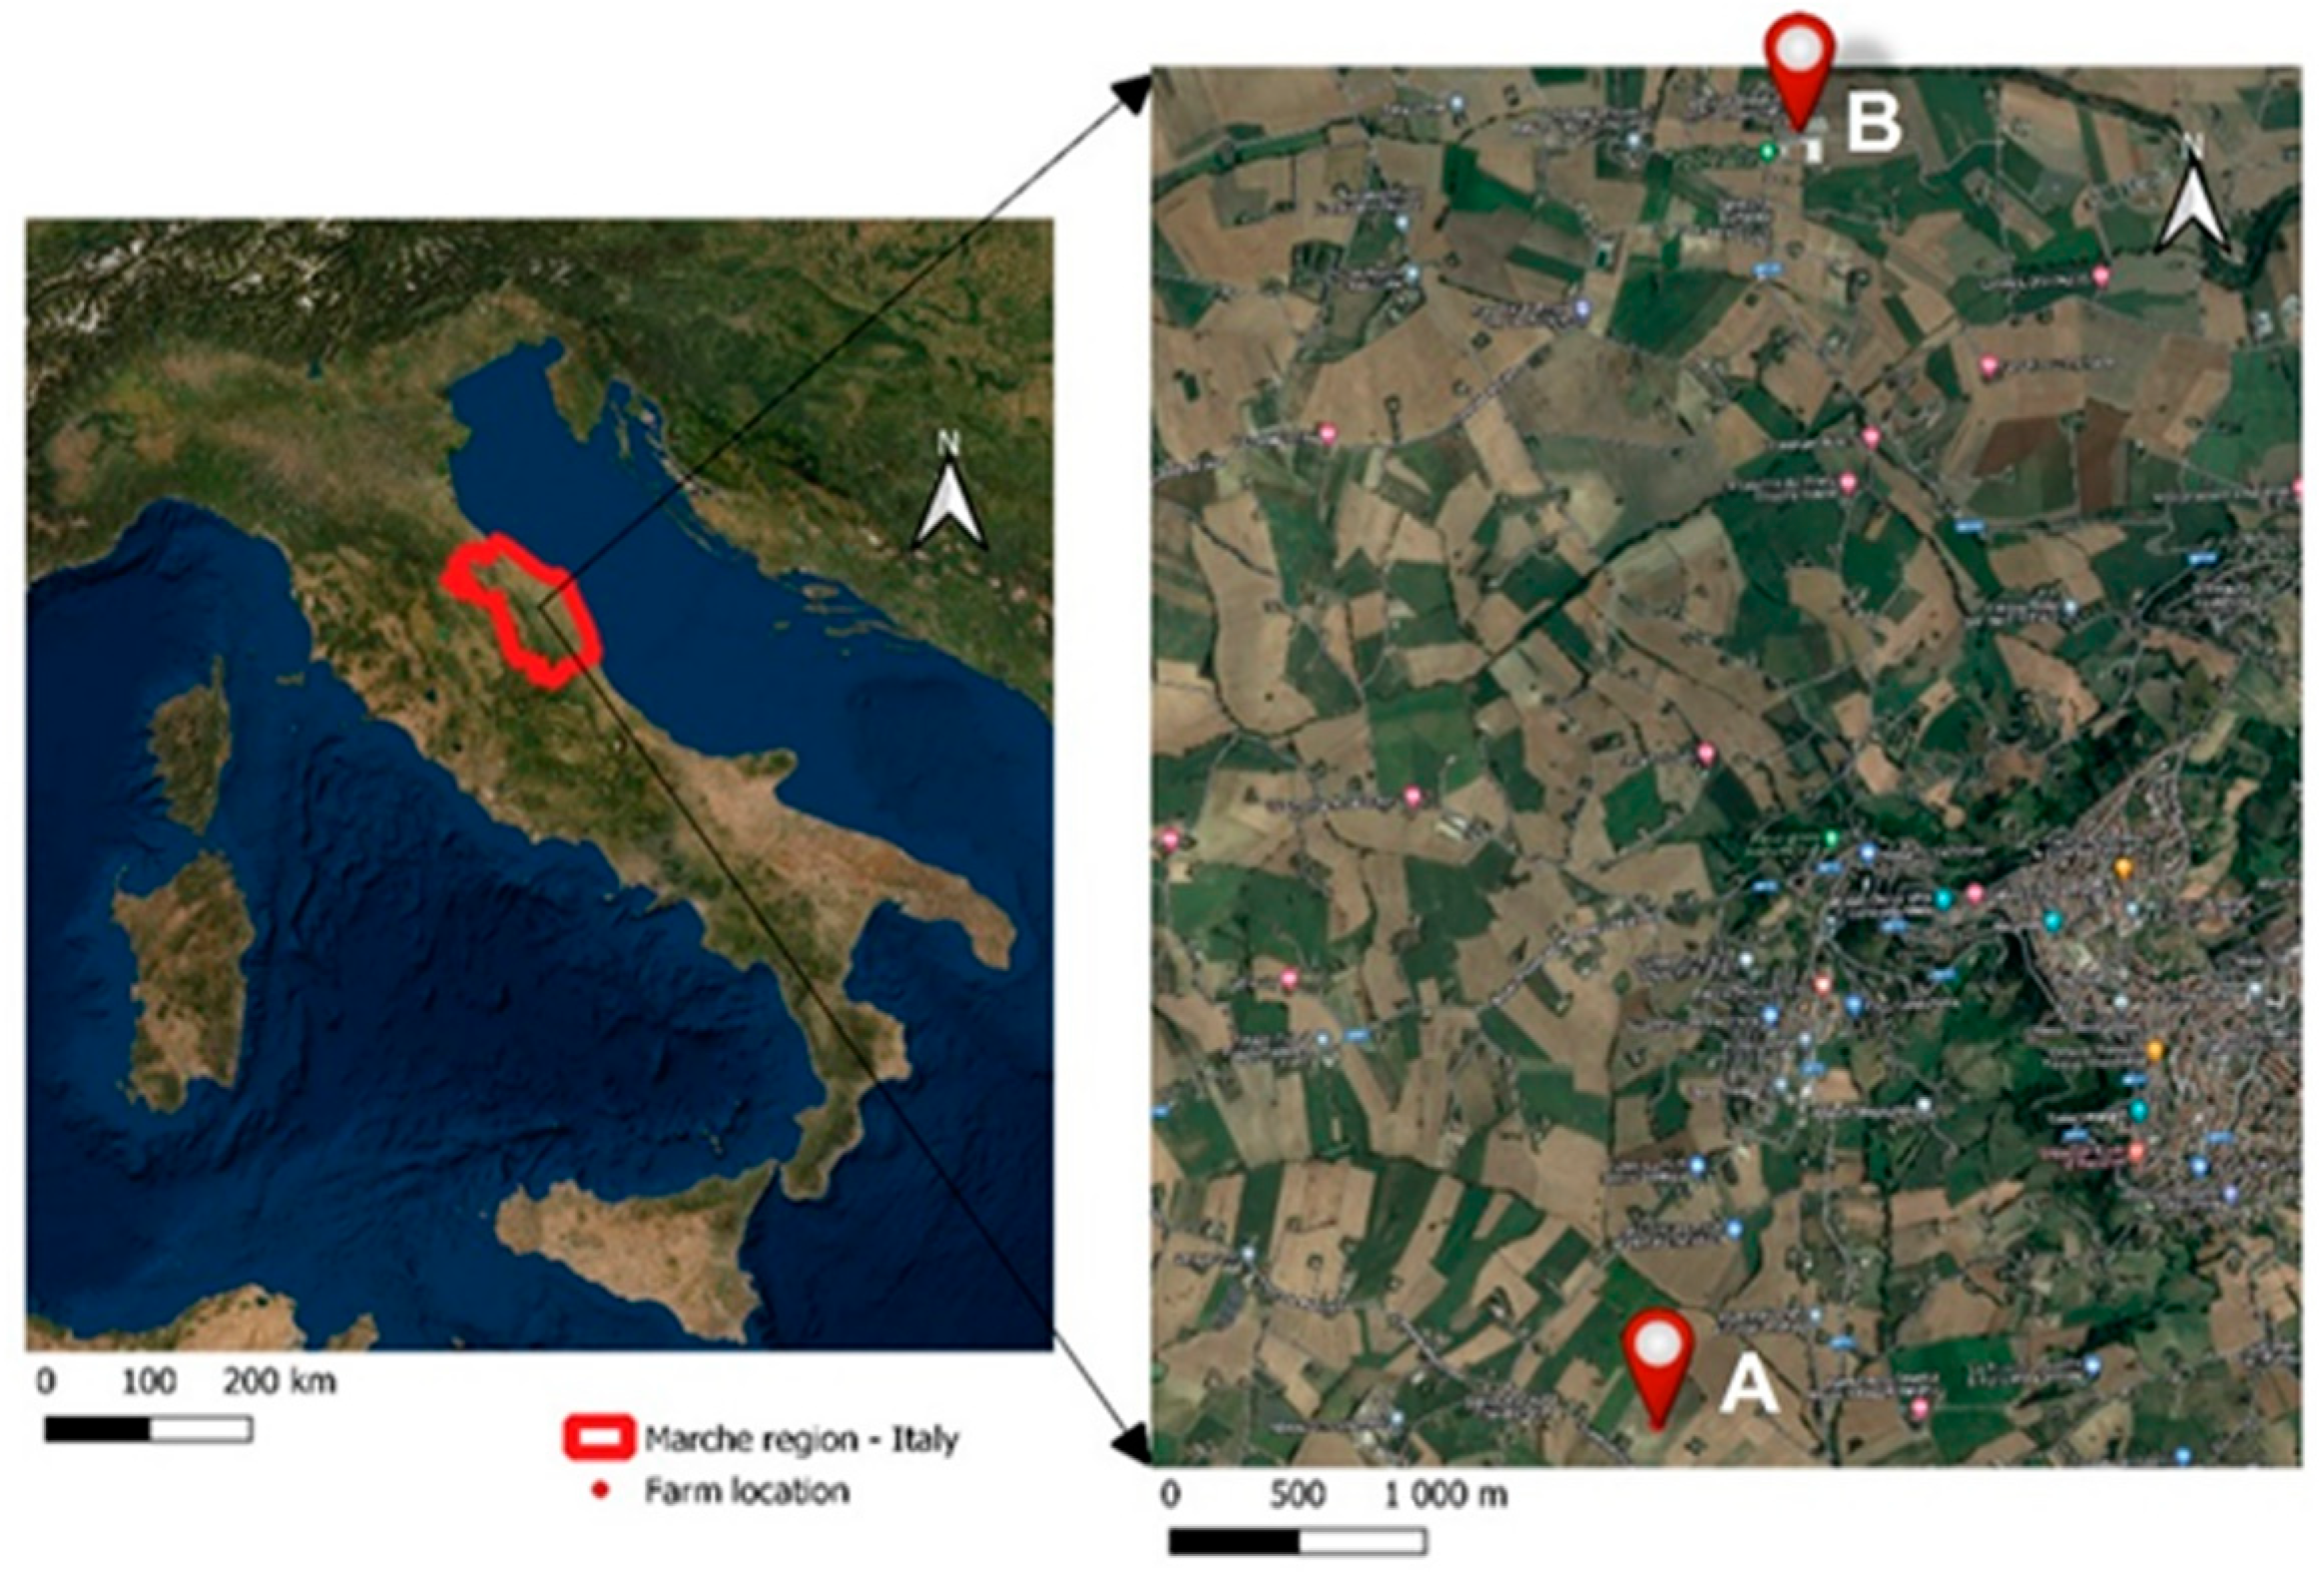
2.1. Study Area and Data Set
- Guidance systems (driver assistance, machine guidance, controlled traffic farming)
- Recording technologies (soil mapping, soil moisture mapping, canopy mapping, yield mapping)
- Reacting technologies (variable-rate irrigation and weeding and variable rate application of seeds, fertilizers, and pesticides).
- To ensure a correct management of nitrogenous inputs on durum wheat through precision agriculture technologies in order to reduce the environmental impact of cereal cropping systems
- To evaluate the economic, environmental, and social sustainability of investments in these technologies.
- The presence of a strong and real willingness to adopt the PA technologies investigated in this study
- The presence of a comparable size of the Utilized Agricultural Area (UAA) devoted to cereal farming and of a minimum total farm size of 100 ha to be defined as a large farm according to FADN statistical standards
- Farm B is a more efficient farm than the average in terms of productivity and profitability even without the implementation of PA technologies. In this regard, as it can be seen from the data (Table 2) that farm B is capable of levels of profitability almost in line to the median operating profit per hectare (calculated net of European CAP supporting payments applied to the durum wheat production) obtained by farms larger than 100 ha and specialized in cereal farming in central Italy. Furthermore, farm A and farm B are both located in the top 25%—in terms of operating profit per hectare from durum wheat farming—cereal farms in central Italy.
- Productivity: For both periods considered (2014–2018 and 2019–2022), the two case studies are both considerably more productive than the median value of productivity referred to in the sample of farms (greater than 40 ha) producing durum wheat in central Italy. Nevertheless, in the period 2019–2022, that is, the period after the acquisition of the PA technology by farm A, both farms A and B slightly lost productivity compared to their levels in the previous period.
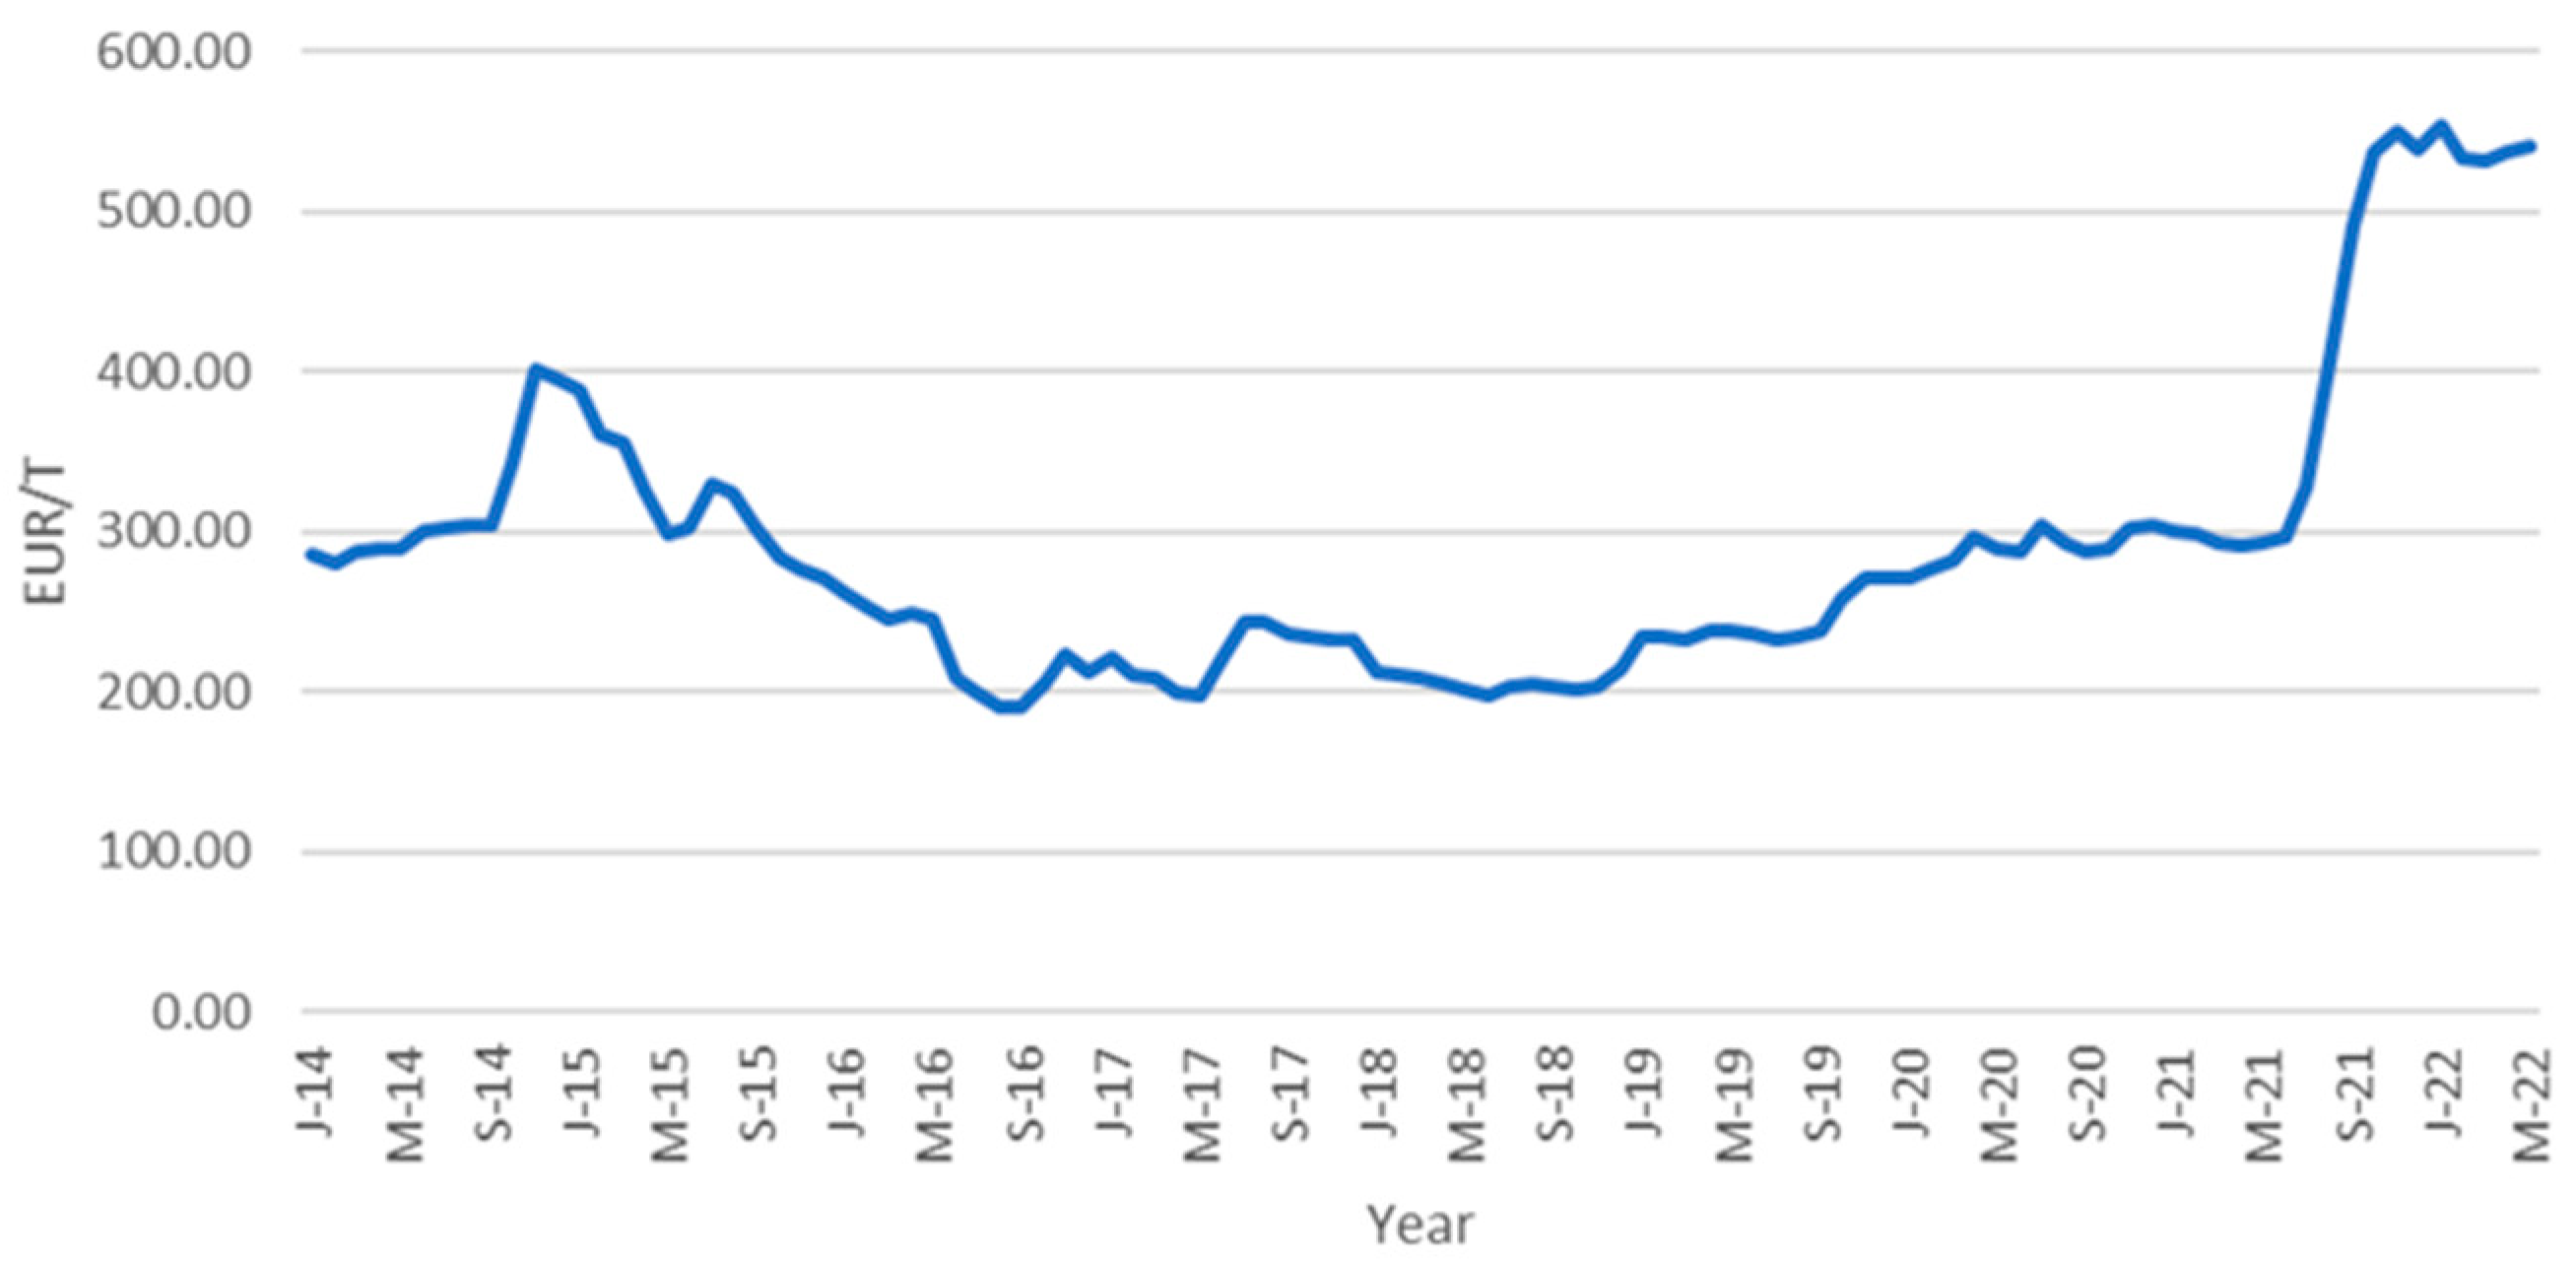
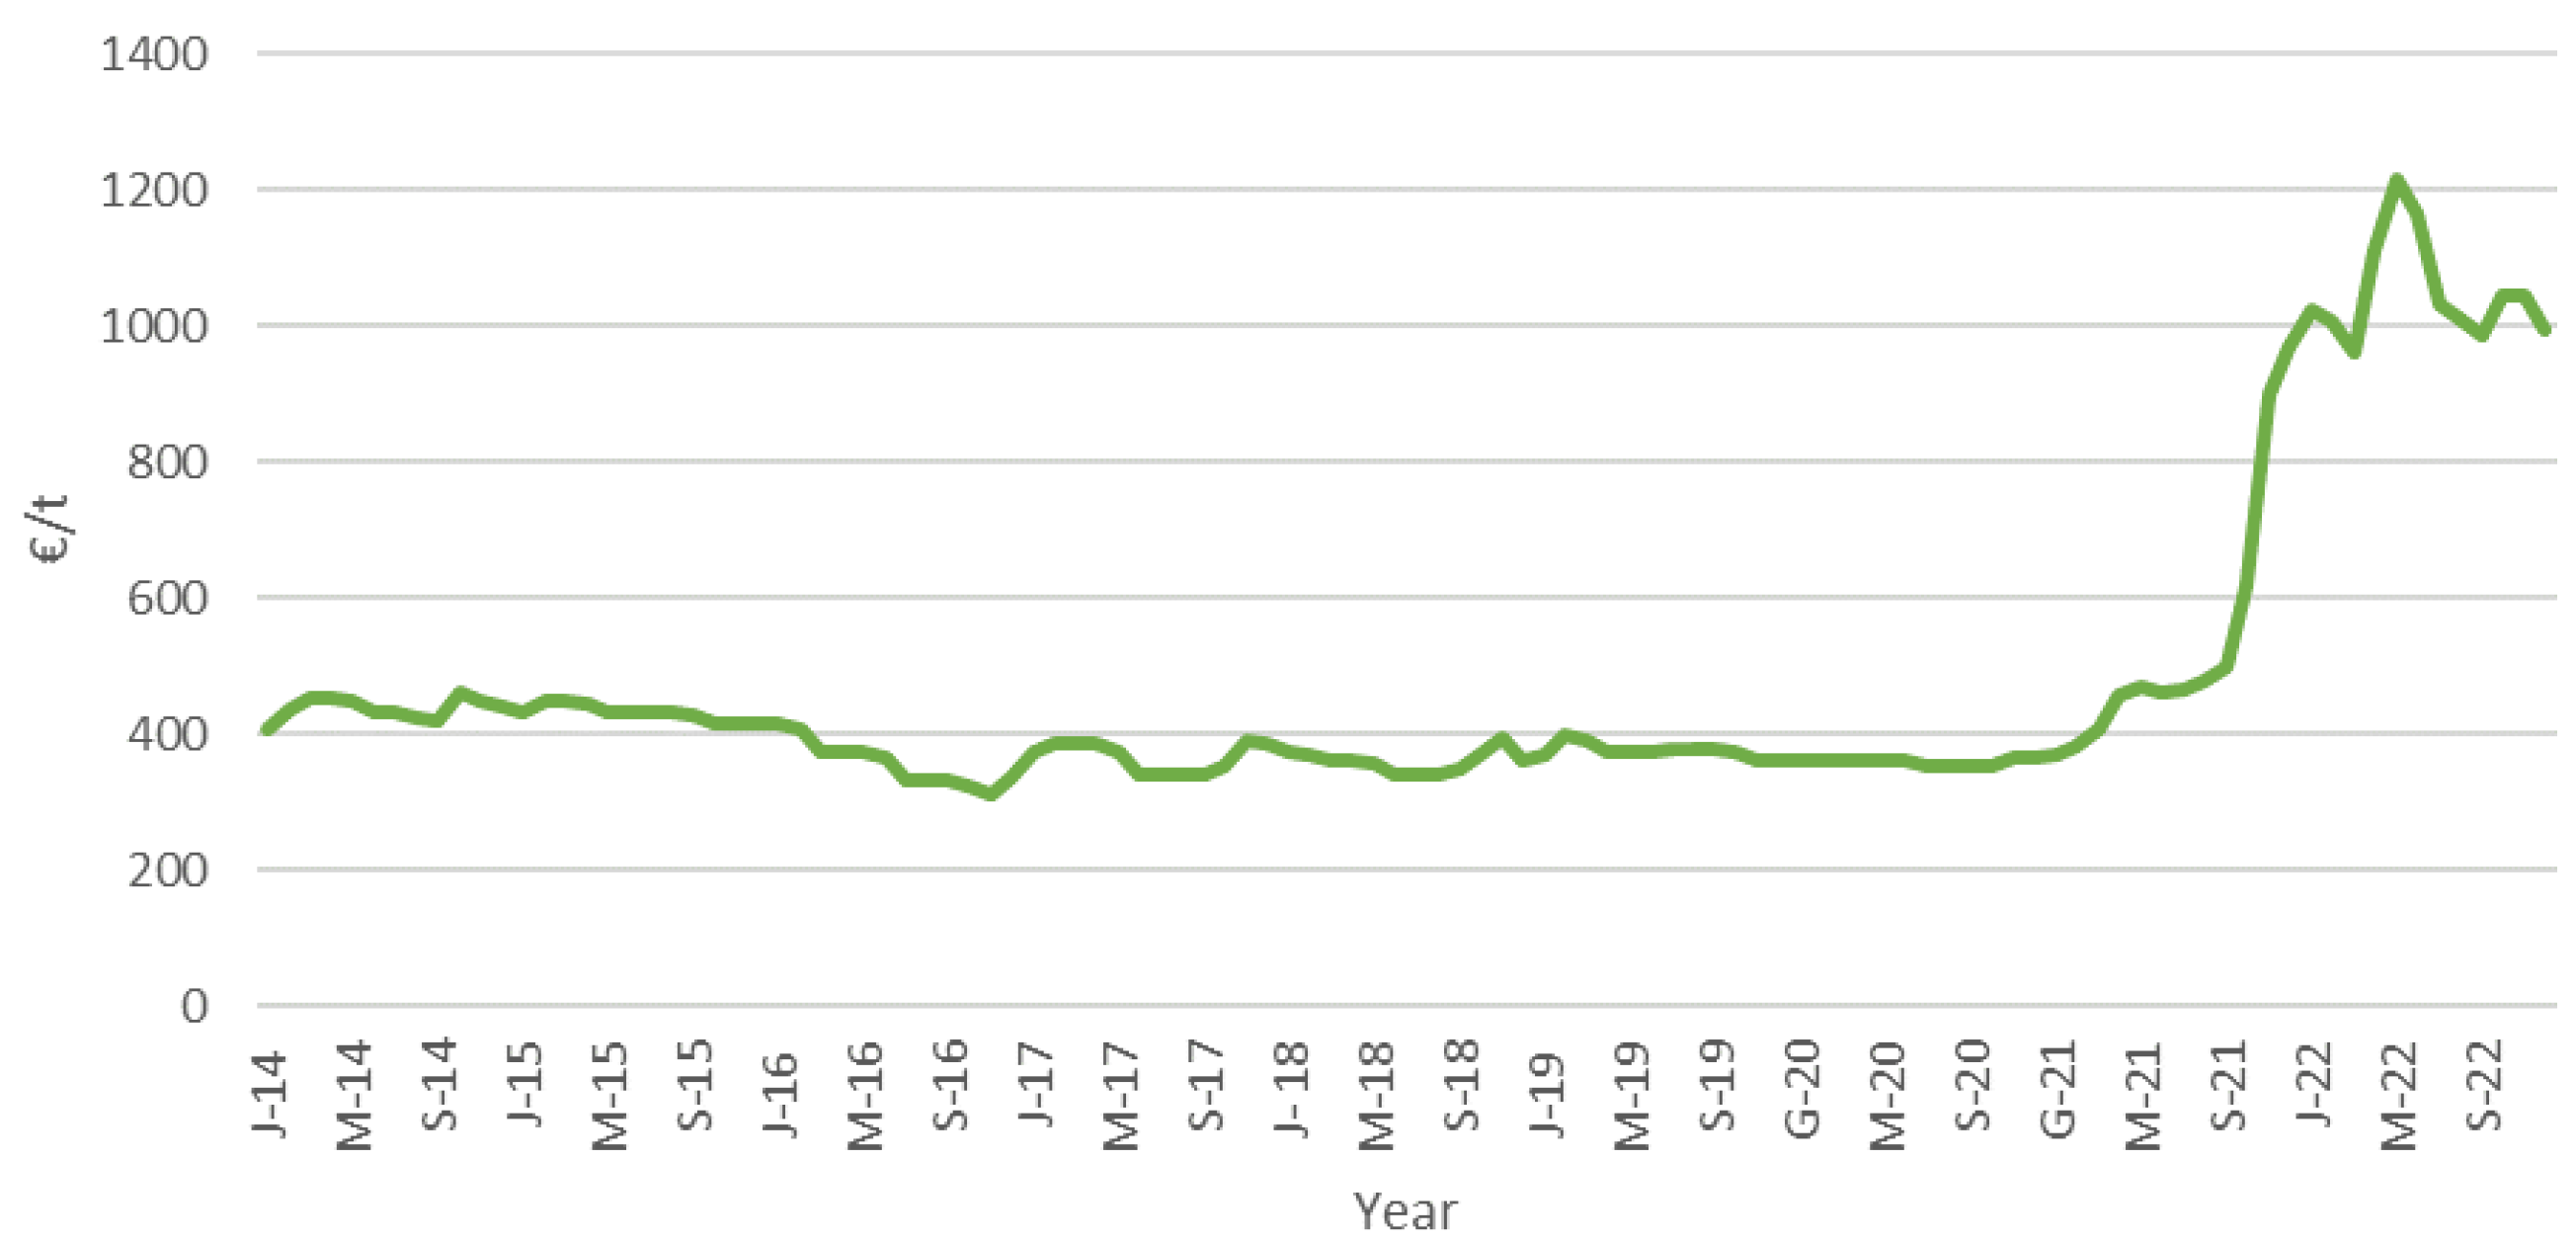
- Price of the durum wheat produced: in the period 2014–2018, farm A proves to possess a capacity to enhance production with a notable premium price compared to central Italy (+16%) and farm B (+20%). This difference in price is due to the fact that farm A markets its product as seed wheat, a niche market in respect to the mainstream production of semolina wheat. In the period 2019–2022, post-PA adoption by farm A, the world changed drastically due to the double crisis (pandemic and the war in Ukraine) which, as we know, has led to a shock on the commodity market. Therefore, the surge in profit margins per hectare experienced by both case studies is due to the short-term economic prospects.
- Profitability (2014–2018): in the period 2014–2018, the operating income generated by every hectare of durum wheat produced by farm A was 69% higher than that of central Italy and 70% higher than that of farm B. This evidence indicates a much greater cost efficiency experienced by farm A in its PA pre-adoption period with respect both to the median context and to farm B. On the other hand, during 2019–2022, both case studies show an operating income which increased considerably because of the supply shock within the European market. In this regard, it is interesting to note that the difference in competitiveness between the two case studies observed in the previous period disappeared, as indicated by the operating income settling on the same level for both the farms.
2.2. Economic Analysis
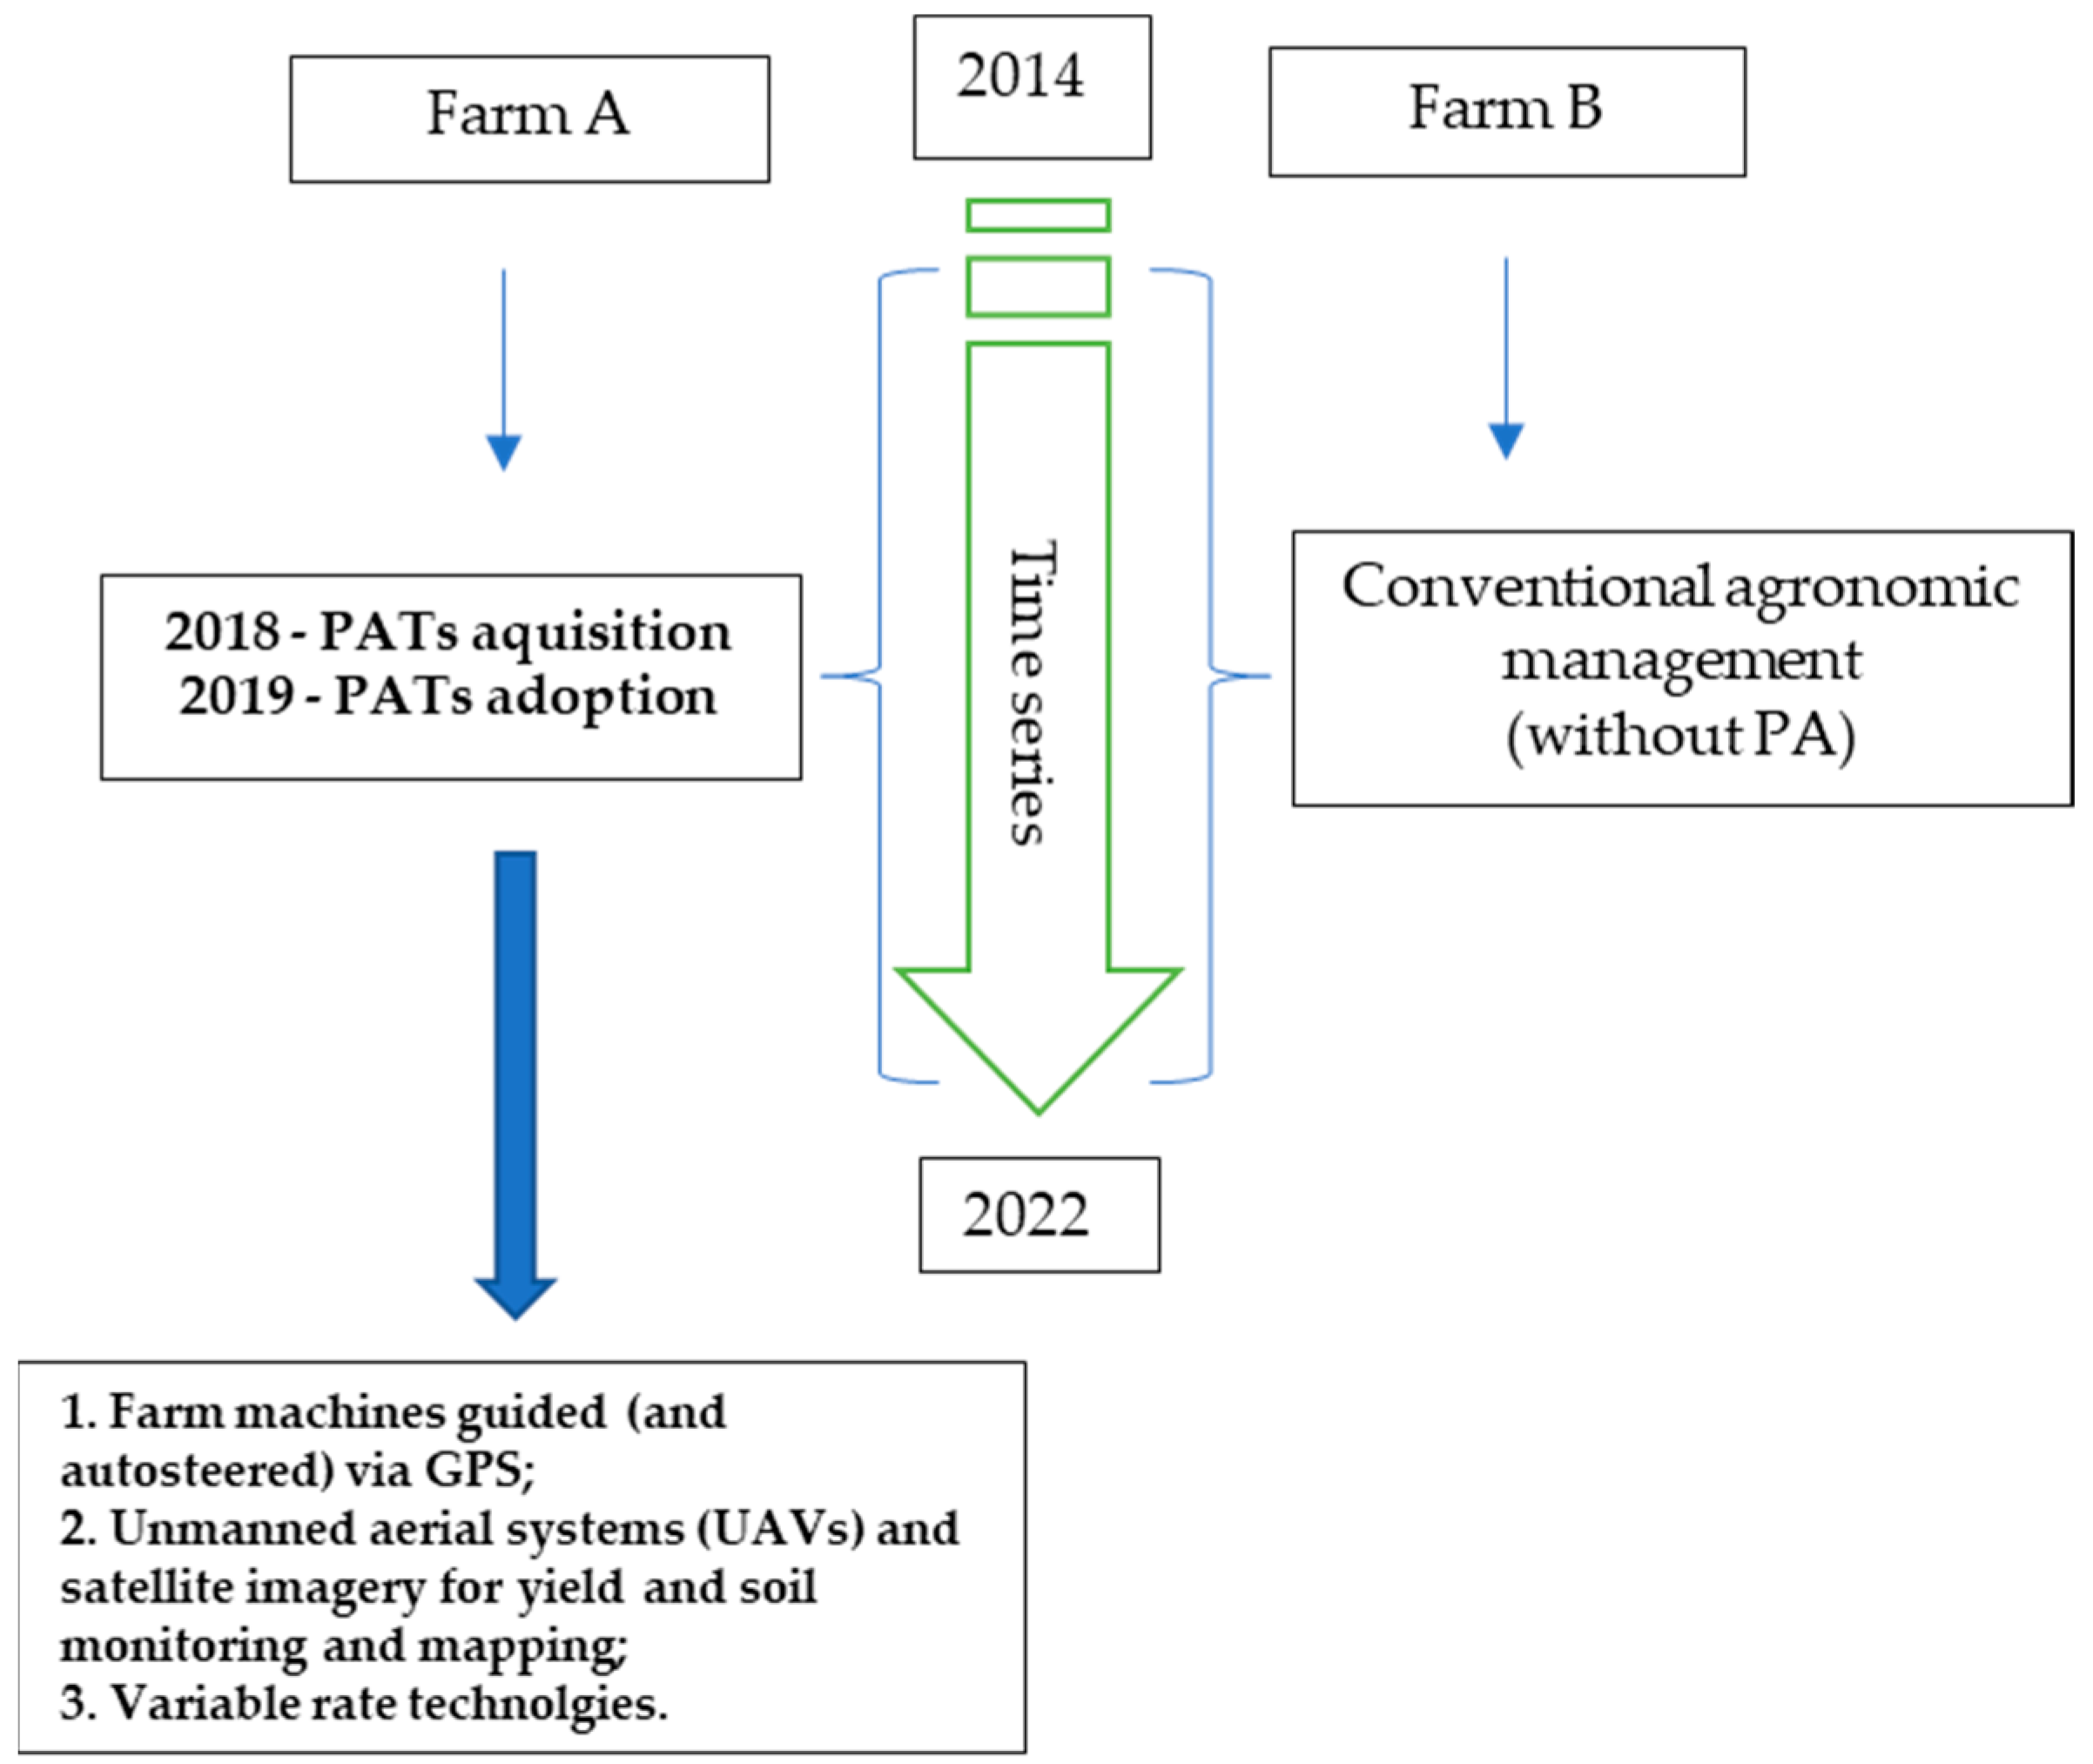
- The profitability of durum wheat production performed by the PA-adopting case study (farm A) has been assessed by comparing how the profitability indicators evolve before and after the adoption period (2014–2018 vs. 2019–2022).
- Besides, the profitability of durum wheat production has been assessed comparing the economic indicators of the PA-adopting farm (farm A) to that of the non-adopting farm (farm B).
- Productivity
- ○
- T/ha
- Gross Profit (per hectare)
- ○
- Revenues (RV) − Variable Costs (VC)
- Gross profit Margin
- ○
- (RV − VC)/RV
- Operating profit (per hectare)
- ○
- Gross Profit − (PA capital depreciation quota − land for rent quota − administrative and general expenses quota)
- Operating profit margin
- ○
- Operating profit/RV
2.3. The Nitrogen Agronomic Efficiency Index (NAE)
3. Results and Discussion
3.1. Economic Results
- (1)
- Productivity: Land productivity is a very complex indicator that depends on many variables involved. In our case study, the data show that the most productive farm is the one that does not adopt the PA: farm B. Moreover, what is noted is also a slight declining trend in productivity for both farms, and perhaps this evidence could be related to the change in atmospheric and climatic conditions in the medium term. However, this is a hypothesis that should be verified using statistically representative samples of cultivated areas. Then, focusing the attention on the post adoption period, we note that farm A shows an increase in productivity in the 2019–2020 period followed by a decrease in productivity in the period 2021–2022. Again, the owners/managers of farm A attribute these trends as essentially linked to environmental conditions and not directly linked to the use of PATs which, among other things, should not be a factor of productivity increase but of cost optimization for any given level of productivity.
- (2)
- Cost efficiency: Regardless of the use of the PATs, looking at the trend of variable costs and the variable costs ratio, it emerges that farm A is a farm structurally more efficient than farm B, while, in terms of PA cost effectiveness, until 2021, the variable costs ratio remains substantially constant. Therefore, no signs of PA adoption efficacy are observed. Things change in 2022. Indeed, the variable costs ratio between farm A and farm B falls from 0.83–0.87 (in trend) to 0.76. Although this is an observation of only one year, so not very meaningful if seen in isolation, it still allows us to make a hypothesis: with raw material prices at the levels of 2022, the cost optimization of the production process using PATs could become significant and relevant. Obviously, this hypothesis should be tested experimentally; nevertheless, our data indicate that the farm that adopts a PAT management shows resilience in terms of increase in the production cost per hectare, which is much greater than the case study that does not adopt PAT.
- (3)
- Gross profitability: Interesting information can emerge if observing the gross profit. First, in the pre-adoption period, farm A was shown to be capable of much higher profitability than the “control” case study (farm B). Since 2018, in conjunction with the investment in the PAT package, farm A apparently loses its profitability advantage with respect to farm B. Indeed, in the period 2021–2022, the gross profit ratio between the two case studies is reversed compared to previous years—the wheat produced by farm B becomes more profitable than that produced by farm A—and this is due to three underlying forces acting simultaneously: wheat selling price, productivity, and contingency of exceptional environmental conditions.
- Selling price: Since 2018, the difference between the two case studies in terms of average revenue narrowed, until it disappeared in 2022. The exceptional increase in prices in the three-year period, 2020–2022, favored an upward squeezing of the price differentials, which was previously linked mainly to product quality.
- Productivity: Farm B remains a structurally more productive farm even in the post-adoption period of the PA package by farm A. The higher productivity of the durum wheat produced by farm B lies in the genetics of the seeds used. Farm A produces durum wheat for seed. The varieties used are generally less productive than semolina varieties, but they usually tend to have a higher market value even if, as we have seen in 2021–2022, the price of the two case studies flattens out on the same level due to the market shock.
- Environmental conditions: Although the use of PATs allows a greater timeliness of action in crop management, even without the use the technologies, farm B was able to manage the 2021 sowing period more effectively than farm A. The 2021 sowing was very difficult in the survey area due to exceptionally prolonged rain events. Farm A was unable to sow before December 2021 (two months of delay), and this strongly influenced the low productivity of the 2022 harvest, while farm B found useful windows for sowing in the right period, i.e., October 2021.
- (4)
- Operating profit: the fundamental information contained in the comparison between the two case studies, in terms of operating profit, is the incidence of the depreciation share of the PA capital invested by farm A in 2018. This factor, combined with the alignment of the prices of wheat sold starting from 2020 and the higher productivity of farm B, determines an inversion of the profitability of the two case studies in 2021–2022, when farm B becomes more profitable than farm A. The weight of the share of depreciation of the PA capital on the profitability per hectare of farm A also emerges from the joint comparison of the gross margin and the operating margin (Figure 5). In fact, the narrowing of the distance between the two indicators that can be seen when passing from the gross margin to the net margin is essentially due to the depreciation rate of the PA capital discounted by farm A.
3.2. Agronomic Results
4. Conclusions
- The depreciation share of the financial capital invested by farm A in the PA package was EUR 89.18 per hectare in 2022.
- The agricultural area on which this share of depreciation is calculated is four times higher than the agricultural area available to farm B. As mentioned by Schimmelpfennig [76], large farms may present economies of scale when adopting PATs because they have more hectares over which to spread investment costs. Moreover, large farms are also more likely to have the type of variability that makes PATs [77].
- The research project from which this article derives involved an agronomic experimentation in the case study farms, and it would have been beyond the possibilities of the project to develop this experimentation in more than two farms (farm A and B).
- Therefore, the first issue was to identify a “control” farm (case study B) available to host the agronomic experimentation for the participation in the comparative study. This farm should have been available to provide all its economic and accounting data. In this regard, it should also be clarified that farms in Italy in many cases do not keep detailed analytical accounting relating to long historical series in their archives. For this reason, even working with just one farm, it was not easy to reconstruct the analytical accounting data set necessary for carrying out this study [80]. On the other hand, there were no difficulties with farm A, since it keeps track of its own detailed analytical accounting using advanced management software (as Geofolia, Isagri).
Author Contributions
Funding
Data Availability Statement
Acknowledgments
Conflicts of Interest
Appendix A


| Equipment | Type of Technology | Price (EUR) |
|---|---|---|
| AGCO challenger ISOBUS-ready tractor | Guidance system | 200,000 |
| Mazzotti MAF 5400 self-propelled sprayer with GPS guidance system | Guidance system and reacting technology | 200,000 |
| Seletron system | Variable distribution of pesticides | 20,000 |
| Jhon Deere ISOBUS-ready no till seeder | Guidance system | 67,000 |
| Sulki ISOBUS-ready fertilizer sprayer | Reacting technology | 24,000 |
| Parrot drone + software | Recording technology | 5000 (+150 annual subscription) |
| Trimble in-cab terminal and satellite receiver combination for GPS guidance system and variable and rate distribution system Vantage Trimble | Guidance system and reacting technology | 15,000 (+150 annual subscription) |
References
- Laborde, D.; Martin, W.; Swinnen, J.; Vos, R. COVID-19 risks to global food security. Science 2020, 369, 500–502. [Google Scholar] [PubMed]
- Hejazi, M.; Marchant, M.A. China’s evolving agricultural support policies. Choices 2017, 32, 1–7. [Google Scholar]
- Behnassi, M.; El Haiba, M. Implications of the Russia–Ukraine war for global food security. Nat. Hum. Behav. 2022, 6, 745–755. [Google Scholar]
- Psaltopoulos, D. The Ukraine War and Food Security Crisis. Eurasian J. Agric. Econ. (EJAE) 2022, 2, 13–23. [Google Scholar]
- Izzeldin, M.; Muradoğlu, Y.G.; Pappas, V.; Petropoulou, A.; Sivaprasad, S. The impact of the Russian-Ukrainian war on global financial markets. Int. Rev. Financ. Anal. 2023, 87, 102598. [Google Scholar]
- Arndt, C.; Diao, X.; Dorosh, P.; Pauw, K.; Thurlow, J. The Ukraine war and rising commodity prices: Implications for developing countries. Glob. Food Secur. 2023, 36, 100680. [Google Scholar]
- Ben Hassen, T.; El Bilali, H. Impacts of the Russia-Ukraine war on global food security: Towards more sustainable and resilient food systems? Foods 2022, 11, 2301. [Google Scholar]
- Shahini, E.; Skura, E.; Sallaku, F.; Shahini, S. The supply shock in organic fertilizers for agriculture caused by the effect of Russia-Ukraine war. Sci. Horiz. 2022, 2, 97–103. [Google Scholar]
- Schnitkey, G.; Paulson, N.; Zulauf, C.; Swanson, K.; Colussi, J.; Baltz, J. Nitrogen fertilizer prices and supply in light of the Ukraine-Russia conflict. Farmdoc Dly. 2022, 12, 45. [Google Scholar]
- Alexander, P.; Arneth, A.; Henry, R.; Maire, J.; Rabin, S.; Rounsevell, M.D. High energy and fertilizer prices are more damaging than food export curtailment from Ukraine and Russia for food prices, health and the environment. Nat. Food 2023, 4, 84–95. [Google Scholar]
- Schieffer, J.; Dillon, C. The economic and environmental impacts of precision agriculture and interactions with agro-environmental policy. Precis. Agric. 2015, 16, 46–61. [Google Scholar]
- Balafoutis, A.; Beck, B.; Fountas, S.; Vangeyte, J.; Wal, T.; Soto, I.; Gómez-Barbero, M.; Barnes, A.; Eory, V. Precision Agriculture Technologies Positively Contributing to GHG Emissions Mitigation, Farm Productivity and Economics. Sustainability 2017, 9, 1339. [Google Scholar]
- Fabiani, S.; Vanino, S.; Napoli, R.; Zajíček, A.; Duffková, R.; Evangelou, E.; Nino, P. Assessment of the economic and environmental sustainability of Variable Rate Technology (VRT) application in different wheat intensive European agricultural areas. A Water energy food nexus approach. Environ. Sci. Policy 2020, 114, 366–376. [Google Scholar]
- ITU; FAO. Digital Excellence in Agriculture in Europe and Central Asia: Good Practices in the Field of Digital Agriculture—Stocktaking Report. Geneva, Switzerland. 2021. Available online: https://www.fao.org/3/cb6098en/cb6098en.pdf (accessed on 23 March 2023).
- Olson, K. Precision agriculture: Current economic and environmental issues. In Proceedings of the Sixth Joint Conference on Food, Agriculture, and the Environment, Minneapolis, MN, USA, 31 August–2 September 1998. [Google Scholar]
- Plant, R.; Pettygrove, G.; Reinert, W. Precision agriculture can increase profits and limit environmental impacts. Calif. Agr. 2000, 54, 66–71. [Google Scholar]
- Zhang, N.; Wang, M.; Wang, N. Precision agriculture—A worldwide overview. Comput. Electron. Agric. 2002, 36, 113–132. [Google Scholar]
- Bongiovanni, R.; Lowenberg-DeBoer, J. Precision agriculture and sustainability. Precis. Agric. 2004, 5, 359–387. [Google Scholar]
- Meyer-Aurich, A.; Gandorfer, M.; Heißenhuber, A. Economic analysis of precision farming technologies at the farm level: Two german case studies. In Agricultural Systems: Economics, Technology, Diversity; Castelonge, O.W., Ed.; Nova Science Publishers: Hauppage, NY, USA, 2008; pp. 67–76. ISBN 978-1-60692-025-1. [Google Scholar]
- Vecchio, Y.; De Rosa, M.; Adinolfi, F.; Bartoli, L.; Masi, M. Adoption of precision farming tools: A context-related analysis. Land Use Policy 2020, 94, 104481. [Google Scholar]
- Finco, A.; Bucci, G.; Belletti, M.; Bentivoglio, D. The economic results of investing in precision agriculture in durum wheat production: A case study in central Italy. Agronomy 2021, 11, 1520. [Google Scholar]
- Gebbers, R.; Adamchuk, V.I. Precision agriculture and food security. Science 2010, 327, 828–831. [Google Scholar]
- Domingo, J.; De Miguel, E.; Hurtado, B.; Métayer, N.; Bamière, L.; Pardon, L.; Bochu, J.; Pointereau, P.; Pellerin, S. Measures at farm level to reduce greenhouse gas emissions from EU agriculture. Notes Policy Dep. B Struct. Cohes. Policies. 2014, 10, 4922. [Google Scholar]
- Higgins, S.; Schellberg, J.; Bailey, J.S. Improving productivity and increasing the efficiency of soil nutrient management on grassland farms in the UK and Ireland using precision agriculture technology. Eur. J. Agron. 2019, 106, 67–74. [Google Scholar]
- Soto Embodas, I.; Barnes, A.; Balafoutis, A.; Beck, B.; Sanchez Fernandez, B.; Vangeyte, J.; Fountas, S.; Van Der Wal, T.; Eory, V.; Gomez Barbero, M. The Contribution of Precision Agriculture Technologies to Farm Productivity and the Mitigation of Greenhouse Gas Emissions in the EU; Publications Office of the European Union: Luxembourg, 2019. [Google Scholar]
- Franco, C.; Pedersen, S.M.; Papaharalampos, H.; Ørum, J.E. The value of precision for image-based decision support in weed management. Precis. Agric. 2017, 18, 366–382. [Google Scholar]
- Monteiro, A.; Santos, S. Sustainable approach to weed management: The role of precision weed management. Agronomy 2022, 12, 118. [Google Scholar]
- Diacono, M.; Rubino, P.; Montemurro, F. Precision nitrogen management of wheat. A review. Agron. Sustain. Dev. 2013, 33, 219–241. [Google Scholar]
- Patrício, D.I.; Rieder, R. Computer vision and artificial intelligence in precision agriculture for grain crops: A systematic review. Comput. Electron. Agric. 2018, 153, 69–81. [Google Scholar]
- Toscano, P.; Castrignanò, A.; Di Gennaro, S.F.; Vonella, A.V.; Ventrella, D.; Matese, A. A precision agriculture approach for durum wheat yield assessment using remote sensing data and yield mapping. Agronomy 2019, 9, 437. [Google Scholar]
- Leukel, J.; Zimpel, T.; Stumpe, C. Machine learning technology for early prediction of grain yield at the field scale: A systematic review. Comput. Electron. Agric. 2023, 207, 107721. [Google Scholar]
- Tanabe, R.; Matsui, T.; Tanaka, T.S. Winter wheat yield prediction using convolutional neural networks and UAV-based multispectral imagery. Field Crops Res. 2023, 291, 108786. [Google Scholar]
- Zou, R.; Zhang, Y.; Chen, J.; Li, J.; Dai, W.; Mu, S. Density estimation method of mature wheat based on point cloud segmentation and clustering. Comput. Electron. Agric. 2023, 205, 107626. [Google Scholar]
- Godwin, R.J.; Richards, T.E.; Wood, G.A.; Welsh, J.P.; Knight, S.M. An economic analysis of the potential for precision farming in UK cereal production. Biosyst. Eng. 2003, 84, 533–545. [Google Scholar]
- Pedersen, S.M.; Fountas, S.; Have, H.; Blackmore, B.S. Agricultural robots—System analysis and economic feasibility. Precis. Agric. 2006, 7, 295–308. [Google Scholar]
- Robertson, M.; Carberry, P.; Brennan, L. The economic benefits of precision agriculture: Case studies from Australian grain farms. Crop Pasture Sci. 2007, 60, 2012. [Google Scholar]
- Jensen, H.G.; Jacobsen, L.B.; Pedersen, S.M.; Tavella, E. Socioeconomic impact of widespread adoption of precision farming and controlled traffic systems in Denmark. Precis. Agric. 2012, 13, 661–677. [Google Scholar]
- Pierpaoli, E.; Carli, G.; Pignatti, E.; Canavari, M. Drivers of precision agriculture technologies adoption: A literature review. Procedia Technol. 2013, 8, 61–69. [Google Scholar]
- Mintert, J.R.; Widmar, D.; Langemeier, M.; Boehlje, M.; Erickson, B. The Challenges of Precision Agriculture: Is Big Data the Answer? 2016. Available online: https://ageconsearch.umn.edu/record/230057 (accessed on 30 March 2023).
- Bucci, G.; Bentivoglio, D.; Finco, A.; Belletti, M.; Bentivoglio, D. Exploring the impact of innovation adoption in agriculture: How and where Precision Agriculture Technologies can be suitable for the Italian farm system? IOP Conf. Ser. Earth Environ. Sci. 2019, 275, 012004. [Google Scholar]
- Barnes, A.; De Soto, I.; Eory, V.; Beck, B.; Balafoutis, A.; Sánchez, B.; Vangeyte, J.; Fountas, S.; van der Wal, T.; Gómez-Barbero, M. Influencing factors and incentives on the intention to adopt precision agricultural technologies within arable farming systems. Environ. Sci. Policy 2019, 93, 66–74. [Google Scholar]
- Deffontaines, L.; Mottes, C.; Della Rossa, P.; Lesueur-Jannoyer, M.; Cattan, P.; Le Bail, M. How farmers learn to change their weed management practices: Simple changes lead to system redesign in the French West Indies. Agric. Syst. 2020, 179, 102769. [Google Scholar]
- Lavik, M.S.; Hardaker, J.B.; Lien, G.; Berge, T.W. A multi-attribute decision analysis of pest management strategies for Norwegian crop farmers. Agric. Syst. 2020, 178, 102741. [Google Scholar]
- Autio, A.; Johansson, T.; Motaroki, L.; Minoia, P.; Pellikka, P. Constraints for adopting climate-smart agricultural practices among smallholder farmers in Southeast Kenya. Agric. Syst. 2021, 194, 103284. [Google Scholar]
- Benitez-Altuna, F.; Trienekens, J.; Materia, V.C.; Bijman, J. Factors affecting the adoption of ecological intensification practices: A case study in vegetable production in Chile. Agric. Syst. 2021, 194, 103283. [Google Scholar]
- Blasch, J.; van der Kroon, B.; van Beukering, P.; Munster, R.; Fabiani, S.; Nino, P.; Vanino, S. Farmer preferences for adopting precision farming technologies: A case study from Italy. Eur. Rev. Agric. Econ. 2022, 49, 33–81. [Google Scholar]
- Basso, B.; Dumont, B.; Cammarano, D.; Pezzuolo, A.; Marinello, F.; Sartori, L. Environmental and Economic Benefits of Variable Rate Nitrogen Fertilization in a Nitrate Vulnerable Zone. Sci. Total Environ. 2016, 545, 227–235. [Google Scholar] [PubMed] [Green Version]
- Colaço, A.F.; Molin, J.P. Variable rate fertilization in citrus: A long term study. Precis. Agric. 2017, 18, 169–191. [Google Scholar]
- Schillaci, C.; Perego, A.; Valkama, E.; Märker, M.; Saia, S.; Veronesi, F.; Lipani, A.; Lombardo, L.; Tadiello, T.; Gamper, H.A.; et al. New Pedotransfer Approaches to Predict Soil Bulk Density Using WoSIS Soil Data and Environmentalcovariates in Mediterranean Agro-Ecosystems. Sci. Total Environ. 2021, 780, 146609. [Google Scholar] [PubMed]
- Yin, R.K. Case study research: Design and methods. Thousand Oaks, CA: Sage. Can. J. Action Res. 2009, 14, 69–71. [Google Scholar]
- Novyarni, N.; Ningsih, L.N.A. Comparative Analysis of Financial Ratios and Economic Value Added Methods in Assessing Company Financial Performance. In Proceedings of the Annual International Conference on Accounting Research; Atlantis Press: Amsterdam, The Netherlands, 2020; pp. 137–142. [Google Scholar]
- Olson, K.; Westra, J. The Economics of Farm Management: A Global Perspective, 2nd ed.; Routledge: New York, NY, USA, 2022. [Google Scholar]
- Ali, A.; Haque, M.I. Ratio Analysis: A Comparative Study of National Petrochemicals Co. and Sahara Petrochemicals Co. of Saudi Arabia. Int. J. Manag. Acad. 2014, 2, 53–61. [Google Scholar]
- Roberts, R.K.; English, B.C.; Larson, J.A.; Cochran, R.L.; Goodman, W.R.; Larkin, S.L.; Marra, M.C.; Martin, S.W.; Shurley, W.D.; Reeves, J.M. Adoption of Site-Specific Information and Variable-Rate Technologies in Cotton Precision Farming. J. Agric. Appl. Econ. 2004, 36, 143–158. [Google Scholar]
- Tamirat, T.W.; Pedersen, S.M.; Lind, K.M. Farm and operator characteristics affecting adoption of precision agriculture in Denmark and Germany. Acta Agric. Scand. Sect. B—Soil Plant Sci. 2018, 68, 349–357. [Google Scholar]
- Kernecker, M.; Knierim, A.; Wurbs, A.; Kraus, T.; Borges, F. Experience versus expectation: Farmers’ perceptions of smart farming technologies for cropping systems across Europe. Precis. Agric. 2020, 21, 34–50. [Google Scholar]
- Charatsari, C.; Lioutas, E.D.; Papadaki-Klavdianou, A.; Michailidis, A.; Partalidou, M. Farm advisors amid the transition to Agriculture 4.0: Professional identity, conceptions of the future and future-specific competencies. Sociol. Rural. 2022, 62, 335–362. [Google Scholar]
- Allen, R.G.; Pereira, L.; Raes, D.; Smith, M. Crop Evapotranspiration-Guidelines for Computing Crop Water Requirements. In FAO Irrigation and Drainage Paper 56; FAO: Rome, Italy, 1998. [Google Scholar]
- Fiorentini, M.; Zenobi, S.; Orsini, R. Remote and Proximal Sensing Applications for Durum Wheat Nutritional Status Detection in Mediterranean Area. Agriculture 2021, 11, 39. [Google Scholar]
- Orsini, R.; Basili, D.; Belletti, M.; Bentivoglio, D.; Bozzi, C.A.; Chiappini, S.; Conti, C.; Galli, A.; Giorgini, E.; Fiorentini, M.; et al. Setting of a precision farming robotic laboratory for cropping system sustainability and food safety and security: Preliminary results. IOP Conf. Ser. Earth Environ. Sci. 2019, 275, 01202. [Google Scholar]
- Fiorentini, M.; Schillaci, C.; Denora, M.; Zenobi, S.; Deligios, P.; Orsini, R.; Santilocchi, R.; Perniola, M.; Montanarella, L.; Ledda, L. A machine learning modelling framework for Triticum turgidum subsp. durum Desf yield forecasting in Italy. Agron. J. 2022, 2023, 1–21. [Google Scholar]
- Denora, M.; Fiorentini, M.; Zenobi, S.; Deligios, P.A.; Orsini, R.; Ledda, L.; Perniola, M. Validation of rapid and low-cost approach for the delineation of zone management based on machine learning algorithms. Agronomy 2022, 12, 183. [Google Scholar]
- Orsini, R.; Fiorentini, M.; Zenobi, S. Testing vegetation index categories as influenced by soil management and nitrogen fertilization in cereal based cropping systems. In Proceedings of the 2019 International IEEE Workshop on Metrology for Agriculture and Foresty, Portici, Italy, 24–26 October 2019. [Google Scholar]
- Orsini, R.; Fiorentini, M.; Zenobi, S. Evaluation of Soil Management Effect on Crop Productivity and Vegetation Indices Accuracy in Mediterranean Cereal-Based Cropping Systems. Sensors 2020, 20, 3383. [Google Scholar]
- Pro, C.; Basili, D.; Notarstefano, V.; Belloni, A.; Fiorentini, M.; Zenobi, S.; Alia, S.; Vignini, A.; Orsini, R.; Giorgini, E. A spectroscopic approach to evaluate the effects of different soil tillage methods and nitrogen fertilization levels on the biochemical composition of durum wheat (Triticum turgidum subsp. durum) leaves and caryopses. Agriculture 2021, 11, 321. [Google Scholar]
- Seddaiu, G.; Iocola, I.; Farina, R.; Orsini, R.; Iezzi, G.; Roggero, P.P. Long term effects of tillage practices and N fertilization in rainfed Mediterranean cropping systems: Durum wheat, sunflower and maize grain yield. Eur. J. Agron. 2016, 77, 166–178. [Google Scholar]
- Abad, A.; Lloveras, J.; Michelena, A. Nitrogen Fertilization and Foliar Urea Effects on Durum Wheat Yield and Quality and on Residual Soil Nitrate in Irrigated Mediterranean Conditions. Field Crops Res. 2004, 87, 257–269. [Google Scholar]
- Rath, S.; Zamora-Re, M.; Graham, W.; Dukes, M.; Kaplan, D. Quantifying Nitrate Leaching to Groundwater from a Corn-Peanut Rotation under a Variety of Irrigation and Nutrient Management Practices in the Suwannee River Basin, Florida. Agric. Water Manag. 2021, 246, 106634. [Google Scholar]
- Munch, J.C.; Velthof, G.L. Denitrification and agriculture. In Biology of the Nitrogen Cycle; Elsevier: Amsterdam, The Netherlands, 2007. [Google Scholar]
- Karpinski, I.; Schuler, J.; Müller, K. A New Approach to Support Site-Specific Farming and Economic Decision Making for Precision Agriculture in East Germany: The Heterogeneity Indicator. Outlook Agric. 2015, 44, 283–289. [Google Scholar]
- Basso, B.; Fiorentino, C.; Cammarano, D.; Schulthess, U. Variable rate nitrogen fertilizer response in wheat using remote sensing. Precis. Agric. 2015, 17, 168–182. [Google Scholar]
- Denora, M.; Amato, M.; Brunetti, G.; De Mastro, F.; Perniola, M. Geophysical field zoning for nitrogen fertilization in durum wheat (Triticum durum Desf.). PLoS ONE 2022, 17, e0267219. [Google Scholar]
- Zhao, G.; Miao, Y.; Wang, H.; Su, M.; Fan, M.; Zhang, F.; Jiang, R.; Zhang, Z.; Liu, C.; Liu, P.; et al. A Preliminary Precision Rice Management System for Increasing Both Grain Yield and Nitrogen Use Efficiency. Field Crops Res. 2013, 154, 23–30. [Google Scholar]
- Argento, F.; Anken, T.; Abt, F.; Vogelsanger, E.; Walter, A.; Liebisch, F. Site-Specific Nitrogen Management in Winter Wheat Supported by Low-Altitude Remote Sensing and Soil Data. Precis. Agric. 2021, 22, 364–386. [Google Scholar]
- Santaga, F.S.; Benincasa, P.; Toscano, P.; Antognelli, S.; Ranieri, E.; Vizzari, M. Simplified and Advanced Sentinel-2-Based Precision Nitrogen Management of Wheat. Agronomy 2021, 11, 1156. [Google Scholar]
- Schimmelpfennig, D. Precision agriculture technologies and factors affecting their adoption. In Amber Waves: The Economics of Food, Farming, Natural Resources, and Rural America; United States Department of Agriculture Economic Research Service: Washington, DC, USA, 2016; Volume 11. [Google Scholar]
- Schimmelpfennig, D.; Lowenberg-DeBoer, J. Farm Types and Precision Agriculture Adoption: Crops, Regions, Soil Variability, and Farm Size. SSRN Electron. J. 2020, 1–38. [Google Scholar]
- Bucci, G.; Bentivoglio, D.; Belletti, M.; Finco, A. Measuring a farm’s profitability after adopting precision agriculture technologies: A case study from Italy. Acta IMEKO 2020, 9, 65–74. [Google Scholar]
- Hanson, E.D.; Cossette, M.K.; Roberts, D.C. The adoption and usage of precision agriculture technologies in North Dakota. Technol. Soc. 2022, 71, 102087. [Google Scholar]
- Vecchio, Y.; Agnusdei, G.P.; Miglietta, P.P.; Capitanio, F. Adoption of Precision Farming Tools: The Case of Italian Farmers. Int. J. Environ. Res. Public Health 2020, 17, 869. [Google Scholar]
- Masi, M.; Di Pasquale, J.; Vecchio, Y.; Capitanio, F. Precision Farming: Barriers of Variable Rate Technology Adoption in Italy. Land 2023, 12, 1084. [Google Scholar]


| Farm | Sand | Silt | Clay | pH | Organic Matter | Total Nitrogen |
|---|---|---|---|---|---|---|
| A | 224.00 | 450.00 | 326.00 | 8.70 | 15.30 | 1.30 |
| B | 142.00 | 462.00 | 396.00 | 8.13 | 14.50 | 1.07 |
| UAA Durum Wheat | Average Yield | Average Yield Index | Average Durum Wheat Price | Average Durum Wheat Price Index | Gross Profit | Gross Profit Index | Operating Profit | Operating Profit Index | |
|---|---|---|---|---|---|---|---|---|---|
| ha | t/ha | €/t | €/ha | €/ha | |||||
| Central Italy farms > 40 ha (2010–2018) | 15.2 | 4.7 | 1.00 | 222 | 1.00 | 478 | 1.00 | 295 | 1.00 |
| Farm A (2014–2018) | 87.6 | 5.66 | 1.18 | 257 | 1.16 | 776 | 1.62 | 498 | 1.69 |
| Farm B (2014–2018) | 54.2 | 6.2 | 1.31 | 213 | 0.96 | 494 | 1.03 | 294 | 0.99 |
| Farm A (2019–2022) | 103.0 | 5.4 | 1.14 | 392 | 1.76 | 1401 | 2.93 | 1019 | 3.45 |
| Farm B (2018–2022) | 57.0 | 5.9 | 1.26 | 369 | 1.66 | 1275 | 2.67 | 1075 | 3.64 |
| Farm A | |
|---|---|
| Field Activities | Period |
| Ploughing (40 cm) | October |
| Harrowing | November |
| Sowing | November |
| Pest control: Azoxystrobin, Cyproconazole | March |
| 1st N fertilization—VRT 1 | March |
| 2nd N fertilization—VRT 1 | April |
| Harvest | July |
| Farm B | |
| Field Activities | Period |
| Chisel (25 cm) | October |
| Harrowing | November |
| Sowing | November |
| Pest control: Azoxystrobin, Cyproconazole | March |
| 1st N fertilization | March |
| 2nd N fertilization | April |
| Harvest | July |
| Harvest Year | Productivity (t/ha) | Durum Wheat Price (€/t) | Variable Costs (€/ha) | Variable Cost Ratio (A/B) | Gross Profit (€/ha) | Gross Profit Ratio (A/B) | Operating Profit (€/ha) | |||||
|---|---|---|---|---|---|---|---|---|---|---|---|---|
| A | B | A | B | A | B | A | B | A | B | |||
| 2014 | 6.40 | 6.20 | 287.30 | 230.00 | 580.40 | 702.50 | 0.83 | 1183.32 | 598.50 | 1.98 | 889.89 | 398.50 |
| 2015 | 4.90 | 5.80 | 306.40 | 240.00 | 600.50 | 712.50 | 0.84 | 817.86 | 554.50 | 1.47 | 511.60 | 354.50 |
| 2016 | 5.70 | 5.80 | 213.00 | 180.00 | 588.80 | 672.50 | 0.88 | 576.30 | 246.50 | 2.34 | 409.28 | 46.50 |
| 2017 | 5.60 | 6.00 | 245.00 | 200.00 | 564.85 | 677.50 | 0.83 | 753.84 | 397.50 | 1.90 | 377.41 | 197.50 |
| 2018 | 5.20 | 7.00 | 234.00 | 215.00 | 600.55 | 709.50 | 0.85 | 548.99 | 670.50 | 0.82 | 300.90 | 470.50 |
| 2019 | 5.60 | 5.50 | 270.00 | 245.00 | 572.80 | 662.50 | 0.86 | 898.87 | 560.00 | 1.61 | 410.22 | 360.00 |
| 2020 | 5.90 | 6.50 | 326.60 | 270.00 | 592.58 | 698.50 | 0.85 | 1296.09 | 93.50 | 1.39 | 965.21 | 731.50 |
| 2021 | 5.30 | 5.80 | 480.00 | 470.00 | 605.00 | 692.50 | 0.87 | 1879.00 | 1908.50 | 0.98 | 1528.29 | 1708.50 |
| 2022 | 4.70 | 5.50 | 490.00 | 490.00 | 771.40 | 1017.50 | 0.76 | 1531.60 | 1699.50 | 0.90 | 1170.97 | 1499.50 |
| Year | Average Yield (t/ha) | Durum Wheat Price (€/t) | Variable Costs (€/ha) | Operating Profit (€/ha) | Operating Margin |
|---|---|---|---|---|---|
| 2020 | 6.50 | 270.00 | 698.50 | 444.77 | 0.25 |
| 2021 | 5.80 | 470.00 | 692.50 | 1416.56 | 0.52 |
| 2022 | 6.00 | 490.00 | 1017.50 | 1202.24 | 0.42 |
| Year | Farm | N Provided (kg N/ha) | Tot. Yield 1 (kg/ha) | NAE 2 |
|---|---|---|---|---|
| 2017 | A | 136 | 5600 | 0.41 |
| 2018 | A | 129 | 5200 | 0.40 |
| 2019 | A | 114 | 5600 | 0.49 |
| 2020 | A | 177 | 5900 | 0.33 |
| 2021 | A | 125 | 5300 | 0.42 |
| Mean A | 136 | 5520 | 0.41 | |
| 2017 | B | 210 | 6000 | 0.29 |
| 2018 | B | 230 | 7000 | 0.30 |
| 2019 | B | 215 | 5500 | 0.26 |
| 2020 | B | 223 | 6500 | 0.29 |
| 2021 | B | 208 | 5800 | 0.28 |
| Mean B | 217 | 6160 | 0.28 | |
| Mean (A vs. B) differences (%) | −63 | −10 | +47 |
Disclaimer/Publisher’s Note: The statements, opinions and data contained in all publications are solely those of the individual author(s) and contributor(s) and not of MDPI and/or the editor(s). MDPI and/or the editor(s) disclaim responsibility for any injury to people or property resulting from any ideas, methods, instructions or products referred to in the content. |
© 2023 by the authors. Licensee MDPI, Basel, Switzerland. This article is an open access article distributed under the terms and conditions of the Creative Commons Attribution (CC BY) license (https://creativecommons.org/licenses/by/4.0/).
Share and Cite
Finco, A.; Bentivoglio, D.; Belletti, M.; Chiaraluce, G.; Fiorentini, M.; Ledda, L.; Orsini, R. Does Precision Technologies Adoption Contribute to the Economic and Agri-Environmental Sustainability of Mediterranean Wheat Production? An Italian Case Study. Agronomy 2023, 13, 1818. https://doi.org/10.3390/agronomy13071818
Finco A, Bentivoglio D, Belletti M, Chiaraluce G, Fiorentini M, Ledda L, Orsini R. Does Precision Technologies Adoption Contribute to the Economic and Agri-Environmental Sustainability of Mediterranean Wheat Production? An Italian Case Study. Agronomy. 2023; 13(7):1818. https://doi.org/10.3390/agronomy13071818
Chicago/Turabian StyleFinco, Adele, Deborah Bentivoglio, Matteo Belletti, Giulia Chiaraluce, Marco Fiorentini, Luigi Ledda, and Roberto Orsini. 2023. "Does Precision Technologies Adoption Contribute to the Economic and Agri-Environmental Sustainability of Mediterranean Wheat Production? An Italian Case Study" Agronomy 13, no. 7: 1818. https://doi.org/10.3390/agronomy13071818