Article

Design of a Tomato Sorting Device Based on the Multisine-FSR Composite Measurement

1
College of Engineering, Nanjing Agricultural University, Nanjing 210031, China
2
Agricultural Engineering Research Institute (AEnRI), Agricultural Research Center (ARC), Giza 12311, Egypt
3
Department of Agricultural Engineering, Faculty of Agriculture, Ain Shams University, Cairo 11566, Egypt
*
Author to whom correspondence should be addressed.
Agronomy 2023, 13(7), 1778; https://doi.org/10.3390/agronomy13071778
Submission received: 17 June 2023 / Revised: 26 June 2023 / Accepted: 27 June 2023 / Published: 30 June 2023
(This article belongs to the Special Issue AI, Sensors and Robotics for Smart Agriculture)

Abstract

:
The ripeness of tomatoes is crucial to determining their shelf life and quality. Most of the current methods for picking and sorting tomatoes take a long time, so this paper aims to design a device for sorting tomatoes based on force and bioelectrical impedance measurement. A force sensor installed on each of its four fingers may be used as an impedance measurement electrode. When picking tomatoes, the electrical impedance analysis circuit is first connected for pre-grasping. By applying a certain pre-tightening force, the FSR sensor on the end effector finger can be tightly attached to the tomato and establish an electric current pathway. Then, the electrical parameters of the tomato are measured to determine its maturity, and some of the electrical parameters are used for force monitoring compensation. Then, a force analysis is conducted to consider the resistance of the FSR under current stress. According to the principle of complex impedance circuit voltage division, the voltage signal on the tomato is determined. At the same time, the specific value of the grasping force at this time is determined based on the calibration of the pre-experiment and the compensation during the detection process, achieving real-time detection of the grasping force. The bioelectricity parameters of tomatoes can not only judge the ripeness of tomatoes, but also compensate for the force measurement stage to achieve more accurate non-destructive sorting. The experimental results showed that within 0.6 s of stable grasping, this system could complete tomato ripeness detection, improve the overall tomato sorting efficiency, and achieve 95% accuracy in identifying ripeness through impedance.

1. Introduction

China has a large tomato-planting area and yield, but there are problems with low tomato sorting capacity, high cost, and low efficiency. The sorting process for fruit crops also relies heavily on manual labor [1,2,3,4]. There are currently three main sorting methods for tomatoes of different qualities:
(1)
Manual sorting: This method is time-consuming and labor-intensive. In recent years, with the acceleration of urbanization and the gradual shortage and aging of agricultural labor, manual picking and sorting methods have made labor costs increasingly high and unable to meet market demands [2,5,6,7,8].
(2)
Visual recognition method [9]: This method sorts the phenotypic physical characteristics of tomatoes based on their size and color and cannot detect the internal substance content of tomatoes. Gao et al. [6] improved the recognition and detection methods of YOLOv5 by using k-means clustering (KMC) at the input end to obtain more suitable anchor points, improving spatial pyramid pooling (SPP) to enhance multi-scale feature extraction, and optimizing non-maximum suppression (NMS) to improve network accuracy. The improved YOLOv5 has much better recognition accuracy and speed than the region-based convolutional neural network and YOLOv3. The improved network has good robustness and provides stable and reliable information for the operation of tomato picking robots. Guan et al. [4] considered variable conditions such as light changes and interference from branches and leaves and used YOLOv5 to confirm the positional relationship between tomatoes and flower stems. Based on the growth characteristics of the fruit, particular areas for picking flower stems were reduced. The center of the boundary box of the flower stems was used as the picking point to obtain corresponding depth information, and the robot was controlled to complete the picking task. This method can identify and locate tomato picking points in complex near-color backgrounds. Compared with the SSD algorithm, it has obvious advantages; Mayar et al. [10] achieved a theoretical classification performance of 100% for all categories of tomatoes based on the control algorithm of CNN-ANN. The actual experimental results showed a theoretical classification performance of 100% for immature and mature tomatoes, and a theoretical classification performance of 90% for mature and defective (overripe and rotten) tomatoes.
(3)
Electrical impedance detection method: At present, the technology of biological quality analysis based on electrical impedance is relatively mature [11]. Arteaga and other scholars [12] evaluate the color and cell size through the calculation algorithm with biological electrical impedance, providing a powerful tool for assessing the cell damage of blueberries during freezing. Chowdhury et al. [13] studied all impedance parameters Z, phase angle, the real part of Z, and imaginary part of Z of bananas, and analyzed the ripening phenomenon of bananas from the perspective of impedance. Li et al. [14] used leaf impedance spectroscopy to evaluate tomato nitrogen nutrition levels, achieving early diagnosis and monitoring of tomato nitrogen content. Electrical impedance can be conveniently applied to early diagnosis and monitoring of tomato nitrogen nutrition stress.
The electrical impedance detection method is an online real-time detection method. It can not only analyze internal factors such as tomato maturity [15] or nitrogen content [14,16,17] but also theoretically determine whether there are diseases and pests inside tomatoes through experimental data, further enhancing the level of tomato sorting [14].
With the growing scale of intelligent tomato picking and sorting development, the intensification of labor costs, and the urgent need to improve production efficiency, agricultural robots with integrated picking and sorting have broad prospects for the future. However, there is little research on the integration of picking and sorting. Even if there are some, most of them are sorted according to the phenotypic data of tomatoes. The sorting stability is not high, and few types are available for selection.
In summary, there are still the following problems in current automated picking and sorting of tomatoes: (1) Tomato harvesting and sorting processes heavily depend on human labor, resulting in significant time consumption and high inefficiency, especially due to the separate tasks of picking and sorting. (2) Although the online real-time sorting method of visual recognition is more time-saving compared to manual secondary sorting, it can only judge the quality of tomatoes based on their appearance. If there is an internal problem with tomatoes, but this internal problem is not shown in their appearance, then this method cannot recognize them. (3) Although electrical impedance detection technology for fruits is relatively mature, most mathematicians conduct theoretical analyses in the laboratory and do not integrate it with actual picking operations.
In order to solve the above problems, this article aims to design a device based on multi-frequency electrical impedance and combined force measurement to realize tomato picking and sorting operations based on their ripeness.

2. Materials and Methods

2.1. Study Area and Experimental Setup

In this study, the botanical tomato variety (The tomato used in the experiment was Suhong 50, which was collected from Dasheng Agricultural Base in Jiangning District, Nanjing) was used at four ripening stages (green, white ripening period, color transformation period, and pink ripening period) based on Huang Yuping [18]. In this study a total of 320 tomato samples were used, of which 80 samples were evenly divided for each period in the training stage, and 100 tomato samples were used in the test stage.
At the green ripening stage (MG), dark green covers the entire fruit. During the white ripening period (BR), the appearance of green gradually disappears, and the appearance of light red at the top of the fruit is less than 10%. During the color transition period (TU), the fruit is light red with a color development rate of 60% to 90%. In the pink stage (PNK), the fruit is red with a color rendering of nearly 100%. During the red ripening period (RED), the fruit is dark red and slightly soft. Figure 1 shows the four ripening stages of experimental tomatoes: green maturity, white maturity, color transition, and pink maturity. Experiments were conducted at the laboratory of Zhixing Building, college of Engineering, Nanjing Agricultural University, China.
According to Zhou Yibin et al. [19], mechanical properties such as firmness and deformation rate of tomatoes relate to maturity, and it would be more meaningful to study tomatoes in three stages: white, color transition, and pink ripening. Because although tomatoes in the green ripening stage have reached commercial maturity, their color and taste are not yet good, and tomatoes in the red ripening stage have started to soften and are difficult to transport, most tomato-picking work is carried out during the white ripening, color transformation, and pink ripening stages of the tomatoes.

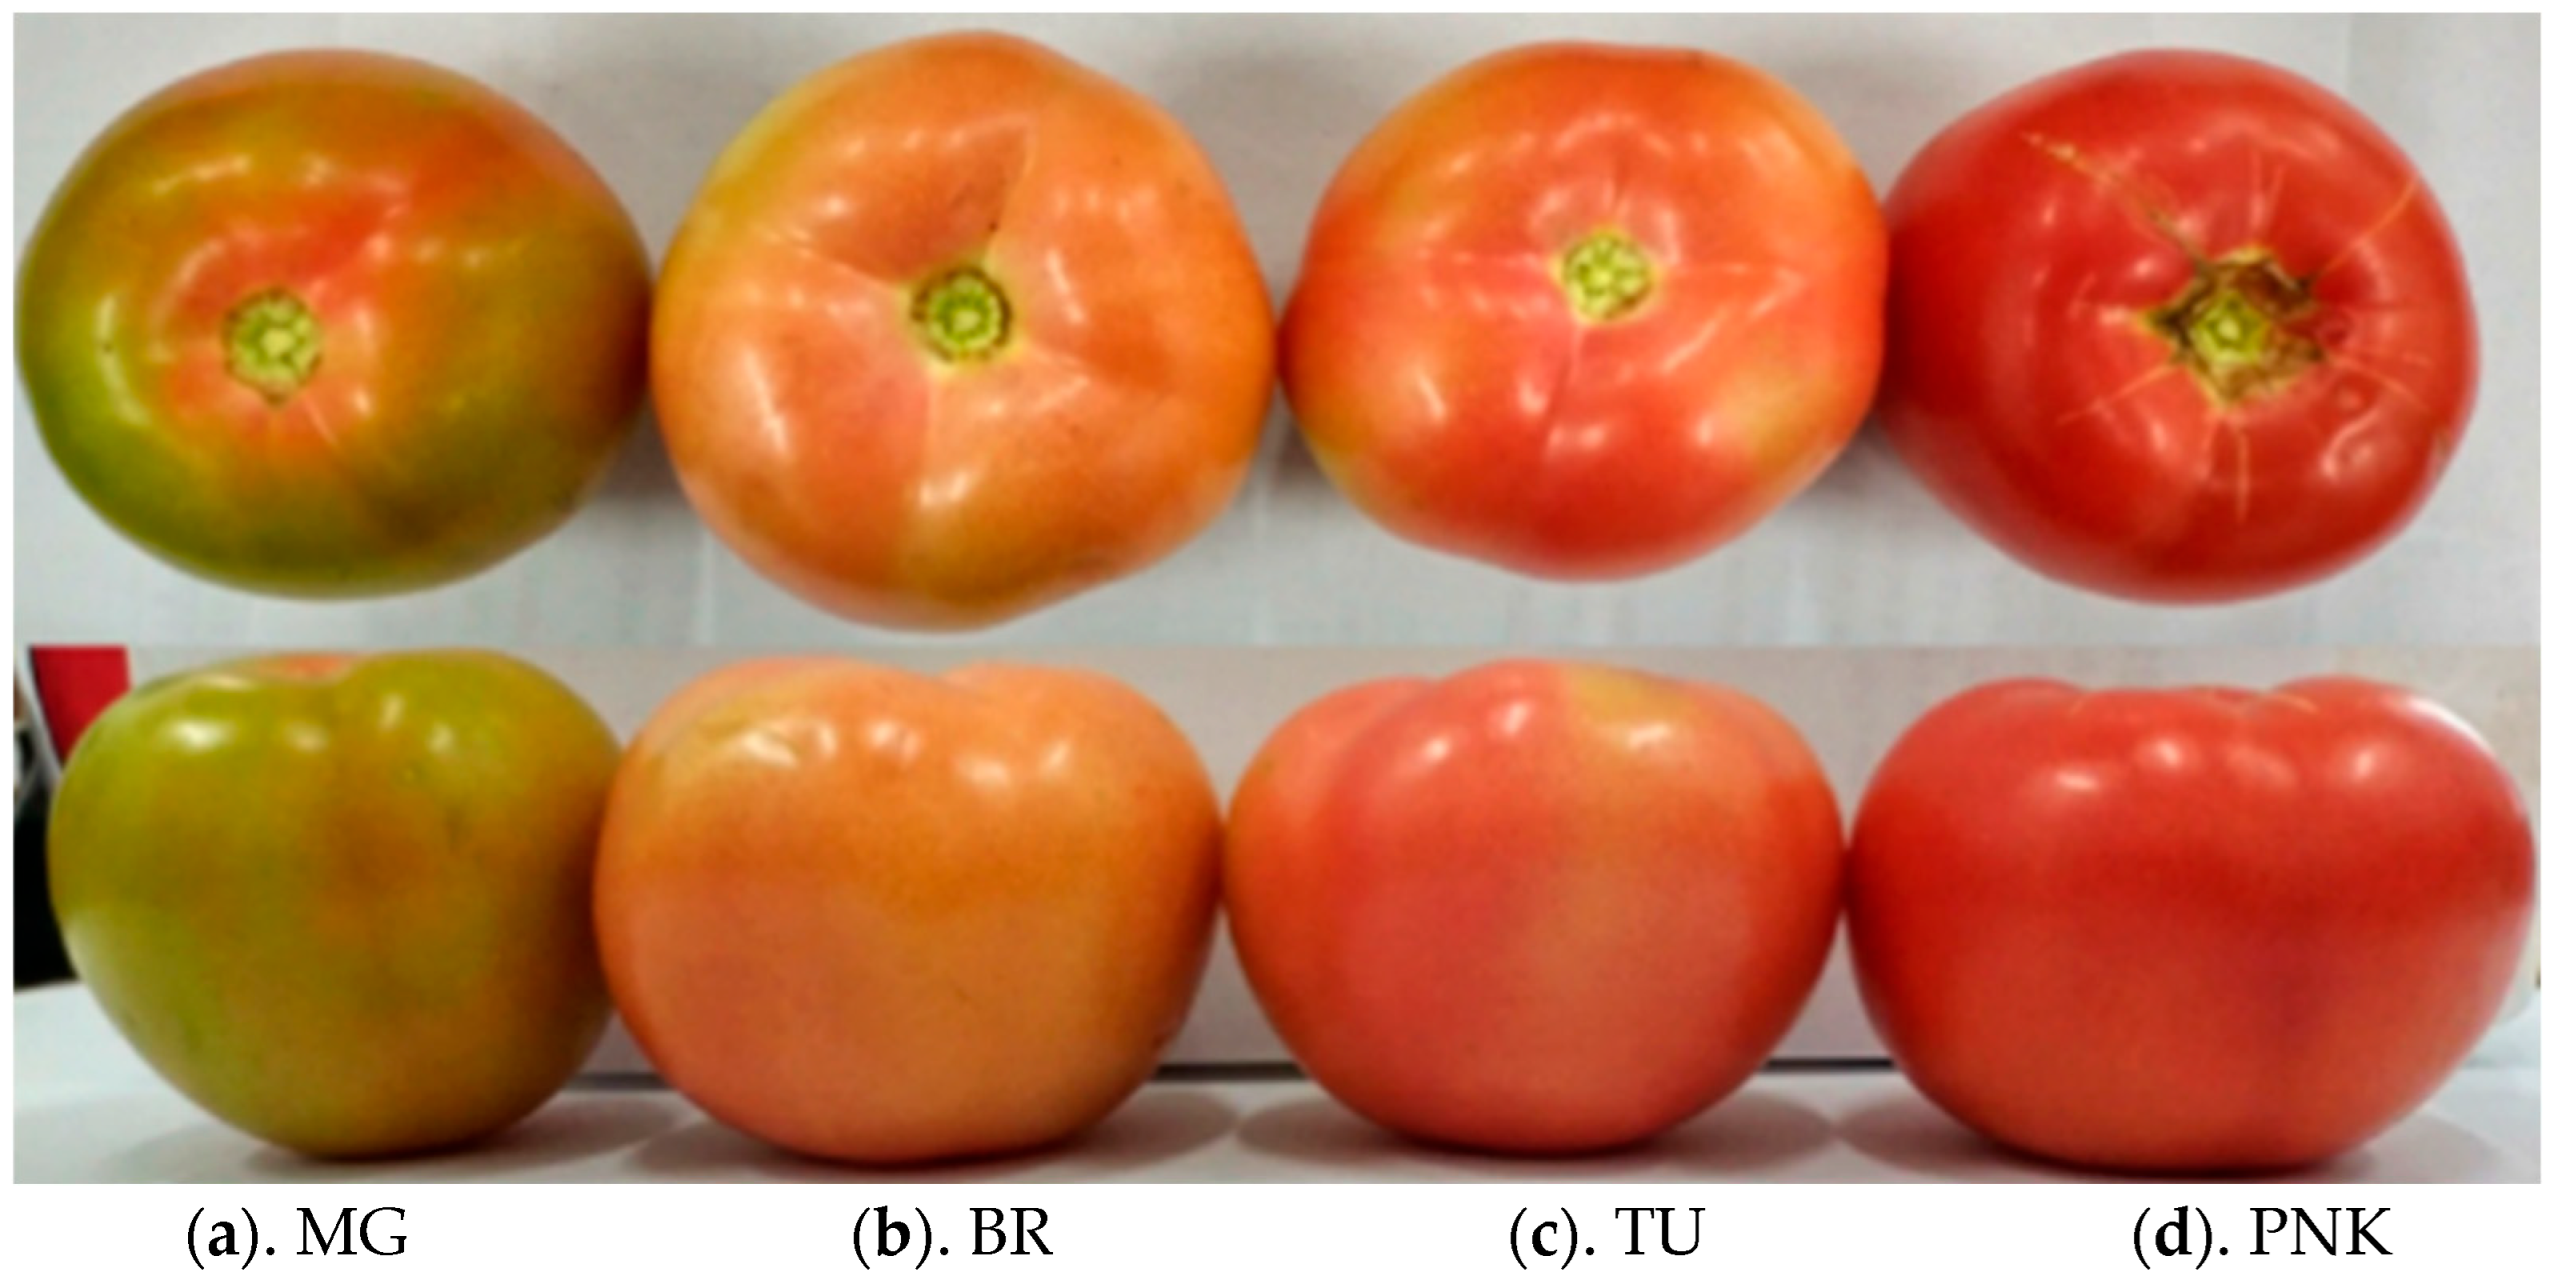
2.2. Tomato Skin Color

The skin color of tomatoes was assessed using a colorimeter (Minolta Chromameter 400, Tokyo, Japan) at various ripening stages at two diametrically opposite spots at the equatorial of the fruit. Using the manufacturer’s recommended white calibration plate, the colorimeter was calibrated. In the L * , a * , b * color space, the color changes were quantified.
Hue angle was calculated from a * and b * values according to the following equation [20]:
H ° = 180 ° + tan 1 ( b * a * )
L * refers to lightness, ranging from 0 = black to 100 = white; the hue angle ( H ° ) value is defined as a color wheel, with red-purple at an angle of 0°, yellow at 90°, bluish-green at 180°, and blue at 270°. The tomatoes were sorted into four different stages using a chlorimeter as a reference guide in the testing process, and then electrical impedance measurements were made.
For electrical impedance testing, multiple healthy tomatoes with similar internal cell states and structures were selected as experimental samples. After obtaining tomatoes from the greenhouse, they were transported directly to the laboratory to achieve room temperature during testing and varying levels of freshness and decomposition during testing at different times.
When judging the degree of tomato decay, the main method is to use perceptual methods: judging from visual inspection, hand feel, odor, and other aspects. Rotten tomatoes exhibit pathological changes in any part. Obviously, for the internal quality inspection of tomatoes, rotten tomatoes should be detected. Each time, the electrode was immersed in a NaCl solution before introducing fruit and then wiped dry to reduce interference.

2.3. Measurements of Electrical Impedance

In this study, a new, and simple device was developed to measure electrical impedance for measuring tomato maturity. Currently, for sorting and picking tomatoes, the end effector mainly uses two picking methods: clip picking and rotary picking [21,22,23]. This study adoptseda rotary rubber pneumatic end effector for tomato sorting, as shown in Figure 2.
Tomato fruits are relatively fragile, and using ordinary rigid claws can easily cause fruit breakage. Therefore, rubber pneumatic end effectors [21,22] are used to meet the physical conditions required for picking and sorting.
The end effector first approaches the tomato in an open state, enveloping it. Then, the air duct is filled with gas and divided into four branch air ducts, allowing the four soft fingers to bend inwards. The end effector gradually returns to a zero state. After applying a certain preload, the inflation is stopped, and a subsequent electrical impedance analysis is conducted. The specific design and workflow of the device is as follows: On each of its four fingers, a force sensor is installed for force measurement. When conducting impedance measurements, the force sensor is used as an electrode, with two injecting currents and the other two collecting voltages. When picking tomatoes, the tomatoes’ clamping force and multi-frequency electrical impedance values are measured simultaneously. The clamping force information is used to construct a force feedback clamping system to ensure non-destructive picking of tomatoes. The multi-frequency electrical impedance information is used for tomato fruit quality analysis, achieving hybrid picking, and sorting operations, reducing the time for tomato picking and sorting and improving the efficiency of the entire tomato-production process.
Figure 2 shows the schematic diagram of the device. Firstly, the RedPitaya development board is connected, and impedance analysis is started. Then, RedPitaya starts collecting feedback data from the port to calculate the electrical parameters of the tomato. Then it starts to analyze the force and use the obtained electrical parameters to compensate for the force measurement, thus obtaining more accurate force.
RedPitaya generates multi-frequency voltage signals during impedance analysis, and the impedance front-end detection circuit board excites the constant current source with multi-frequency voltage signals to generate multi-frequency current signals, which are injected into the tomato. Afterward, the voltage on the tomato is collected using the FSR as an electrode. Therefore, when collecting the voltage signal, it is necessary to consider the partial voltage of the FSR. After fast Fourier transforms of the voltage transform, its amplitude and phase are obtained and then compared with the current injected into the tomato to calculate the tomato’s electrical impedance.
Figure 3 represents the device workflow diagram. Firstly, the three dashed rectangular boxes represent which part of the process inside occurs, such as some processes occurring on RedPitaya and others occurring in the end effector. Secondly, the entire process is as follows: at the beginning, an impedance analysis is performed, and a multi-frequency voltage signal is generated on the RedPitaya development board (C1). This signal stimulates the constant current source on the impedance front-end detection circuit board (C2) to generate a multi-frequency current signal, which is then grabbed by the end effector. At the moment of fitting onto the tomato, the current signal is injected into the tomato, and the voltage is collected through a specially processed FSR. Then, the collected voltage is processed through C2, and the feedback data is calculated on C1 to obtain various electrical parameters of the tomato. Then, (1) the electrical parameters are compared with the already constructed tomato electrical parameter database to obtain the approximate maturity of the tomato. (2) By obtaining a certain electrical parameter (i.e., R3 in the paper) to compensate for force analysis, a more accurate picking force can be obtained.

2.4. Theoretical Basis of Multi-Frequency Measurement

The multi-frequency synchronous measurement method uses broadband excitation signals to obtain bioelectrical impedance information at multiple frequency points simultaneously. The measurement speed is about 2.76 times that of the sweep measurement method [24], which can accurately record the instantaneous impedance spectrum information of a lifetime-varying system at a certain time. This work improves the Multisine synthesis algorithm based on phase iteration optimization by Yang et al. [25] and applies it to impedance measurement on tomatoes. In this work, the harmonic frequencies were 2, 3, 5, 7, 11, 13, 17, 19, 29, 37, 53, 73, 101, 139, 193, 269, 373, 521, 719, and 997 kHz, respectively.
If M ( t ) , a multi-frequency sinusoidal signal, consists of N harmonic components,
M ( t ) = n = 1 N A n sin ( 2 π f n t + θ n )
where, A n , f n , and θ n , respectively, represent the n amplitude, analog frequency, and initial phase M ( t ) of the signal’s second harmonic. In the digital control system, the sampling rate f s is used for M ( t ) discretization,
M ( k ) = n = 1 N A n sin ( 2 π f n f S k + θ n ) ( k = 0 , 1 , , K 1 )
where K is the number of sampling points. At the same time, in order to minimize spectrum leakage and prevent the inability to calculate the amplitude of the signal accurately, it is also necessary to perform full cycle sampling on the output sine signal,
{ f 0 = f S K f n = q n f 0 , ( n = 1 , 2 , , N )
where f 0 represents the q n fundamental frequency and is a positive integer. Finally, to improve the accuracy of the peak factor CF [25,26,27],
K 64 f M A X
where f M A X represents the f n maximum value in.
In summary, in order to facilitate the operation of fast Fourier transforms in experiments, K is generally taken as an exponential multiple of 2, such as 2048 or 4096. After collecting the voltage on the tomato, the sum V is sampled throughout the entire cycle, and then transformed using Fourier transform,
{ Z n = V n I n α n = φ n θ n
where Z n and θ n α n , respectively, represent the amplitude and phase of the measured impedance at the corresponding frequency, V n and φ n represent the amplitude and phase of the collected voltage after fast Fourier transform at the frequency, and I n represents the amplitude and phase of the injected current after fast Fourier transforms at the frequency.
Figure 4 shows a schematic diagram of four electrode measurements, where the yellow part represents the processed force sensor FSR, and the blue part represents the ordinary electrode piece. Current signals are injected through the ordinary electrode piece in the actual measurement process, and FSR collects voltage signals.

2.5. FSR Hybrid Measurement

When picking tomatoes, a certain pre-tightening force is applied to make the FSR sensor on the end effector finger tightly fit the tomato. Firstly, a multi-frequency electrical impedance measurement of the tomato is performed to determine its maturity and corresponding grasping force [28,29]. Then, the resistance value of the FSR is detected to achieve real-time detection of grasping force.
From Figure 5, R 2 shows the equivalent circuit of tomato picking. The dotted circle R 1 represents the bioelectrical impedance equivalent model of a tomato [30,31,32], the resistance under the current force of FSR1, and the resistance under the current force of FSR2. R 4 and C represent the equivalent external and internal fluid resistance and membrane capacitance of the entire biological tissue, respectively. UF1 is the voltage transmitted from FSR1 to the impedance front-end detection circuit board, while UF2 is the voltage transmitted from FSR2 to the impedance front-end detection circuit board.

2.5.1. Electrical Impedance Analysis

According to Figure 5, when a multi-frequency current signal passes through, the impedance of the tomato Z n is:
Z n = R 3 ( R 4 j X c ) R 3 + R 4 j X c = Z ( f n )
X c = 1 2 π f n C
where f n represents the frequency f n of the injected current at this time, and X c represents the reactance of C to the harmonic frequency of the current signal when injecting a multi-frequency sinusoidal current signal.
Equation (7) can also be expressed as:
| Z n | = R 3 R 4 2 + X c 2 ( R 3 + R 4 ) 2 + X c 2
α n = arctan X c R 4 + arctan X c R 3 + R 4
The collected tomato voltage signal is synthesized into a sine signal and meets the requirements:
V n = U F 1 U F 2 = n = 1 N U n sin ( 2 π f n t + φ n )
After processing the multi-frequency current signal and the collected voltage signal, their amplitudes meet the following relationship:
| Z n | + R 1 + R 2 = | V n | | I n | = | Z n |
where | Z n | represents the impedance amplitude f n of the tomato at harmonic frequency, | V n | represents the f n amplitude of the collected voltage at harmonic frequency, and | I n | represents the amplitude of the injected current at f n harmonic frequency.
From Equation (12), it can be seen that the measured multi-frequency impedance data includes the impedance of the tomato itself and the resistance value of the FSR force-sensitive resistor.
Using the measured values obtained from ordinary electrodes as the theoretical impedance values of tomatoes, the relative impedance errors of tomato impedance errors at various frequencies and forces e n can be calculated:
e n = | | Z T | | Z n | | Z T | |
where | Z T | represents the theoretical and | Z n | represents the true impedance amplitude of tomatoes measured using electrode plates and the actual impedance amplitude of tomatoes measured using FSR.

2.5.2. Force Compensation Analysis

The maximum allowable harvesting force for tomato picking during the TU period is based on the experimental data obtained by scholars such as Zhou [33], which is 11.13 N. Tomatoes were subjected to compression experiments using a precision push–pull force gauge, and the results were not significantly different from 11.13 N. Therefore, when picking tomatoes, once the RedPitaya development board detects that the force on the FSR sensor reaches 11.13 N, the digital output port that powers the force analysis module and controls the inflation of the end effector on the RedPitaya will be changed to a low level, that is, the force analysis circuit will be disconnected, and the attitude of the end effector will be fixed.
The brand of the precision push–pull gauge is ZHIQU, as shown in Figure 6, with the following specifications:
  • Measurement unit: N, kgf (gf) or lbf
  • Display: Four-digit LCD
  • Measurable value: peak or random value
  • Sampling rate: 1000 times/s
  • Overload capacity: approximately 120% F.S (LCD flashing alarm at 100% F.S)
  • A/D converter: 24-bit
  • Processor: 16-bit mcu
  • Accuracy: 0.1% F.S
  • Operating temperature: −20 to 40 °C
As shown in Figure 5, when the DC signal passes through the tomato, the impedance of the tomato Z n is:
Z n = Z ( 0 ) = R 3
To enable the force-sensitive resistor to simultaneously act as both FSR and electrode, the insulation film is removed from its sensing area. The relationship between force and resistance of an untreated force-sensitive sensor is:
R s = R 1 + R 2 = k F
Among them, the k value is only related to the material and properties of the force-sensitive sensor and is determined by pre-experiments.
If the force-sensitive sensor is processed and used to collect tomato voltage, the relationship between force and resistance is:
R = R s + R 3 = k F + R 3
Due to the direct current signal injected into the tomato, the total resistance can be directly calculated from the collected voltage and injected current:
R = | Z ( 0 ) |
Therefore, by combining Equations (12), (16), and (17), it can be seen that R measured in real-time is a known quantity. It was k obtained from the pre-experiment and is also known, so as long as the R 3 value is known, the magnitude of the force at this time can be obtained through the equation of these two equations.
At each moment, the duration R s of the injection current signal and the collection voltage signal is extremely short, F , so the force of the end effector on the tomato can be considered constant. Therefore, by combining Equation (15), it can be concluded that the values at different frequencies are equal at this time. From Equations (9) and (10), it can be seen that both equations contain three unknowns: R 3 , R 4 , and X c , respectively. However, due to the large error in the values obtained by α n column equations, equations were chosen to construct equations at different frequencies and solve them R 3 .
By Equation (12), subtracting the equations at four different frequencies, we obtain:
| Z ( f 2 ) | | Z ( f i ) | = | V ( f 2 ) | | I ( f 2 ) | | V ( f i ) | | I ( f i ) | ( i = 3 , 4 , 5 )
These three equations are linearly independent and can solve for multiple sets of R 4 and sum X c 1 values. Select the optimal set from them and use it to substitute it into Equation (16), so that F at this time can be calculated for real-time accurate force detection.

3. Results and Discussion

3.1. Electrical Impedance Detection Test

In order to verify the accuracy of FSR as an electrode for impedance measurement, multiple experiments were conducted on tomatoes at different ripening stages. The measured electrical parameters of tomatoes using the FSR electrode under different forces using the precision push–pull force gauge introduced in Section 2.5.2 may be compared with the electrical parameters measured with ordinary electrodes. Based on the error, it can be determined how to use the FSR electrode to measure the most accurately. The impedance values of tomatoes were measured using the method described in this article and ordinary electrode plates, and the multi-frequency impedance values of tomatoes under different forces were measured, as shown in Figure 7. From Figure 7, the impedance values measured in this article were consistent with the impedance values obtained from ordinary electrode plates at different frequencies. The impedance first increased and then gradually decreased with frequency. The electrical impedance of a tomato was at its maximum value.
As shown in Table 1, Table 2, Table 3 and Table 4, it can be observed that at any time period, as the collection force increased, the measurement error of electrical impedance significantly decreased, with a particularly small error between 2 and 13 kHz.
Under a force of 10 N, the relative error between the actual measured value and the theoretical value of tomatoes started to be less than 10%. Therefore, different tomatoes’ impedance was measured, and their relative error was also calculated as shown in Figure 8. The measured tomatoes were all with harvesting value, namely from the TU and PNK periods. Therefore, in the actual picking experiment, the maximum allowable harvesting force set was greater than 10 N, and constant force was applied to the tomatoes. Comparing the relative error of impedance of different tomatoes, it was found that the error was also relatively small in the 2–13 kHz frequency domain. The results were stable, so combined with Table 1, 3–7 kHz was selected as the 18 parameter solution for the three sets of equations R 3 . Moreover, if the picking force was higher, the end effector made the FSR fit more tightly with the tomato, and the series resistance value became very small. As the force of the end effector increased, that is, as the FSR resistance value decreased until it approached the electrode resistance value, the collected voltage signal curve fitted more closely with the sine curve. Therefore, the tomato complex impedance amplitude calculated using FSR as the electrode was closer to that directly calculated using the electrode. The relative error of impedance amplitude measured under different forces, i.e., different tomatoes, was within 5% when using FSR as an electrode to measure the impedance amplitude in the 3–7 kHz frequency domain.

3.2. Force Detection Test

As shown in Figure 9, a series of fixed positive forces were applied to tomatoes through the precision push–pull gauge. With Equations (15) and (16), the theoretical force was calculated through the formula and compared with the applied force.
Note that when conducting an FSR force measurement, it is necessary to compensate for the impedance value of the tomato in order to accurately measure the resistance value of the force-sensitive resistor.
In Figure 9, the uncompensated force was R 3 = 0 , obtained from the tomato’s resistance. As can be seen from the figure, the difference between the uncompensated force and the output force was significant, and the compensated force curve was basically within the 5% error band of the output force curve, with a small error.

3.3. Maturity Detection Test

Many tomatoes were selected for measurement in each period to obtain the average complex impedance of tomatoes at different frequencies during that period, and then the curve was plotted. In order to ensure the accuracy of the measurement results of tomato electrical parameters during the actual picking process, we set the maximum allowable picking force condition for constructing the tomato electrical parameter database to be the same as the actual picking force of 10 N. This measurement under the same force will make the differentiation results of tomato maturity more reliable. The specific testing method was to place the tomato with FSR on the measurement table of the precision push–pull meter and then rotate the control wheel on the side to make the force-measuring device stick to the surface of the tomato. The control wheel was rotated until the data on the screen was the target force value. Figure 10 shows that the impedance values of tomatoes at different periods under the same frequency excitation were also different, which can well reflect the inherent relationship between tomato maturity and its impedance. During the green and white ripening stages of tomatoes, the impedance values corresponding to different frequencies are basically equal. As tomato maturity deepens, the impedance value at 5 kHz significantly increases, with the highest at the pink stage, approaching 30. Impedance measurements at different frequencies are not comparable; therefore, impedance values at the same frequency should be compared during quality testing. Research [15] also found that as the freshness of tomatoes before decay decreases, their free water is consumed by respiration, and the content of organic acids and pectin gradually decreases, leading to a decrease in the relative dielectric constant and an increase in equivalent impedance. The rules explained in this conclusion are consistent with the impedance values of tomatoes measured and plotted in different periods in this article.
Figure 11 shows the relationship between short-term electrical parameters and the time of pink tomatoes in an electrical impedance measurement. Because most tomatoes are already mature or semi-mature during picking, it is particularly important to focus on analyzing the fluctuation range of tomato electrical parameters during the pink period. The testing conditions were chosen to conduct time-sharing measurements at the same location of the tomato sample at room temperature (20 °C), with the sample exposed to air and the measuring electrode continuously attached to the surface of the tomato. Data was collected every 1 s, and the measured data was plotted to obtain the impedance spectrum of the tomato over time. The graph shows that the impedance spectrum of tomatoes fluctuated slightly with time at a certain frequency, but fluctuated significantly at low frequencies, rising first and then falling. At high frequencies, the changes were not significant and continued to decrease.
A very important reason for this phenomenon is the physiological changes in tomatoes after harvest, which is a complex metabolic process. Physiological reactions such as cell movement and chemical reactions constantly occur inside tomatoes, which can cause changes in the impedance amplitude of tomatoes within a certain range, with respiration being the main factor. The respiration of fruits is generally the process of absorbing oxygen from the air, oxidizing sugars and other substances, breaking them down into carbon dioxide and water, and releasing energy. Under hypoxic and anaerobic conditions, fruits are forced to undergo anaerobic respiration.

3.4. Comparative Experiment on Picking Efficiency

The steps for detecting tomato maturity were as follows: (1) In the beginning, 25 tomatoes were selected for each ripening period using the hue angle. The hue angle values ranged in the MG period from 110 to 115, in the BR period from 104 to 108, in the TU period from 92 to 95), and in the PNK period from 55 to 60. These results are consistent with those of Abdelhamid et al. [34]. (2) The impedance value of the tomato to be picked was measured. (3) The least squares method was used to determine which maturity period the tomato to be picked belonged to. Suppose there was a significant difference in the complex impedance values between the tomato and the white maturity, color transition, and pink stages. In that case, the tomato was included in the review area and waited for the end effector to perform secondary detection or manual discrimination. After considering factors such as transient current instability caused by using FSR as an electrode, the impedance recognition took only 0.6 s. One hundred tomatoes were used for this detection experiment, with 25 tomatoes from each of the four stages (MG, BR, TU, and PNK). Table 5 and Table 6 show the recognition accuracy, with a total recognition accuracy of 95%. After conducting secondary detection of tomatoes in the review area, the total recognition accuracy could reach 97%. In the table, "Identify quantity” indicates how many tomatoes were identified as being in this period, and “Recognition error” indicates how many tomatoes in the identified quantity actually did not belong to this period.
At present, the recognition time and correct recognition rate of mature fruits using machine vision are 7 s and 92.5% [35], respectively. Impedance recognition time was 10 times lower, and the accuracy of one recognition was also 2.5 percentage points higher. Impedance recognition is not affected by lighting conditions, and different results will not be recognized for the same tomato under different lighting conditions. Moreover, visual recognition can only view the external factors of the tomato, but impedance detection can determine the internal quality of tomatoes.

4. Summary and Future Work

4.1. Summary

(1)
In this article, FSR with a removed insulation film was used mainly as the electrode while also retaining the function of force detection. Through experiments, it was evident that tomatoes of the same size and visual maturity had almost the same reference complex impedance frequency curve, which provided a strong theoretical basis for electrical impedance sorting. Combined with a force-detection-based end effector for picking, integration of picking and sorting was achieved, greatly improving the efficiency of tomato production.
(2)
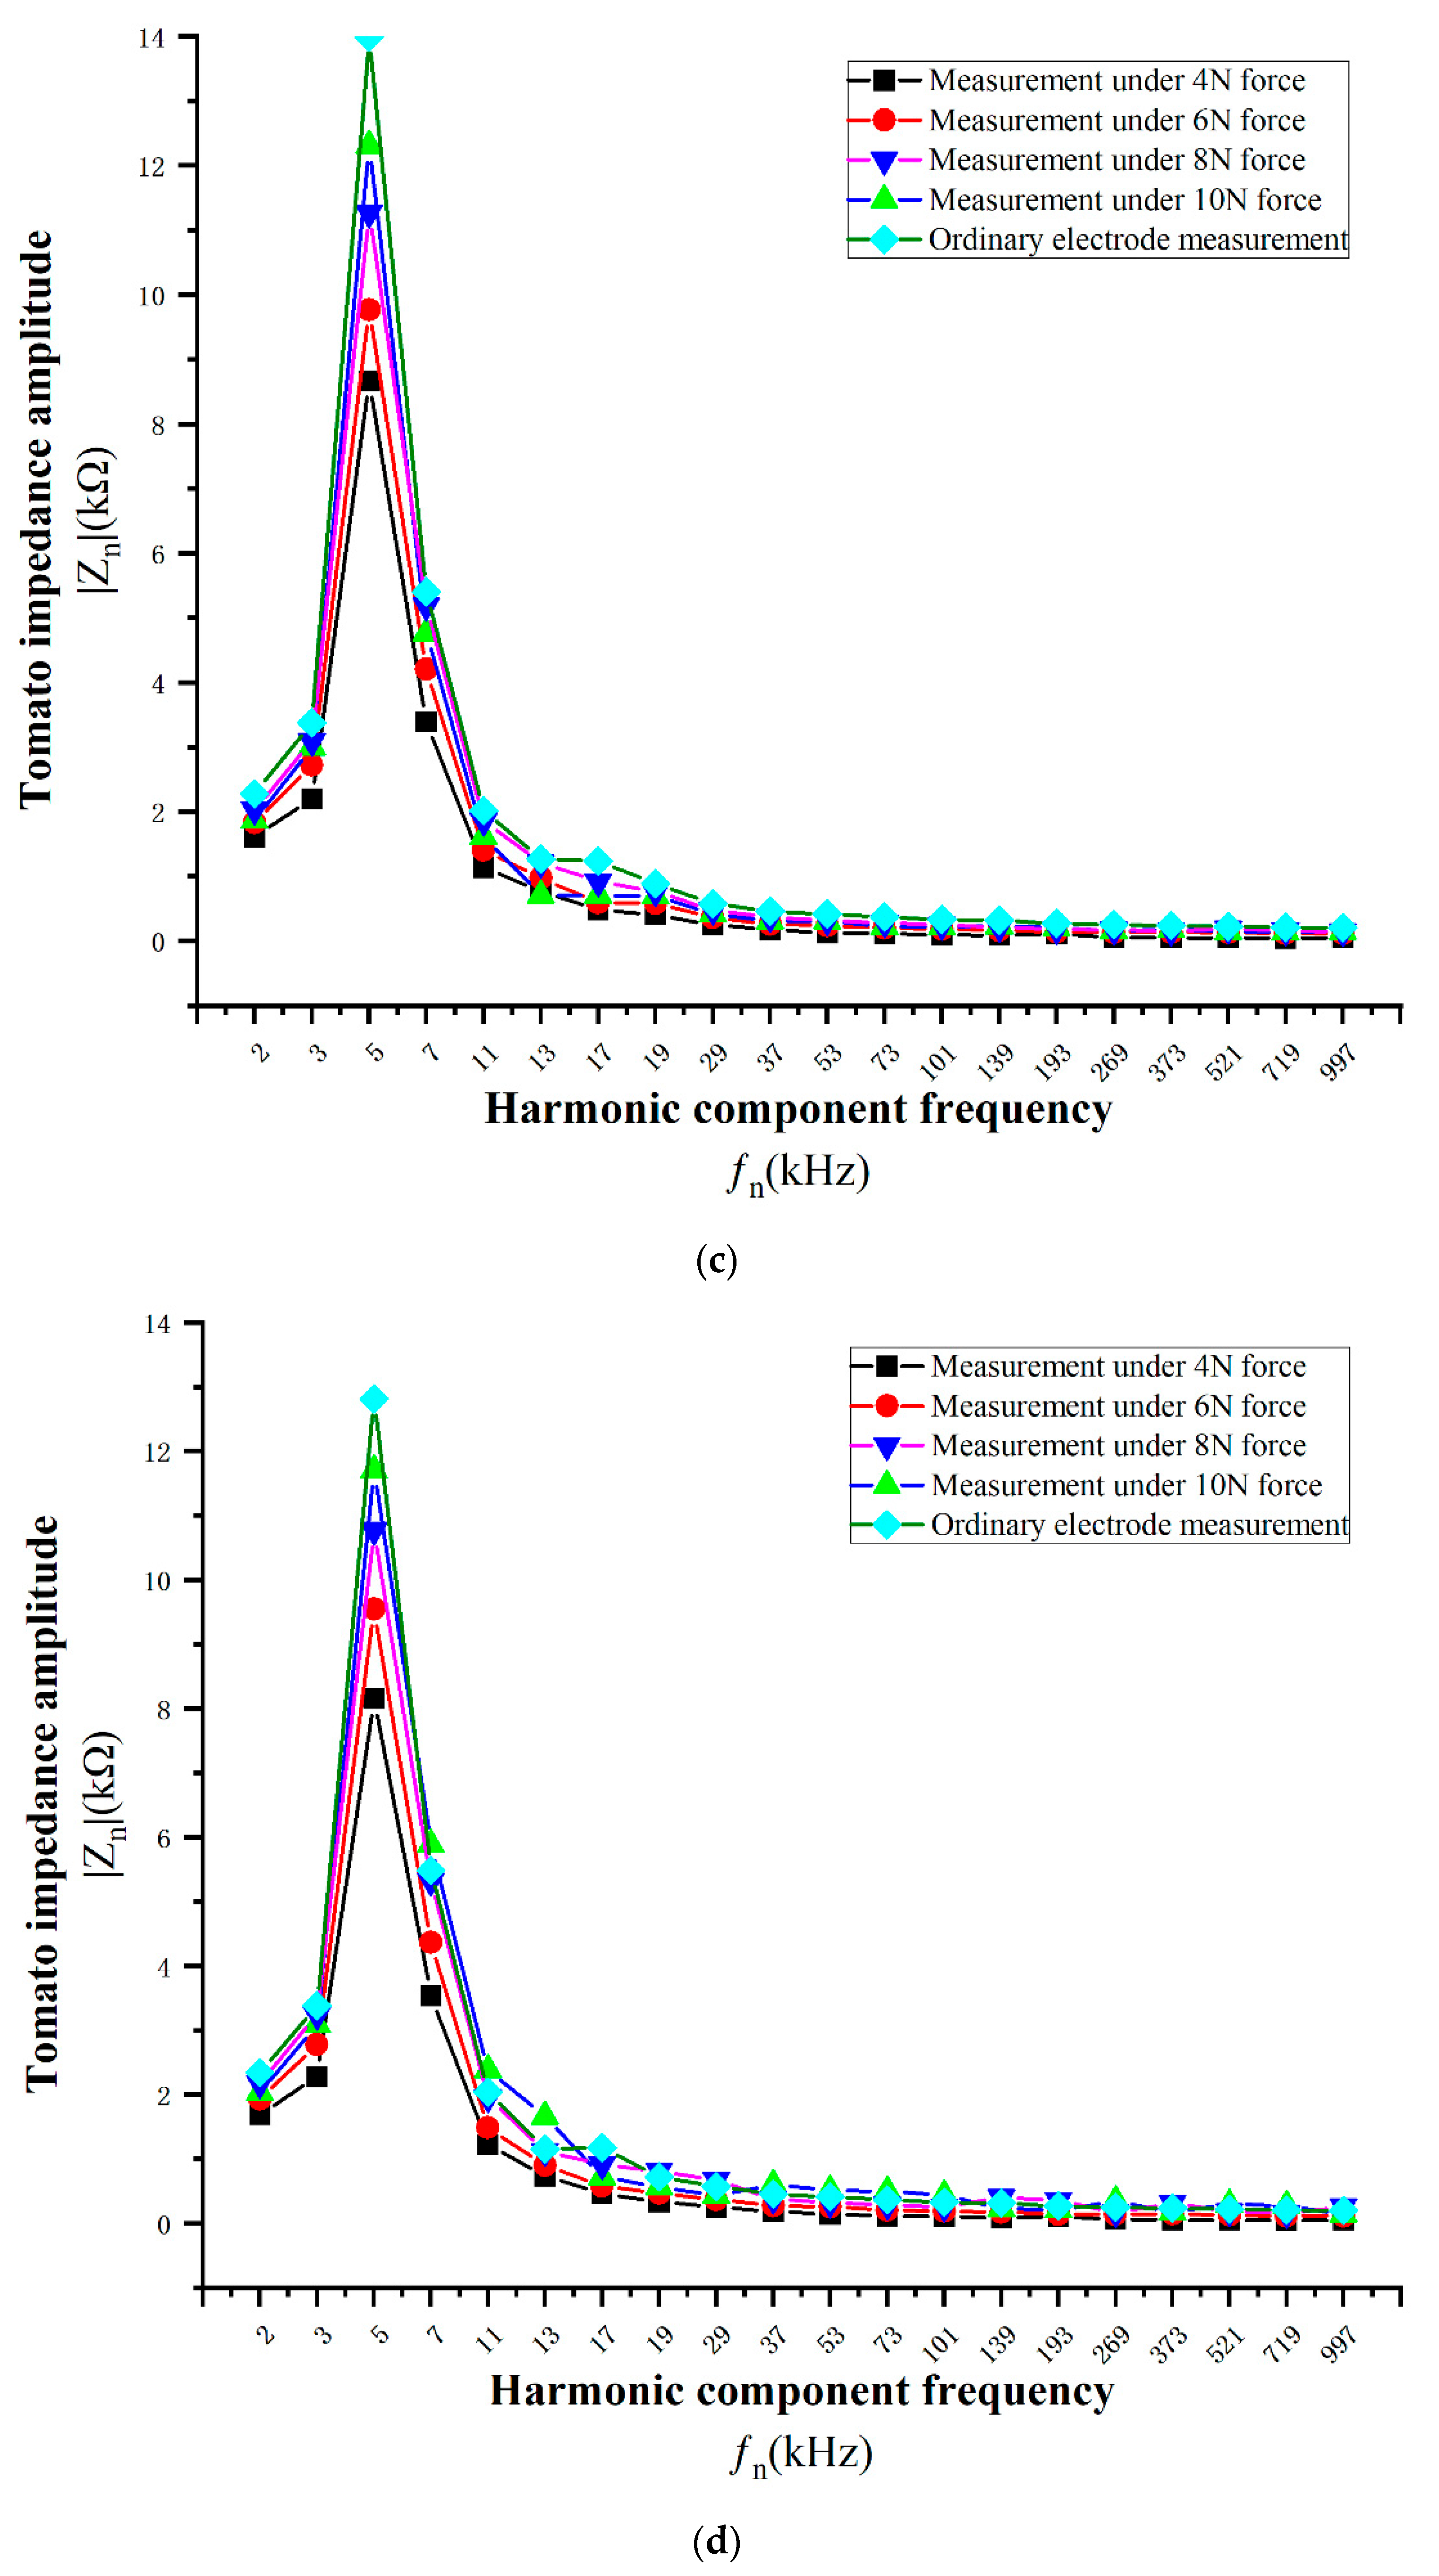
When collecting tomatoes under a force of more than 10 N, the relative error between the electrical parameters obtained from FSR and the values obtained from ordinary electrode plates was within 10%, and within the frequency range of 2–13 kHz, the relative error of impedance values was within 5%.
(3)
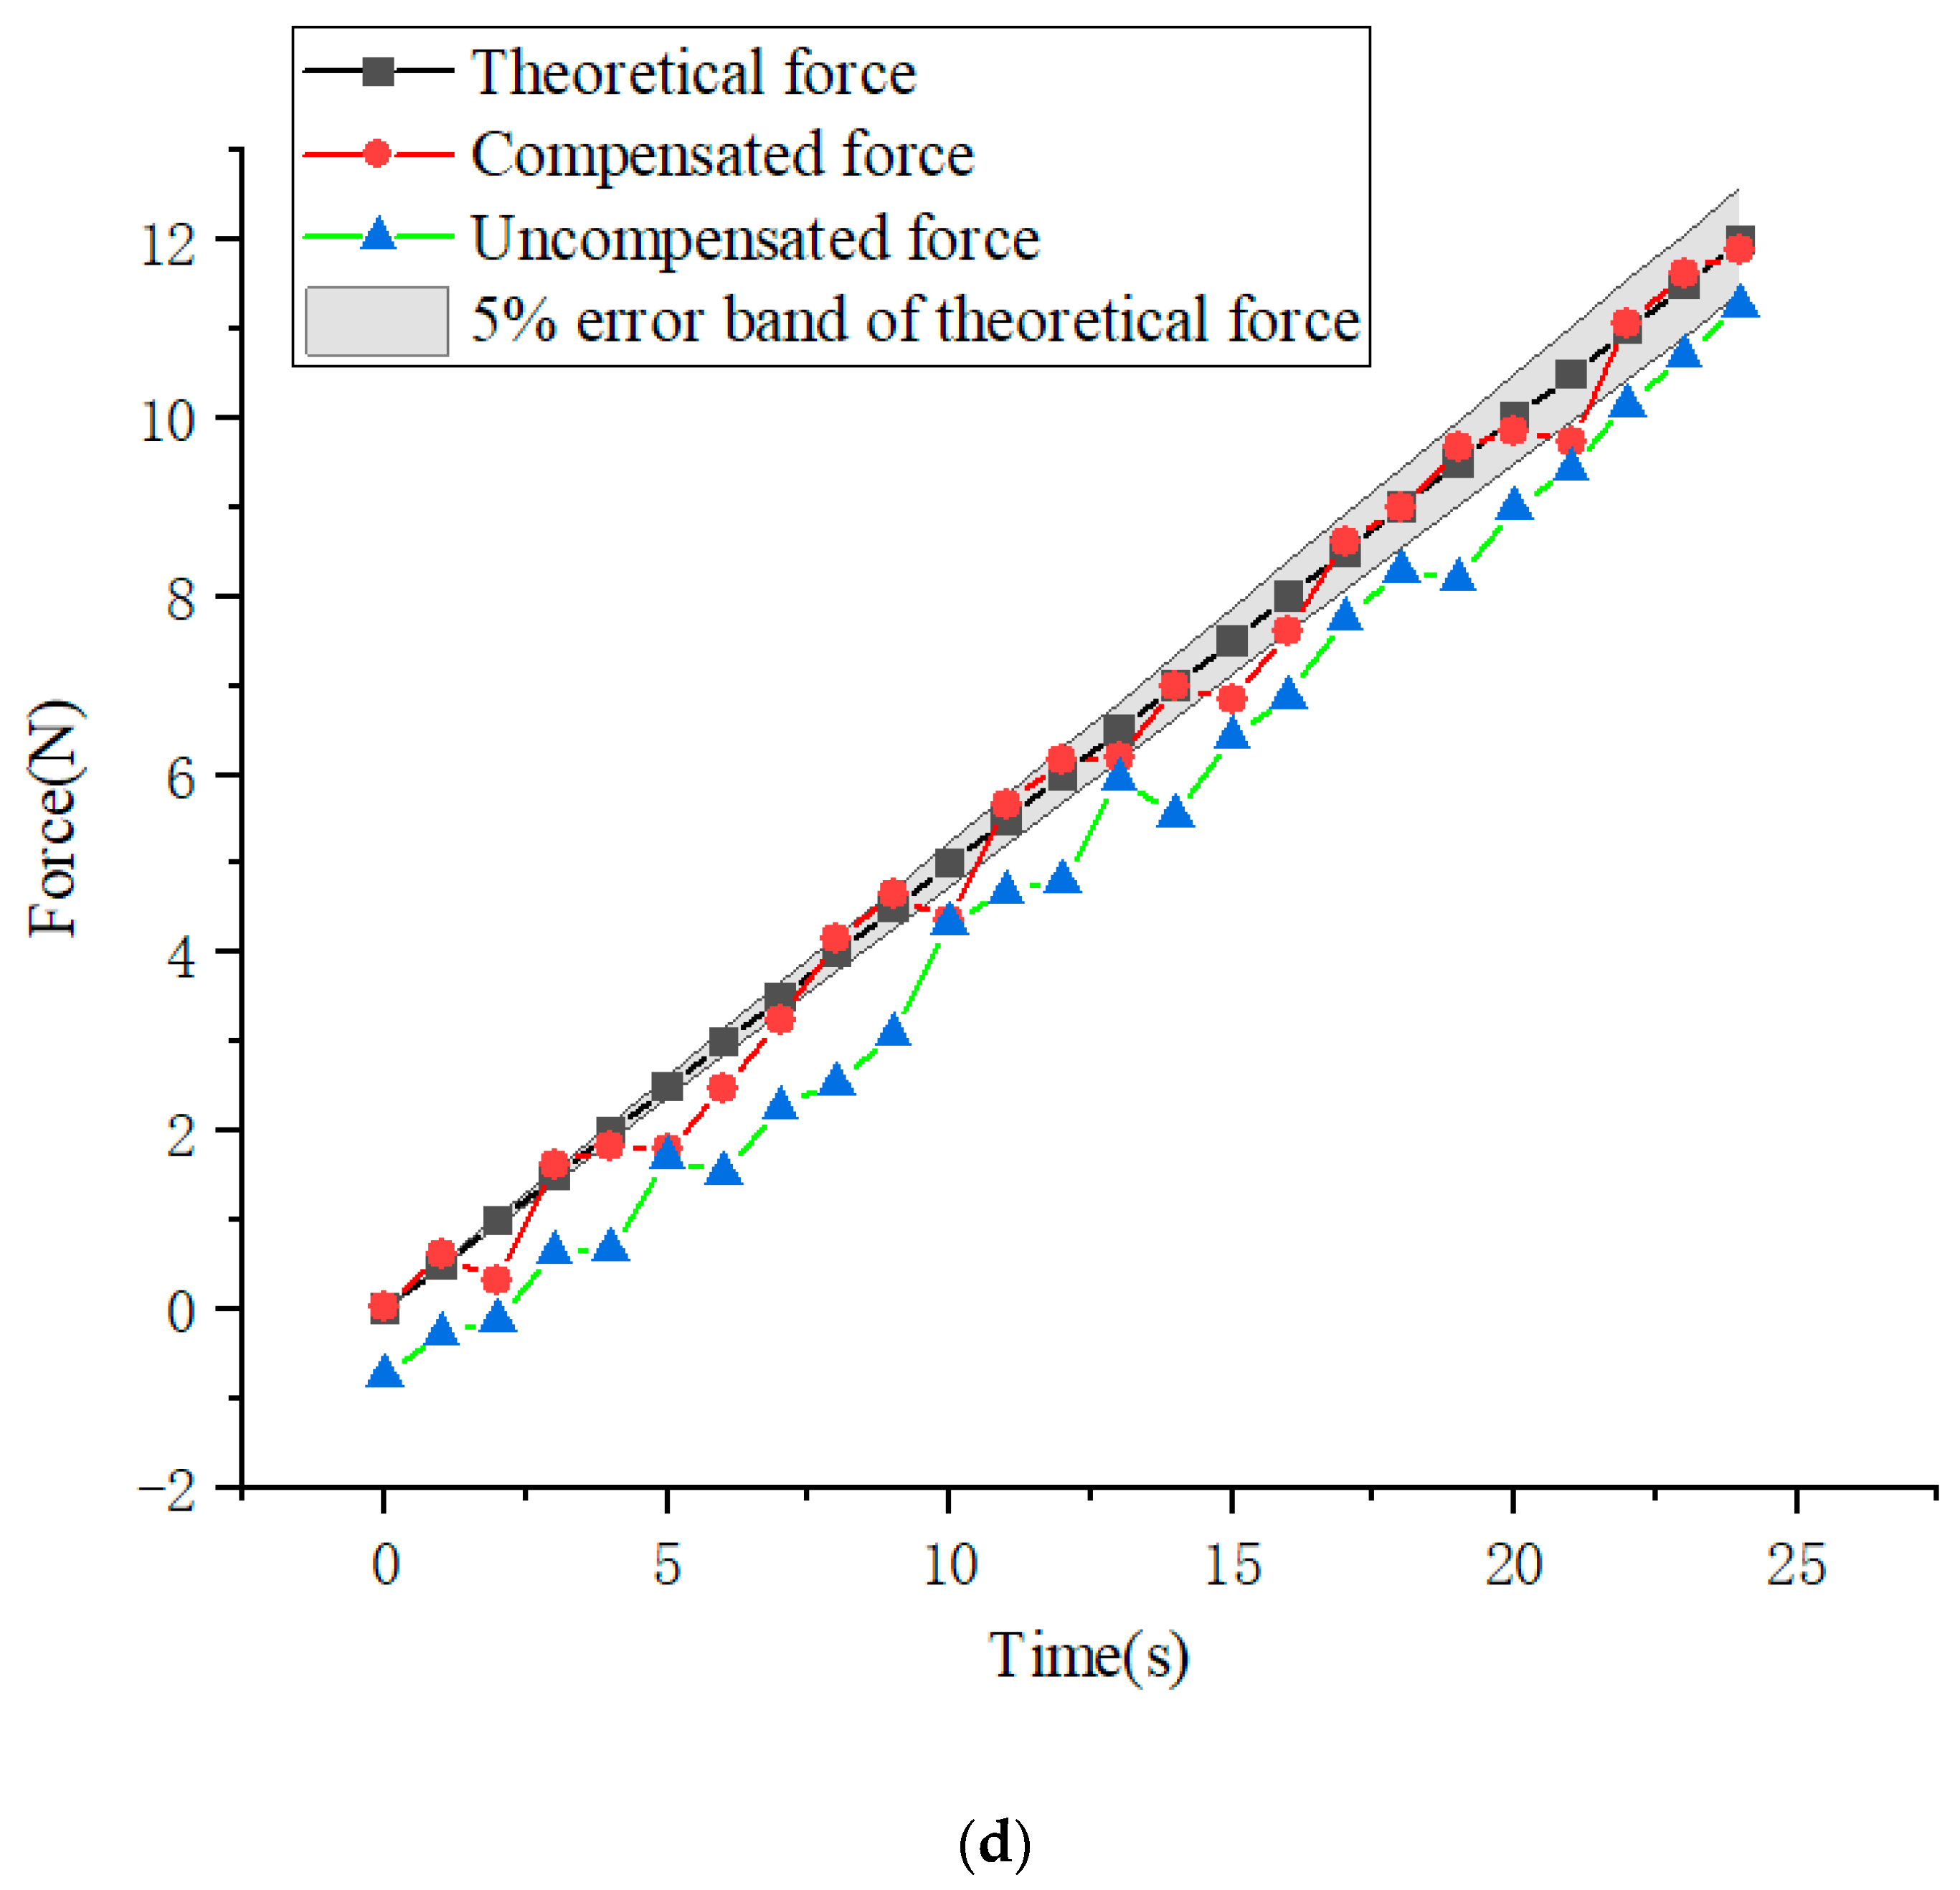
When performing force control compensation, a frequency within 2–13 kHz and its corresponding tomato electrical parameter values should be chosen for a solution. The force calculated through compensation was clearly closer to the true value than the force calculated without compensation.
(4)
When tomatoes were placed for a long time, the impedance value corresponding to 5 kHz significantly increased as their maturity deepened. The impedance value in the pink phase was the highest, approaching 30. When tomatoes were placed for a short time, a series of chemical changes occurred within the tomato cells, which could cause fluctuations in the electrical parameters of the tomato over time.
(5)
The time required for impedance recognition was only 0.6 s, and the total recognition accuracy at one time reached 95%. The time for impedance recognition was 10 times lower than the current time for using machine-vision recognition, and the accuracy of one recognition was also 2.5 percentage points higher. Moreover, impedance recognition is not affected by lighting conditions, and different results will not be recognized for the same tomato under different lighting conditions. Moreover, visual recognition can only use the external performance of the tomato to determine its quality, but impedance detection can judge its internal qualities using the electrical parameters of the tomato.

4.2. Future Work

Future work should focus on transferring the technology of sorting based on electrical impedance to other fruits and vegetables and building a corresponding electrical parameter database, so that other various quality problems can be solved using the biological electrical impedance of fruits and vegetables.
Due to the open indoor conditions of tomatoes in the experiment and the high humidity of air during this period, the probability of penicillium wilt disease was higher. In addition, spot disease and brown rot disease may have also occurred. In fact, tomatoes may experience different diseases simultaneously and exhibit different types of disease characteristics. In the future, conducting in-depth research on the relationship between tomato diseases and pests and electrical parameters is necessary.
The quality of tomatoes is related not only to electrical parameter values but also to volume, water content, and cell activity. Therefore, in the future, detailed and comprehensive consideration is needed.

Author Contributions

Conceptualization, Z.Y.; methodology, Z.Y.; validation, Y.Z., G.C. and M.A.A.; formal analysis, A.A.; resources, A.A. and G.C.; data curation, A.A. and G.C.; writing—original draft, Z.Y.; writing—review and editing, X.W.; visualization, Z.Y.; supervision, X.W.; project administration, Y.Z. and X.W.; funding acquisition, Y.Z. All authors have read and agreed to the published version of the manuscript.

Funding

This research was supported by Jiangsu Agricultural Science and Technology Innovation Fund Project (CX (21) 3148), the Fundamental Research Funds for the Central Universities (YDZX2023007), and Key R&D Program of Jiangsu Province (BE2021016).

Data Availability Statement

The data that were used are confidential.

Acknowledgments

Zizhao Yang would like to thank Yongnian Zhang for the support and Ahmed Amin for patience, company, and encouragement.

Conflicts of Interest

The authors declare that they have no known competing financial interests or personal relationships that could appear to have influenced the work reported in this paper.

References

  1. Wang, Z.; Xun, Y.; Wang, Y.; Yang, Q. Review of smart robots for fruit and vegetable picking in agriculture. Int. J. Agric. Biol. Eng. 2022, 15, 33–54. [Google Scholar]
  2. Zhou, T.; Zhang, D.; Zhou, M.; Xi, H.; Chen, X. System Design of Tomatoes Harvesting Robot Based on Binocular Vision. In Proceedings of the Chinese Automation Congress (CAC), Xi’an, China, 30 November–2 December 2018; pp. 1114–1118. [Google Scholar]
  3. Ansari, S.; Bhattacharya, B. Design and Development of a Tomato Picking Soft Robotic Gripper with a Separator and Mechanical Iris Based Pedicel Cutting Mechanism. In Proceedings of the 6th International Conference on System-Integrated Intelligence (SysInt), Genova, Italy, 7–9 September 2022; pp. 276–286. [Google Scholar]
  4. Guan, Z.; Li, H.; Zuo, Z.; Libo, P. Design a Robot System for Tomato Picking Based on YOLO v5. In Proceedings of the 16th IFAC Symposium on Large Scale Complex Systems—Theory and Applications (LSS), Xi’an, China, 22–24 April 2022; pp. 166–171. [Google Scholar]
  5. Bai, Y.; Mao, S.; Zhou, J.; Zhang, B. Clustered tomato detection and picking point location using machine learning-aided image analysis for automatic robotic harvesting. Precis. Agric. 2022, 24, 727–743. [Google Scholar] [CrossRef]
  6. Gao, G.; Wang, S.; Shuai, C.; Zhang, Z.; Zhang, S. Recognition and Detection of Greenhouse Tomatoes in Complex Environment. Traitement Du Signal 2022, 39, 291–298. [Google Scholar] [CrossRef]
  7. Zheng, T.; Jiang, M.; Li, Y.; Feng, M. Research on tomato detection in natural environment based on RC-YOLOv4. Comput. Electron. Agric. 2022, 198, 107029. [Google Scholar] [CrossRef]
  8. Rong, J.; Wang, P.; Wang, T.; Hu, L.; Yuan, T. Fruit pose recognition and directional orderly grasping strategies for tomato harvesting robots. Comput. Electron. Agric. 2022, 202, 107430. [Google Scholar] [CrossRef]
  9. Jin, Z.; Sun, W.; Zhang, J.; Shen, C.; Zhang, H.; Han, S. Intelligent Tomato Picking Robot System Based on Multimodal Depth Feature Analysis Method. In Proceedings of the 5th International Conference on Environmental Science and Material Application (ESMA), Xi’an, China, 19–20 December 2021. [Google Scholar]
  10. Haggag, M.; Abdelhay, S.; Mecheter, A.; Gowid, S.; Musharavati, F.; Ghani, S. An Intelligent Hybrid Experimental-Based Deep Learning Algorithm for Tomato-Sorting Controllers. IEEE Access 2019, 7, 106890–106898. [Google Scholar] [CrossRef]
  11. Li, J.; Xu, Y.; Zhu, W.; Wei, X.; Sun, H. Maturity assessment of tomato fruit based on electrical impedance spectroscopy. Int. J. Agric. Biol. Eng. 2019, 12, 154–161. [Google Scholar] [CrossRef]
  12. Arteaga, H.; Robleto-Martinez, E.; Silva, A.C.D.S.; Souto, S.; Batista, J.; Costa, E.J.X. Postharvest freezing process assessment of the blueberry structure in three acts: Bioimpedance, color, and granulometry analysis. LWT-Food Sci. Technol. 2021, 151, 112237. [Google Scholar] [CrossRef]
  13. Chowdhury, A.; Bera, T.K.; Ghoshal, D.; Chakraborty, B. Electrical Impedance Variations in Banana Ripening: An Analytical Study with Electrical Impedance Spectroscopy. J. Food Process Eng. 2017, 40, e12387. [Google Scholar] [CrossRef]
  14. Li, M.Q.; Li, J.Y.; Wei, X.H.; Wenjing, Z. Early diagnosis and monitoring of nitrogen nutrition stress in tomato leaves using electrical impedance spectroscopy. Int. J. Agric. Biol. Eng. 2017, 10, 194–205. [Google Scholar]
  15. Bauchot, A.D.; Harker, F.R.; Arnold, W.M. The use of electrical impedance spectroscopy to assess the physiological condition of kiwifruit. Postharvest Biol. Technol. 2000, 18, 9–18. [Google Scholar] [CrossRef]
  16. Al-Ali, A.; Maundy, B.; Allagui, A.; Elwakil, A. Optimum impedance spectroscopy circuit model identification using deep learning algorithms. J. Electroanal. Chem. 2022, 924, 116854. [Google Scholar] [CrossRef]
  17. Buss, E.; Aust, T.; Wahby, M.; Rabbel, T.L.; Kernbach, S.; Hamann, H. Stimulus classification with electrical potential and impedance of living plants: Comparing discriminant analysis and deep-learning methods. Bioinspir. Biomim. 2023, 18, 025003. [Google Scholar] [CrossRef] [PubMed]
  18. Huang, Y.; Liu, Y.; Yang, Y.; Zhang, Z. Assessment of tomato color by spatially resolved and conventional Vis/NIR spectroscopies. Spectrosc. Spectr. Anal. 2019, 39, 3585–3591, (In Chinese with English abstract). [Google Scholar]
  19. Wang, J.; Zhou, Y. Electronic-nose technique: Potential for monitoring maturity and shelf life of tomatoes. J. Agric. Res. 2007, 50, 1219–1228. [Google Scholar] [CrossRef]
  20. López Camelo, A.F.; Gómez, P.A. Comparison of color indexes for tomato ripening. Hortic. Bras. 2004, 22, 534–537. [Google Scholar] [CrossRef]
  21. Bao, G.; Yao, P.; Cai, S.; Ying, S.; Yang, Q. Flexible Pneumatic End-effector for Agricultural Robot: Design & Experiment. In Proceedings of the IEEE International Conference on Robotics and Biomimetics (ROBIO), Zhuhai, China, 6–9 December 2015; pp. 2175–2180. [Google Scholar]
  22. Gao, J.; Zhang, F.; Zhang, J.; Yuan, T.; Yin, J.; Guo, H.; Yang, C. Development and evaluation of a pneumatic finger-like end-effector for cherry tomato harvesting robot in greenhouse. Comput. Electron. Agric. 2022, 197, 106879. [Google Scholar] [CrossRef]
  23. Pei, M.; Xu, K.; Ding, X.; Jiang, S.; Gao, X. Design and Analysis of Continuous Rotating Multifunctional Mechanical Gripper. In Proceedings of the IEEE International Conference on Robotics and Biomimetics (ROBIO), Kuala Lumpur, Malaysia, 12–15 December 2018; pp. 2007–2012. [Google Scholar]
  24. Kallel, A.Y.; Bouchaala, D.; Kanoun, O. Critical implementation issues of excitation signals for embedded wearable bioimpedance spectroscopy systems with limited resources. Meas. Sci. Technol. 2021, 32, 084011. [Google Scholar] [CrossRef]
  25. Yang, Y.; Zhang, F.; Tao, K.; Wang, L.; Wen, H.; Teng, Z. Multi-frequency simultaneous measurement of bioimpedance spectroscopy based on a low crest factor multisine excitation. Physiol. Meas. 2015, 36, 489–501. [Google Scholar] [CrossRef]
  26. Vanderouderaa, E.; Schoukens, J.; Renneboog, J. Peak Factor Minimization Using a Time-Frequency Domain Swapping Algorithm. IEEE Trans. Instrum. Meas. 1988, 37, 145–147. [Google Scholar] [CrossRef]
  27. Vanderouderaa, E.; Schoukens, J.; Renneboog, J. Peak Factor Minimization of Input and Output Signals of Linear-Systems. IEEE Trans. Instrum. Meas. 1988, 37, 207–212. [Google Scholar] [CrossRef]
  28. Kumar, R.; Paul, V.; Pandey, R.; Sahoo, R.N.; Gupta, V.K. Reflectance based non-destructive determination of colour and ripeness of tomato fruits. Physiol. Mol. Biol. Plants 2022, 28, 275–288. [Google Scholar] [CrossRef]
  29. Zhang, Y.; Chen, Y.; Song, Y.; Zhang, R.; Wang, X. Finding the lowest damage picking mode for tomatoes based on finite element analysis. Comput. Electron. Agric. 2023, 204, 107536. [Google Scholar] [CrossRef]
  30. Elwakil, A.S.; Maundy, B. Extracting the Cole-Cole impedance model parameters without direct impedance measurement. Electron. Lett. 2010, 46, 1367–1368. [Google Scholar] [CrossRef]
  31. Maundy, B.; Elwakil, A.S. Extracting single dispersion Cole-Cole impedance model parameters using an integrator setup. Analog. Integr. Circuits Signal Process. 2012, 71, 107–110. [Google Scholar] [CrossRef]
  32. Cole, K.S. Electric Impedance of Suspensions of Spheres. J. Gen. Physiol. 1928, 12, 29–36. [Google Scholar] [CrossRef]
  33. Zhou, K.; Xia, L.; Liu, J.; Qian, M.; Pi, J. Design of a flexible end-effector based on characteristics of tomatoes. Int. J. Agric. Biol. Eng. 2022, 15, 13–24. [Google Scholar] [CrossRef]
  34. Abdelhamid, M.A.; Sudnik, Y.; Alshinayyin, H.J.; Shaaban, F. Non-destructive method for monitoring tomato ripening based on chlo-rophyll fluorescence induction. J. Agric. Eng. 2021, 52, 1. [Google Scholar]
  35. Liu, J. Research progress analysis of greenhouse harvesting robot technology. Trans. Chin. Soc. Agric. Mach. 2017, 48, 1–18, (In Chinese with English abstract). [Google Scholar]
Figure 1. Tomato ripening stages under study: (a) green ripening period, (b) white ripening period, (c) color transformation period, and (d) pink ripening period.
Agronomy 13 01778 g001
Figure 2. Schematic diagram of the experimental platform.
Agronomy 13 01778 g002
Figure 3. Device workflow diagram.
Agronomy 13 01778 g003
Figure 4. Schematic diagram of four-electrode measurement.
Agronomy 13 01778 g004
Figure 5. Circuit diagram for collecting tomato voltage.
Agronomy 13 01778 g005
Figure 6. Precision pushing and pulling force gauge.
Agronomy 13 01778 g006
Figure 7. Relationship between tomato impedance amplitude and frequency under different forces at different ripening stages: (a) MG period; (b) BR period; (c) TU period, and (d) PNK period.
Agronomy 13 01778 g007aAgronomy 13 01778 g007b
Figure 8. Relative impedance error of different ripening periods.
Agronomy 13 01778 g008
Figure 9. Comparison between the measured force obtained by the developed device, the actual force and the uncompensated measured force when conducting force compensation experiments on tomatoes during different ripening periods: (a) MG; (b) BR; (c) TU, and (d) PNK period.
Agronomy 13 01778 g009aAgronomy 13 01778 g009bAgronomy 13 01778 g009c
Figure 10. Magnitude of tomato impedance at different ripening stages.
Agronomy 13 01778 g010
Figure 11. Changes in short-term impedance of tomatoes with frequency and time at different ripening periods: (a) MG; (b) BR; (c) TU; and (d) PNK period.
Agronomy 13 01778 g011aAgronomy 13 01778 g011b
Table 1. Relative error of impedance amplitude of tomatoes under different pickup forces during the MG period.
Frequency (kHz)4 N Force6 N Force8 N Force10 N Force
235.51%26.68%23.74%14.21%
336.21%27.15%11.10%6.04%
542.07%34.61%13.39%24.89%
740.32%21.42%10.88%16.78%
1152.02%34.34%22.76%10.87%
1349.89%31.32%47.52%9.45%
1765.49%64.29%42.45%23.64%
1966.82%45.54%30.41%25.78%
2962.19%49.94%28.54%22.48%
3767.66%51.96%32.21%29.33%
5376.09%42.70%34.94%27.84%
7378.37%53.30%51.55%25.49%
10176.29%44.69%47.08%25.23%
13982.73%45.55%36.81%31.43%
19364.77%53.37%28.36%39.34%
26988.86%53.91%46.25%32.90%
37391.94%49.71%26.26%43.28%
52185.11%53.11%34.30%18.85%
71978.42%55.66%34.25%37.02%
99787.44%56.07%40.16%34.18%
Mean of Error66.41%44.77%32.15%24.95%
Table 2. Relative error of impedance amplitude of tomatoes under different pickup forces during the BR period.
Frequency (kHz)4 N Force6 N Force8 N Force10 N Force
233.98%19.01%17.43%8.77%
338.53%22.17%15.76%4.72%
542.10%35.35%9.72%24.90%
741.53%22.22%11.07%10.44%
1141.32%30.06%18.02%13.53%
1341.25%25.33%49.81%9.89%
1765.17%56.25%44.49%24.05%
1959.93%40.58%22.87%17.83%
2960.63%41.00%24.52%23.37%
3761.07%39.85%31.65%23.98%
5367.46%40.16%31.14%25.01%
7368.80%45.47%38.82%27.37%
10169.66%48.63%35.46%25.05%
13980.73%48.10%27.56%37.44%
19364.88%51.28%24.76%37.26%
26981.55%48.31%45.88%38.47%
37385.45%45.76%29.22%40.20%
52180.68%51.33%35.51%16.51%
71981.62%51.21%35.56%27.99%
99780.91%47.10%38.28%33.96%
Mean of Error62.36%40.46%29.38%23.54%
Table 3. Relative error of impedance amplitude of tomatoes under different pickup forces during the TU period.
Frequency (kHz)4 N Force6 N Force8 N Force10 N Force
229.07%19.36%17.67%10.80%
334.88%19.50%11.19%8.47%
538.04%30.17%12.02%19.51%
737.28%22.13%11.82%3.92%
1143.78%30.36%19.96%7.58%
1339.81%23.48%44.38%4.59%
1761.22%52.21%43.15%25.73%
1954.53%34.60%21.53%13.58%
2957.02%37.83%28.31%18.07%
3762.87%42.87%32.80%20.78%
5370.03%42.68%26.95%23.72%
7368.94%46.26%39.56%22.68%
10172.81%44.00%32.56%24.64%
13972.25%47.21%27.33%31.52%
19361.76%49.67%23.27%34.36%
26977.84%46.41%40.12%32.74%
37381.15%42.80%26.33%36.42%
52179.83%42.24%36.18%18.12%
71980.70%45.11%33.55%24.24%
99775.18%43.50%28.73%29.10%
Mean of Error59.95%38.12%27.87%20.53%
Table 4. Relative error of impedance amplitude of tomatoes under different pickup forces during the PNK period.
Frequency (kHz)4 N Force6 N Force8 N Force10 N Force
227.78%17.56%13.07%7.08%
332.58%17.91%8.67%4.09%
536.38%25.52%8.63%15.94%
735.50%20.42%7.38%2.90%
1140.11%27.03%16.84%4.02%
1336.48%21.92%44.18%3.19%
1760.55%50.98%38.54%22.42%
1953.54%34.32%21.31%12.37%
2956.22%35.65%24.29%17.27%
3758.75%39.55%31.19%17.03%
5365.77%37.77%24.80%21.64%
7368.67%44.35%36.65%20.84%
10168.23%41.37%32.49%22.09%
13971.70%43.66%26.54%30%
19359.99%46.62%22.52%31.07%
26974.76%43.97%36.85%31.39%
37377.69%38.13%25.84%32.57%
52177.14%41.55%33.15%15.21%
71976.39%44.92%32.90%24.18%
99773.90%42.85%28.70%28.68%
Mean of Error57.61%35.80%25.73%18.20%
Table 5. Tomato primary recognition accuracy.
Maturity PeriodMGBRTUPNKRe-Check
Total number of tomatoes252525250
Identify quantity262424242
Recognition error1101
Total recognition accuracy95%
Table 6. Tomato secondary recognition accuracy rate.
Maturity PeriodMGBRTUPNKRe-Check
Total number of tomatoes252525250
Identify quantity262525240
Recognition error2100
Total recognition accuracy97%
Disclaimer/Publisher’s Note: The statements, opinions and data contained in all publications are solely those of the individual author(s) and contributor(s) and not of MDPI and/or the editor(s). MDPI and/or the editor(s) disclaim responsibility for any injury to people or property resulting from any ideas, methods, instructions or products referred to in the content.

