Article

Postharvest Preservation of Flammulina velutipes with Isoamyl Isothiocyanate

1
Department of Vegetables, College of Horticulture, China Agricultural University, Beijing 100193, China
2
Biotechnology and Genetic Germplasm Resources Research Institute, Yunnan Academy of Agricultural Sciences, Kunming 650205, China
3
Institute of Plant Protection, Xinjiang Academy of Agricultural Sciences, Urumqi 830091, China
*
Author to whom correspondence should be addressed.
These authors contributed equally to this work.
Agronomy 2023, 13(7), 1771; https://doi.org/10.3390/agronomy13071771
Submission received: 27 May 2023 / Revised: 21 June 2023 / Accepted: 28 June 2023 / Published: 29 June 2023

Abstract

:
Flammulina velutipes was treated with 10, 50, and 250 μL L−1 isoamyl isothiocyanate (IAITC), and effects on quality preservation were assessed. IAITC displayed positive effects during the storage of F. velutipes: (i) maintained tissue integrity, reduced weight loss rates; (ii) reduced browning degree by inhibiting the activities of browning-related enzymes; (iii) enhanced activities of two antioxidant enzymes (superoxide dismutase and catalase) and increased ascorbic acid content; (iv) ameliorated microbial spoilage by inhibiting bacterial growth, especially Serratia, a major bacterial community on the surface of F. velutipes; (v) enhanced chitin content and thereby maintained structural integrity; and (vi) maintained levels of Asp, Glu, linoleic acid, and polyunsaturated fatty acids. In conclusion, IAITC reduced catalase activity and total phenolic content in F. velutipes during storage. The most suitable concentration of IAITC in the preservation of F. velutipes was 50 µL L−1.

1. Introduction

Flammulina velutipes, with its high nutrient content and organoleptic and medicinal properties, is the fourth most highly consumed mushroom species worldwide [1] and China has become the largest producer of F. velutipes [2]. However, F. velutipes also poses a great challenge while increasing the income of mushroom growers: it is a very perishable food product. Because of the thin epidermis of its fruiting bodies, F. velutipes is prone to spoilage by microorganisms and loss of moisture. Increased respiration rate of the fruiting bodies after harvest leads to browning, cap opening, stipe elongation, decreasing firmness, and nutrient content loss in F. velutipes [3]. Thereby, the quality of appearance and nutrition for F. velutipes decrease rapidly within a few days. A proper approach to extend postharvest quality of F. velutipes is required.
Postharvest preservation techniques, including physical and chemical methods, play an important role in maintaining postharvest quality and extending the shelf life of F. velutipes. Low-temperature preservation is the most common way to store mushrooms, but it needs to be combined with other methods because of incomplete bacterial inhibition [4]. Nanopackaging and plasma treatment are also effective for postharvest preservation [5,6], but high costs of equipment requirements and production are major challenges. Spraying of an antibacterial agent and 1-methylcyclopropene (1-MCP) is the main chemical method, which is a recent advance in postharvest quality preservation of the golden needle mushroom (F. velutiper). However, sprayed mushrooms will have higher moisture content on their surface, which makes microbial attack easier [7] and may reduce consumer’s acceptance even if they are safe. Therefore, increasing concerns with food safety and environmental protection have also stimulated interest in novel preservative for F. velutipes preservation.
Isothiocyanates (ITCs) are plant essential oils (EOs) that are of interest in food preservation because of their natural, biodegradable, relatively safe, and antimicrobial properties [8,9]. Various ITCs have been explored concerning their effect on preserving postharvest product quality. Allyl isothiocyanate (AITC) displays biocidal activity against pathogenic microorganisms [10], and helps maintain weight and enhances antioxidant properties of mulberry (Morus alba) fruit [11]. AITC treatment also maintains a lower decay rate in blackberry (Rubus spp.) caused by Botrytis cinerea [12]. Benzyl isothiocyanate (BITC) inhibits growth of B. cinerea and postpones decay of postharvest strawberry [13]. ITCs are promising safe agents owing to their natural properties, antimicrobial activity, and health benefit. However, the application of ITCs for postharvest mushroom preservation has not been systematically investigated. Isoamyl isothiocyanate (IAITC) is one of isothiocyanates (ITCs) derived from Brassicaceae plants, including Armoracia lapathifolia, Brassica juncea, and others. Based on the antimicrobial effect of IAITC against microorganisms [14], the effects of IAITC on postharvest preservation of F. velutipes during storage for 8 d at 6 °C and 90% relative humidity was analyzed.

2. Materials and Methods

2.1. Reagents

Isoamyl isothiocyanate (IAITC) was sourced from 3B Scientific Co. (Wuhan, China). Glutaraldehyde, catechol, guaiacol, L-dopa, pyrogallol, Folin–Ciocalteu reagent, gallic acid, trichloroacetic acid (TCA), and thiobarbituric acid (TBA) were from Sigma-Aldrich (St. Louis, MO, USA). Other reagents were of analytical grade.

2.2. Sample Preparation

Fresh F. velutipes mushrooms were from Xiangyunxinglong mushroom plant (Beijing, 40° N, 116° E) and transported to the Laboratory of Medical and Edible Fungi in China Agricultural University within 1 h. Mushrooms free from physical damage were selected by bundle weight at 400 ± 20 g and length at 15.5 ± 0.5 cm.

2.3. Treatment Preparation

Three doses of IAITC (80, 400, 2000 µL) were spotted onto gauze pads laid at the bottom of 8 L polystyrene containers with a lid. Three bundles of mushroom (~1200 g) were placed in the containers, which were kept at 25 °C for 15 min to let IAITC volatilize. Thus, the concentrations of IAITC in the containers were 10, 50, and 250 µL L−1, and they were termed groups I, II, and III, respectively. Each group contained 4 containers and opened one container to sampling every other day. The opened container would be abandoned after sampling because of the change in IAITC concentration. Blank controls (termed group CK) were treated with deionized water rather than IAITC solution. All containers were stored at 6 °C and 90% relative humidity for eight days.
At each time of sampling, one container was opened randomly at day 2, 4, 6, and 8 and 150 g mushroom was taken from three bundles of F. velutipes as three replicates. The weight loss rate, browning degree, appearance, microstructure, and microbiological analysis were analyzed immediately after harvesting and sampling. Other samples were stored at −80 °C for further analysis.

2.4. CO2 Concentration

CO2 concentration in containers was determined by gas chromatography (model TP-2060, Beifentianpu, Beijing, China) every two hours until 172 h and expressed as percentage.

2.5. Weight Loss and Browning Degree

Mushrooms were weighed before and after the storage period, and the weight loss rate was calculated by using Formula (1):
Weight loss rate (%) = (W0 − Wt)/Wt × 100%
where W0 is initial weight and Wt is weight after storage.
Browning degree was determined by spectrophotometry [15]. Mushrooms (2 g) were ground with 10 mL phosphate buffer (0.1 M, pH 6.8) and centrifuged at 13,000× g for 20 min. Absorbance of the supernatant at wavelength 420 nm (abbreviated A420) was measured, and the browning degree was calculated by using Formula (2):
Browning degree = (A420 × 10)/fresh weight

2.6. Histological Microstructure

2.6.1. Histological Section

For light microscopic observation, tissue pieces (~10 × 5 × 2 mm) were collected from the stipe surface and fixed with formaldehyde/acetic acid/ethanol fixative (FAA). Fixed tissues were dehydrated by ethanol series (65, 75, 85, 95, 100% v/v), immersed in paraffin for 40 min, and embedded using a YB-6LF system (Yaguang Co.; Hubei, China). Thin sections (2.5 µm) were cut by rotary microtome (model HM 340E, Thermo Scientific; Hennigsdorf, Germany), stained with Safranin O/Fast Green [16], and observed with light microscope (model Axio Vert A1, Zeiss; Oberkochen, Germany) at ×400 magnification.

2.6.2. Scanning Electron Microscopy (SEM)

Tissues were collected from the stipe, immersed in 2.5% (v/v) glutaraldehyde for 3 h, washed for 15 min with 0.1 mL phosphate buffer (pH 7.0) 3×, and dehydrated by ethanol series (30, 50, 70, 80, 90, 100% v/v). Thick slices (0.5 mm) were cut, coated with a gold layer by carbon coater (model IB-3, Eiko; Tokyo, Japan), and observed by SEM (model S-3400N, Hitachi; Tokyo, Japan) at ×500 magnification [3].

2.7. Chitin Content

A lyophilized mushroom sample (3 g) was ground, mixed with 90 mL NaOH (1 M), stirred at 80 °C for 2 h, and the alkali-insoluble residue (AIR) was washed with deionized water and centrifuged (8000× g, 10 min). The wash/centrifuge cycle was repeated several times until reaching neutral pH, and AIR was lyophilized. To isolate chitin, 1 g AIR was added with 100 mL of 2% (v/v) acetic acid, stirred at 95 °C for 6 h, centrifuged as above, washed with deionized water until reaching neutral pH, and lyophilized. Chitin content was determined by weighing [17].

2.8. Enzyme Activities

Mushroom samples (2 g) were ground with 20 mL phosphate buffer (50 mM, pH 7.0), centrifuged (13,000× g, 4 °C, 20 min), and the supernatant collected as crude enzyme extract for analysis of polyphenol oxidase (PPO), tyrosinase (TYR), peroxidase (POD), catalase (CAT), and superoxide dismutase (SOD).

2.8.1. PPO Activity

The crude enzyme solution of 0.5 mL was mixed with 2 mL phosphate buffer (50 mM; pH 7.0) and 1 mL catechol (50 mM). One unit of PPO activity was defined as the amount of enzyme resulting in A410 increase rate of 0.001/min. PPO activity was expressed as U mg−1 protein [18].

2.8.2. TYR Activity

L-dopa was used as substrate, and dopachrome formation was monitored at 475 nm [19]. L-dopa solution (0.1% (w/v)) of 3 mL prepared in phosphate buffer (0.1 M, pH 6.8) was mixed with crude enzyme of 1 mL, and A475 measured immediately (one time/min for 3 min). One unit of TYR activity was defined as the amount of enzyme resulting in A475 increase rate of 0.001/min. TYR activity was expressed as U mg−1 protein.

2.8.3. POD Activity

Assay solution (0.2 mL crude enzyme, 1 mL phosphate buffer (50 mM, pH 7.0), 0.8 mL guaiacol (0.2%, v/v), 1 mL H2O2 (0.3%, v/v)) was incubated at 35 °C for 3 min, and A470 was measured at 30 s intervals for 2 min. One unit of POD activity was defined as the amount of enzyme resulting in A470 increase rate of 0.01/min. POD activity was expressed as U mg−1 protein [18].

2.8.4. CAT Activity

The crude enzyme solution of 0.5 mL was mixed with 1 mL phosphate buffer (50 mM, pH 7.0) and 0.3 mL H2O2 (0.2%, v/v). A240 was measured at 30 s intervals for 2 min. One unit of CAT activity was defined as the amount of enzyme resulting in A240 decrease rate of 0.1/min. CAT activity was expressed as U mg−1 protein [18].

2.8.5. SOD Activity

This assay was based on inhibition of pyrogallol autoxidation [20]. A mushroom sample (2 g) was ground with 20 mL phosphate buffer (50 mM, pH 7.8), centrifuged (13,000× g, 4 °C, 20 min), and the supernatant was collected as crude enzyme extract. Extract samples were combined with 1.4 mL deionized water and 0.1 mL pyrogallol solution (6 mM) in 1.5 mL phosphate buffer as above, and A420 was measured at 30 s intervals for 5 min. Pyrogallol autoxidation rate was assayed based on the slope of the linear portion of the △A420 plot, and expressed as ∆A′420 min−1.
Inhibition rate of pyrogallol autoxidation by SOD was determined based on pyrogallol autoxidation rate as above. For this method, 0.1 mL crude enzyme and 0.1 mL pyrogallol solution (6 mM) were added to 2.8 mL phosphate buffer, as described above, and the results were expressed as ∆A′420 min−1. One unit of SOD activity was defined as the amount of enzyme resulting in 50% reduction of pyrogallol autoxidation, and calculated by using Formula (3):
SOD activity(U mg−1 protein) = [(∆A420 min−1 − ∆A′420 min−1) × 2/∆A420 min−1] × (V1/V2)
where V1 and V2 is the volume of reaction mixture and crude enzyme, respectively.

2.8.6. Succinic Dehydrogenase (SDH) Activity

SDH activity was determined using commercial kits (BOXBIO; Beijing, China) as per manufacturer’s instructions, and expressed as U mg−1 protein.

2.9. Microbiological Analysis

2.9.1. Total Colony Count

To determine total colony count, a 2 g mushroom sample was washed with 20 mL sterile 0.9% NaCl solution, diluted to 10−1–10−9, and 0.2 mL aliquots were placed in LB medium and cultured for 24 h at 37 °C. Total colony count was expressed as log CFU g−1 [21].

2.9.2. Deoxyribonucleic Acid (DNA) Extraction and Sequencing Library Construction

Bacterial composition analysis was performed for selected mushrooms from the various storage period groups. Total bacterial genomic DNA was extracted using a Fast DNA Spin Kit for Soil (MP Biomedicals; Santa Ana, CA, USA) as per manufacturer’s instructions. The V3–V4 region of 16S rRNA gene was amplified with primer pairs:
Forward primers: 338F (5′-ACTCCTACGGGAGGCAGCAG-3′);
Reverse primers: 806R (5′-GGACTACHVGGGTWTCTAAT-3′).
The polymerase chain reaction (PCR) program in PCR thermocycler (model GeneAmp 9700, ABI; Culver City, CA, USA) was run with the reaction mixture containing 2× Pro Taq (Sangon Biotech, Beijing, China), 0.8 µL of each primer (5 μM), 10 ng μL−1 template DNA, and ddH2O to final volume 20 µL. PCR amplification cycling conditions were as follows: initial denaturation at 95 °C for 3 min, 27 cycles at 95 °C for 30 s, 55 °C for 30 s, and 72 °C for 45 s, then single extension at 72 °C for 10 min, and finally at 10 °C. Illumina MiSeq sequencing of 16S rRNAs from the samples was performed by Majorbio Technology (Shanghai, China). High-throughput sequencing was performed by 2 × 300 bp paired-end method on the MiSeq platform.
Operational taxonomic units (OTUs) were clustered at 97% sequence similarity level by UPARSE method. The Mothur software program (https://mothur.org/wiki/download_mothur, accessed on 19 December 2021.) was used for taxonomic assignments at 70% confidence level based on the Ribosomal Database Project (RDP) database. Bioinformatic analysis was performed using the Majorbio Cloud platform (https://cloud.majorbio.com, accessed on 5 May 2022.). Relative abundance of each bacterial genus (variables clustering on Y-axis) within each sample (X-axis) was expressed by a heat-map plot. Members of a given community responsible for differences between communities were identified on the platform.

2.10. Contents of Total Phenolics and Ascorbic Acid

Mushroom samples (2 g) were homogenized with 15 mL ethanol (80%, v/v), centrifuged (13,000× g, 20 min), and the supernatant double-diluted with deionized water. The diluted supernatant (1 mL) was mixed with 0.5 mL Folin–Ciocalteu reagent (1 M) and 1.5 mL sodium carbonate solution (10%, w/v), kept in the dark for 30 min, and A760 was measured. Phenolic content was expressed as mg gallic acid equivalent (GAE) g−1 dry weight (DW) [22]. Ascorbic acid was quantified using a commercial kit (Leagene; Beijing, China) as per manufacturer’s instructions.

2.11. Malondialdehyde (MDA) Content

Mushroom samples (2 g) were ground with 10 mL TCA (10%, w/v), centrifuged (2000× g, 4 °C, 10 min), and the MDA extract collected. MDA extract (2 mL) was combined with 2 mL TBA (0.6 w/v), boiled for 15 min, cooled quickly, centrifuged as above, and the supernatant collected. Absorbance of supernatant was measured at wavelengths 450, 532, and 600 nm [18], and the MDA content was calculated by using Formulas (4) and (5):
c = 6.45 × (A532 − A600) − 0.56 × A450
MDA (nmol g−1) = (c × vt)/(vs × fresh weight)
where c is the MDA concentration in the reaction mixture, vt is the volume of extract solution, and vs is the volume of extract solution used in the experiment.

2.12. Nutritional Content

Mushroom samples were lyophilized and ground to powder (60 mesh). Amino acid composition and fatty acid composition were determined according to Chinese National Standards GB/T18246-2019, GB 5009.168-2016, and GB/T6432-2018, respectively.

2.13. Statistical Analysis

All experiments were performed in triplicate; results were analyzed by one-way analysis of variance with Duncan’s multiple range test using Prism software 8.0; data are presented as mean ± SD. Differences between means with p < 0.05 were considered significant.

3. Results

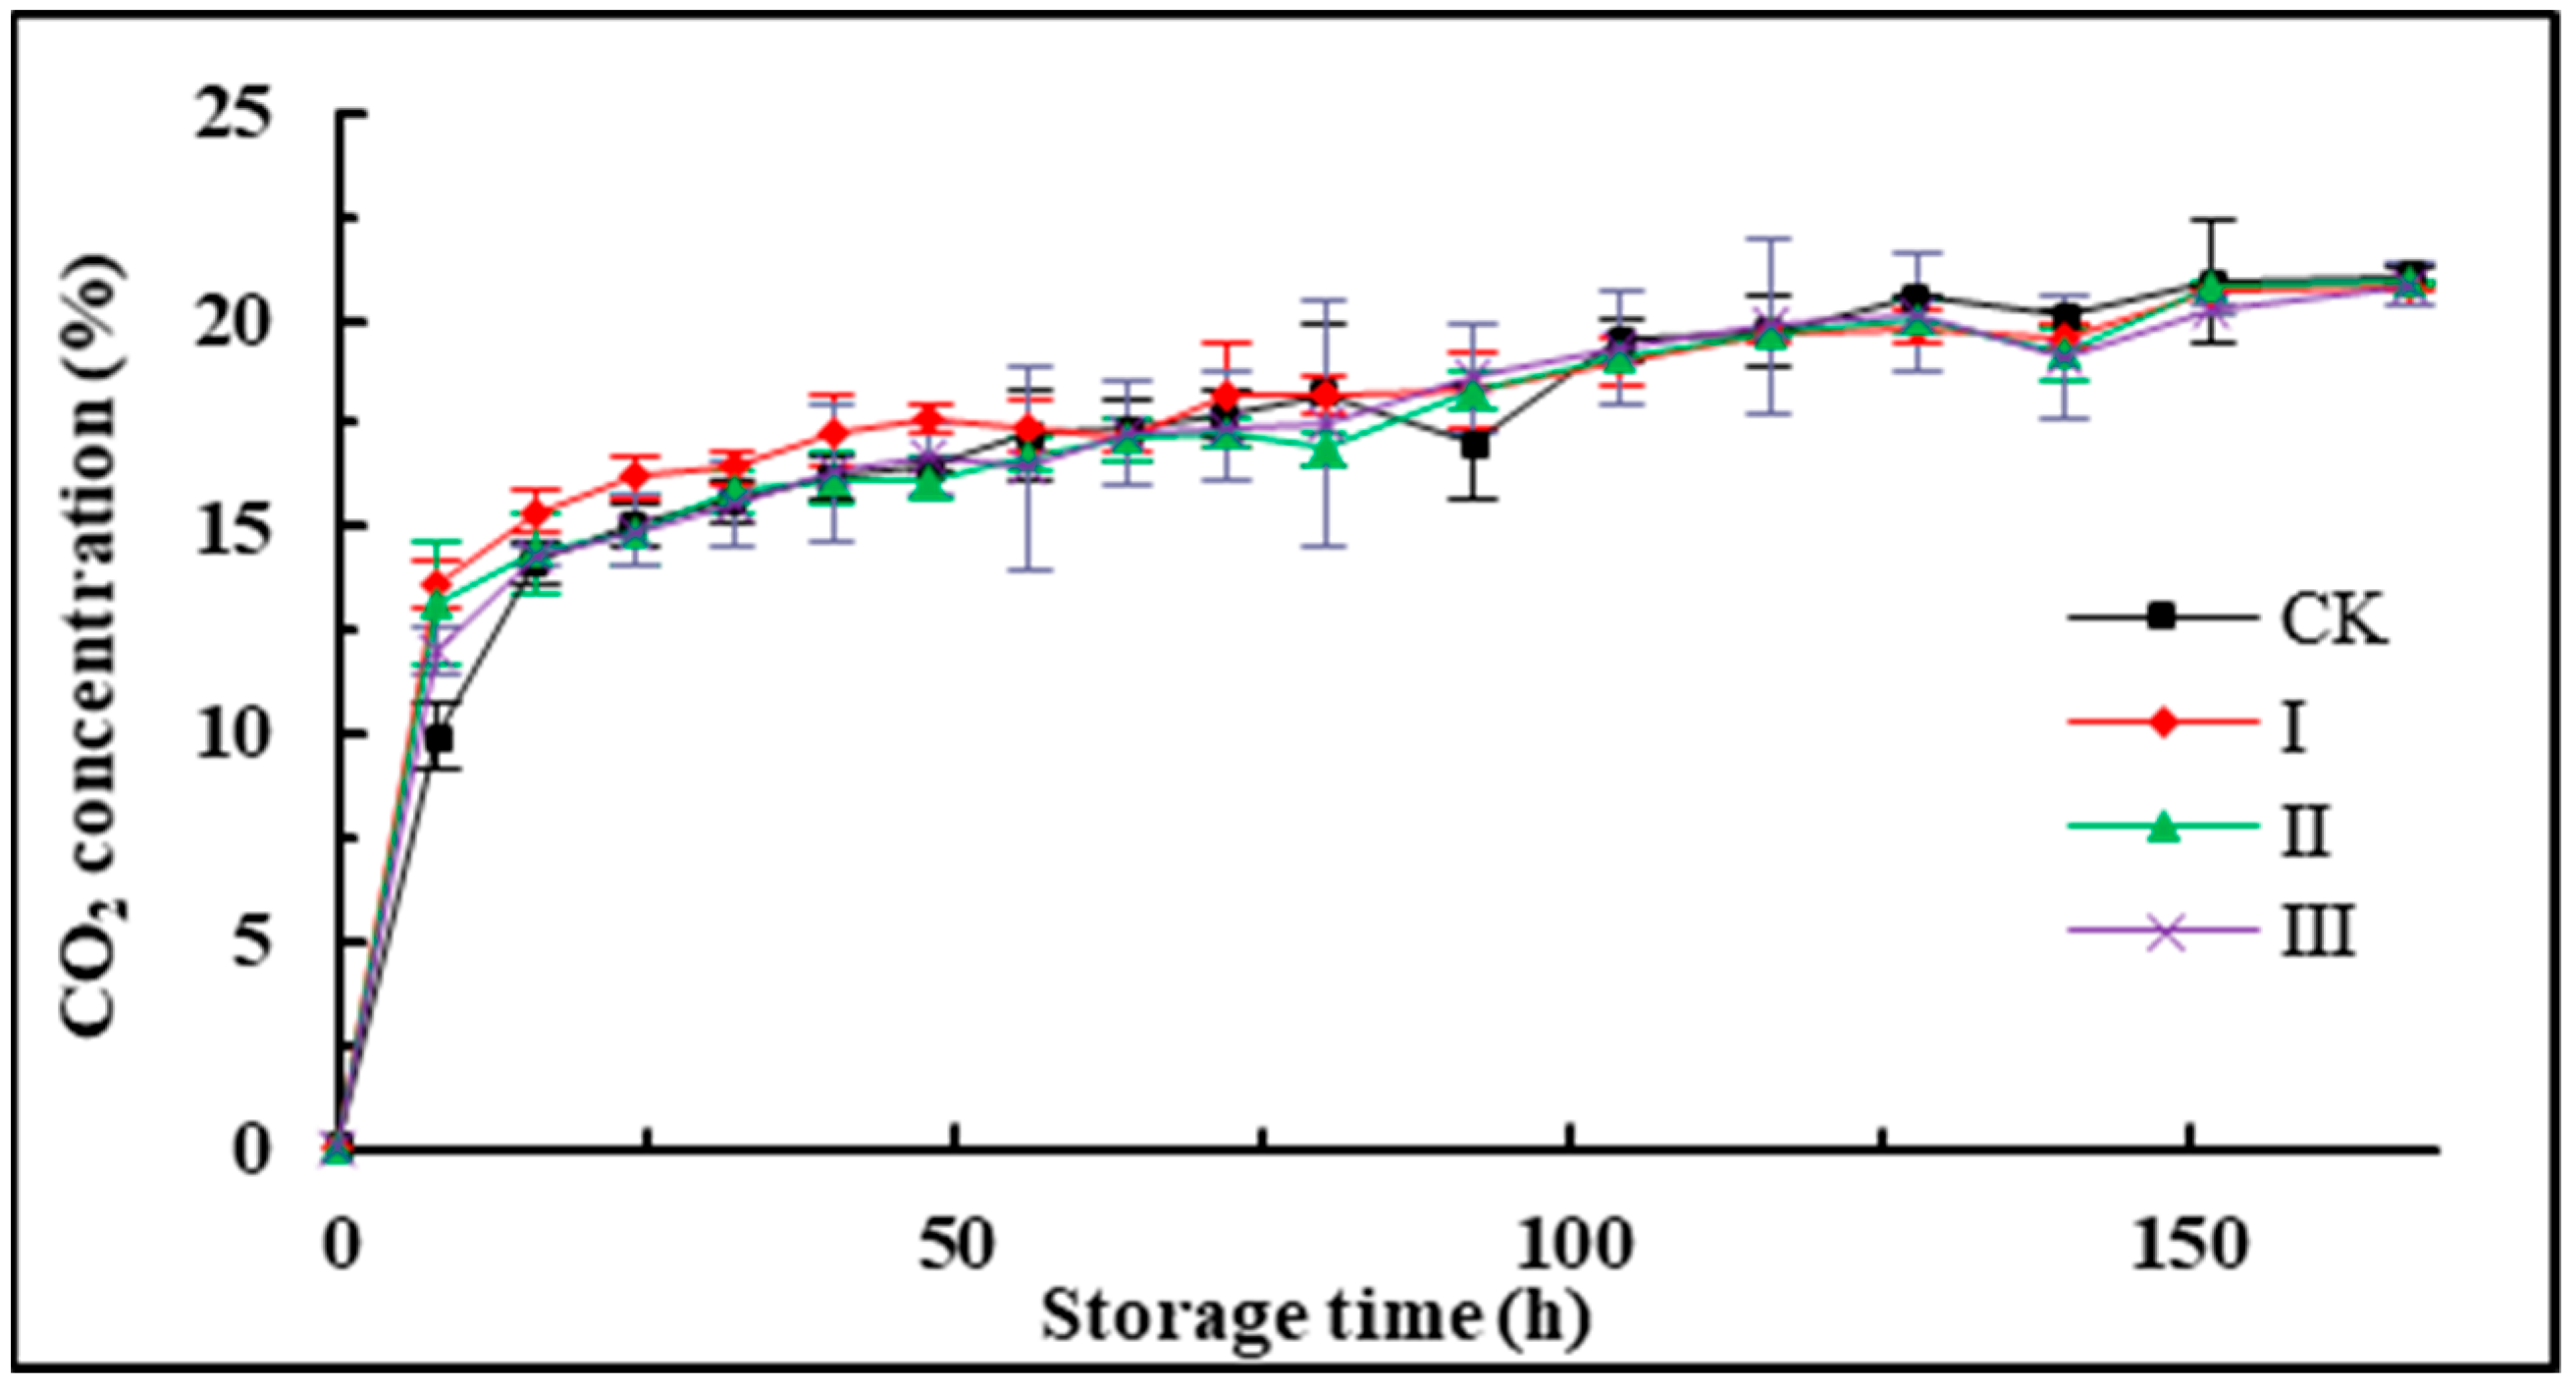
3.1. CO2 Concentration
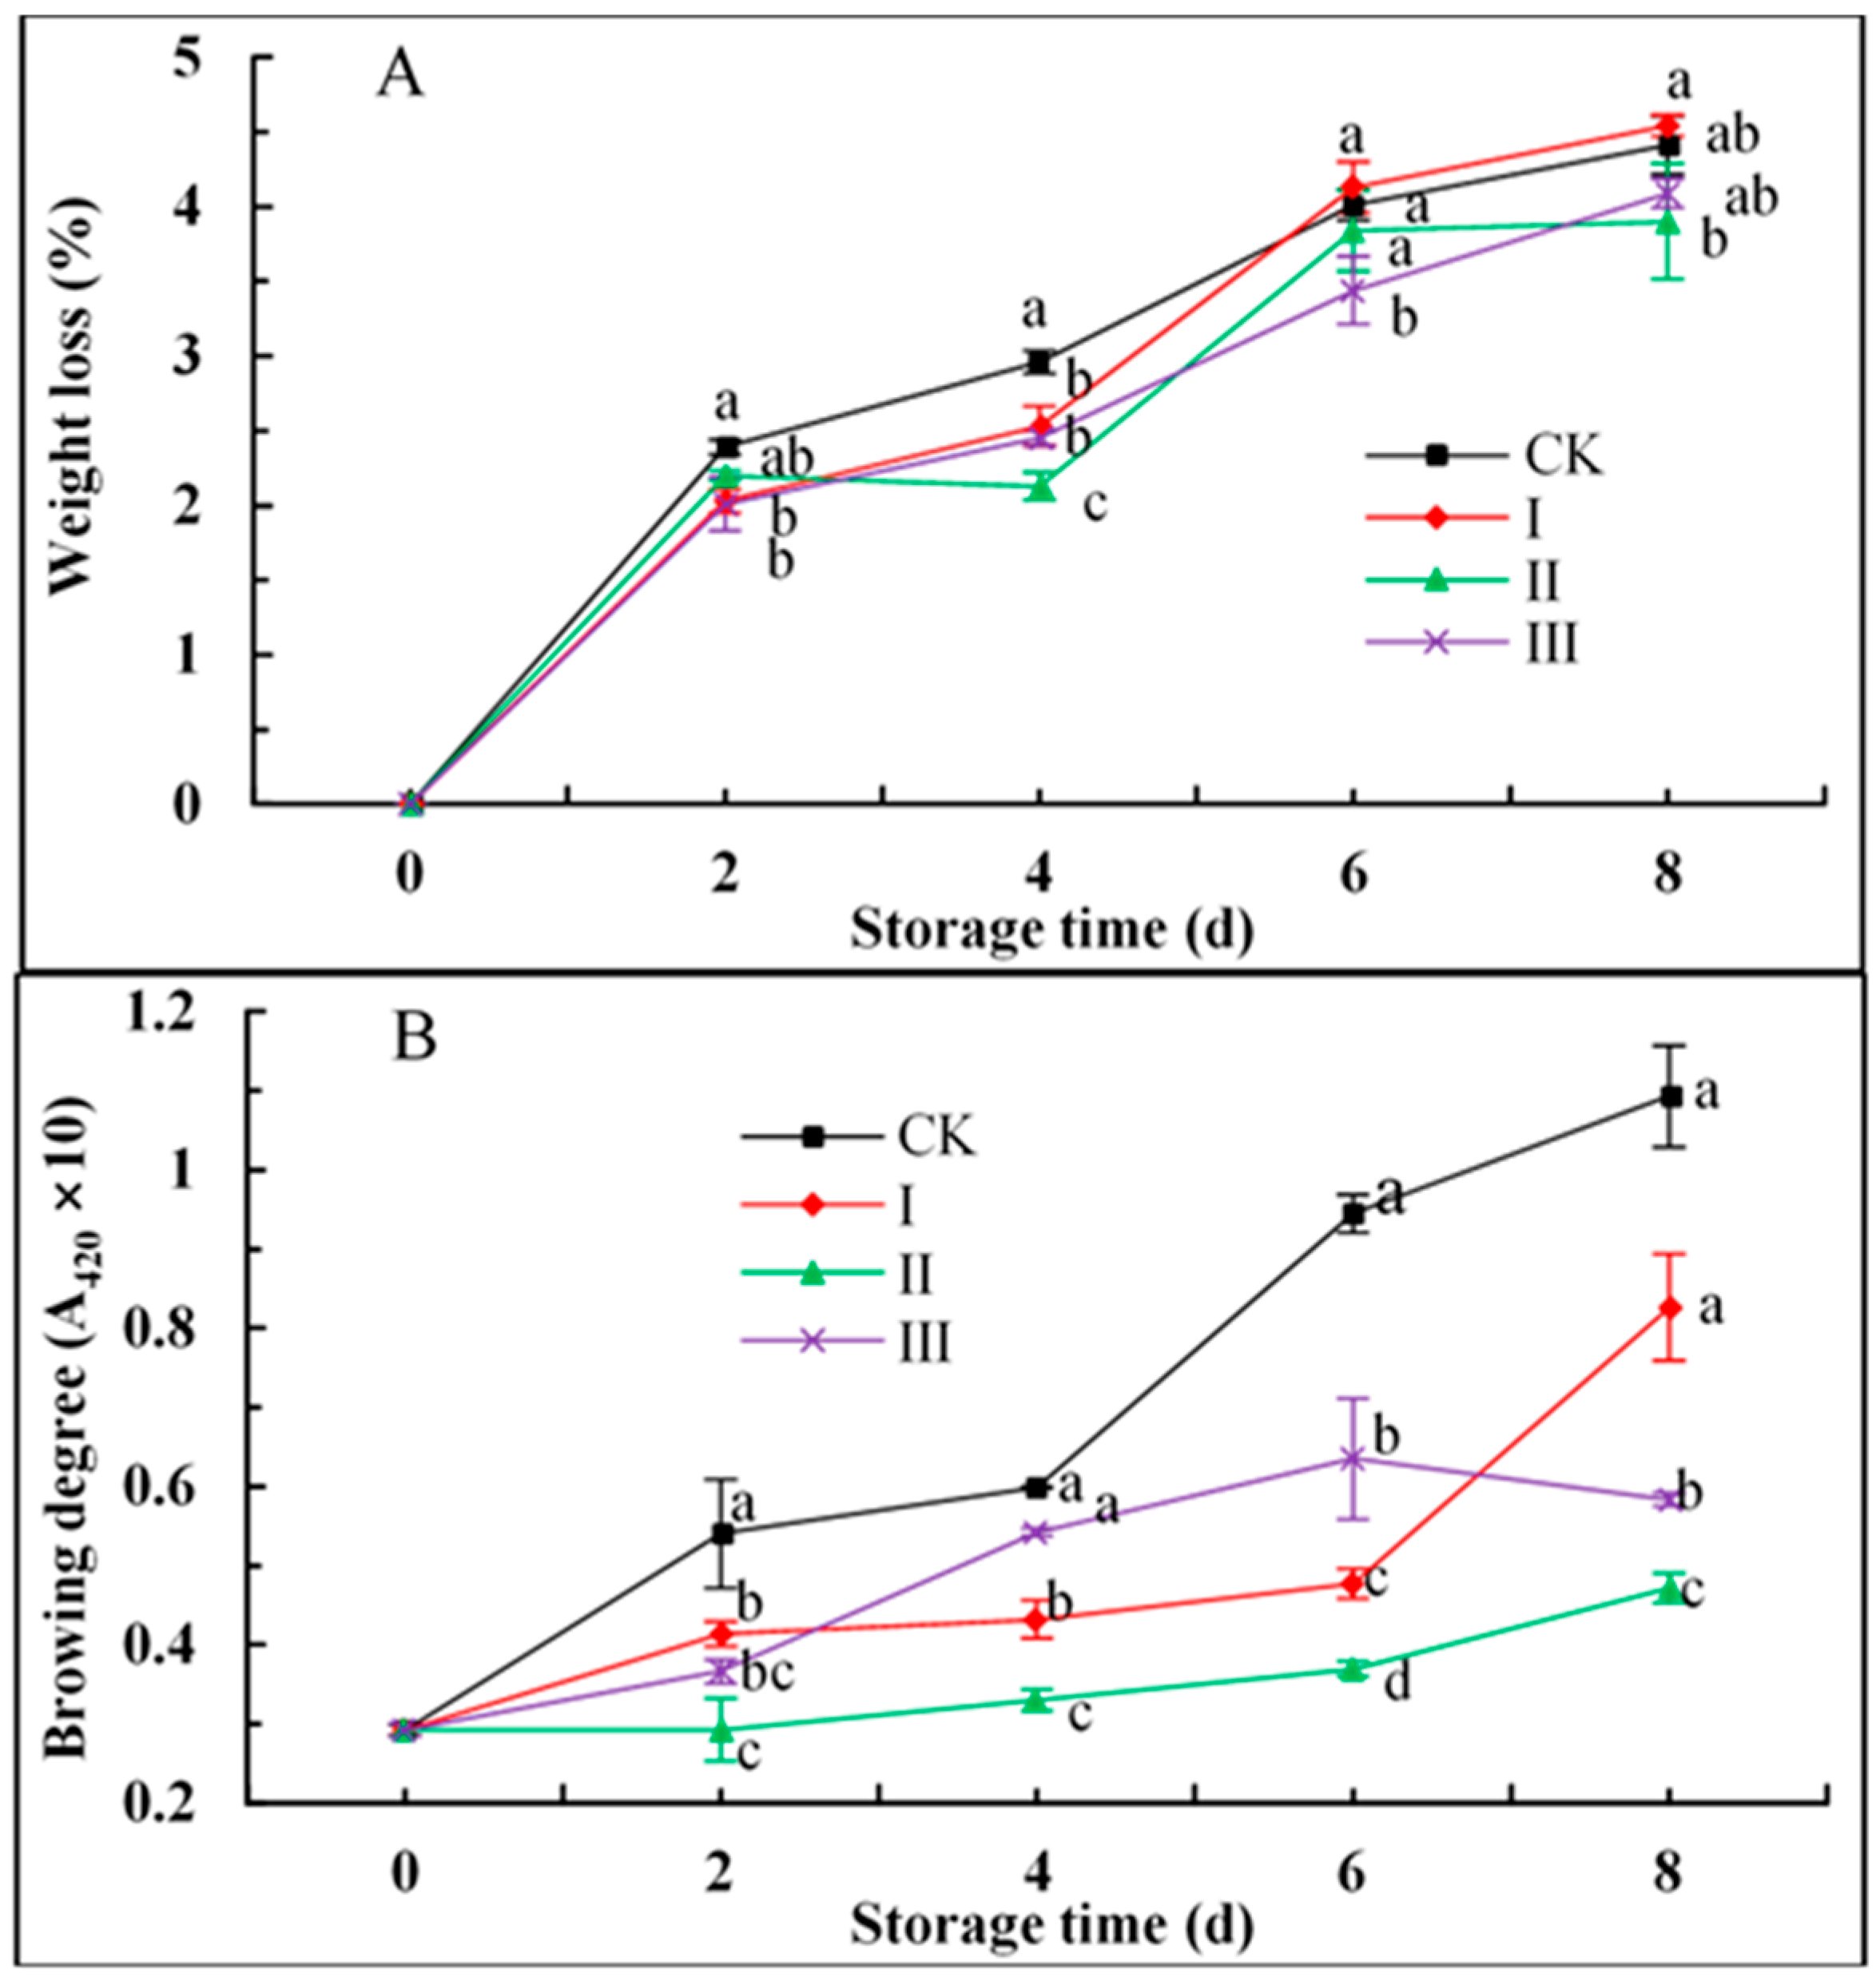
CO2 concentration in all groups increased rapidly in the first 6 h of storage (Figure A1, available in Appendix A), which indicted that mushroom has high respiratory rate. After 12 h, all groups show relatively flat trends in rising CO2 concentration until the end of measurement. Group CK had a CO2 concentration of 20.30% at 8 d, whereas IAITC-treated groups ranged from 20.68–21.23%. No significance observed in the CO2 concentration between IAITC-treated samples and CK.

3.2. Weight Loss

Weight loss is mainly due to water transpiration and respiration metabolism in mushroom [23]. Weight loss increased for each group during storage. Weight loss was the highest for group CK during days 1–4, and remained higher than that in IAITC-treated groups II and III at day 8 (the end of storage) (Figure 1A). Weight loss in CK, I, II, and III was 4.41%, 4.54%, 3.90%, and 4.09% at day 8, respectively. It was significant that group II was lower than the others (p < 0.05). Mushrooms treated with 50–250 μL L−1 IAITC showed smaller weight loss.

3.3. Browning Degree

Browning degree increased slowly during storage days 1–4 for all groups (Figure 1B), while it increased most rapidly during days 4–8. The browning degree in CK was the highest, followed (in order) by I, III, and II. IAITC inhibited browning in F. velutipes effectively and 50 μL L−1 (group II) was the optimal concentration.

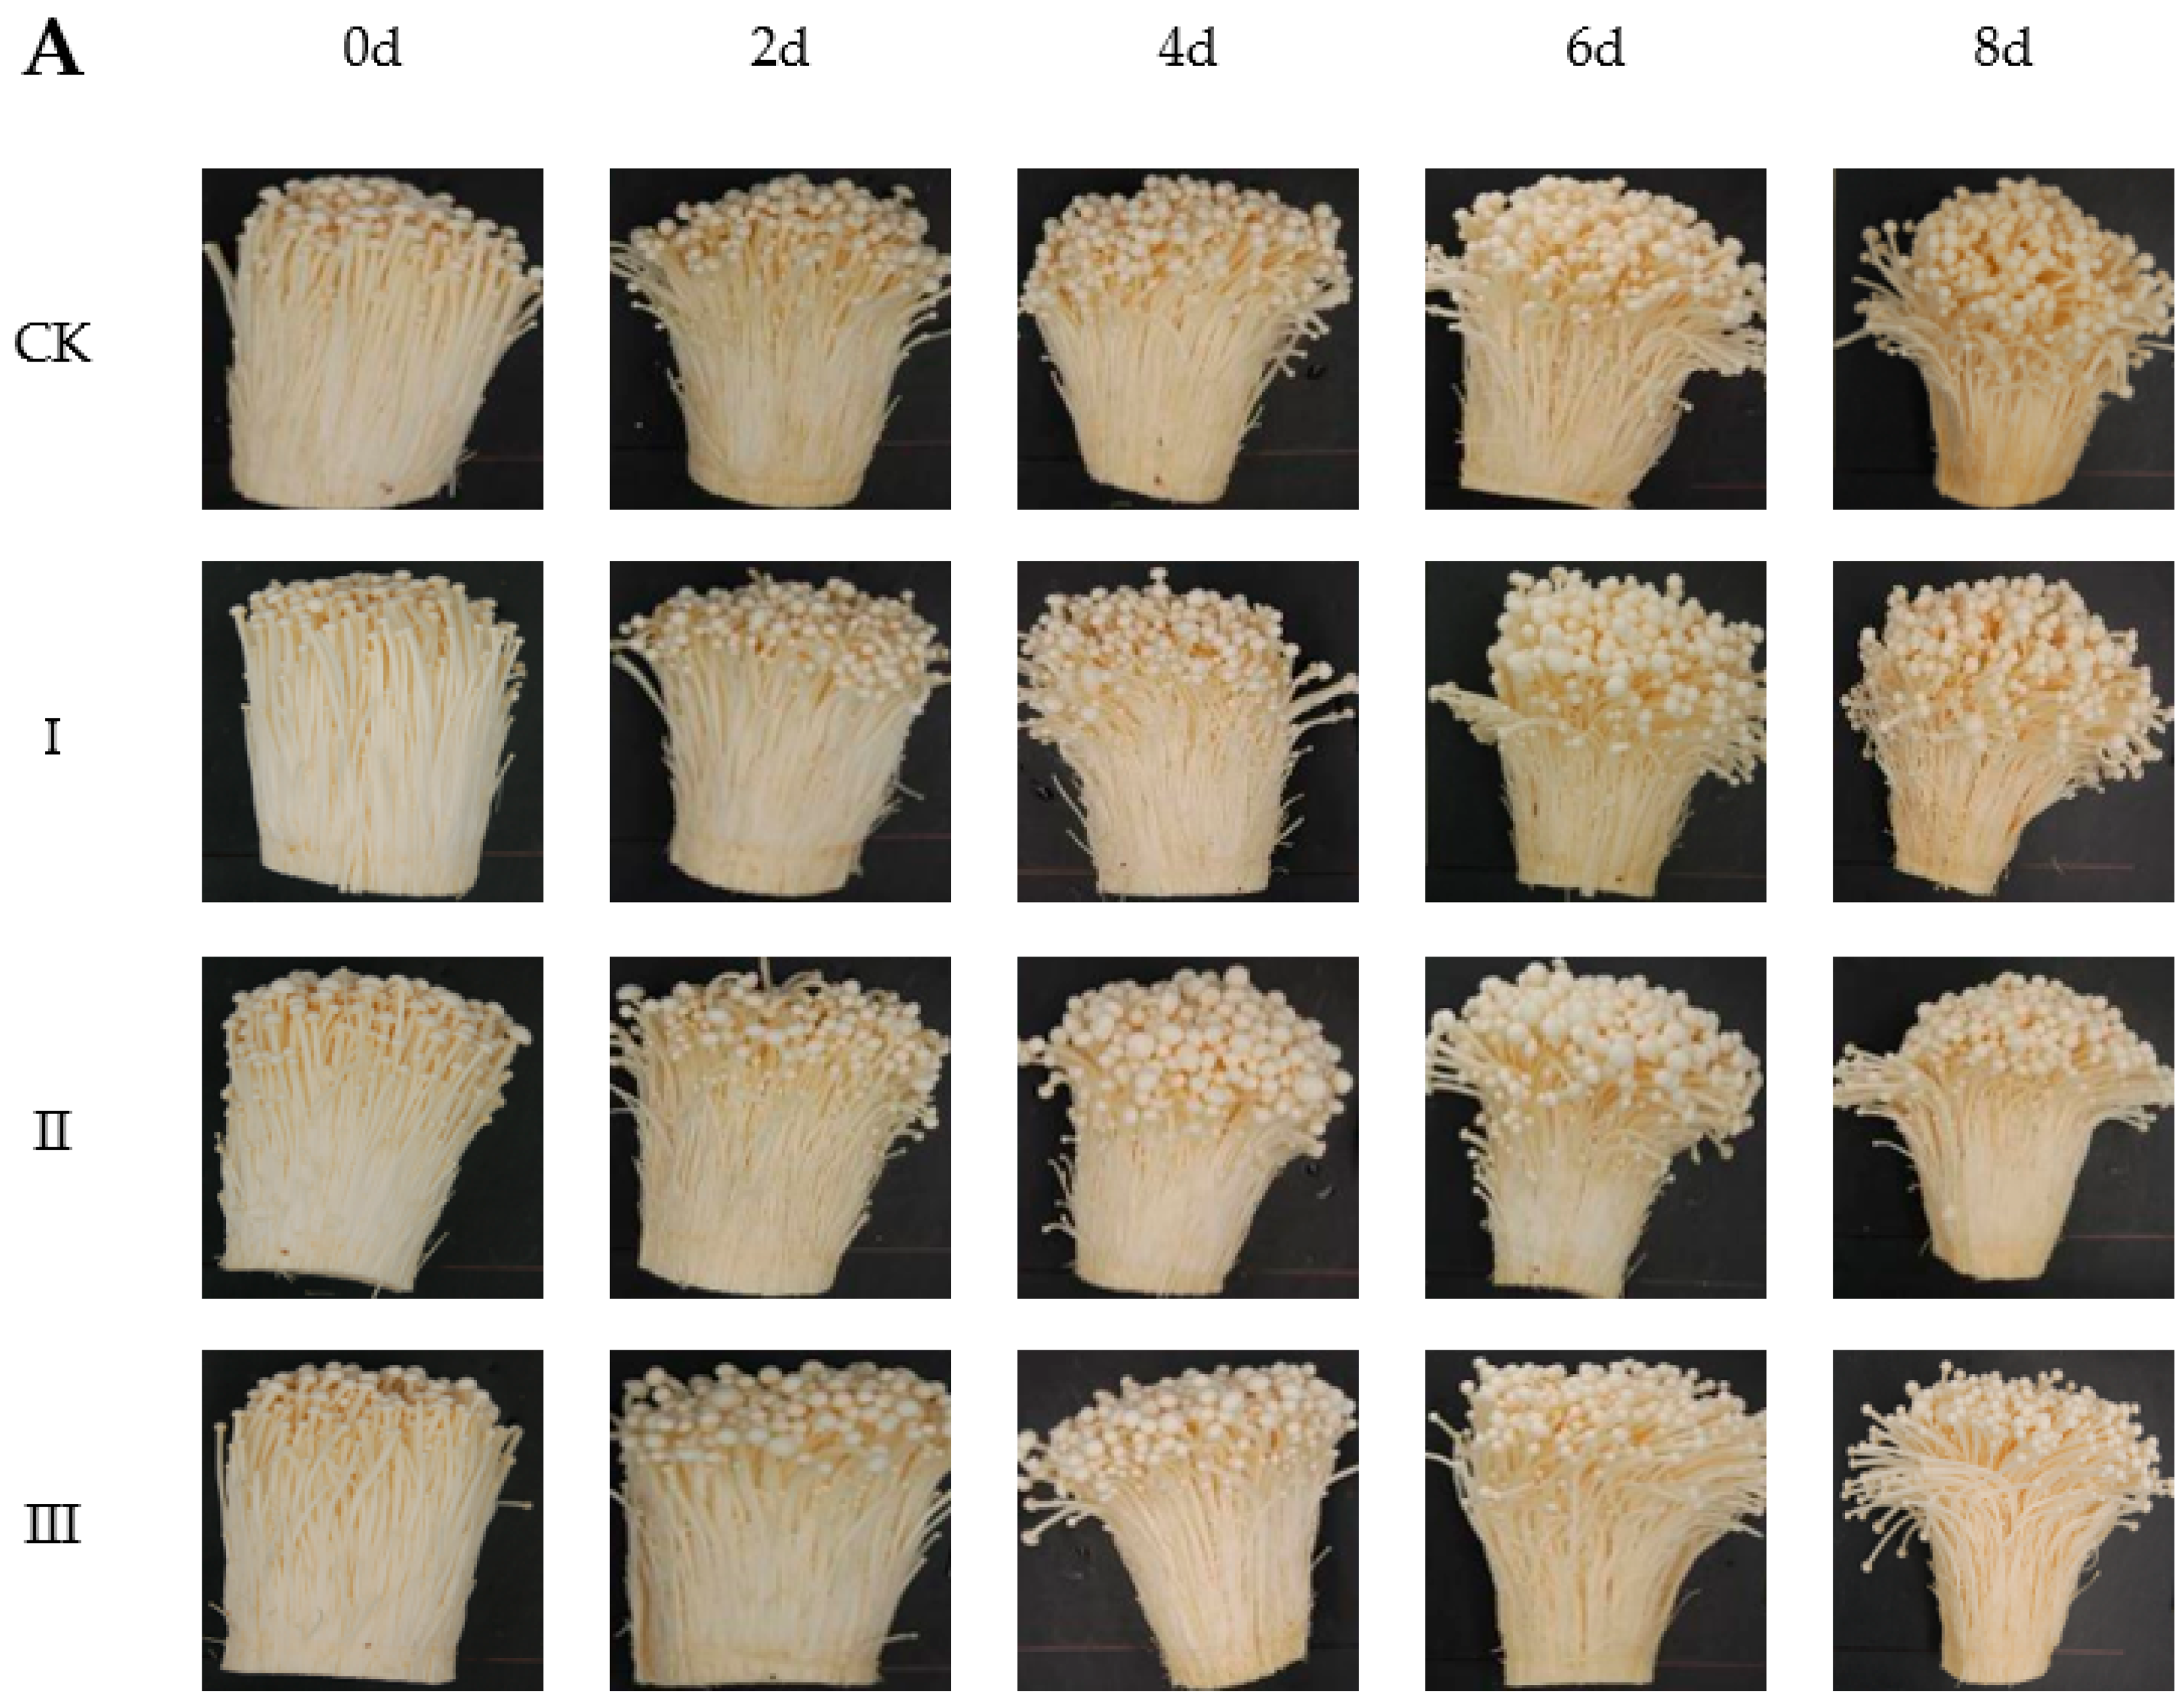
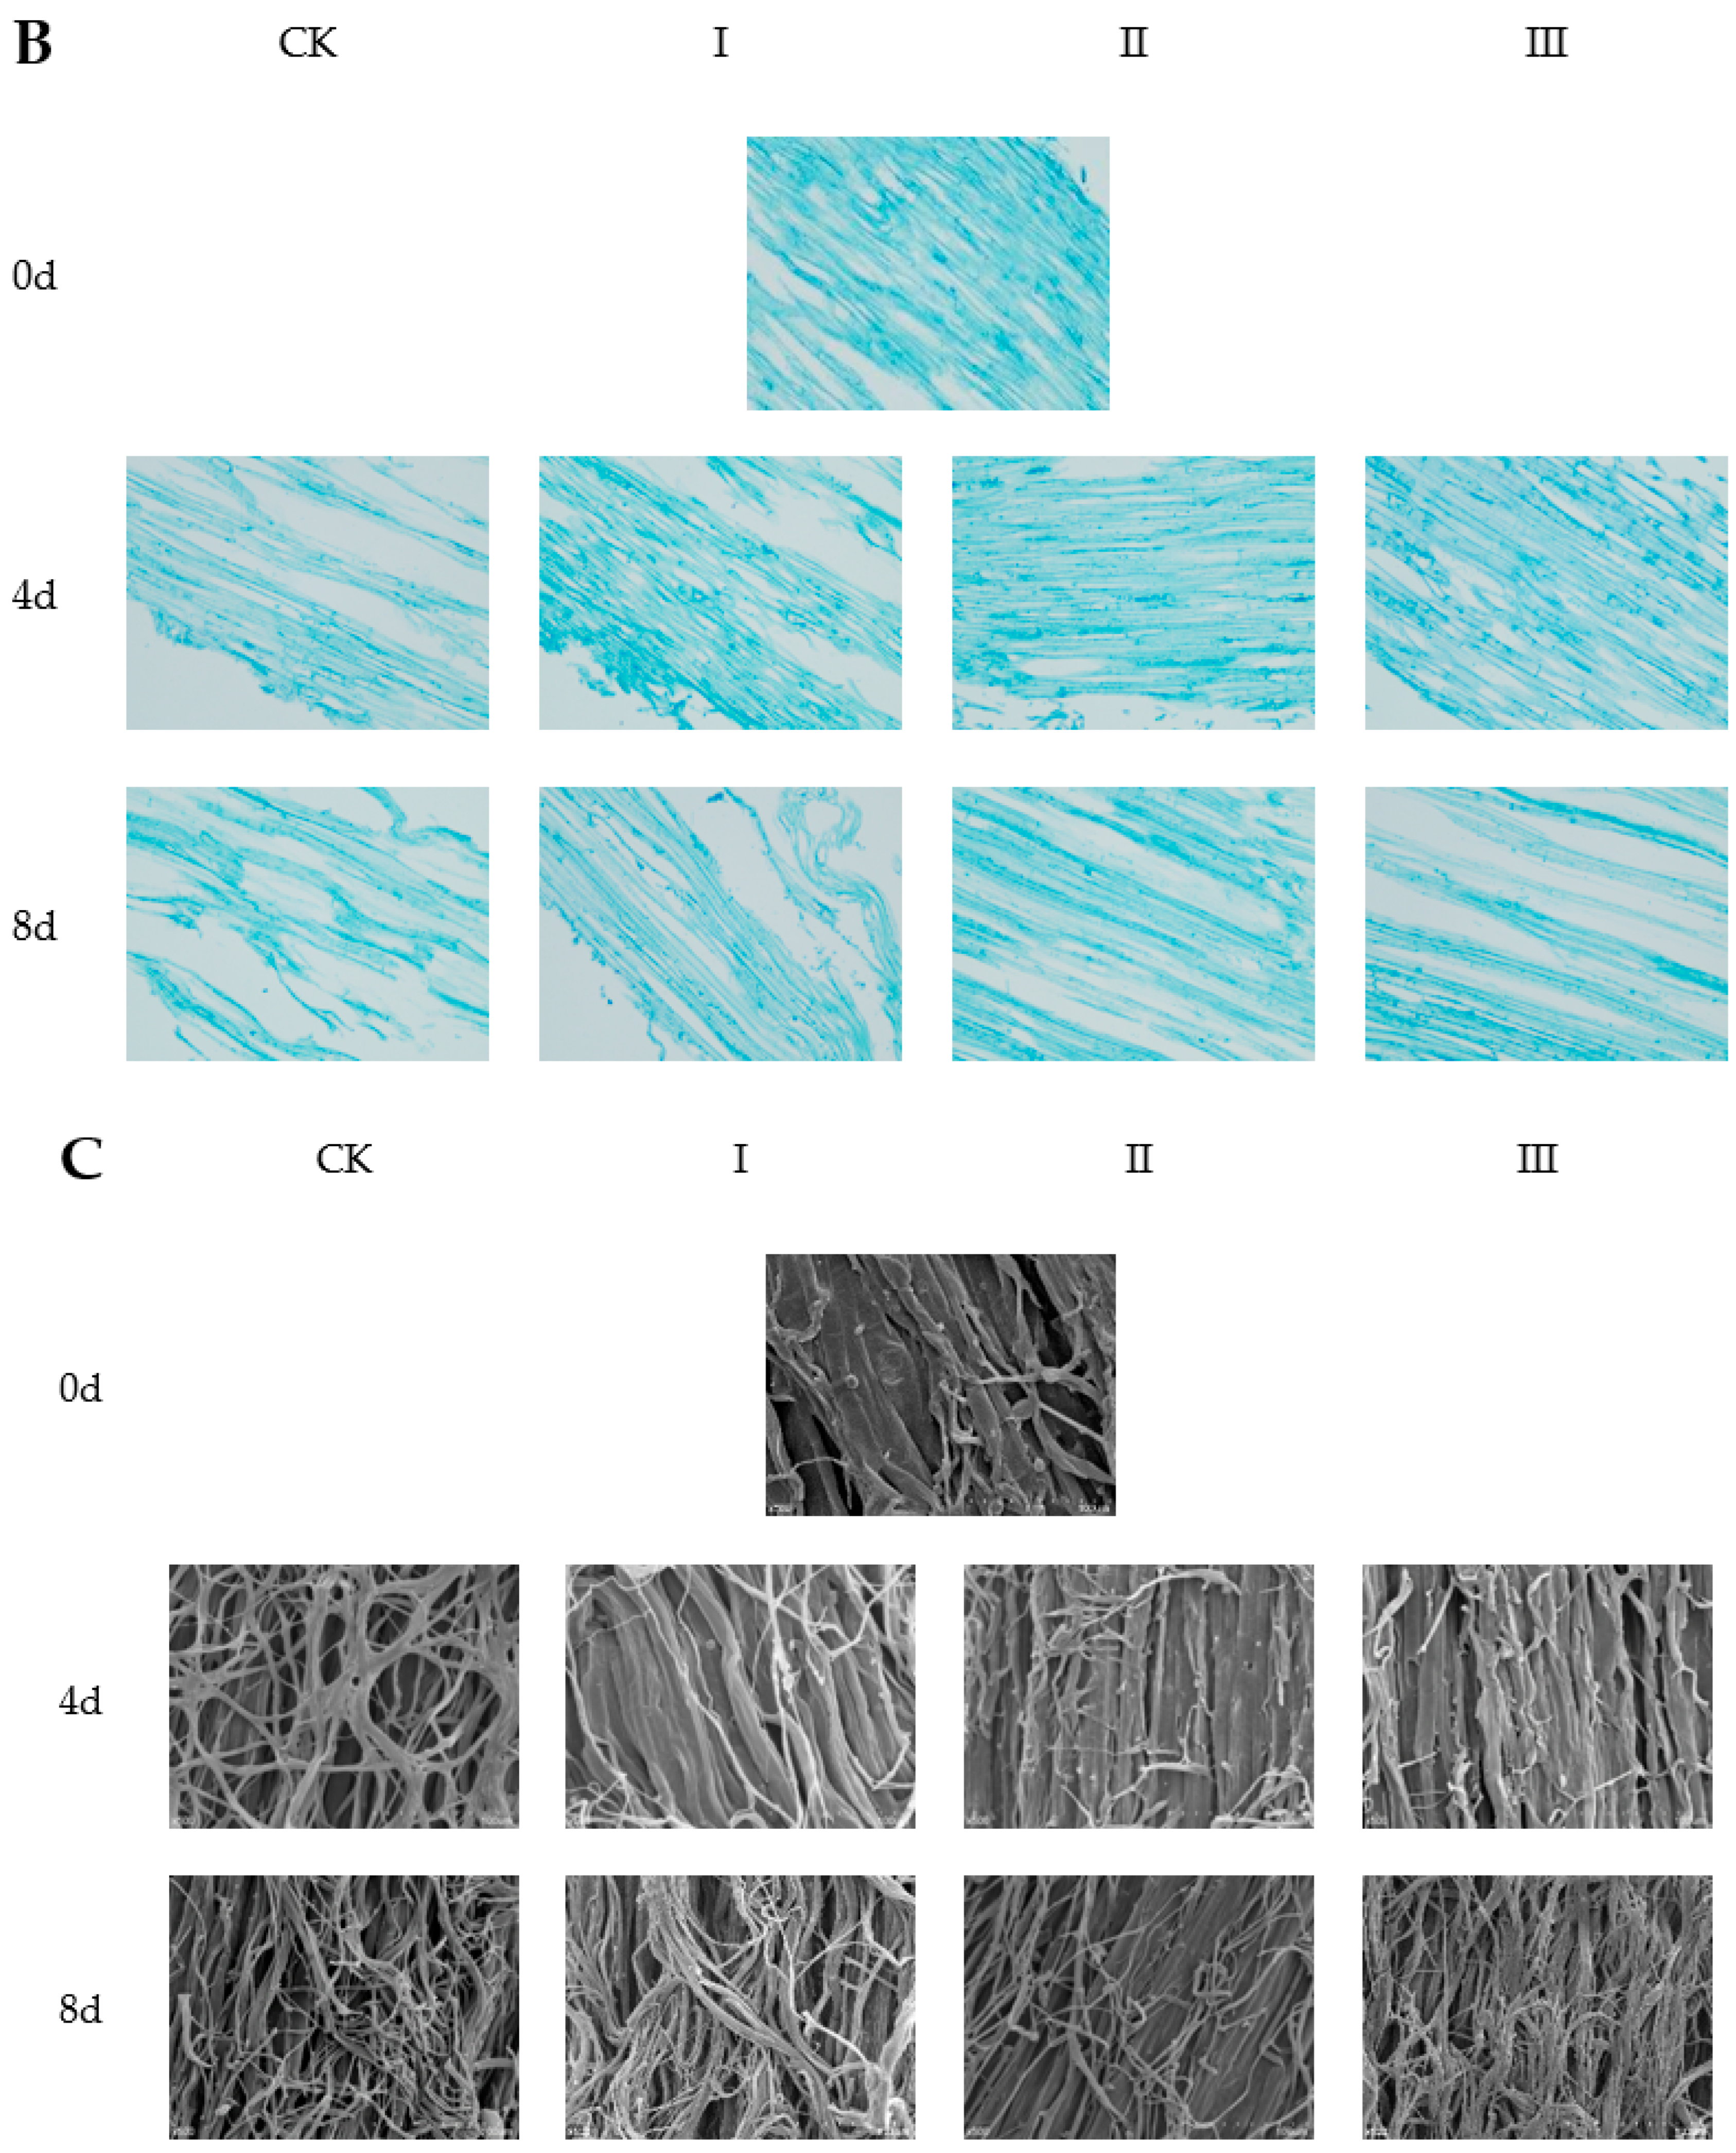
3.4. Appearance and Microstructure Observation
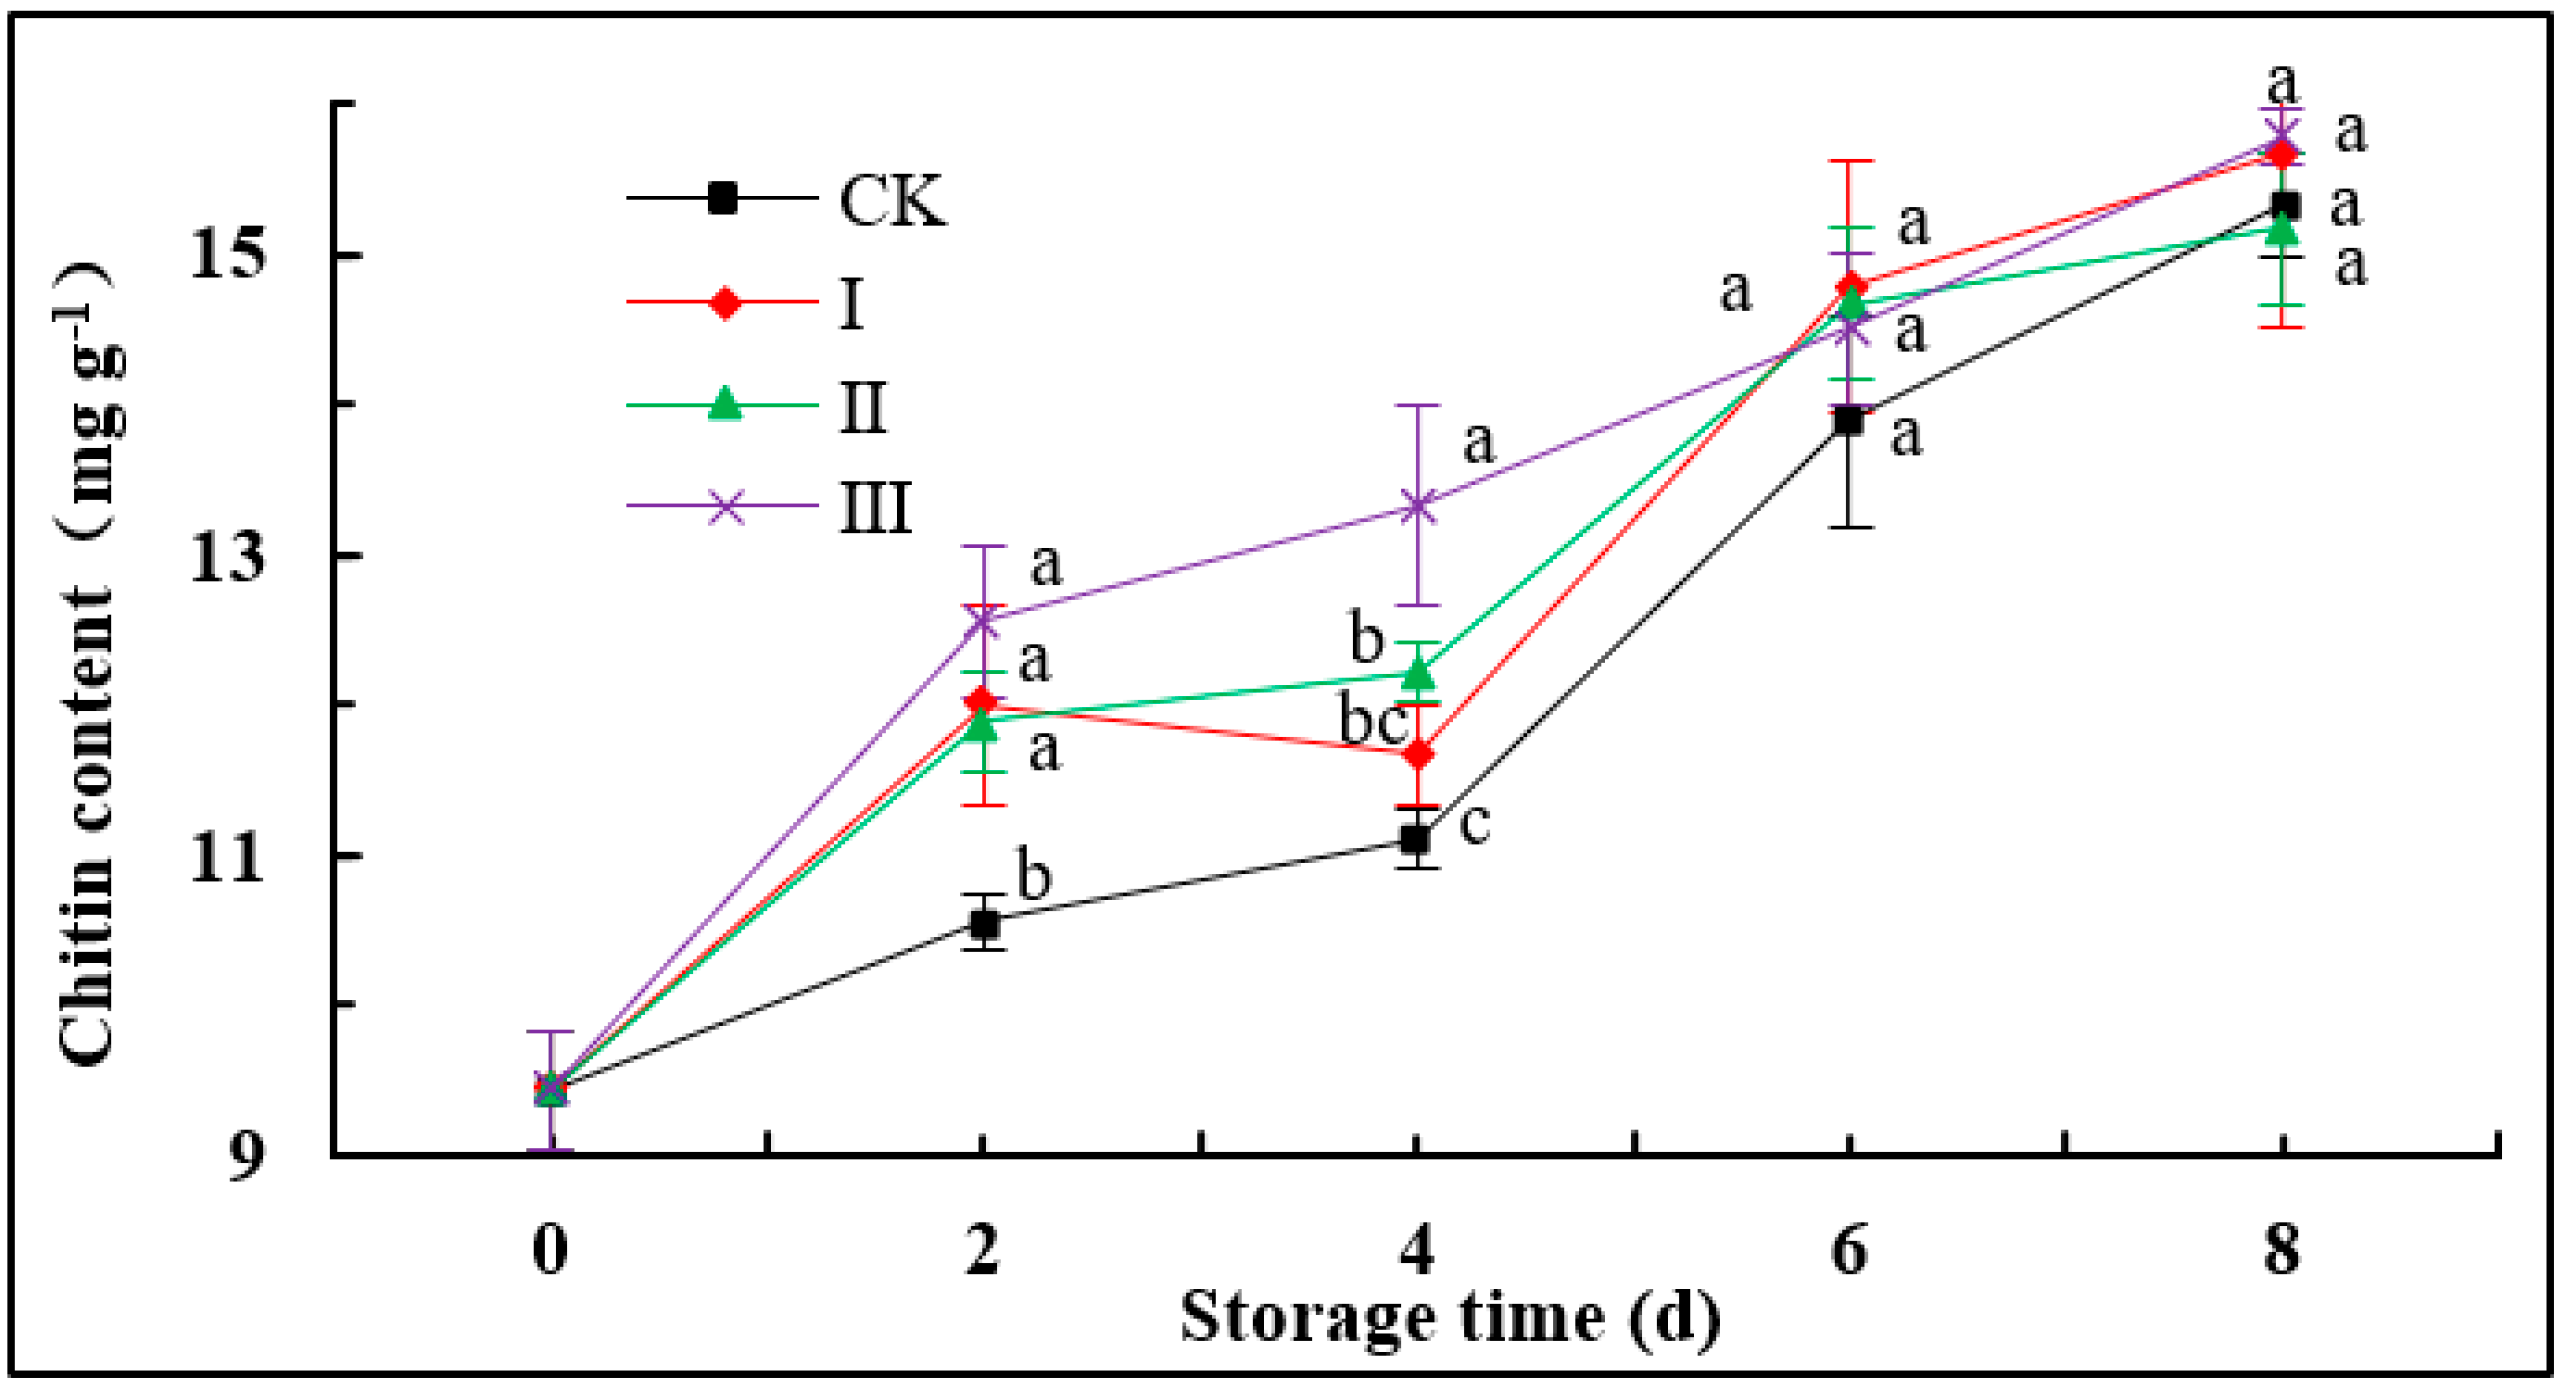
As storage continued, mushrooms displayed increased degrees of browning, stipe elongation, cap opening, and wilting (Figure 2A). On day 8, CK had notably stronger browning, longer stipes, reduced firmness, and more diffused fruiting bodies compared to day 0, which were milder in the IAITC-treated groups. Group II treated with 50 µL L−1 maintained the best quality, including white color and neat appearance.
Stipe tissue microstructure reflects changes in external appearance as described above. Examination by optical microscopy showed that stipe tissues became sparser generally as storage time increased, but it was denser in II and III than in CK and I (Figure 2B). More detailed information from SEM (Figure 2C) revealed that stipe tissue was plump and dense on day 0. The tissue began to loosen (day 4) and collapse (day 8) in CK, while remaining relatively intact in II and III.

3.5. Chitin Content

In all groups, the chitin content was positively correlated with storage time (Figure A2, available in Appendix A; R2 was 0.9489 in Group CK). Chitin content for CK was significantly lower than that for the IAITC-treated groups on day 2. On day 4, there was significant difference between group III and the other groups. It subsequently increased for all groups, and differences among them were not significant (p > 0.05). On day 8, chitin contents were 15.33, 15.67, 15.17, and 15.78 mg g−1 fresh weight for CK, I, II, and III, respectively.

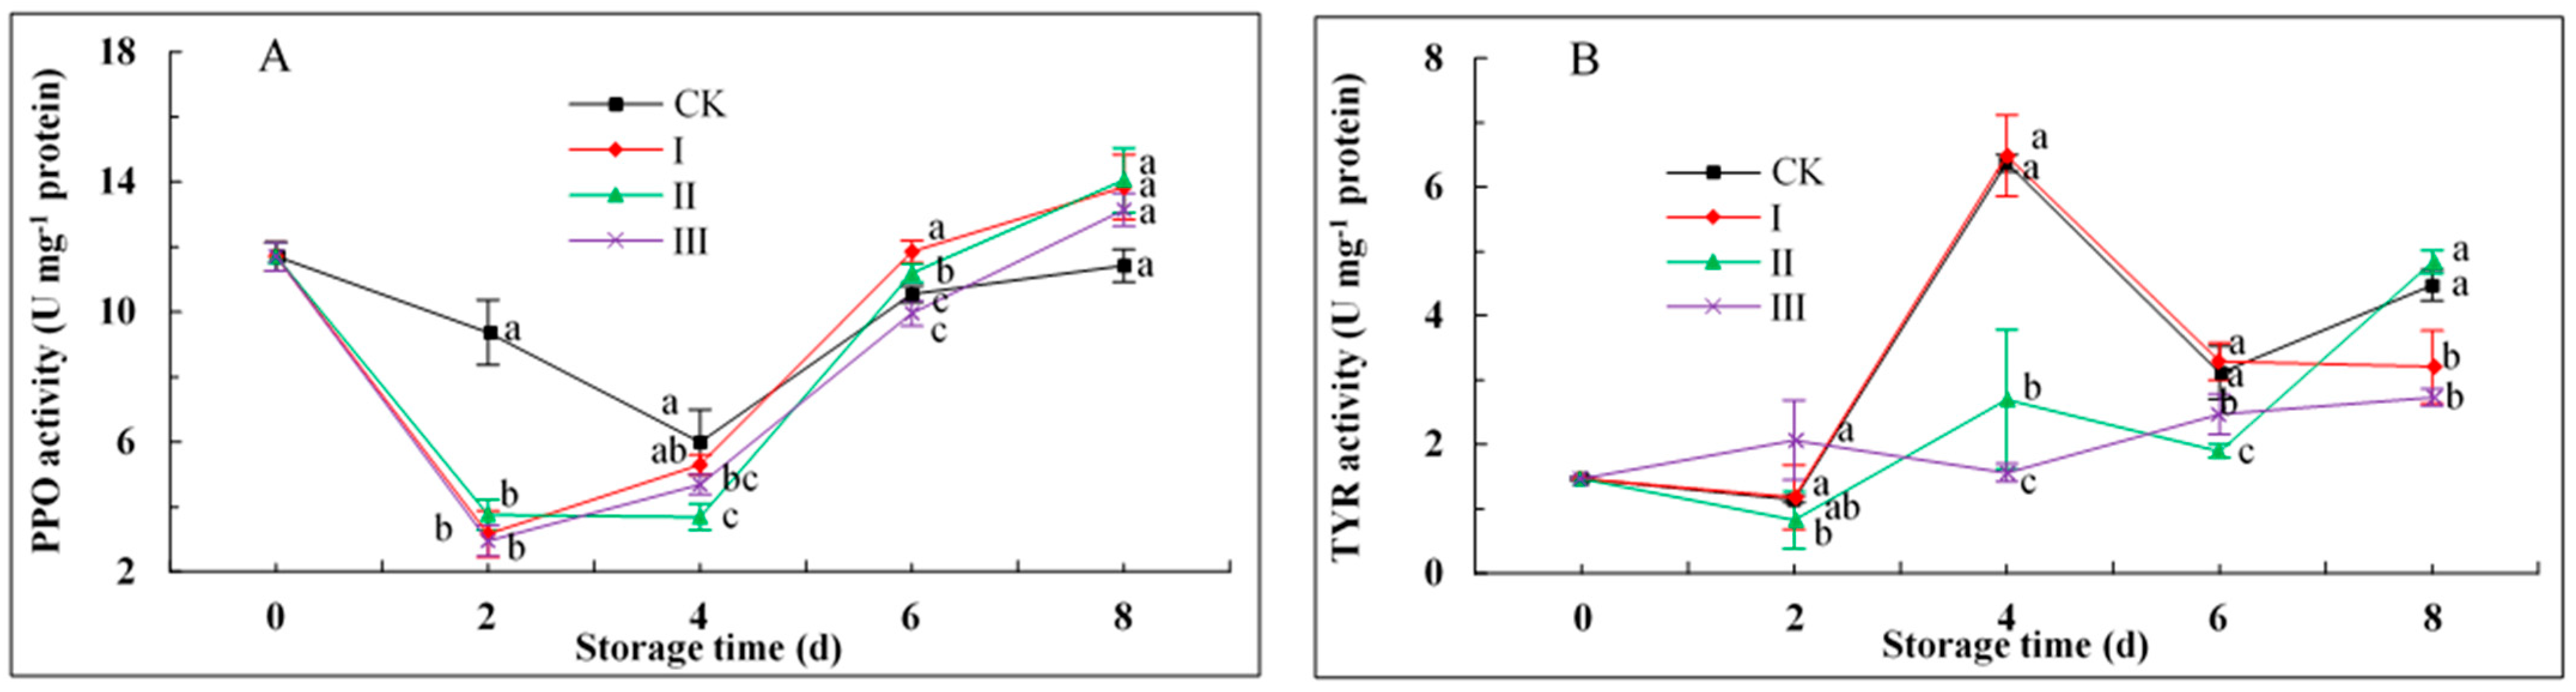
3.6. PPO and TYR Activities

During storage days 1–4, PPO activity was significantly higher for CK than that for the IAITC-treated groups (Figure 3A). The activities increased for all groups during days 4–8 and did not differ significantly among them at day 8 (p > 0.05).
During the initial 2 days of storage, TYR activity for CK, I, and II was lower than that for III (Figure 3B). TYR activity for CK and I was significantly higher than that for II and III on days 4 and 6, and had the maximal values for CK and I on day 4. The findings indicated that 50 μL L−1 IAITC (group II) notably reduced TYR activity during days 1–6, and 250 μL L−1 IAITC (group III) had the greatest inhibitory effect over the entire 8 d period.

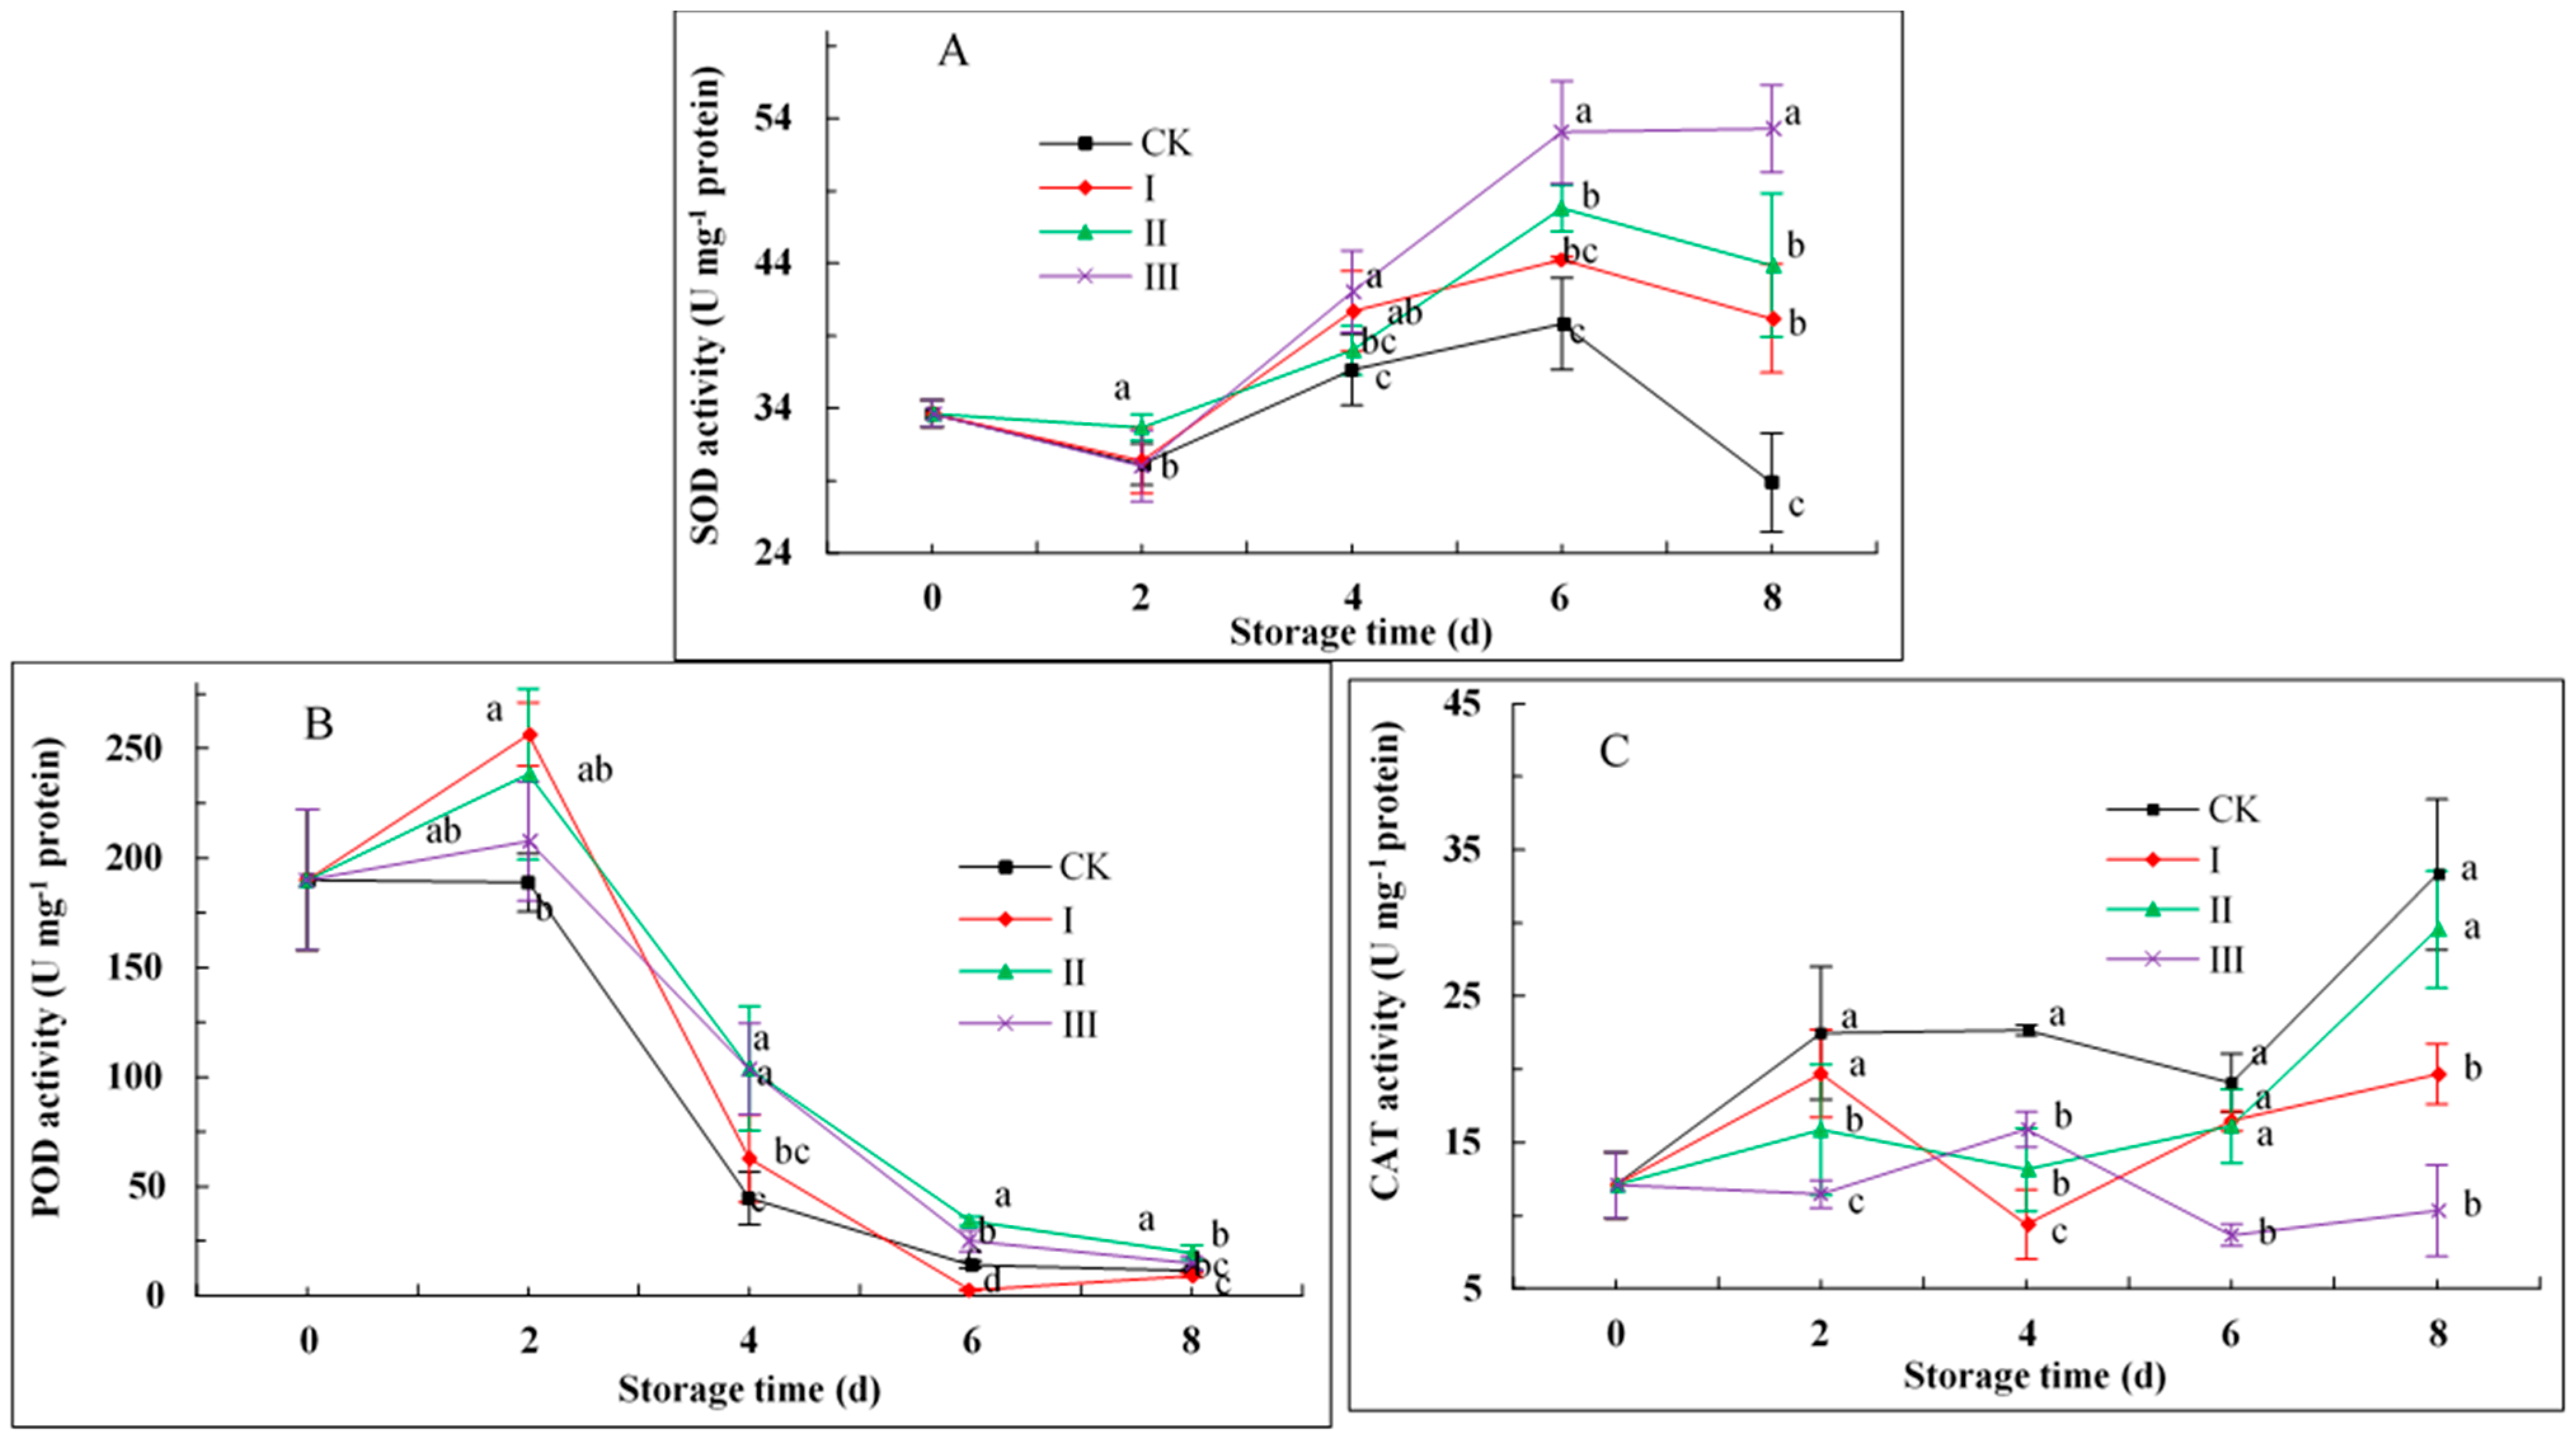
3.7. SOD, POD, and CAT Activities

SOD activity in all groups remained steady in the first 2 days of storage, and then increased greatly after the second day. At the same time, the differences among groups began to appear. Group CK was significantly lower than that treated with IAITC. At the end of storage, the SOD activities in group CK, I, II, and III were 28.86, 40.18, 43.86, and 53.30 U mg−1 protein, respectively.
POD activity in all groups was highest on day 2, and it subsequently declined rapidly (Figure 4B). The activity in all groups treated with IAITC except I was higher than that in CK. There was a significant difference between group II and CK during storage.
CAT activity in groups treated with IAITC was lower than CK throughout the storage period (Figure 4C). The activity in group III was significantly lower than that in the other groups, while II and CK were very close during days 6 to 8.

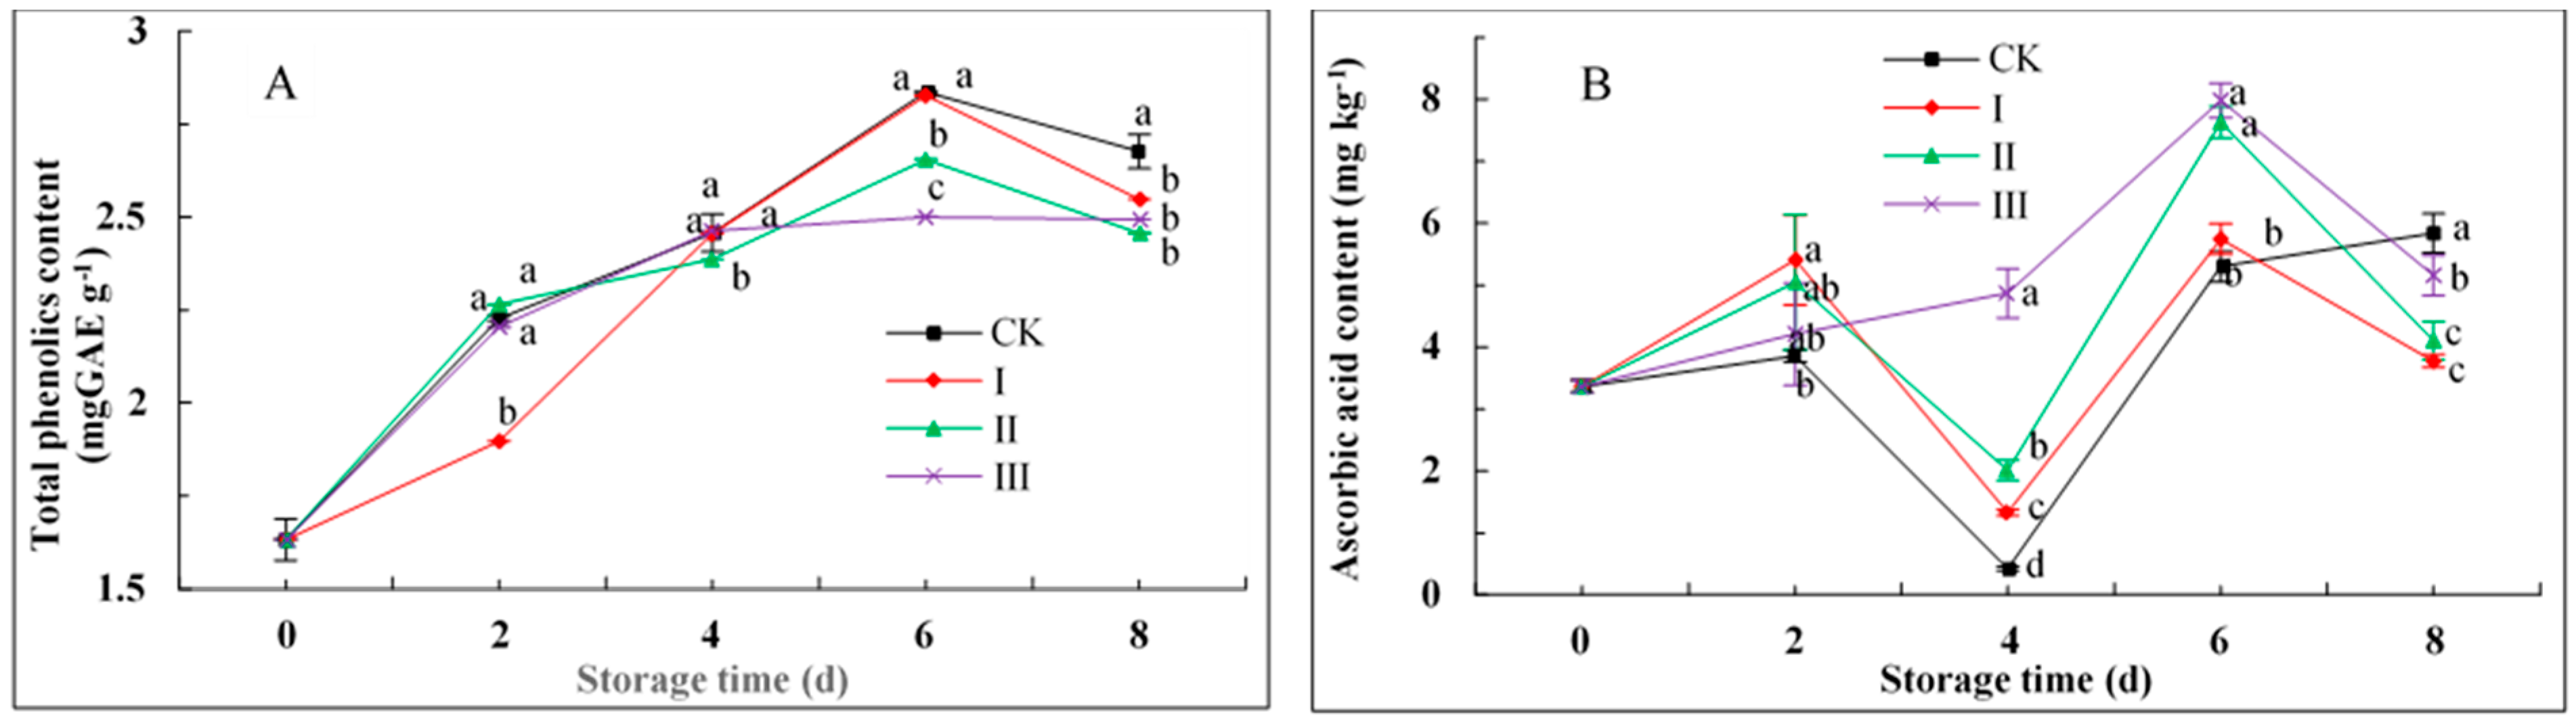
3.8. Total Phenolic and Ascorbic Acid Contents

Total phenolic increased in all groups during storage (Figure 5A). On day 2, total phenolic content in group I was significantly lower than the other groups. On day 8, contents in the three IAITC-treated groups were lower than that in CK. Maximal values for all groups were observed on day 6: 2.84, 2.83, 2.66, and 2.51 mg kg−1 for CK, I, II, and III, respectively.
Ascorbic acid content varied widely during storage for all groups (Figure 5B). Initial (day 0) content was 3.36 mg kg−1, and the highest values were observed on day 6 for III (7.98 mg kg−1) and II (7.63 mg kg−1). Ascorbic acid in CK was lower than IAITC-treated groups during the first 6 days. The content in group III was significantly higher than others at day 4. Content declined sharply in the three IAITC-treated groups from day 6 to day 8, while it increased slightly in CK.

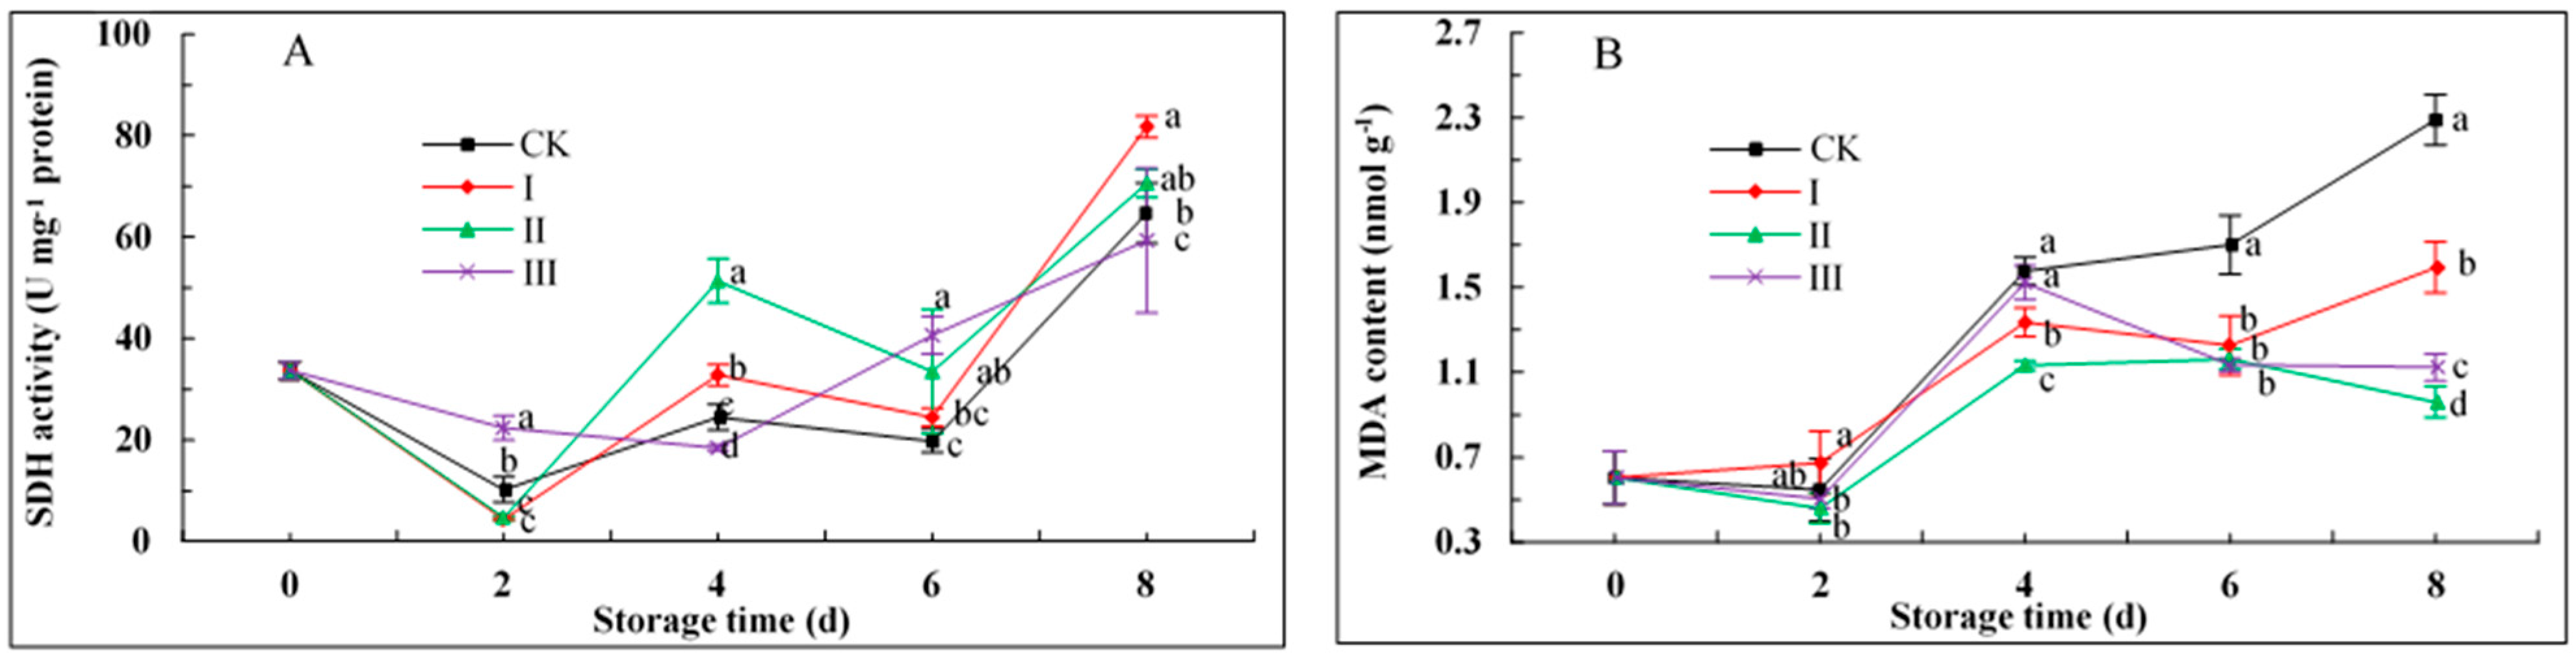
3.9. SDH Activity and MDA Content

SDH activity was maximal on day 8 for all groups (Figure 6A). On days 4 and 8, activity for I and II was higher, but for III was lower relative to CK. Activities on day 8 were 64.77, 81.80, 70.55, and 59.32 U mg−1 protein for CK, I, II, and III, respectively. Group III was significantly lower than I or II at day 8.
MDA content increased during the 8 days in storage (Figure 6B). At the initial time, the highest MDA content was observed in group I. Subsequently, the content of MDA in group CK was higher than that in IAITC-treated groups until the end of storage. On day 8, the value for CK was 2.29, significantly higher than those for I (1.59 nmol g−1), II (0.96 nmol g−1), and III (1.12 nmol g−1).

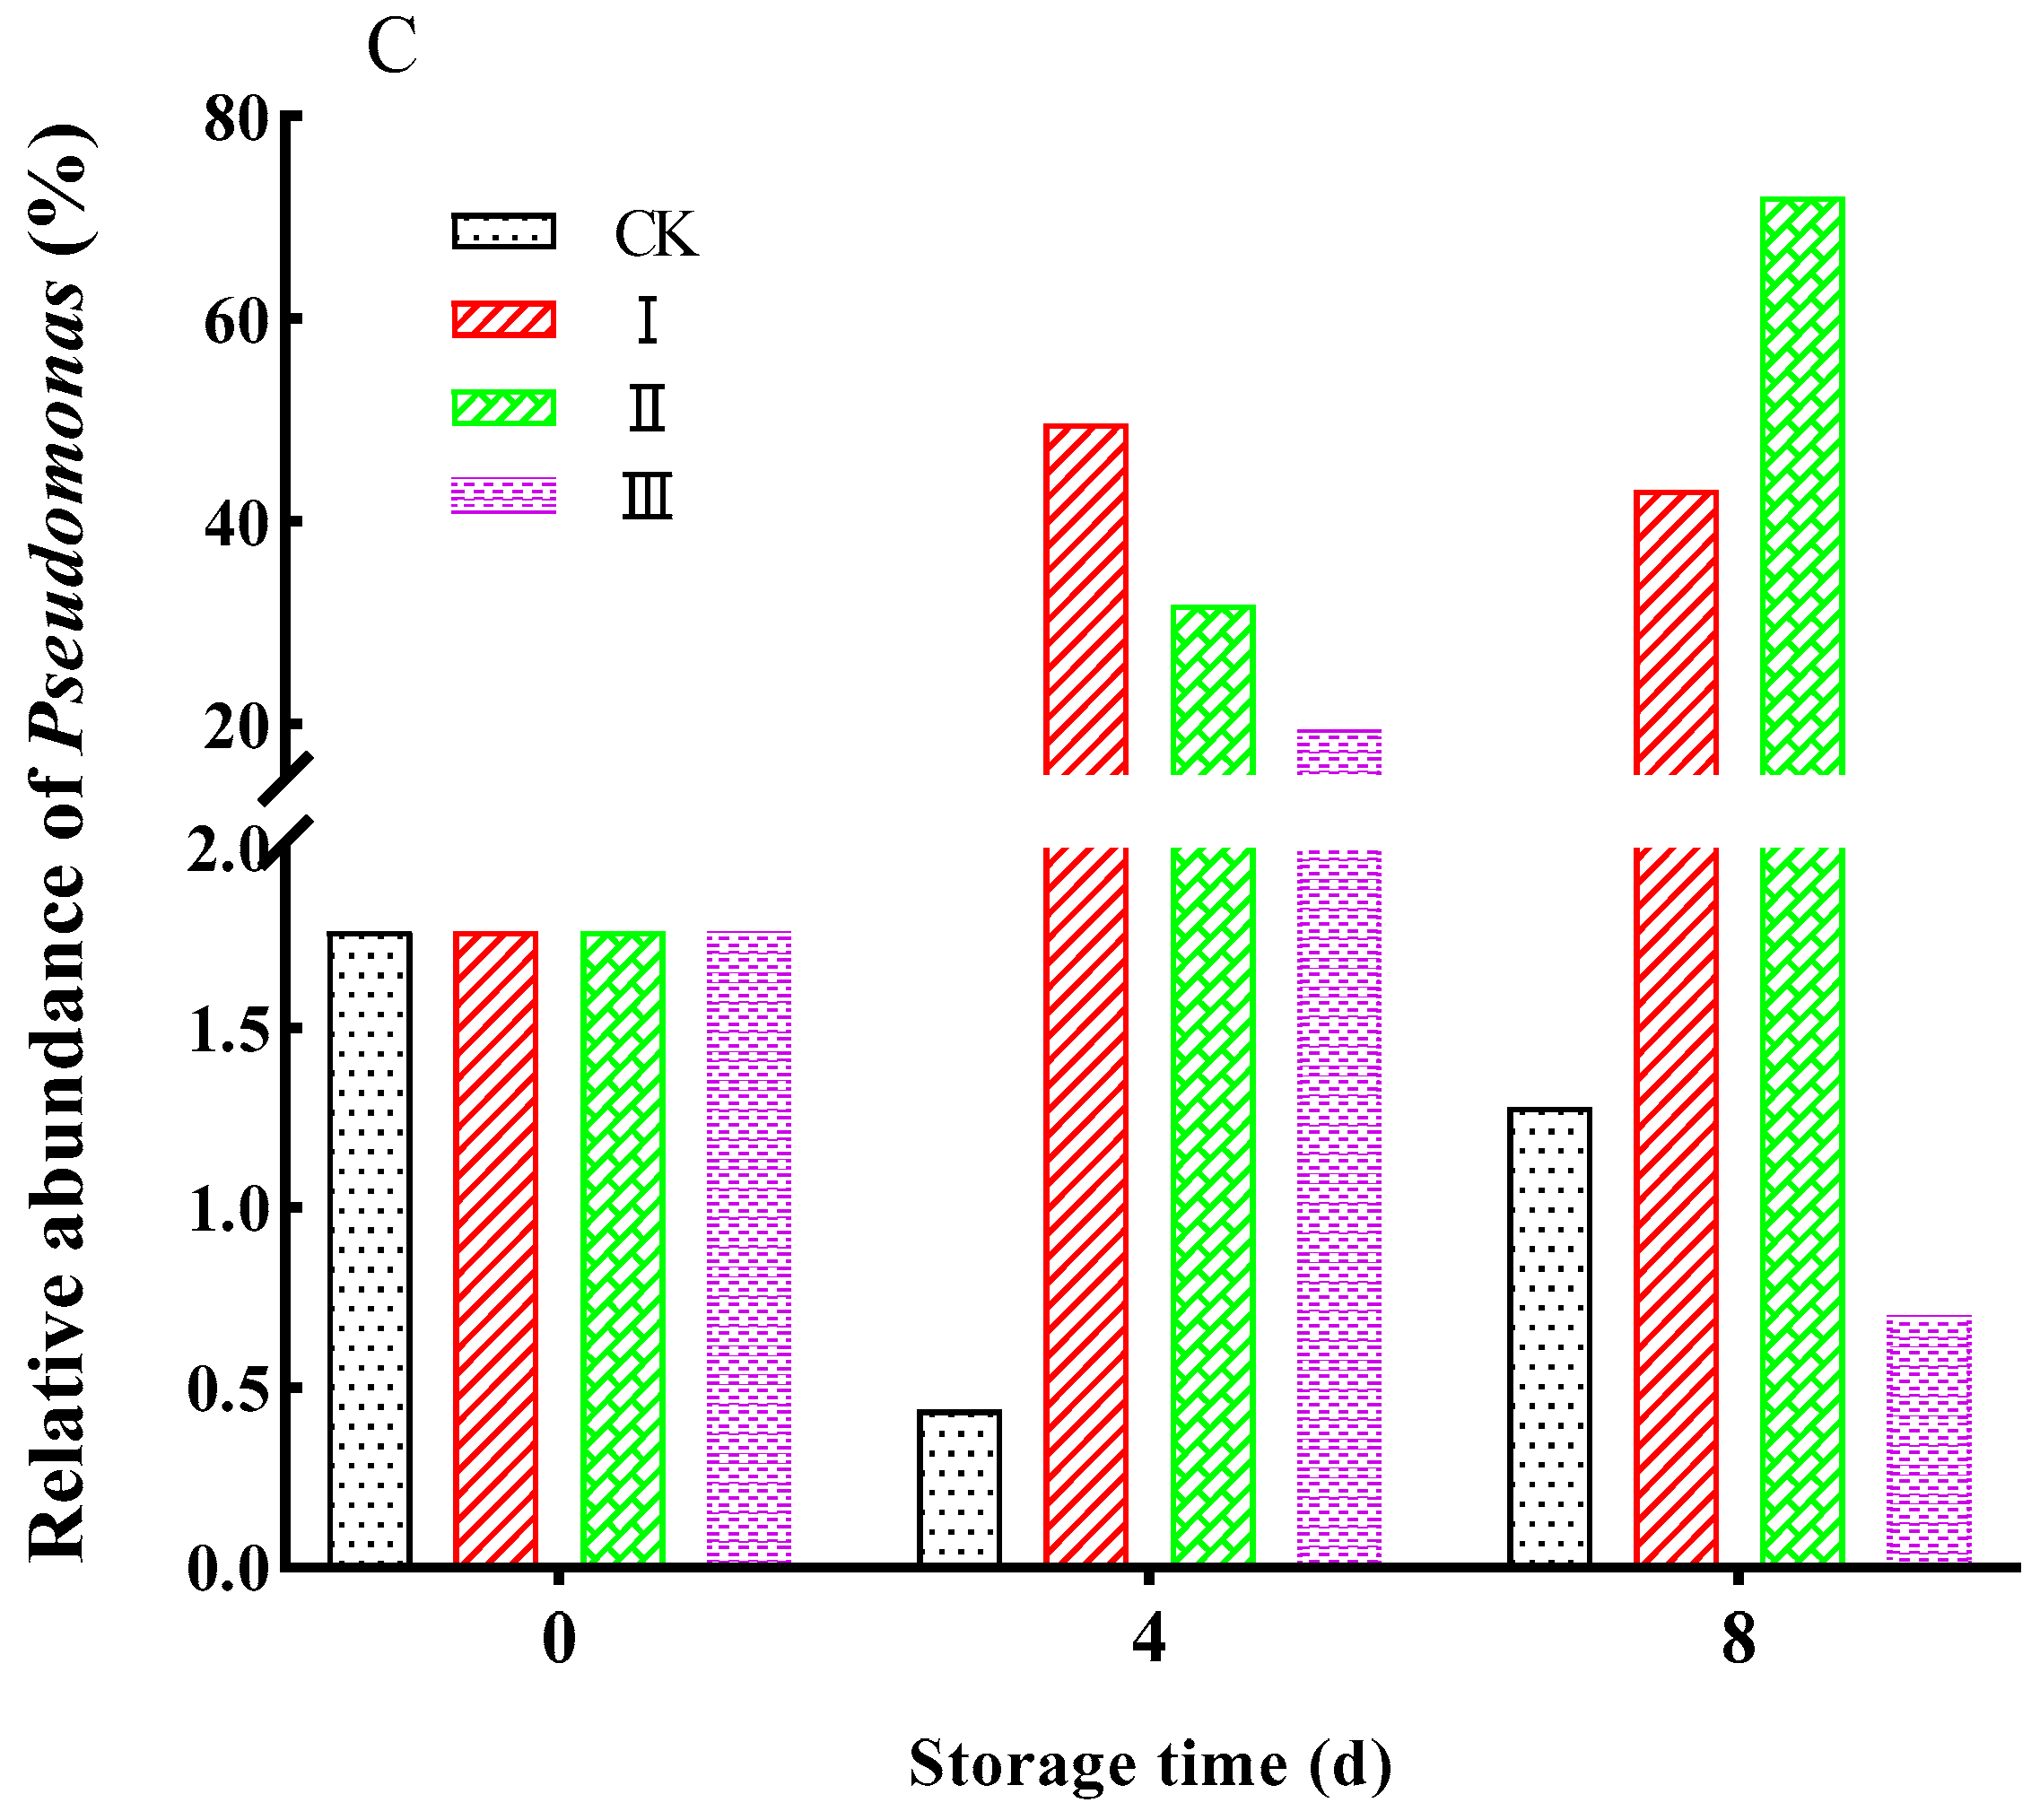
3.10. Bacterial Colony Counts

In the present study, microbial quantity (total plate count) was 4.36 log CFU g−1 at the beginning of storage, increasing steadily as storage time extended (Table 1). The microbial quantity in CK was significantly higher than that in the IAITC-treated groups. Values on day 8 for CK, I, II, and III were 7.34, 6.87, 6.76, and 7.01 log CFU g−1, respectively. IAITC effectively inhibited microbial proliferation, and the optimal inhibitory concentration was 50 µL L−1 (group II).

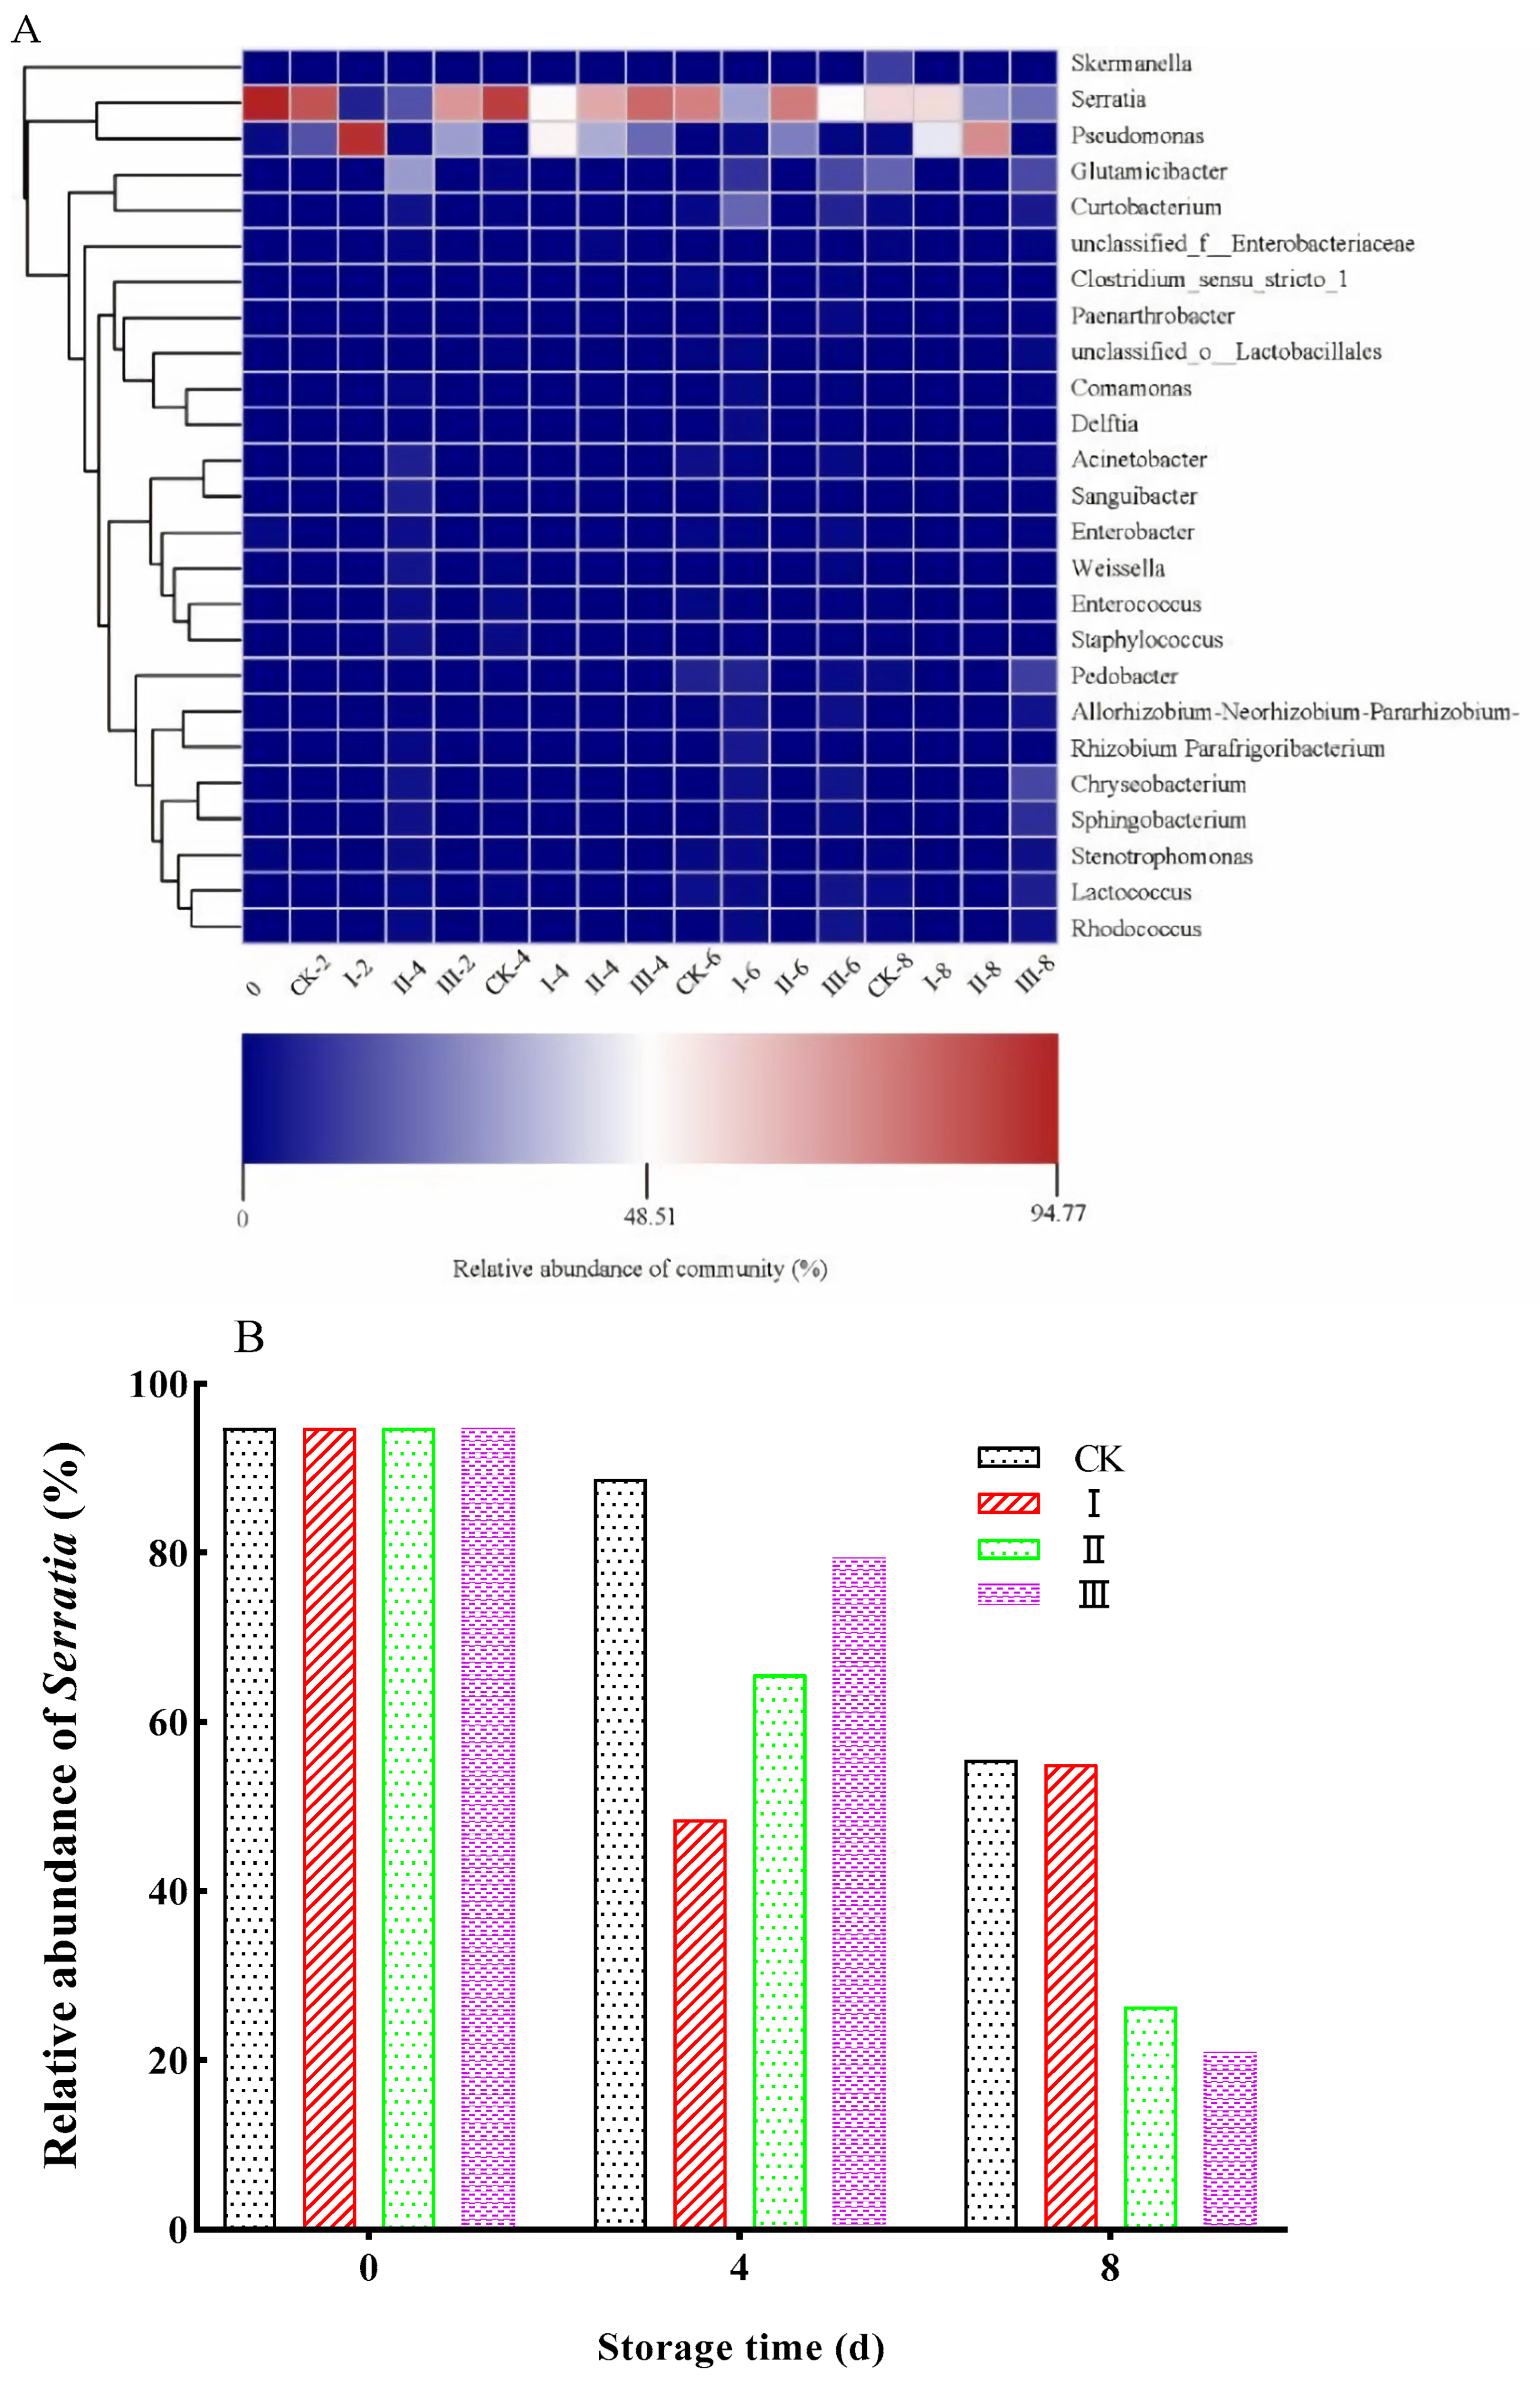
3.11. Bacterial Community Structure

In order to clarify the changes in the relative abundance of bacterial genera, samples from day 0, 4, and 8 were selected for analysis of the bacterial community structure (Figure 7A). A heat map revealed that there were two main bacteria on the surface of F. velutipes. On day 0, the predominant genus was Serratia (relative abundance 94.77%). Along with the extension in storage time, relative abundance of Serratia declined (Figure 7B). On the other hand, Pseudomonas grew rapidly, and became the predominant bacterial community member on day 4 in I, and on day 8 in II (Figure 7C).

3.12. Amino Acid and Fatty Acid Contents

The amino acid and fatty acid contents in samples before and after storage were detected. Mushrooms are good sources of amino acids. Eighteen amino acids in F. velutipes were categorized on the basis of taste characteristics as MSG-like, sweet, bitter, or tasteless [24] (Table 2). In order to clarify the effect of IAITC on the quality of F. velutipes, the changes in amino acid content before and after storage were detected. On day 0, total amino acid content was 112.11 mg g−1 DW. Total content on day 8 was much higher for all groups, particularly II and III. Asp and Glu are MSG-like amino acids that contribute to mushroom flavor profiles [25]. The IAITC-treated groups had increased contents of Asp, Glu, Ser, Met, and Lys on day 8. Thus, IAITC could maintain the flavor of F. velutipes to a certain extent.
Fourteen fatty acids were analyzed and categorized based on the degree of unsaturation, as saturated, monounsaturated, or polyunsaturated fatty acids (termed SFAs, MUFAs, or PUFAs, respectively). The most abundant components of these three categories were palmitic acid, oleic acid, and linoleic acid, respectively (Table 3). Total fatty acid content increased during storage (day 8 vs. day 0) for all groups, and the increase was greater for I and II than for CK.
The content of MSG-like amino acids for the IAITC-treated groups and that of PUFA except III was higher than CK on day 8.

4. Discussion

The respiration rate for F. velutipes is high, and the thin epidermis cannot prevent transpiration effectively during postharvest, which results in weight loss and tissue fragility. Water loss in mushrooms accelerates senescence and cap opening by reducing the cohesive force between water and proteins [3]. Water loss also leads to widening of intercellular space and loss of tissue turgidity. In the present study, there were some changes in the appearance of F. velutipes, including cap opening and stipe elongation and bending. The underlying changes in mushroom appearance were revealed by microstructure observation, which revealed tissue breakage and shrinkage increasing with lengthening storage time. These changes were caused by water loss rather than respiration metabolism, and IAITC fumigation could mitigate the water loss from F. velutipes during storage.
Chitin, the major component of fungal cell walls, plays an essential role in maintaining the structure. The content of chitin was associated with mushroom toughness during postharvest. Along with the increase in chitin content, covalent bonds between chitin and R-glucan formatted and enhanced the rigidity of the hyphal cell wall [26]. Group CK had relatively lower chitin content than others. As a result, higher chitin content in groups treated with IAITC could be responsible for maintaining the integrity of cell walls and increasing the texture toughening. In the present study, the increase in chitin may be the reason why IAITC fumigation maintained F. velutipes morphology.
After harvest, sensory attributes of F. velutipes odor deteriorated rapidly [27,28]. Browning, which reduced commercial value and consumer acceptability greatly, is a common phenomenon in F. velutipes and other mushrooms [28,29,30,31]. In this study, browning degree was measured by spectrophotometry for mirroring the visual change in the sensory attributes of F. velutipes. IAITC treatment reduced the degree of browning significantly in F. velutipes. The major causative factors in this process are enzymatic reactions, physical damage, and microbial infestation [29]. PPO promotes browning by catalyzing oxidation of polyphenols to melanin [31]. TYR, also called catecholase or diphenol oxidase, is a member of the PPO family [32]. As a mono- and di-phenolase, TYR catalyzes hydroxylation of monophenols (e.g., L-tyrosine) to 3,4-dihydroxyphenylalanine (L-dopa), and oxidizes L-dopa to dopaquinone in the first two rate-limiting steps of melanin biosynthesis, respectively [18,33]. The findings indicated that 50 μL L−1 IAITC (group II) notably reduced PPO and TYR activity during days 1–4, which relieved the degree of browning by reducing oxidation of phenols.
During maturation/aging processes of mushrooms, oxidative damage by ROS causes damage to membrane and alters cell structure and functions [34]. ROS-scavenging enzymes (SOD, POD, and CAT) help to reduce oxidative damage [18,22]. Ascorbic acid (vitamin C) is another powerful antioxidant that inhibits ROS damage and delays senescence [34,35]. IAITC treatment increased the activity of SOD and slowed the decline in POD/CAT activity. Fumigation with IAITC essentially enhanced ascorbic acid content in F. velutipes through day 6. These contributed to lower degrees of ROS damage and cell membrane peroxidation. Although phenolic compounds, another important type of antioxidant, scavenge free radicals and suppress lipid peroxidation in mushrooms [21,22], the accumulation of phenolic in F. velutipes was suppressed by IAITC. The results were in agreement with previous findings regarding the effects of ITCs on quality preservation of mulberries [11] and strawberries [13]. ITCs did not contribute to the maintenance of phenolic content. MDA is a product of lipid peroxidation and serves as an indicator of cell membrane damage in postharvest mushrooms [18,22]. In this study, IAITC suppressed the accumulation of MDA content in mushrooms, which illustrated that IAITC reduced the damage to cell membrane by ROS. It indicates that IAITC mitigated cell membrane damage in F. velutipes. This could be attributed to the increase/maintenance of SOD and POD/CAT activities and ascorbic acid content under IAITC treatment. Considering the content of chitin, it is speculated that IAITC maintains the structural integrity of the cells.
Intact cells have higher vitality. Control of ripening and aging processes in mushrooms depends on energy metabolism, and tricarboxylic acid (TCA) cycle plays an essential role in ATP production and intracellular energy metabolism. In postharvest mushrooms, the level of energy metabolism is reflected by the activity level of SDH, a rate-limiting enzyme in the TCA cycle [30]. High ITC concentration inhibited biophysical activity by suppressing SDH activity and energy metabolism in Aspergillus niger (“black mold” fungus) [14]. In the present study, 250 μL L−1 IAITC (group III) had similar effects. As a result, IAITC concentrations 10 and 50 μL L−1 (groups I and II) enhanced postharvest SDH activity and ATP production by delaying senescence.
Deterioration of mushroom quality is typically caused by microorganisms (microbes) presenting in culture medium, packaging, or storage environments [28]. Serratia, an anaerobic genus, is a frequent cause of “blown pack” spoilage in foods such as vacuum-packaged meats [36]. Pseudomonas frequently contributes to quality deterioration of mushrooms by accelerating browning and softening processes [37,38,39]. In this study, the increasing concentration of IAITC reduced growth of Serratia, but not Pseudomonas (Figure 4C). Serratia growth was also inhibited by three aliphatic ITCs (AITC, methyl ITC, and propyl ITC). Cluster analysis revealed similar antibacterial activities of these ITCs against various genera [10]. Color, firmness, antioxidant bioactivity, and odor in postharvest mushrooms are all negatively affected by microbial spoilage [28,37,39]. IAITC has the potential to delay quality deterioration of mushrooms during storage through its antibacterial activity.
Asp and Glu are MSG-like amino acids that contribute to mushroom flavor profiles [25]. The IAITC-treated groups had increased contents of Asp, Glu, Ser, Met, and Lys on day 8. The major fatty acid components were unsaturated types, particularly PUFAs, as observed previously in other mushroom species. The most abundant mushroom PUFAs in general are linoleic acid and α-linoleic acid, which are essential fatty acids that cannot be synthesized by the human body and therefore have important nutritional value [40]. During the present study, linoleic acid was the predominant fatty acid, followed by α-linoleic acid. Linoleic acid content increased in all groups during storage, and was significantly higher on day 8 in groups I and II compared to CK. We analyzed amino acid and PUFA levels because these are important nutritional components of mushrooms. Asp and Glu, MSG-like amino acids contributing to “umami” taste in F. velutipes, were accumulated in the IAITC-treated groups. In many edible mushroom species, linoleic acid is a precursor of 1-octen-3-ol, an aromatic compound that contributes to specific flavors [41]. IAITC treatment evidently helped maintain aroma profiles, and promoted accumulation of PUFAs, in I and II postharvest.

5. Conclusions

To summarize, IAITC is capable in controlling postharvest decay in F. velutipes. Inhibition of tyrosinase (TYR) activity by IAITC treatment effectively promoted antioxidant bioactivity and suppressed the browning process. On the other hand, the treatment with IAITC inhibited the expansion of bacterial population on the F. velutipes surface, thus alleviating bacterial infection. It is helpful in preserving the nutritional contents in mushroom and maintaining higher levels of amino acids and fatty acids. Furthermore, IAITC could reduce the damage to cells. IAITC treatment (50–250 μL L−1) maintained the tissue structure in F. velutipes by increasing the chitin content and relieving the weight loss by reducing the transpiration rate. The overall effect of 50 μL L−1 IAITC was the best. These results imply that IAITC application may provide a new insight for postharvest preservation in mushroom or other agricultural products.

Author Contributions

P.Z.: Data curation, Formal analysis, Investigation, Methodology, Resources, and Writing—original draft. P.W.: Data curation, Formal analysis, Investigation, Methodology, Resources, Writing—original draft, and Writing—review and editing. Q.T.: Data curation, Formal analysis, Investigation, Methodology, Resources, and Validation. T.C.: Data curation, Formal analysis, Investigation, Methodology, and Resources. G.T.: Data curation, Formal analysis, and Writing—review and editing. C.Y.: Data curation, Formal analysis, and Funding acquisition. N.Y.: Formal analysis and Writing—review and editing. Q.L.: Conceptualization, Data curation, Formal analysis, Funding acquisition, Investigation, Methodology, Project administration, Resources, Supervision, Validation, Writing—original draft, and Writing—review and editing. All authors have read and agreed to the published version of the manuscript.

Funding

This research was funded by the Liu Qinghong Specialist Station of Yunnan Province (No. 202305AF150164) and the China Agriculture Research System (No. CARS-20-01A).

Data Availability Statement

The authors are not authorized to release data.

Conflicts of Interest

The authors declare no conflict of interest.

Appendix A

Figure A1. CO2 concentration in containers stored at 6 °C for the indicated periods following treatment with 10 (group I), 50 (group II), or 250 (group III) µL L−1 IAITC, or with distilled water (group CK). Error bars indicate SD calculated from three replicate experiments, and differing letters indicate significant (p < 0.05) differences between groups for a given storage period.
Agronomy 13 01771 g0a1
Figure A2. Chitin content in F. velutipes stored at 6 °C for the indicated periods following treatment with 10 (group I), 50 (group II), or 250 (group III) µL L−1 IAITC, or with distilled water (group CK). Error bars indicate SD calculated from three replicate experiments, and differing letters indicate significant (p < 0.05) differences between groups for a given storage period.
Agronomy 13 01771 g0a2

References

  1. Marçal, S.; Sousa, A.S.; Taofiq, O.; Antunes, F.; Morais, A.M.M.B.; Freitas, A.C.; Barros, L.; Ferreira, I.C.F.R.; Pintado, M. Impact of postharvest preservation methods on nutritional value and bioactive properties of mushrooms. Trends Food Sci. Technol. 2021, 110, 418–431. [Google Scholar] [CrossRef]
  2. Royse, D.J.; Baars, J.; Tan, Q. Current overview of mushroom production in the world. Edible Med. Mushrooms Technol. Appl. 2017, 2, 5–13. [Google Scholar] [CrossRef]
  3. Shi, C.; Wu, Y.; Fang, D.; Pei, F.; Mariga, A.M.; Yang, W.; Hu, Q. Effect of nanocomposite packaging on postharvest senescence of Flammulina velutipes. Food Chem. 2018, 246, 414–421. [Google Scholar] [CrossRef] [PubMed]
  4. Tano, K.; Arul, J.; Doyon, G.; Castaigne, F. Atmospheric composition and quality of fresh mushrooms in modified atmosphere packages as affected by storage temperature abuse. J. Food Sci. 1999, 64, 1073–1077. [Google Scholar] [CrossRef]
  5. Fang, D.L.; Yang, W.J.; Kimatu, B.M.; Mariga, A.M.; Zhao, L.Y.; An, X.X.; Hu, Q.H. Effect of nanocomposite-based packaging on storage stability of mushrooms (Flammulina velutipes). Innov. Food Sci. Emerg. Technol. 2016, 33, 489–497. [Google Scholar] [CrossRef]
  6. Xu, Y.Y.; Tian, Y.; Ma, R.N.; Liu, Q.H.; Zhang, J. Effect of plasma activated water on the postharvest quality of button mushrooms, Agaricus bisporus. Food Chem. 2016, 197, 436–444. [Google Scholar] [CrossRef]
  7. Zhang, K.X.; Pu, Y.Y.; Sun, D.W. Recent advances in quality preservation of postharvest mushrooms (Agaricus bisporus): A review. Trends Food Sci. Technol. 2018, 78, 72–82. [Google Scholar] [CrossRef]
  8. Li, N.; Wu, X.; Zhuang, W.; Wu, C.; Rao, Z.; Du, L.; Zhou, Y. Cruciferous vegetable and isothiocyanate intake and multiple health outcomes. Food Chem. 2022, 375, 131816. [Google Scholar] [CrossRef]
  9. Kyung, K.H. Antimicrobial properties of allium species. Curr. Opin. Biotechnol. 2012, 23, 142–147. [Google Scholar] [CrossRef]
  10. Wilson, A.E.; Bergaentzlé, M.; Bindler, F.; Marchioni, E.; Lintz, A.; Ennahar, S. In vitro efficacies of various isothiocyanates from cruciferous vegetables as antimicrobial agents against foodborne pathogens and spoilage bacteria. Food Control 2013, 30, 318–324. [Google Scholar] [CrossRef]
  11. Chen, H.; Gao, H.; Fang, X.; Ye, L.; Zhou, Y.; Yang, H. Effects of allyl isothiocyanate treatment on postharvest quality and the activities of antioxidant enzymes of mulberry fruit. Postharvest Biol. Technol. 2015, 108, 61–67. [Google Scholar] [CrossRef]
  12. Park, D.; Park, S.Y.; Liu, K.H.; Ku, K.M. Optimal allyl isothiocyanate concentration on Botrytis cinerea during the postharvest storage of blackberries and mechanism of blackberry color changes at high concentration of allyl isothiocyanate. Postharvest Biol. Technol. 2023, 199, 112292. [Google Scholar] [CrossRef]
  13. Sun, Y.; Wang, Y.; Xu, Y.; Chen, T.; Li, B.; Zhang, Z.; Tian, S. Application and mechanism of benzyl-isothiocyanate, a natural antimicrobial agent from cruciferous vegetables, in controlling postharvest decay of strawberry. Postharvest Biol. Technol. 2021, 180, 111604. [Google Scholar] [CrossRef]
  14. Wu, T.L.; Hu, Y.M.; Sun, Y.; Zhang, Z.J.; Wu, Z.R.; Zhao, W.B.; Tang, C.; Du, S.S.; He, Y.H.; Ma, Y.; et al. Insights into the mode of action of 2-(4-methoxyphenyl) ethyl isothiocyanate on Aspergillus niger. Food Control 2022, 136, 108871. [Google Scholar] [CrossRef]
  15. Lei, J.; Li, B.; Zhang, N.; Yan, R.; Guan, W.; Brennan, C.S.; Gao, H.; Peng, B. Effects of UV-C treatment on browning and the expression of polyphenol oxidase (PPO) genes in different tissues of Agaricus bisporus during cold storage. Postharvest Biol. Technol. 2018, 139, 99–105. [Google Scholar] [CrossRef]
  16. Wang, Y.; Wen, Y.; Gao, J. Anatomy and microscopic characteristics of Picris japonica. Rev. Bras. Farmacogn. 2018, 28, 640–646. [Google Scholar] [CrossRef]
  17. Hassainia, A.; Satha, H.; Boufi, S. Chitin from Agaricus bisporus: Extraction and characterization. Int. J. Biol. Macromol. 2018, 117, 1334–1342. [Google Scholar] [CrossRef]
  18. Wang, X.; Huang, X.; Zhang, F.; Hou, F.; Yi, F.; Sun, X.; Yang, Q.; Han, X.; Liu, Z. Characterization of chitosan/zein composite film combined with tea polyphenol and its application on postharvest quality improvement of mushroom (Lyophyllum decastes Sing.). Food Packag. Shelf Life 2022, 33, 100869. [Google Scholar] [CrossRef]
  19. Mahdavi, A.; Mohammadsadeghi, N.; Mohammadi, F.; Saadati, F.; Nikfard, S. Evaluation of inhibitory effects of some novel phenolic derivatives on the mushroom tyrosinase activity: Insights from spectroscopic analyses, molecular docking and in vitro assays. Food Chem. 2022, 387, 132938. [Google Scholar] [CrossRef]
  20. Marklund, S.; Marklund, G. Involvement of the superoxide anion radical in the autoxidation of pyrogallol and a convenient assay for superoxide dismutase. Eur. J. Biochem. 1974, 47, 469–474. [Google Scholar] [CrossRef] [PubMed]
  21. Wang, X.; Sun, Y.; Liu, Z.; Huang, X.; Yi, F.; Hou, F.; Zhang, F. Preparation and characterization of chitosan/zein film loaded with lemon essential oil: Effects on postharvest quality of mushroom (Agaricus bisporus). Int. J. Biol. Macromol. 2021, 192, 635–643. [Google Scholar] [CrossRef] [PubMed]
  22. Yan, M.; Yuan, B.; Xie, Y.; Cheng, S.; Huang, H.; Zhang, W.; Chen, J.; Cao, C. Improvement of postharvest quality, enzymes activity and polyphenoloxidase structure of postharvest Agaricus bisporus in response to high voltage electric field. Postharvest Biol. Technol. 2020, 166, 111230. [Google Scholar] [CrossRef]
  23. Roy, S.; Anantheswaran, R.C.; Beelman, R.B. Fresh mushroom quality as affected by modified atmosphere packaging. J. Food Sci. 1995, 60, 334–340. [Google Scholar] [CrossRef]
  24. Mau, J.L.; Lin, H.C.; Chen, C.C. Non-volatile components of several medicinal mushrooms. Food Res. Int. 2001, 34, 521–526. [Google Scholar] [CrossRef]
  25. Sissons, J.; Davila, M.; Du, X. Sautéing and roasting effect on free amino acid profiles in portobello and shiitake mushrooms, and the effect of mushroom- and cooking-related volatile aroma compounds on meaty flavor enhancement. Int. J. Gastron. Food Sci. 2022, 28, 100550. [Google Scholar] [CrossRef]
  26. Zivanovic, S.; Busher, R.W.; Kim, K.S. Textural changes in mushrooms (Agaricus bisporus) associated with tissue ultrastructure and composition. J. Food Sci. 2000, 65, 1404–1408. [Google Scholar] [CrossRef]
  27. Xia, R.; Wang, L.; Xin, G.; Bao, X.; Sun, L.; Xu, H.; Hou, Z. Preharvest and postharvest applications of 1-MCP affect umami taste and aroma profiles of mushrooms (Flammulina velutipes). LWT 2021, 144, 111176. [Google Scholar] [CrossRef]
  28. Niu, Y.; Yun, J.; Bi, Y.; Wang, T.; Zhang, Y.; Liu, H.; Zhao, F. Predicting the shelf life of postharvest Flammulina velutipes at various temperatures based on mushroom quality and specific spoilage organisms. Postharvest Biol. Technol. 2020, 167, 111235. [Google Scholar] [CrossRef]
  29. Lin, X.; Sun, D.W. Research advances in browning of button mushroom (Agaricus bisporus): Affecting factors and controlling methods. Trends Food Sci. Technol. 2019, 90, 63–75. [Google Scholar] [CrossRef]
  30. Li, D.; Wang, D.; Fang, Y.; Li, L.; Lin, X.; Xu, Y.; Chen, H.; Zhu, M.; Luo, Z. A novel phase change coolant promoted quality attributes and glutamate accumulation in postharvest shiitake mushrooms involved in energy metabolism. Food Chem. 2021, 351, 129227. [Google Scholar] [CrossRef]
  31. Fu, Y.; Yu, Y.; Tan, H.; Wang, B.; Peng, W.; Sun, Q. Metabolomics reveals dopa melanin involved in the enzymatic browning of the yellow cultivars of East Asian golden needle mushroom (Flammulina filiformis). Food Chem. 2022, 370, 131295. [Google Scholar] [CrossRef] [PubMed]
  32. Mayer, A.M. Polyphenol oxidases in plants-recent progress. Phytochemistry 1986, 26, 11–20. [Google Scholar] [CrossRef]
  33. Chen, Q.X.; Song, K.K.; Qiu, L.; Liu, X.D.; Huang, H.; Guo, H.Y. Inhibitory effects on mushroom tyrosinase by p-alkoxybenzoic acids. Food Chem. 2005, 91, 269–274. [Google Scholar] [CrossRef]
  34. Gill, S.S.; Tuteja, N. Reactive oxygen species and antioxidant machinery in abiotic stress tolerance in crop plants. Plant Physiol. Biochem. 2010, 48, 909–930. [Google Scholar] [CrossRef]
  35. Nasiri, M.; Barzegar, M.; Sahari, M.A.; Niakousari, M. Application of Tragacanth gum impregnated with Satureja khuzistanica essential oil as a natural coating for enhancement of postharvest quality and shelf life of button mushroom (Agaricus bisporus). Int. J. Biol. Macromol. 2018, 106, 218–226. [Google Scholar] [CrossRef]
  36. Húngaro, H.M.; Caturla, M.Y.R.; Horita, C.N.; Furtado, M.M.; Sant’Ana, A.S. Blown pack spoilage in vacuum-packaged meat: A review on clostridia as causative agents, sources, detection methods, contributing factors and mitigation strategies. Trends Food Sci. Technol. 2016, 52, 123–138. [Google Scholar] [CrossRef]
  37. Louis, E.; Villalobos-Carvajal, R.; Reyes-Parra, J.; Jara-Quijada, E.; Ruiz, C.; Andrades, P.; Gacitúa, J.; Beldarraín-Iznaga, T. Preservation of mushrooms (Agaricus bisporus) by an alginate-based-coating containing a cinnamaldehyde essential oil nanoemulsion. Food Packag. Shelf Life 2021, 28, 100662. [Google Scholar] [CrossRef]
  38. Gao, M.; Feng, L.; Jiang, T. Browning inhibition and quality preservation of button mushroom (Agaricus bisporus) by essential oils fumigation treatment. Food Chem. 2014, 149, 107–113. [Google Scholar] [CrossRef]
  39. Fang, D.; Wang, C.; Deng, Z.; Ma, N.; Hu, Q.; Zhao, L. Microflora and umami alterations of different packaging material preserved mushroom (Flammulina filiformis) during cold storage. Food Res. Int. 2021, 147, 110481. [Google Scholar] [CrossRef]
  40. Sande, D.; de Oliveira, G.P.; Moura, M.A.F.; Martins, B.d.A.; Lima, M.T.N.S.; Takahashi, J.A. Edible mushrooms as a ubiquitous source of essential fatty acids. Food Res. Int. 2019, 125, 108524. [Google Scholar] [CrossRef]
  41. Combet, E.; Eastwood, D.C.; Burton, K.S.; Combet, E.; Henderson, J.; Henderson, J.; Combet, E. Eight-carbon volatiles in mushrooms and fungi: Properties, analysis, and biosynthesis. Mycoscience 2006, 47, 317–326. [Google Scholar] [CrossRef]
Figure 1. Weight loss (A) and browning degree (B) in F. velutipes stored at 6 °C for the indicated periods following treatment with 10 (group I), 50 (group II), or 250 (group III) µL L−1 IAITC, or with distilled water (group CK). Error bars indicate SD calculated from three replicate experiments, and differing letters indicate significant (p < 0.05) differences between groups for a given storage period.
Agronomy 13 01771 g001
Figure 2. Gross appearance (A) and microstructure of F. velutipes with different treatment and storage time as viewed by optical microscopy (B) and by SEM (C).
Agronomy 13 01771 g002aAgronomy 13 01771 g002b
Figure 3. PPO (A) and TYR (B) activities in F. velutipes stored at 6 °C for the indicated periods following treatment with 10 (group I), 50 (group II), or 250 (group III) µL L−1 IAITC, or with distilled water (group CK). Error bars indicate SD calculated from three replicate experiments, and differing letters indicate significant (p < 0.05) differences between groups for a given storage period.
Agronomy 13 01771 g003
Figure 4. SOD (A), POD (B), and CAT (C) activities in F. velutipes stored at 6 °C for the indicated periods following treatment with 10 (group I), 50 (group II), or 250 (group III) µL L−1 IAITC, or with distilled water (group CK). Error bars indicate SD calculated from three replicate experiments, and differing letters indicate significant (p < 0.05) differences between groups for a given storage period.
Agronomy 13 01771 g004
Figure 5. Total phenolic (A) and ascorbic acid (B) activities in F. velutipes stored at 6 °C for the indicated periods following treatment with 10 (group I), 50 (group II), or 250 (group III) µL L−1 IAITC, or with distilled water (group CK). Error bars indicate SD calculated from three replicate experiments, and differing letters indicate significant (p < 0.05) differences between groups for a given storage period.
Agronomy 13 01771 g005
Figure 6. SDH activity (A) and MDA content (B) activities in F. velutipes stored at 6 °C for the indicated periods following treatment with 10 (group I), 50 (group II), or 250 (group III) µL L−1 IAITC, or with distilled water (group CK). Error bars indicate SD calculated from three replicate experiments, and differing letters indicate significant (p < 0.05) differences between groups for a given storage period.
Agronomy 13 01771 g006
Figure 7. Relative abundances of various bacterial genera (A), Serratia (B), and Pseudomonas (C) in postharvest F. velutipes for the four experimental groups (10 (group I), 50 (group II), or 250 (group III) µL L−1 IAITC) at storage times 0, 4, and 8 days.
Agronomy 13 01771 g007aAgronomy 13 01771 g007b
Table 1. Microbial quantities (total plate count; log CFU g−1) in F. velutipes stored at 6 °C following treatment with 10 (group I), 50 (group II), or 250 (group III) µL L−1 IAITC, or with distilled water (group CK). Differing letters indicate significant (p < 0.05) differences between groups for a given storage period.
TreatmentStorage Time (d)
02468
CK4.36 ± 0.045.74 ± 0.11 a5.57 ± 0.01 a6.33 ± 0.06 a7.34 ± 0.04 a
4.36 ± 0.045.15 ± 0.01 b5.48 ± 0.03 b6.14 ± 0.03 b6.87 ± 0.06 c
II4.36 ± 0.045.12 ± 0.05 b5.41 ± 0.01 c6.03 ± 0.03 b6.76 ± 0.08 d
III4.36 ± 0.045.05 ± 0.02 b5.34 ± 0.01 d6.04 ± 0.04 b7.01 ± 0.01 b
Table 2. Amino acids in F. velutipes treated with 10 (group I), 50 (group II), or 250 (group III) µL L−1 IAITC when storage time was 0 and 8 days. Differing letters indicate significant (p < 0.05) differences between groups for a given storage period.
Amino Acid (mg g−1)0 d8 d
CKIIIIII
MSG-likeAspartic acid10.85 ± 0.0611.59 ± 0.09 b11.67 ± 0.21 b11.71 ± 0.18 b12.85 ± 0.02 a
Glutamic acid23.67 ± 1.1834.04 ± 0.56 b34.97 ± 0.67 b40.48 ± 0.67 a39.72 ± 0.05 a
Total33.7645.6346.6452.1952.57
SweetAlanine6.63 ± 0.8310.46 ± 0.02 a9.50 ± 0.18 b10.34 ± 0.17 a9.06 ± 0.10 c
Glycine5.36 ± 1.036.98 ± 0.03 b6.91 ± 0.12 b7.04 ± 0.12 b7.25 ± 0.01 a
Serine6.00 ± 0.766.80 ± 0.05 c6.82 ± 0.12 c7.02 ± 0.11 b7.29 ± 0.02 a
Threonine5.84 ± 0.437.43 ± 0.08 a7.19 ± 0.13 b7.36 ± 0.12 ab7.39 ± 0.02 a
Total23.8331.6730.4231.7630.99
BitterArginine5.38 ± 0.747.10 ± 0.20 b6.99 ± 0.09 b7.37 ± 0.12 a7.35 ± 0.02 a
Histidine3.14 ± 1.754.17 ± 0.06 a4.10 ± 0.05 ab4.19 ± 0.09 a4.03 ± 0.02 b
Leucine7.87 ± 0.649.34 ± 0.05 a8.79 ± 0.23 b8.67 ± 0.21 b8.92 ± 0.08 b
Phenylalanine5.23 ± 0.767.12 ± 0.04 a6.89 ± 0.12 b6.90 ± 0.14 b7.15 ± 0.12 a
Methionine1.69 ± 0.041.82 ± 0.08 a1.89 ± 0.05 a1.88 ± 0.03 a1.91 ± 0.07 a
Cysteine1.11 ± 0.041.92 ± 0.02 a1.82 ± 0.02 b1.80 ± 0.03 b1.90 ± 0.04 a
Valine5.94 ± 0.597.81 ± 0.05 a7.27 ± 0.17 b7.31 ± 0.14 b7.28 ± 0.02 b
Total30.3639.2837.7538.1238.54
TastelessIsoleucine4.61 ± 0.035.54 ± 0.04 a5.14 ± 0.20 b5.07 ± 0.18 b5.19 ± 0.02 b
Lysine7.63 ± 0.0210.22 ± 0.07 b10.33 ± 0.19 b10.60 ± 0.18 a10.82 ± 0.07 a
Proline5.12 ± 2.645.41 ± 0.11 b5.44 ± 0.14 ab5.23 ± 0.14 ab5.54 ± 0.07 a
Tryptophan2.22 ± 0.282.42 ± 0.01 c2.40 ± 0.01 d2.47 ± 0.01 b2.53 ± 0.01 a
Tyrosine4.58 ± 1.205.99 ± 0.11 a5.87 ± 0.13 a5.98 ± 0.17 a6.02 ± 0.04 a
Total24.1629.5829.1429.3530.1
Total amino acids112.11145.3143.12150.51151.20
Table 3. Fatty acids in F. velutipes treated with 10 (group I), 50 (group II), or 250 (group III) µL L−1 IAITC when storage time was 0 and 8 days. Differing letters indicate significant (p < 0.05) differences between groups for a given storage period. n.d.: not detected.
Fatty Acids (mg g−1)0 d8 d
CKIIIIII
Saturated fatty acids (SFA)Lauric acid C12:00.16 ± 0.010.30 ± 0.02 b0.36 ± 0.01 a0.27 ± 0.01 c0.27 ± 0.02 c
Myristic acid C14:00.32 ± 0.030.38 ± 0.02 b0.47 ± 0.01 a0.38 ± 0.02 b0.38 ± 0.02 b
Pentadecanoic acid C15:00.09 ± 0.010.22 ± 0.01 b0.24 ± 0.0 b0.29 ± 0.02 a0.23 ± 0.01 b
Palmitic acid C16:02.76 ± 0.212.61 ± 0.15 b3.05 ± 0.04 a2.72 ± 0.16 b2.49 ± 0.13 b
Heptadecanoic acid C17:0n.d.n.d.n.d.0.03 ± 0.01 a0.02 ± 0.01 b
Stearic acid C18:00.22 ± 0.020.20 ± 0.01 c0.25 ± 0.01 a0.23 ± 0.01 b0.19 ± 0.01 c
Arachidic acid C20:0n.d.n.d.n.d.n.d.n.d.
Heneicosanoic acid C21:0n.d.0.20 ± 0.00 a0.20 ± 0.00 a0.20 ± 0.00 a0.20 ± 0.00 a
Behenic acid C22:00.10 ± 0.010.90 ± 0.01 b0.11 ± 0.00 a0.11 ± 0.00 a0.09 ± 0.01 b
Lignoceric acid C24:0n.d.n.d.n.d.n.d.n.d.
Total3.653.824.504.013.69
Monounsaturated fatty acids (MUFA)Palmitoleic acid C16:10.18 ± 0.020.33 ± 0.02 a0.30 ± 0.01 b0.30 ± 0.02 b0.24 ± 0.01 c
Oleic acid C18:1n9c0.78 ± 0.060.95 ± 0.07 b1.05 ± 0.02 a0.95 ± 0.06 b0.80 ± 0.03 c
cis-11-Eicosenoic acid C20:1n.d.n.d.n.d.n.d.n.d.
Erucic acid C22:1n9n.d.0.04 ± 0.00 d0.06 ± 0.01 b0.07 ± 0.01 a0.05 ± 0.01 c
Nervonic acid C24:1n.d.0.20 ± 0.02 ab0.25 ± 0.01 a0.24 ± 0.03 a0.13 ± 0.10 c
Total0.961.531.661.551.27
Polyunsaturated fatty acids (PUFA)Linoleic acid C18:2n6c8.34 ± 0.3411.18 ± 0.74 b12.66 ± 0.17 a12.15 ± 0.77 ab11.13 ± 0.44 b
α-linoleic acid C18:3n34.53 ± 0.415.17 ± 0.34 b5.63 ± 0.09 a4.90 ± 0.29 bc4.46 ± 0.17 c
cis-11,14,17-Eicosatrienoic acid C20:3n3n.d.n.d.n.d.n.d.n.d.
Total13.8316.3518.3217.0515.59
Total fatty acids 18.4421.6924.4822.6720.55
Disclaimer/Publisher’s Note: The statements, opinions and data contained in all publications are solely those of the individual author(s) and contributor(s) and not of MDPI and/or the editor(s). MDPI and/or the editor(s) disclaim responsibility for any injury to people or property resulting from any ideas, methods, instructions or products referred to in the content.

