1. Introduction
Two-dimensional generalized correlation spectroscopy (2D-COS) is an improvement on traditional spectroscopic methods, which reveals the underlying similarity or dissimilarity among systematic variations in spectroscopic signal intensities [
1,
2]. To be sure, 2D-COS turns one-dimensional spectra into two-dimensional maps and identifies correlations between individual bands in the spectrum based on cross-correlation techniques [
3,
4]. The mathematical apparatus of this technique makes it possible to find the relationship between individual bands in the same spectrum (homospectral 2D-COS) [
5,
6] or spectra in different regions for a single object or different spectroscopic techniques or different samples (heterospectral 2D-COS) [
7]. Indeed, 2D-COS simplifies complex spectra consisting of multiple overlapping bands and increases spectral resolution.
The application of 2D-COS is based on the use of an additional factor to the analyzed system, called
external perturbation, which selectively excites or changes different components of the system that are revealed in the spectra. In chemistry, the external perturbation of the sample is usually produced by heating [
8,
9,
10,
11,
12,
13], electrical effects [
14,
15], pH change [
16], or component-selective chemical reactions [
17,
18].
In IR spectroscopy, 2D-COS makes it possible to identify overtones and Raman-active bands more accurately, as well as to establish the presence of interconnections between vibrations of bands of inorganic compounds and organic structures during the formation of complex compounds or adsorption [
19,
20,
21,
22]. At the same time, altering the test sample by heating [
10,
11,
13], pH [
16], or reactions [
17,
18] with the help of 2D-COS at different experimental conditions, it is possible to obtain extensive information about the structural-group composition of complex substances or their mixtures with high reliability. A 2D-COS is used in IR spectroscopy to study polymers [
23,
24], proteins [
25,
26], or biomedical samples [
7,
27,
28,
29], but is not in full use yet in soil analysis and for such natural samples as humic substances.
However, the possibilities of 2D-COS are essential for such complex samples as soils, especially for the information on soil organic matter (SOM), which shows weaker IR bands compared to mineral matrix bands, which hinders the interpretation and band identification [
30,
31,
32,
33]. For chernozems as one of the most fertile and agriculturally used soils, there is a substantial risk of degradation of soil structures on cultivating [
34,
35], which is a consequence of changes in SOM, which are difficult to find by IR spectroscopy and related methods without separation.
Also, another problem of soil analysis is sample preparation itself as any destructive chemical techniques inevitably change the composition of soil. Still, to use all the possibilities of IR spectroscopy of soils with 2D-COS, considering its spectral limitations, the use of quantitative preparative fractionation is very expedient [
36,
37]. Since soils are mixtures of different particles with a very wide size distribution (from millimeters to tens of nanometers) [
38], while SOM is unevenly distributed between these particles [
39,
40], and all methods of registration are dependent on particle size, the size fractionation is a critical point in obtaining adequate results for IR analysis of soils as they show the different compositions of both SOM and mineral matrix [
31,
33]. For 2D-COS, such a size fractionation that separates soil in changing fractions with different SOM contents and composition and different degrees of amorphization of the silicate matrix is a very informative factor that can be used as a perturbation variable for 2D-COS, which does not change the chemical composition of the sample like heating, pH, or reactive agents.
Thus, a method of IR measurements using homospectral 2D-COS for more accurate estimation and identification of bands was used for SOM of chernozem soils. The variable factor for building 2D maps (the external perturbation) is prepared size soil fractions. Chernozems with different land use with different SOM compositions (native steppe, bare fallow, arable land, and shelterbelt) were selected for the study.
2. Materials and Methods
Samples of differently used chernozem soils (typical; Kursk region, Russia) were selected [
30,
31,
33,
41] the native mowed steppe uncultivated for several centuries; 60-year-old shelterbelt on the former arable land, annually cultivated arable land under permanent wheat (cropland); and permanent 60-year-old annually plowed bare fallow (
Figure 1). The soils have a high humus profile developed on loess-like loam and carbonate. The details on soil sample collection are given elsewhere [
33,
41].
Native steppe (
Figure 1, the red marker) vegetation is an example of intact typical chernozem. Samples were taken at the site of the annually mowed steppe of V.V. Alekhin Tsentralno-Chernozemny Nature Reserve. The vegetation cover is about 100% with
Bromus riparius L.,
Festuca sulcata Hack.,
Galium verum L.,
Salvia pratensis L.,
Iris pumila L.,
Adonis vernalis L.,
Vicia tenuifolia Roth.,
Stipa pennata,
Stipa pulcherrima, and
Stipa tirsa.
Permanent bare fallow since 1964 is a site of the former native steppe (
Figure 1) where the soil is annually treated: plowing without sowing and fertilization; thus, since 1964, fresh organic matter has almost not entered this soil type.
Arable land (cropland), as shown in
Figure 1 (the yellow marker), has been under permanent wheat with mineral fertilizers since 1964 on the same former arable land, delimiting the experimental fields is the soil type in which the structure is being restored under the influence of forest vegetation and compared with the arable chernozem, which shows high structural indicators [
42]. This is a shelterbelt forest without a living grass layer of ca. 60 years of age. Forest-forming species:
Quercus robur,
Fraxinus excelsio, and
Acer campestre.
General samples (2 kg) of the topsoil layer (0–10 cm) were sampled in May 2017 from 1.5 m deep sections along genetic horizons and with a step of 10 cm. Wet fractionation of averaged samples was conducted on an AS 200 sieving machine (Retsch, Haan, Germany) with a wet sieving holder. A set of precision sieves with a stainless steel mesh, a diameter of 200 mm, and square mesh sizes of 50, 63, 71, 80, 90, 100, 200, 250, 500 μm, and 1 mm (Retsch) were used to obtain medium and coarse fractions; ultramicro sieves with a diameter of 200 mm and square cells of 20, 30, and 40 μm (Precision Eforming LLC, Cortland, NY, USA) were used to obtain fine fractions. Some fractions were combined due to composition similarity, and in the majority of experiments, the fractions were 20–40, 40–63, 63–80, 80–100, 100–200, 200–250, 250–500 μm, 0.5–1 mm, and over 1 mm. More details are given in [
31].
IR spectra were recorded on a Vertex 70 single-beam Fourier spectrometer, (Bruker Optik, Ettlingen, Germany). A PrayingMantis™ diffuse reflection (DRIFT) accessory (Harrick Scientific Products, Inc., Pleasantville, NY, USA) was used throughout; resolution, 2 cm−1; scanner velocity, 10 kHz; sample and background scan numbers, 128; acquisition mode, double-sided, forward-backward; beamsplitter, KBr; aperture, 8 mm; and detector, wide-range room temperature DLaTGS. The spectrometer, accessories, and attachments were constantly purged at 500 L/h with dry air (dew point, −70 °C) from a PG28L Purge Gas Generator, PEAK Scientific, Glasgow, UK. The ambient temperature was kept at 23 ± 1 °C.
Spectra were processed by Bruker OPUS 8.5 software: automatically converted using the Kubelka–Munk conversion, smoothed by 13 points, and transmittance spectra converted to absorbance. The threshold for transmittance/reflectance is 0.001% corresponding to a Kubelka–Munk value of ca. 500. For background DRIFT measurements, the tilted alignment mirror for the PrayingMantis™ accessory was used [
31].
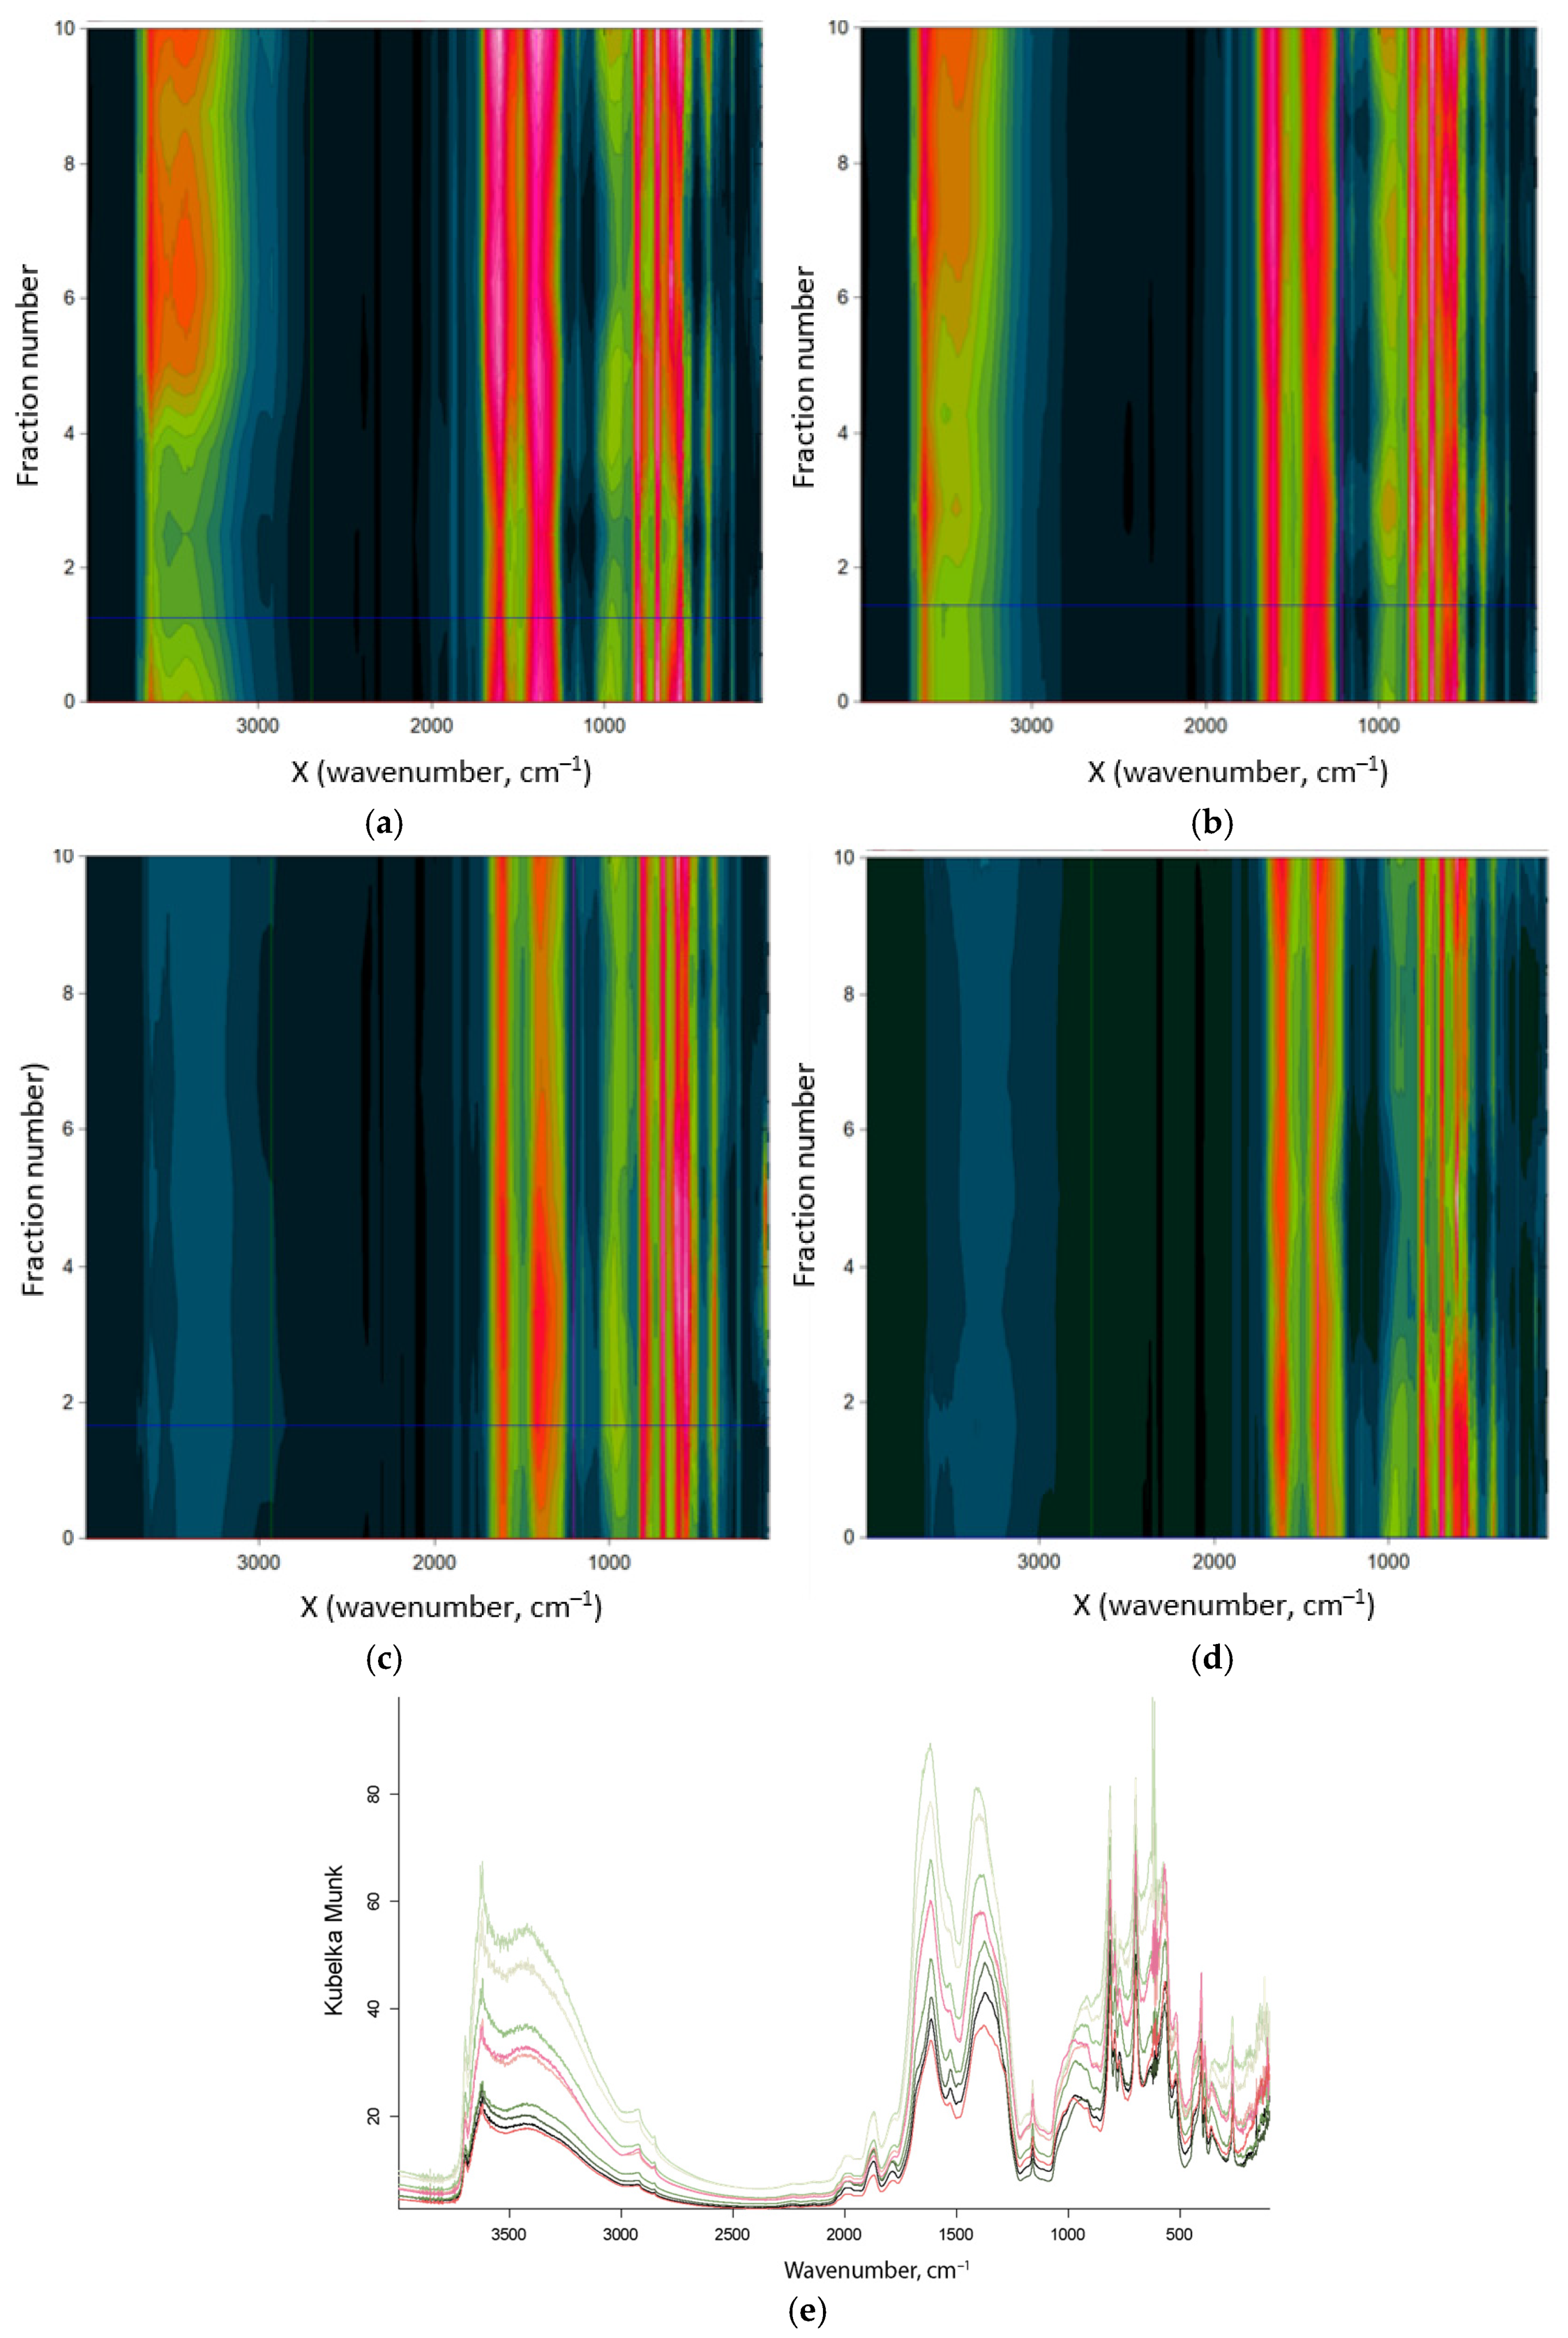
The 2D-COS measurements were implemented using Bruker OPUS 8.5 two-dimensional correlation spectroscopy unit. Matrix spectra (assemblies) for 2D-COS (
Figure 2a–d) were assembled with the fraction size as a perturbation (changing factor).
The spectral assemblies were built from the finest to coarsest fractions. Homospectral synchronous and asynchronous maps were built for each sample (chernozem agricultural land use). Synchronous maps were not normalized, asynchronous maps were normalized to the average value of all the correlations (Bruker OPUS 8.5).
Principal component analysis (PCA) and hierarchical cluster analysis (Euclidian distance, by furthest neighbor) were made using OriginPro, Version 2021 (OriginLab Corp., Northampton, MA, USA).
3. Results
Preliminary tests exhibited that DRIFT measurements provide more intense spectra in the characteristic range of 4000–150 cm
−1 compared to attenuated total reflection measurements [
30,
31] and, thus, are most applicable for 2D-COS. Spectra for all the fractions were obtained, their more detailed analysis is given elsewhere [
30,
31]. The most intense bands in the range over 3000 cm
−1 (
Figure 2e) is a wide continuum of 3500–3000 cm
−1 corresponding to O–H and N–H vibrations of water, and inorganic as well as organic fragments (alcohols, phenols, and amides) [
43,
44,
45] bonded by hydrogen bonds. The band at 3730 cm
−1 as for the previously obtained spectra of large fractions (manifested in all spectra of fractions of chernozems of the steppe, arable land, and bare fallow) is attributed to the valence vibrations of isolated non-adsorbed water, as well as valence vibrations of hydrosilicate Si–O–H [
43,
46,
47]. The band at 3695–3690 cm
−1 (for the shelterbelt, it has the lowest relative intensity for small fractions) is associated with the absorption of valence vibrations of SiO–H, presumably related to kaolinite, and 3620 cm
−1, to the vibrations of SiO–H of quartz and aluminosilicates [
48]. The range 3100–2560 cm
−1 contains valence antisymmetric 2920 cm
−1 and symmetric 2860 cm
−1 sp
3 –CH
2 vibrations [
49,
50].
The whole SOM range (2000–1340 cm
−1) contains IR bands related to the SOM, as well as overtones and combined bands of the soil matrix. The triplet of SiO
2 overtone bands [
49], 2000–1990, 1870, and 1780 cm
−1, is clearly visible for all the size fractions. In addition to the water band 1640–1620 cm
−1 (HO–H stretch), the broad band at 1750–1500 cm
−1 contains valence vibrations of carbonyl, bending deformation –NH
2 at 1680 cm
−1, valence vibrations of –C=C– and valence vibrations of –C=O and substituted aromatics [
43,
44,
45], or a combination quartz band. The band at 1620 cm
−1 may also refer to C=O valence and N–H bending vibrations [
51]. The band at 1640 cm
−1 most probably belongs to the Amide I region or aromatic –C=C– stretch [
52].
The ranges of 1580–1510 cm
−1 and 1400–1340 cm
−1 are mainly antisymmetric and symmetric carboxylate stretches [
53], with possible contributions from SiO
2 overtones. A band at 1444 cm
−1 is a carboxylic C–O–H in-plane bend [
54]. A broad band in the range of 1470–1345 cm
−1 is assigned to Raman-active bands of quartz [
55,
56] or the manifestation of SOM (carboxyl compounds and unsaturated hydrocarbons). The band at 1250–1240 cm
−1 corresponds to valence vibrations of C–O in phenol or –O–C=O in carboxylic acids [
57].
In the range 1190–900 cm
−1 (
Figure 2e), O–Si–O absorption bands in quartz (main are 1165, 1111, 1095, 1037, 1020, and 1000 cm
−1) are present. The band at 915 cm
−1 corresponds to deformation vibrations of Al/Mg–O–H [
44]. The band at 860 cm
−1 corresponds to Al–O–H deformation vibrations. The band at 775 cm
−1 belongs to deformation vibrations of Al/Mg–O–H [
44] or quartz [
50,
58].
The range of fundamental vibrations of the matrix, as well as larger fractions of >10–20 μm, contains the most intense absorption bands of the quartz matrix (796, 775, 697, 490, and 450 cm−1). In the range of 640–610 cm−1, absorption bands of librations of atmospheric water appear. These bands appear in all spectra of soil fractions.
Homospectral synchronous 2D-COS maps for the separated size fractions of chernozems show positive correlations in the ranges of 4000–3600 cm
−1 corresponding to hydrogen bonds, 1800–1150 cm
−1, mainly SOM, and 1100–200 cm
−1, mainly quartz bands (
Figure 3 shows the whole map for native steppe chernozem).
In the matrix band ranges (2100–1850 cm
−1, overtones, and 1250–100 cm
−1, main lattice bands), all main bands of crystalline and amorphous silicon dioxide [
30,
50,
59] are revealed, with almost an exact correlation match for different bands. No significant differences in the maps of all land-use samples were found in the ranges 4000–3600 cm
−1 (
Figure 3, the left white marker) and 1100–200 cm
−1.
Thus, most informative correlation bands corresponding to SOM are in the range of 1850–1050 cm
−1, which was used for more detailed measurements and handling by 2D-COS. In this SOM range, the leading correlation in synchronous maps is 1480–1350 cm
−1 vs. 1660–1560 cm
−1 (
Figure 3, the central almost square-shaped four-peak region). This region mainly corresponds to carboxylic groups of acids and their anions. Two autocorrelation bands are present: 1340–1320 cm
−1 (assignment is to symmetric carboxylate or CH
2 groups) and 1560–1610 cm
−1 (assignment is to antisymmetric carboxylate or aromatic C–C). Cross-correlations of these two regions have nearly the same intensities as auto-correlation bands, which indicates the same carboxylate groups. The more “rounded” areas around 1160 cm
−1, correlated with carboxylic groups, can be attributed to C–OH [
60].
Asynchronous maps for all the samples show bands at 3690, 3660, 3620, 2930, 2830, 1643, 1562, 1444, 1251, 1158, 1070, 797, and 505 cm
−1. In the range of 4000–200 cm
−1, the bands are weak and show no change in intensities throughout all the fractions. Still, in all samples, satisfactory reproducibility of the bands according to the maximum position is shown. The bands at 3690, 3660, and 3620 cm
−1 well fit the bands in initial spectra and indicate an increase in the amount of silicate or quartz not bound to SOM or bound to adsorbed water in small fractions [
30,
48]. This behavior correlates with an intensity increase in the size of the adsorbed-water band at 1643 cm
−1. As expected, the range 3100–2560 cm
−1 contains bands at 2920 and 2860 cm
−1 of methylene vibrations, showing the increase in SOM in small fractions. The range 2200–1800 cm
−1 shows the main bands of the SiO
2 overtone triplet at 2000–1990, 1870, and 1780 cm
−1 (
Figure 4a, green, pink, red, and blue lines indicating the most intense correlation bands).
Relatively low-intense but well-visible narrow bands (
Figure 4b) at 1070, 797, 697 (red and green marker lines), 620–610 (blue marker line), 505, and 400 (pink marker line) cm
−1. They all, except for 620–610 cm
−1, belong to crystalline SiO
2, and their proportion increases with the fraction size (yellow vertical and blue horizontal lines). The band at 620–610 cm
−1 is carbon dioxide.
As a whole, asynchronous correlations in this region are weak. As the size increases, the quantities of amorphous species decrease. As well, peaks of overtones of 2100–1800 cm
−1 grow with size, showing the growth of the percentage of crystalline species. Total silicon grows more slowly, apparently due to the IR saturation effect in DRIFT [
31,
61] and, therefore, the growth of overtones is more characteristic. All bands of total dioxide, crystalline and amorphous, are visible in 2D-COS maps with an almost perfect match for different correlation bands.
The most important is the manifestation of bands at 1650, 1580–1560, 1444, 1340, and 1250 cm
−1 (
Figure 5,
Figure 6,
Figure 7 and
Figure 8) on the asynchronous maps, which have no major contributions from inorganic matrix soil components [
30,
31]. These bands can be attributed to carboxylate groups, aromatic compounds, and the Amide III range. It is noteworthy that the intensity of these correlation bands is significant, and the band structure is different from the regions in the corresponding synchronous maps.
Figure 5,
Figure 6,
Figure 7 and
Figure 8 provide the correlation maps for all four types of agricultural use types, which make it possible to distinguish them from the contribution of bands that can be attributed to organic matter or water and carbon dioxide. As for synchronous maps, all differences in SOM are revealed in the range of 1850–1050 cm
−1.
Regardless of the land use, asynchronous maps are dominated by a multi-band correlation (1450–1380 cm−1)—(1660–1560 cm−1) determined in the main contribution of carboxyl groups, but with a probable effect of SiO2. The entire area of 1230–1050 cm−1 is weakly but clearly correlated with the main correlation region (1450–1380 cm−1)—(1660–1560 cm−1), while their content varies greatly from size (asynchronous maps), which is evidence that in these bands not only the inorganic matrix contributes. In the region of 1850–1050 cm−1, the set of asynchronous bands does not change, which correlates with the range of the matrix.
In synchronous maps (
Figure 5a,
Figure 6a,
Figure 7a and
Figure 8a), the autocorrelation band 1440–1320 cm
−1 is broadest and most intense for steppe and is less manifested in the maps of arable land, bare fallow, and shelterbelt. In arable land and bare fallow, its shape changes from round to triangular (
Figure 6 and
Figure 7) losing the region at 1380 cm
−1. The autocorrelation band of 1640–1560 cm
−1 is significantly less visible for bare fallow and arable land compared to steppe and shelterbelt.
In asynchronous maps, the behavior of all main characteristic bands, at 3690, 3660, 3620, 2930, 2830, 1640, 1560, 1444, 1250, 1160, 1070, 797, 697, 620–610, 505, and 400 cm
−1, depends on the soil agricultural land use. In the SOM region, the main asynchronous bands form a row of first to last changes upon an increase in the fraction size. In the native steppe, the order of change (
Figure 5b) is 1680 (the bluest vertical region on the asynchronous map) > 1520 > 1560 > 1630 > 1160 > 1420 > 1380 > 1280 cm
−1 (the most orange vertical region on the asynchronous map). The order between the fastest and slowest changed lines for the bare fallow (
Figure 6b) is mainly similar to that for the native steppe: 1680 > 1520 > 1560 > 1630 > 1160 = 1300–1280 > 1350 > 1380 > 1420 cm
−1. For the arable land, the order is inverted compared to native steppe and fallow (
Figure 7b), 1160 = 1430 > 1650 = 1560 > 1280 > 1350 = 1380 > 1630 cm
−1. For the shelterbelt (
Figure 8b), the order is close to fallow, 1650 = 1560 > 1520 > 1630 = 1160 > 1380 > 1350 > 1280–1320 cm
−1.
For comparison with 2D-COS, the spectra of the same samples were subjected to hierarchical cluster analysis and principal component analysis. The range was 2050–1050 cm
−1 to cover signature bands of the quartz matrix at 1990, 1870, and 1780 cm
−1 [
49] and the informative correlation SOM region was in the range of 1850–1050 cm
−1.
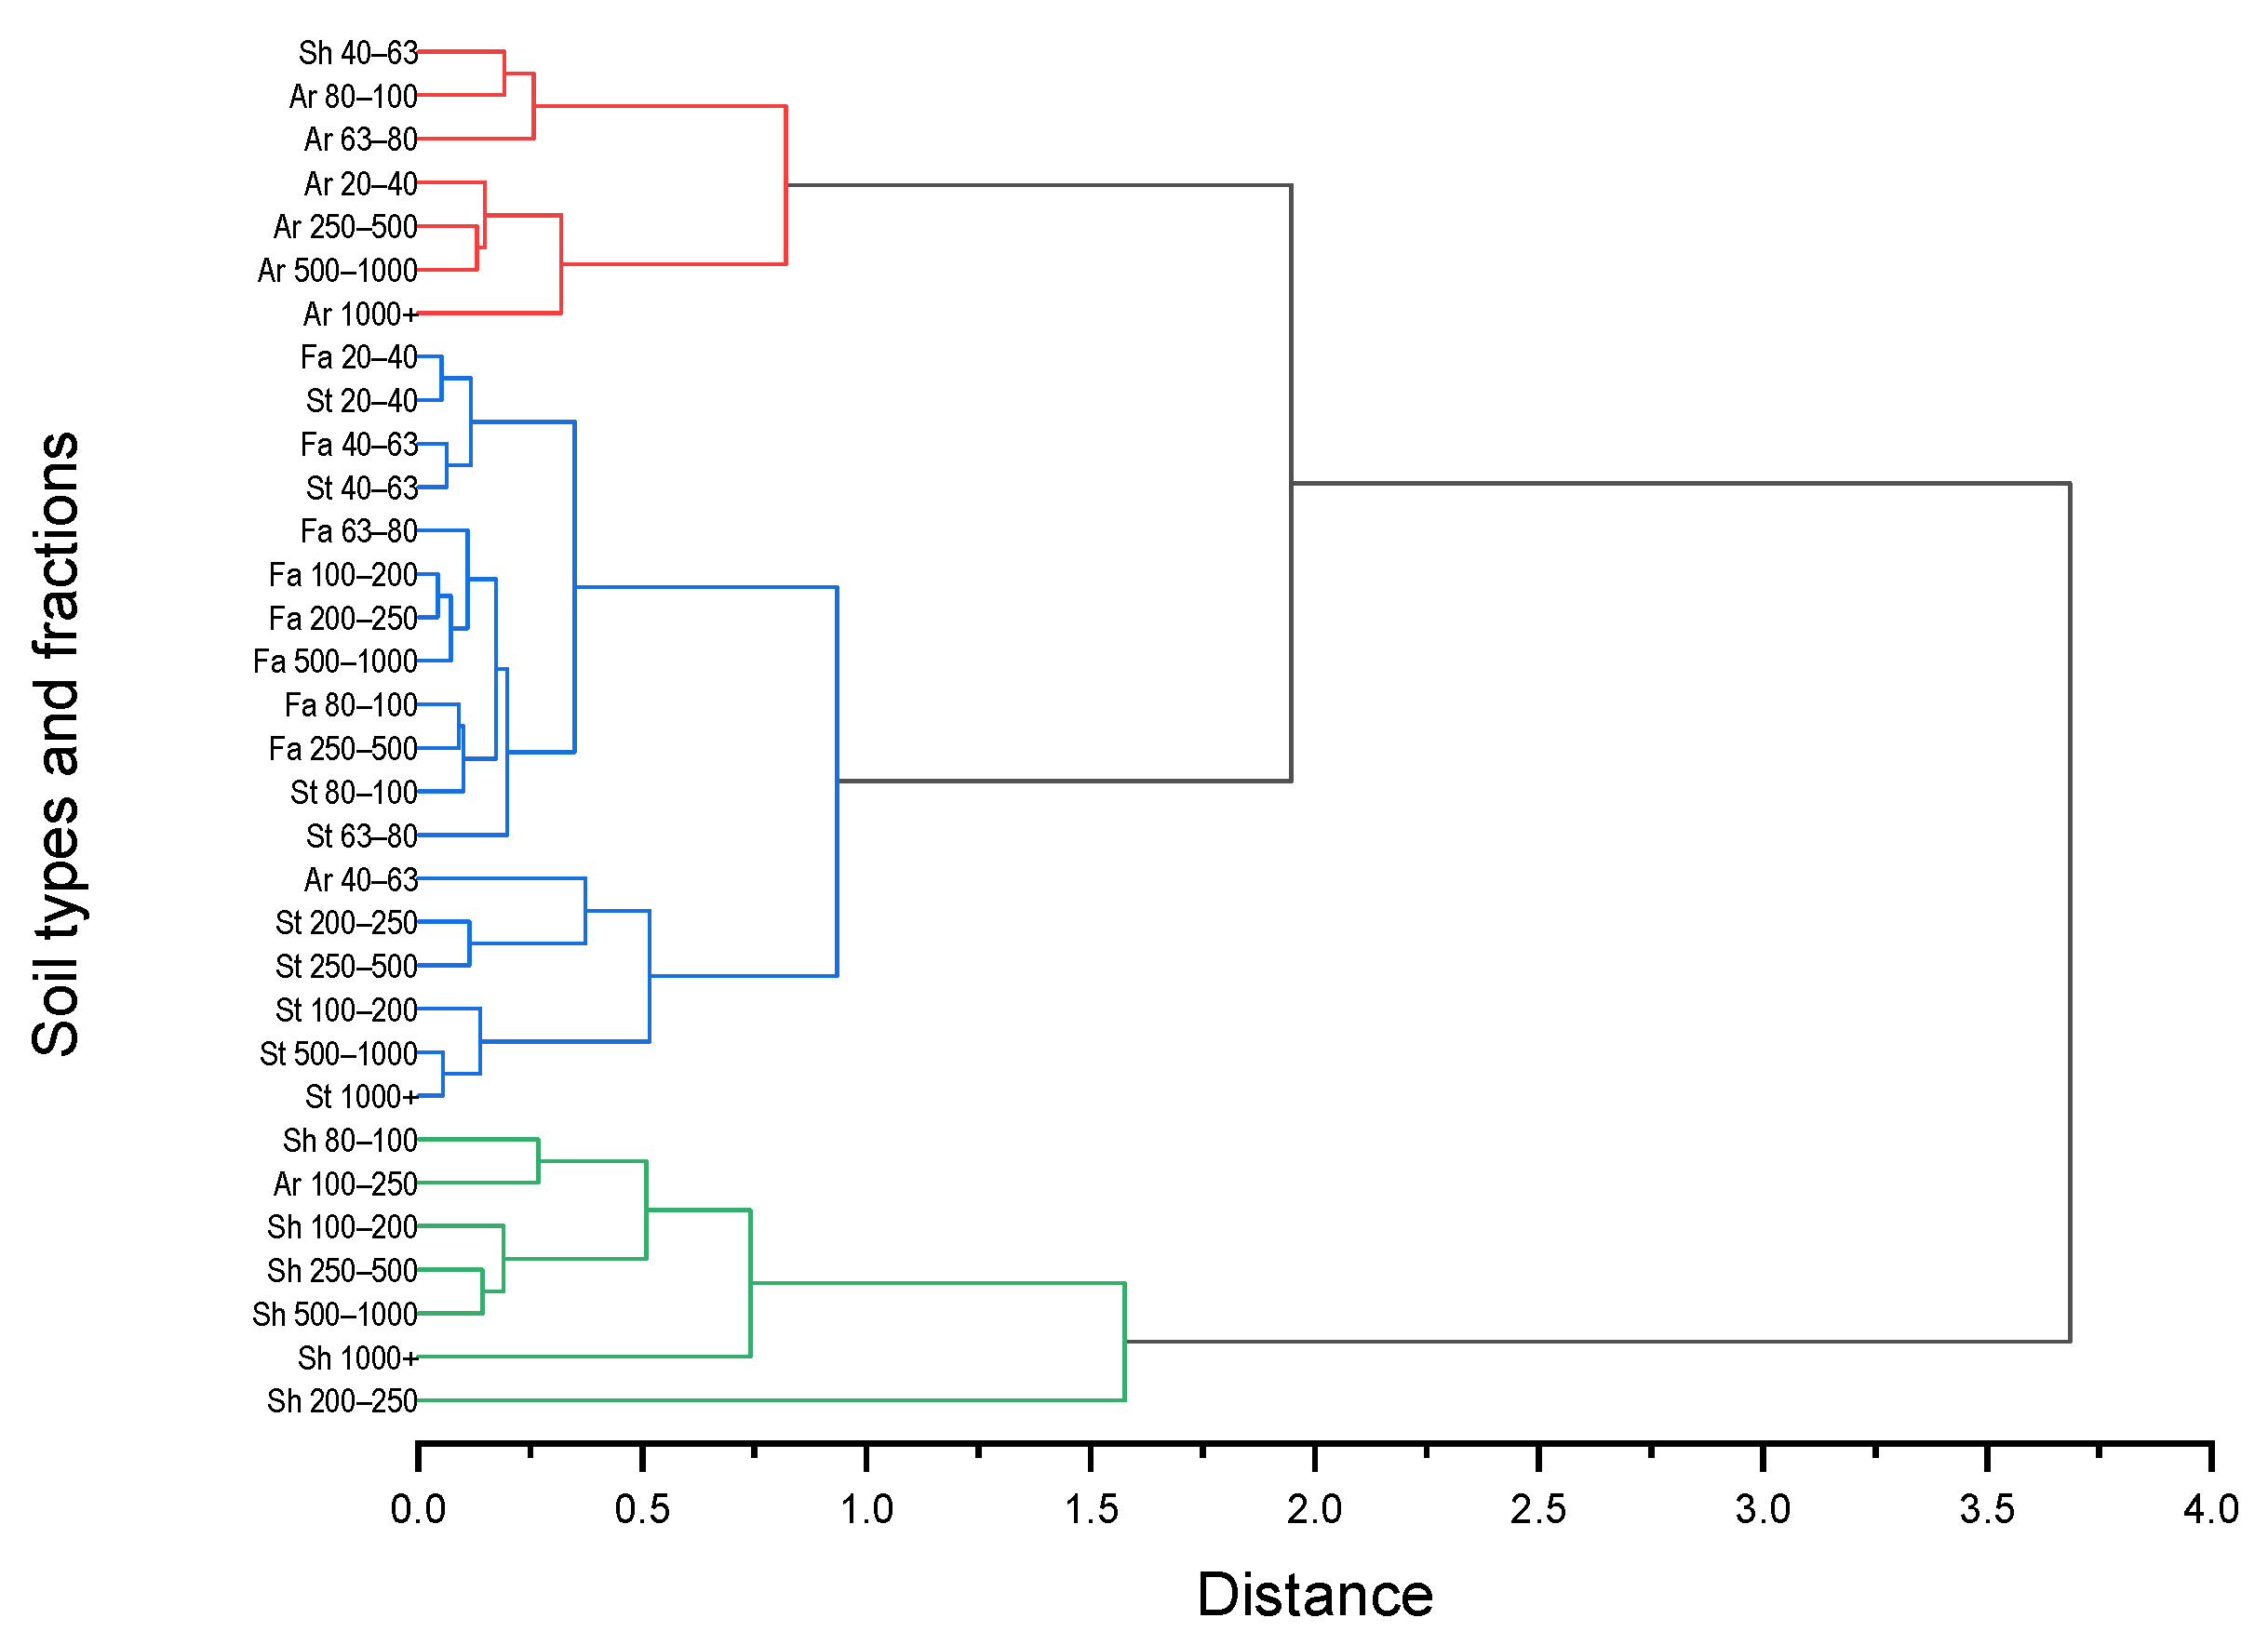
Hierarchical cluster analysis (
Figure 9) shows that all the selected fractionated soil samples are divided into three clusters: mainly arable land (some shelterbelt samples also fall here), mainly shelterbelt (some arable land samples also fall here), and the combined bare fallow/native steppe cluster. This clustering agrees with the location and history of the samples (the bare fallow on native steppe and the shelterbelt over arable land). Cluster analysis data suggest that SOM in the studied samples retains the original parent compounds specific to the litter of the vegetation in which the steppe was formed.
Principal component analysis of the spectral information in the range of 2050–1050 cm
−1 (
Figure 10) was made using the main band intensities in this range (1990, 1867, 1786, 1720, 1680, 1614, 1580, 1529, 1460, 1414, 1375, 1318, 1281, and 1193 cm
−1). PCA shows that the cumulative of 99.5% is reached for three principal components, with the dominating component being PC1.
Figure 10a shows that the land uses can be differentiated but not completely, bare fallow and native steppe samples show overlapped structures, some of the shelterbelt and arable land can be differentiated, but some of the samples are out of the main clusters. Principal component 1 corresponds to the nature of the constituents, while factors 2 and 3 seem to be responsible for land-use types and fractional differences in the studied soil.
From the viewpoint of clusterization by wavenumbers, the picture is more distinct (
Figure 1b), one of the clusters (grey) is formed by the quartz bands (1990, 1867, 1786, and 1193 cm
−1) and two others (blue and brown) are SOM components, mainly carboxylic and involving C–H and structural vibrations; the single 1720 cm
−1 band may be due to its complex nature as it main contain both matrix and various SOM components.
4. Discussion
A 2D-COS shows that zones on synchronous maps below 1100 cm
−1, identified as Si–O bands [
30,
31], give much narrower correlation regions for the main (X) and broad for the correlated (Z) variable (see
Figure 2), which makes it possible to distinguish them from the contributions of bands that can be attributed to SOM or water and carbon dioxide rendering much broader correlation regions. At the same time, as a rule, they are equally manifested on both synchronous (
Figure 11) and asynchronous maps (
Figure 4), which gives a second property that distinguishes them from non-matrix, SOM bands.
The consequence of such a different behavior of matrix bands is the possibility to normalize 2D-COS maps of SOM using a band of 1160 cm
−1 (SiO
2, lattice vibrations) [
50] because they are uniquely manifested on all correlation maps. Another option is the use of the triplet of quartz overtone bands in 2000–1800 cm
−1, as they are not affected by the light absorption saturation effect; however, this triplet shows relatively low-intense correlation bands. This problem may be a subject of a separate study and was out of the framework of this research.
Another important feature that should be considered is that the comparison of initial spectra and corresponding asynchronous 2D-COS maps shows that the latter are differential. Thus, a range in the correlation map that changes very significantly may not reflect an actual band but the changing background region in between. Thus, the problem of band assignment on a correlation map is even more significant than for original spectra and the bands that cannot be reliably identified should be excluded from the consideration without another confirmation. In this study, we excluded the region at 2200–2050 cm−1.
The overall comparison of 2D-COS maps for major IR spectral regions shows that the region of 3900–2700 cm−1 repeats the initial spectra in synchronous maps and does not provide any useful information in asynchronous maps. Correlations are poorly expressed. The symmetric band at 2860 cm−1 is most revealed in the spectra of fractions of the native steppe, which indicates the highest amount of SOM in this sample, which is expected. The range of 2700–2200 cm−1 is uninformative.
The ranges of 2050–1850 cm
−1 and 1050–100 cm
−1 represent dominating correlations mainly for the silicate matrix. The range of matrix overtones is dominated by bands of the soil matrix: quartz and hydrosilicates. Any correlations that can be attributed to SOM are absent or entirely unreliable, and their use for SOM analysis is almost impractical. The analysis of 2D-COS results in this range adds no information on the matrix compared to the analysis of initial IR spectra. The positions of the maxima and shapes of bands are reproduced for all samples. The asynchronous maps show the disappearance of the band attributed to amorphous SiO
2 with the fraction size, and the appearance of quartz bands that agree with the analysis of the initial IR spectra, finer fractions show a higher degree of SiO
2 amorphization. Thus, the application of 2D-COS for silicate soil matrix provides expected results but is not quite expedient compared to 1D spectra due to time consumption. Also, the overall contribution of the silicate matrix to different bands can be readily revealed by PCA (
Figure 10b).
On the contrary, the SOM region shows new information on organic matter that is specific to each land-use sample. On synchronous maps of the
native steppe, the main carboxylate correlation of 1390–1540 cm
−1 is strong and broadest among all the samples. The whole carboxylate region (1660–1560)—(1450–1300) cm
−1 (upper left vs. lower right,
Figure 5a) is the broadest and most pronounced, which may evidence the maximum variety of acidic groups in the native steppe. The data obtained confirm the previous results of comparison of the contents of carboxyl-containing labile organic matter [
62] that hayfield soil, an authentic analog of the steppe soil that is not subjected to the mechanical action of plowing, contains 1.5–3-fold more labile SOM than even the soil of an old-growth undisturbed forest. The authors emphasize that it is the consumption of mortal residues of plants, root exudates, and microbial biomass into the soil and their further transformation in the soil that determines the environmental quality of soils under conditions of different land use [
62].
The autocorrelation band of 1340–1320 cm
−1 is well manifested in the native steppe (
Figure 5a; black square), which is very slightly revealed in the spectra of other land use samples: arable land, bare fallow, and shelterbelt. Its assignment is CH
2 groups [
63] and it does not belong to carboxylate bands and correlates with the strongest correlation band of 2860 cm
−1. Also, there is a correlation region at 1560–1610 cm
−1 (
Figure 5a; red squares), its possible attribution of C–C vibrations of aromatic rings. In the synchronous maps of the shelterbelt and bare fallow, it is much less visible, and it is very low for the arable land. An extended autocorrelation to 1670 cm
−1 is characteristic for the native steppe only and may correspond to aromatic –C=C– stretch [
52], which is barely seen in arable land and bare fallow and can be seen only slightly in the shelterbelt. Finally, there is a correlation zone (1590–1580)—(1400–1380) cm
−1 (
Figure 5a; blue rounded squares), which is much narrower than the main zone for both variables and corresponds to C=C stretch in (poly)aromatic rings and with CH
2 and CH
3 bands and non-carboxyl C–O–H in-plane bend [
63]. Such a zone may manifest larger amounts of nonoxidized organic matter in the native steppe. This zone is almost absent in three other samples, barely appearing in the shelterbelt.
Asynchronous maps of the native steppe (
Figure 5b) show that the fastest growing part with fraction size is 1680 cm
−1 (carbonyl and aromatic –C=C– stretch) and the slowest is 1280 cm
−1 (C–O stretch at aromatic rings and carboxylic acids), between them are mainly carboxylate vibrations and C–C stretch in aromatic rings. It is interesting that the range around the band 1720 cm
−1, characteristic in PCA (
Figure 10a), does not reveal itself as distinguishing in 2D-COS, probably due to its multi-component nature: it shows its difference compared to other bands in PCA but does not result in any useful correlations.
To some extent, synchronous maps for
bare fallow (
Figure 6a) are similar to the steppe, which correlates with the data from PCA (
Figure 10a) and hierarchical clusterization (
Figure 9). The carboxylate region (1660–1560)—(1450–1300) cm
−1 narrows and weakens compared to the native steppe, which may indicate a decrease in the variety of acidic groups. This is due to the almost complete absence of fresh organic matter in the bare fallow soil. And the autocorrelation band of 1340–1320 cm
−1 (CH
2 groups,
Figure 6a, black square) shows much less intensity than in the native steppe. The auto-correlation band at 1680 cm
−1 disappears as well as the correlation of (1590–1580)—(1400–1380) cm
−1 (
Figure 6a, blue rounded squares), which indicates the depletion of SOM as aromatic compounds in bare fallow, which characterizes the maximum degree of decomposition and removal of specific soil organic matter. The correlation of 1560–1610 cm
−1 is weak (
Figure 6a, red squares). Compared to the native steppe, the carboxylate correlation of 1390–1540 cm
−1 almost disappears.
Asynchronous maps (
Figure 6b) also show that bare fallow is the closest analog of the native steppe compared to the other two samples. The fastest change with fraction size is also 1680 cm
−1 and the slowest is 1420–1430 cm
−1; the order between the fastest and slowest bands is similar to that for the native steppe, so more pronounced changing in 1280 cm
−1 (slowest in the native steppe and in the middle for the bare fallow) may indicate the depletion in SOM in small fractions. This can be explained by the initial genetic and geographical proximity of these two land-use samples (native steppe and bare fallow) located at a distance of about 50 m from each other and the heredity of their initially identical steppe grass–forbs vegetation cover characterized by the peculiarities of the composition of lignin in SOM of these samples. Such patterns of inheritance are known [
64,
65] and allow us to trace the history of crop growth or changes in the nature of land use. Our previous studies of the thermal parameters of the chemical agents of these soils revealed similar patterns [
41]. Still, 2D-COS shows significant differences in these two samples that cannot be unambiguously distinguished by PCA and cluster analysis. Also noteworthy is that the distinguished ranges cannot be revealed from conventional IR spectra of the whole soil or separate fractions and are revealed only in homospectral correlations.
Synchronous maps of the
arable land (
Figure 7a) reveal that the autocorrelation band at 1340–1320 cm
−1 (CH
2 groups, black square) is absent and 1560–1610 cm
−1, weak (red squares). No autocorrelation band at 1650 cm
−1 is observed, which confirms the depletion of SOM. Compared to the native steppe (
Figure 5), there is almost no correlation in the ranges of 1390–1540 cm
−1 and (1590–1580)—(1400–1380) cm
−1 (
Figure 7a, blue rounded squares). The silicate matrix bands (1160 and 1100 cm
−1) are most pronounced in this sample, which also indicates the decrease in the overall SOM amount. The carboxylate region (1660–1560)—(1450–1300) cm
−1 is even narrower as in the bare fallow, and the whole range becomes almost triangular compared to rounded regions of bare fallow and native steppe.
Asynchronous maps of the arable land show that it is an almost completely inverted behavior compared to native steppe and bare fallow (
Figure 7b vs.
Figure 5b and
Figure 6b). In coarse fractions, the fastest species appearing with fraction size are those that change little (or slower) in the steppe and fallow. The fastest are 1160 and 1430 cm
−1 (silicate and carboxyl acids), while the carbonyl region of 1630 cm
−1 is the slowest. It is noteworthy that carboxylate bands of 1380–1350 cm
−1 become one of the slowest, so that may indicate the equalizing of the number of acidic groups in different fractions. The comparison of asynchronous and synchronous maps shows that this is a depletion of acidic groups in large fractions. As a whole, arable land provides a picture quite different from the first two samples, which agrees with the clusterization by PCA and hierarchical analysis.
Synchronous maps of the
shelterbelt (
Figure 8a) are very similar to arable land, which, as in the case of steppe vs. fallow, is due to the genetic (the shelterbelt was laid on the cropland) and geographical proximity of these two samples, located at a distance of ca. 100 m from each other. The autocorrelation band of 1340–1320 cm
−1 (CH
2 groups, black square) is absent. The band at 1560–1610 cm
−1 (
Figure 8a, red squares) is significantly less pronounced than in the native steppe (
Figure 5a), but better than in the bare fallow (
Figure 6a). The carboxylate pair of 1390–1540 cm
−1 is more pronounced than in the bare fallow and arable land but is weaker than in the native steppe. The band at 1650 cm
−1 becomes visible like in the steppe but is much weaker. The carboxylate region (1660–1560)—(1450–1300) cm
−1 expands and increases in comparison with the bare fallow and arable land but does not reach the width of the native steppe and keeps the triangular form characteristic for the arable land sample. This is due to the fact that the quality of incoming fresh organic matter varies depending on the different vegetation cover of the plots: it is a rapidly degradable leaf litter of broad-leaved species in an almost dead-cover shelterbelt and mainly roots mortal remains, plowed annually, with a small amount of stubble after the alienation of the bulk of the above-ground parts of wheat plants. In the native steppe soil, as noted above, the chemical source of SOM is a rich set of cereals and steppe herbs.
Asynchronous maps of the shelterbelt (
Figure 8b), in the range of 1800–1400 cm
−1, are close to the bare fallow (
Figure 6b), then seem similar to the native steppe, but the shape of the bands is different and more similar to the correlations of the silicate matrix (especially below 1200 cm
−1). The fastest growing size regions are 1640 and 1560 cm
−1, and the slowest is 1280–1320 cm
−1. Thus, the distribution of the groups is restored compared to inversed behavior of the arable land; still, the behavior of the 1160 cm
−1 band of quartz matrix is similar to the bare fallow. As for the native steppe/bare fallow pair, 2D-COS shows more reliable differences in these two samples that cannot be unambiguously distinguished by PCA (outliers,
Figure 10a) and hierarchical cluster analysis (two difference clusters, the upper and lower, show fractions of both land-use samples,
Figure 9).
To sum up all the samples, synchronous 2D-COS maps show that all the samples of each land use are different, and the SOM range can be used as a signature of the samples. The comparison results in two pairs of samples, native steppe–bare fallow and arable land–shelterbelt. The first two reveal similar correlations for the range of 1340–1320 cm
−1 (CH
2 groups), giving the rounded shape of the corresponding band (
Figure 5a and
Figure 6a). Synchronous maps of the arable land and shelterbelt grown over the former arable land are also rather similar, which shows that the diversity of carboxylic bands is not restored in the shelterbelt compared to the native steppe. It is noteworthy that the autocorrelation band at 1670 cm
−1 (aromatic –C=C– stretch), characteristic of the native steppe, is not restored either in the bare fallow or the shelterbelt.
Asynchronous maps show the same bands mainly belonging to carbonyl, carboxylate, and aromatic C–C for all the studied land-use samples, but the order of their appearance (accumulation in the larger factions) is quite different. The similar feature of all the asynchronous maps is that all the samples show the same order of Amide I > Amide II > Amide III regions, and for all samples except for the arable land, Amide I and Amide II ranges are fastest changing with the fraction size. However, the bands of 1560 and 1380 cm
−1, which correspond to the same carboxylic groups, have a different order. This fact means that one of these bands has at least one more contribution. The band at 1560 cm
−1 growing faster compared to 1380 cm
−1 may indicate the contribution of aromatic constituents to the former, which correlates with the differentiation of these bands in PCA of characteristic wavenumbers (
Figure 10b). This hypothesis correlates well with the behavior of synchronous maps for non-carboxyl continua: the maximum amounts of hydrocarbons are revealed in the native steppe, then bare fallow, and then arable land; in the shelterbelt, asynchronous maps show that the accumulation of aromatic compounds in the coarse fraction is mainly restored. For the native steppe, shelterbelt, and bare fallow, changes in carboxylic C–O–H acidic groups are slowest, while for the arable land, it is the fastest. Also, the arable land shows the maximum increase in the band at 1160 cm
−1 that can be both silicate matrix and CH
2 groups, the latter is supported by the similarly fastest changing region of 1420 cm
−1.
As a whole, the homospectral 2D-COS reveals more information about the SOM region of IR spectra compared to the original spectra, provides a way to separate SOM and mineral matrix bands, and exposes different behavior of bands that have possible contributions from different groups. Certainly, such conclusions require a larger set of samples and confirmation from other approaches including those with sample preparation. Still, from the viewpoint of land-use samples, the conclusions based on 2D-COS map analysis agree well with the previous data on sample comparison [
31,
32,
33,
41] and cluster analysis. However, 2D-COS extends them as 2D-COS treats the whole series of fractionated samples as trends (a change with the fraction size), rather than groups of similar samples in cluster analysis. Thus, while PCA provides a way to make an overall picture of differences and similarities, 2D-COS makes a more detailed analysis: it uncovers the actual changes in SOM and functional groups upon land degradation (from undisturbed native steppe to arable land) and its incomplete restoration (the bare fallow and shelterbelt) with high reliability.
For used chernozem soils, the homospectral 2D-COS approach provided an additional set of information that can be used to identify SOM components in different land-use samples compared to original 1D FTIR spectra. As the bands used in the analysis is characteristic for all soil types (C–H, skeletal vibrations of aliphatic and aromatic components, carboxylic groups, and inorganic matrix), this approach can be extended to various types of soil. To be sure, 2D-COS reveals bands of functional groups of organic components, in particular, a larger number of bands of SOM for C–H, largely from aromatic components.
This approach is especially important in IR spectral regions, where the contribution of the mineral soil components does not facilitate the use of either SOM extraction or destructive treatments like chemolysis or annealing. It is noteworthy that granulometric fraction separation of soils that is, as far as we are concerned, used for the first time as a perturbation variable in 2D-COS shows its expedience: it separates chemically different fractions without changing the chemical composition, which is very favorable for trend finding by correlation spectroscopy. This methodological approach can be used in various similar problems in soils and mixed with other external factors like horizons, which provide a very broad analysis of soils of various types.


