Article

Physiological and Histological Characterization of the ESB1 TILLING Mutant of Brassica rapa L.: Potential Use in Biofortification and Phytoremediation Programs

Department of Plant Physiology, Faculty of Sciences, University of Granada, 18071 Granada, Spain
*
Author to whom correspondence should be addressed.
Agronomy 2023, 13(6), 1642; https://doi.org/10.3390/agronomy13061642
Submission received: 29 May 2023 / Revised: 14 June 2023 / Accepted: 16 June 2023 / Published: 19 June 2023

Abstract

:
Enhanced suberin1 (ESB1) is a protein whose mutation is correlated with an increase in root suberin and altered nutrient concentrations. Here, we show a physiological and histological characterization of esb1 mutant plants of Brassica rapa L. Therefore, the potential use of this mutant in selenium (Se) biofortification and/or cadmium (Cd) phytoremediation programs was also evaluated by applying 20 μM of Na2SeO4 and 0.49 μM of CdCl2 to a nutrient solution. With respect to wild type (WT) plants, an increase in root suberin was observed in esb1 at the level of the exodermis. This increase in root suberin did not affect photosynthesis performance. However, the esb1 mutant showed an increase in transpiration rate and a decrease in water use efficiency. Additionally, root histological changes affected the transport and concentration of some mineral elements. Thus, our results suggest that esb1 mutants of B. rapa would not be useful for Se biofortification because no significant differences were observed between the two genotypes at the leaf level. Nevertheless, the esb1 mutant reduced Cd translocation to the leaves and increased Fe and Cu uptake, so ESB1 mutation could be useful for Cd phytoremediation and Fe and Cu biofortification, although further research is needed. Therefore, this study provides detailed information on the effect of ESB1 mutation in B. rapa and suggests its potential use in biofortification and phytoremediation programs.

1. Introduction

Plant roots are specialized organs that play essential roles in plant growth and development due to their involvement in the absorption of water and nutrients present in the soil [1]. The transport of water and nutrients across the root cell layers can occur via apoplastic, symplastic, or transcellular transport [2,3,4,5]. Among the various tissues that make up the root, the endodermis is considered a key tissue for plant development due to the existence in this tissue of a selective barrier that regulates the radial transport to the xylem of mineral elements and water. However, this barrier is not present along the entire length of the root but first becomes evident in the maturation zone, where cells are differentiated and acquire a tissue-specific identity [1].
Generally, the endodermal cells undergo two levels of differentiation characterized by the deposition of lignin (State I) and take place the suberin lamellae formation (State II) [6]. Lignin is a polymer of hydrophobic nature that is deposited on the anticlinal walls of adjacent cells, forming a subcellular structure called the Casparian strip. For this reason, at state I of endodermal cell differentiation, the apoplastic transport of water and nutrients is blocked by the Casparian strip [6,7,8]. On the other hand, suberin is a hydrophobic polymer that is deposited as a thick secondary cell wall. Suberin acts by blocking the transport of molecules from the apoplast to the endodermal cytoplasm; so, in this case, the transcellular pathway is blocked. According to different authors, suberin lamellae can also block the apoplastic pathway but does not affect the symplastic pathway [6,7]. Therefore, endodermal cells at state II of differentiation show the Casparian strip and suberin lamellae. Both structures constitute a selective barrier, called the endodermal barrier, which controls the transport of mineral elements and water to the xylem and thus to the aerial part of the plant. This function of the endodermis is made possible by the plasticity of the endodermal barrier, i.e., depending on environmental conditions such as drought, salinity, heavy metals toxicity, etc., an increase or reduction in lignin or suberin can occur, which will influence the water and ionic status of the plant [3,7,9]. Additionally, it is important to know that many plant species develop a tissue between the epidermis and cortex, called the exodermis, which is physiologically and structurally similar to the endodermis and also presents a selective barrier with Casparian strip and suberin lamellae that modulates water and mineral transport [3,10].
Model plants such as Arabidopsis thaliana L. have been used to identify some of the genes and proteins involved in endodermal barrier biosynthesis. Enhanced suberin1 (ESB1) is an essential protein for the correct formation of the Casparian strip [8]. The function of this protein appears to be to guide the formation of bonds between lignin monomers, as well as control the correct order in which these monomers are deposited [8,9,11]. The esb1 mutation results in an altered and defective Casparian strip in A. thaliana and, consequently, leads to increased suberin deposition in the endodermis, which is twice as high in mutant plants with respect to wild type (WT) plants [5,9,11]. Additionally, Baxter et al. [11] found that esb1 mutants showed differential nutrient accumulation in leaves, demonstrating the role of suberin in the root transport of mineral elements. These authors observed a reduction in calcium (Ca), manganese (Mn), and zinc (Zn) contents and an increase in sodium (Na), sulfur (S), potassium (K), arsenic (As), selenium (Se), and molybdenum (Mo) compared to WT plants.
The fact that mutant plants show an altered concentration of mineral elements where some of them are increased, as is the case of esb1 mutants, is an interesting result for future biofortification and phytoremediation studies [12]. Biofortification is a promising tool for alleviating malnutrition problems associated with nutrient deficiencies because it aims to increase the concentration of essential animal nutrients in the edible part of the plant [12,13]. For example, Se is an essential micronutrient for humans whose deficiency is associated with cardiovascular diseases, hypothyroidism, rheumatoid arthritis, and cancer. In this scenario, biofortification takes on particular importance to try to provide a diet of Se content necessary for health, which is estimated at 30–40 µg Se/day in humans [14,15,16]. On the other hand, a widespread environmental problem is the contamination of soil and water by heavy metals, such as cadmium (Cd), which is highly toxic to plants and animals. The main route of exposure to Cd in animals is through the consumption of Cd-contaminated plant food. Cd toxicity can produce hepatic and renal dysfunction, osteomalacia, pulmonary edema, damage to the hemopoietic system, and cancer development in humans [17,18]. Phytoremediation is an economical, effective, and eco-friendly technology used to reduce the bioavailability of heavy metals, such as Cd, in the environment using plants [17,18,19]. Species such as Brassica rapa L. have been used in phytoremediation and biofortification studies due to their capacities to tolerate and accumulate high concentrations of heavy metals and concentrate essential nutrients in edible parts of the plant [20,21,22]. In addition, B. rapa ssp. trilocularis is a model plant in genetic and evolutionary studies because its genome has been sequenced; it is a diploid plant, it produces a large number of seeds, and it is self-fertile [23].
In recent years, many biotechnological techniques are aimed at breeding plant varieties with improved agronomic and physiological characteristics. One of these techniques is TILLING (Targeting Induced Local Lesions in Genomes), a cost-efficient, and high-throughput tool for associating a gene sequence with a given phenotype by obtaining mutations in this sequence [23]. ESB1 genes could be a target for TILLING to obtain esb1 mutants with improved characteristics, such as enhanced biofortification or phytoremediation capacities. In the present study, the esb1 mutant of B. rapa ssp. trilocularis was generated using TILLING. This mutant presents a unique amino acid change in ESB1 protein, so its function could be affected. Therefore, the objectives of this work were (i) to assess the effect of esb1 mutation on phenotype, photosynthetic state, root histology, and ionomic profile in B. rapa L. plants and (ii) determine the potential use of this mutant in Se biofortification and Cd phytoremediation programs.

2. Materials and Methods

2.1. Plant Material, Growth Conditions, and Experimental Design

Two genotypes of B. rapa ssp. trilocularis were used as plant material: the parental line “R-o-18” (WT) and M3 generation mutant plants generated from the “R-o-18” TILLING population (BraA.esb1a-4 S2 BCI M3 homozygote segregated; change from glycine to alanine at amino acid 213) in order to understand physiological, photosynthetic, and ionomic effects associated with esb1 compared to WT plants. Mutant plants were generated and identified as described by Lochlainn et al. [24] and Graham et al. [25], where R-o-18 seeds were treated with ethyl methane sulfonate (EMS) to induce mutations in target genes, and the mutant used in this study was selected after a crossing and phenotyping process. Seeds of both genotypes were disinfected and sterilized with 70% ethanol and 50% bleach. Then, seeds were sown on filter paper moistened with milli-Q water (18.2 MΩ cm) in 9 cm Petri dishes, which were sealed with plastic film and kept in the dark for one day at 4 °C before being moved to vermiculite-filled pots. These pots were placed in a growth chamber under controlled environmental conditions with a temperature of 18 °C/24 °C (night/day), relative humidity of 60–80%, and a photoperiod of 14 h/10 h with a photosynthetic photon flux density of 350 μmol m−2s−1 (measured at the top of the plant with a LICOR 6800, Inc., Lincoln, NE, USA, EE.UU.). During the experiment, the plants received a growth solution composed of 1 mM KH2PO4, 1 mM NaH2PO4·2H2O, 2 mM MgSO4·7H2O, 4 mM KNO3, 3 mM Ca(NO3)2·4H2O, 5 µM Fe-chelate (Sequestrene; 138FeG100), 10 µM HBO3, 2 µM MnCl2·4H2O, 1 µM ZnSO4·7H2O, 0.25 mM CuSO4·5H2O, and 0.1 µM Na2MoO4·2H2O. This solution had a pH of 5.5–6 and was renewed every three days. In order to evaluate different parameters related to Se and Cd, 20 μM of sodium selenite (Na2SeO4) and 0.49 μM of cadmium chloride (CdCl2) were added to the nutrient solution at each irrigation. Therefore, a total of two treatments were used in our study: (1) the WT (nutrient solution + 20 μM of Na2SeO4 + 0.49 μM of CdCl2) and (2) esb1 (nutrient solution + 20 μM of Na2SeO4 + 0.49 μM of CdCl2). The experimental design consisted of a complete randomized block with two treatments, with three replications per treatment and eight plants per replicate.

2.2. Plant Sampling

Plant sampling was carried out 72 days after germination. The leaves and roots of the plants from each treatment were washed with distilled water, dried on filter paper to remove any remaining particles of vermiculite, and weighed to obtain the fresh weight (FW). In addition, the length of the roots was measured in cm from the apex to the basal zone using a metric ruler and, using a measuring cylinder with water, the root volume in cm3 was estimated. Half of the leaves and roots from each treatment were frozen at −40 °C for use in subsequent biochemical assays. The other half of the plant material was lyophilized to determine the dry weight (DW) as well as nutrient concentration in leaves and roots.

2.3. Determination of Photosynthetic Pigments Concentration

Chlorophyll a (Chl a) chlorophyll b (Chl b) pigments, as well as carotenoids, were measured according to Wellburn et al. (1994). A total of 0.1 g of frozen leaves were macerated in 1 mL of methanol and centrifuged at 2200× g for 5 min. The absorbance of the supernatant was measured at 653 nm, 666 nm, and 470 nm. Pigment concentrations were obtained using the equations proposed by Wellburn et al. [26]:
Chlorophyll a = 15.65 × A666 nm − 7.34 × A653 nm
Chlorophyll b = 27.05 × A653 nm − 11.21 × A666 nm
Carotenoids = (1000 × A470 nm − 2.86 × Chl a − 129.2 × Chl b)/221
The Chl a/b ratio was also estimated as Chl a/Chl b.

2.4. Fluorescence Parameters Analysis

The leaves were adapted to 30 min of darkness before the measurements using a special leaf clip to ensure that the photosystems were in a basal state and, after the darkness period, the fluorescence kinetics of Chl a were determined using the Handy PEA Chlorophyll Fluorimeter (Hansatech Ltd., King’s Lynn, Norfolk, UK). The OJIP phases were induced by red light (650 nm) with a light intensity of 3000 μmol photons m−2s−1. Measurements were made on fully developed leaves at the midstem position of nine plants per treatment. The following parameters were used to study photosynthetic activity: maximum quantum yield for primary photochemistry (Fv/Fm), where Fv is the variable fluorescence (Fv = Fm − Fo, where Fm is the maximum fluorescence and Fo is the initial fluorescence); the proportion of active reaction centers (RCs) (RC/ABS); maximum quantum yield of electron (e) transport (ΦEo = ETo/ABS); the efficiency at which a trapped exciton can move an e past QA in the electron transport chain (Ψo); and the performance index (PIABS) [27].

2.5. Determination of Leaf Gas Exchange Parameters

Measurements of leaf gas exchange parameters were recorded using a LICOR 6800 Portable Photosynthesis System infrared gas analyzer (IRGA: LICOR Inc., Lincoln, Nebraska, USA). Intermediate and fully expanded leaves, on nine plants per treatment, were placed in a set of cuvettes under optimal growing conditions. Measurements were taken between 11.00 am and 12.00 pm. The instrument was heated for 30 min and calibrated before use. The measurements used optimal cell conditions of CO2 concentration (400 μmol mol−1), photosynthetically active radiation (500 μmol m−2s−1), relative humidity (60%), and leaf temperature (30 °C). Different parameters such as net photosynthetic rate (A), stomatal conductance (gs), intercellular CO2 (Ci), and transpiration rate (E) were recorded simultaneously. The data were stored in the LICOR instrument and analyzed by the “Photosyn Assistant”. The water use efficiency (WUE) was calculated as A/E.

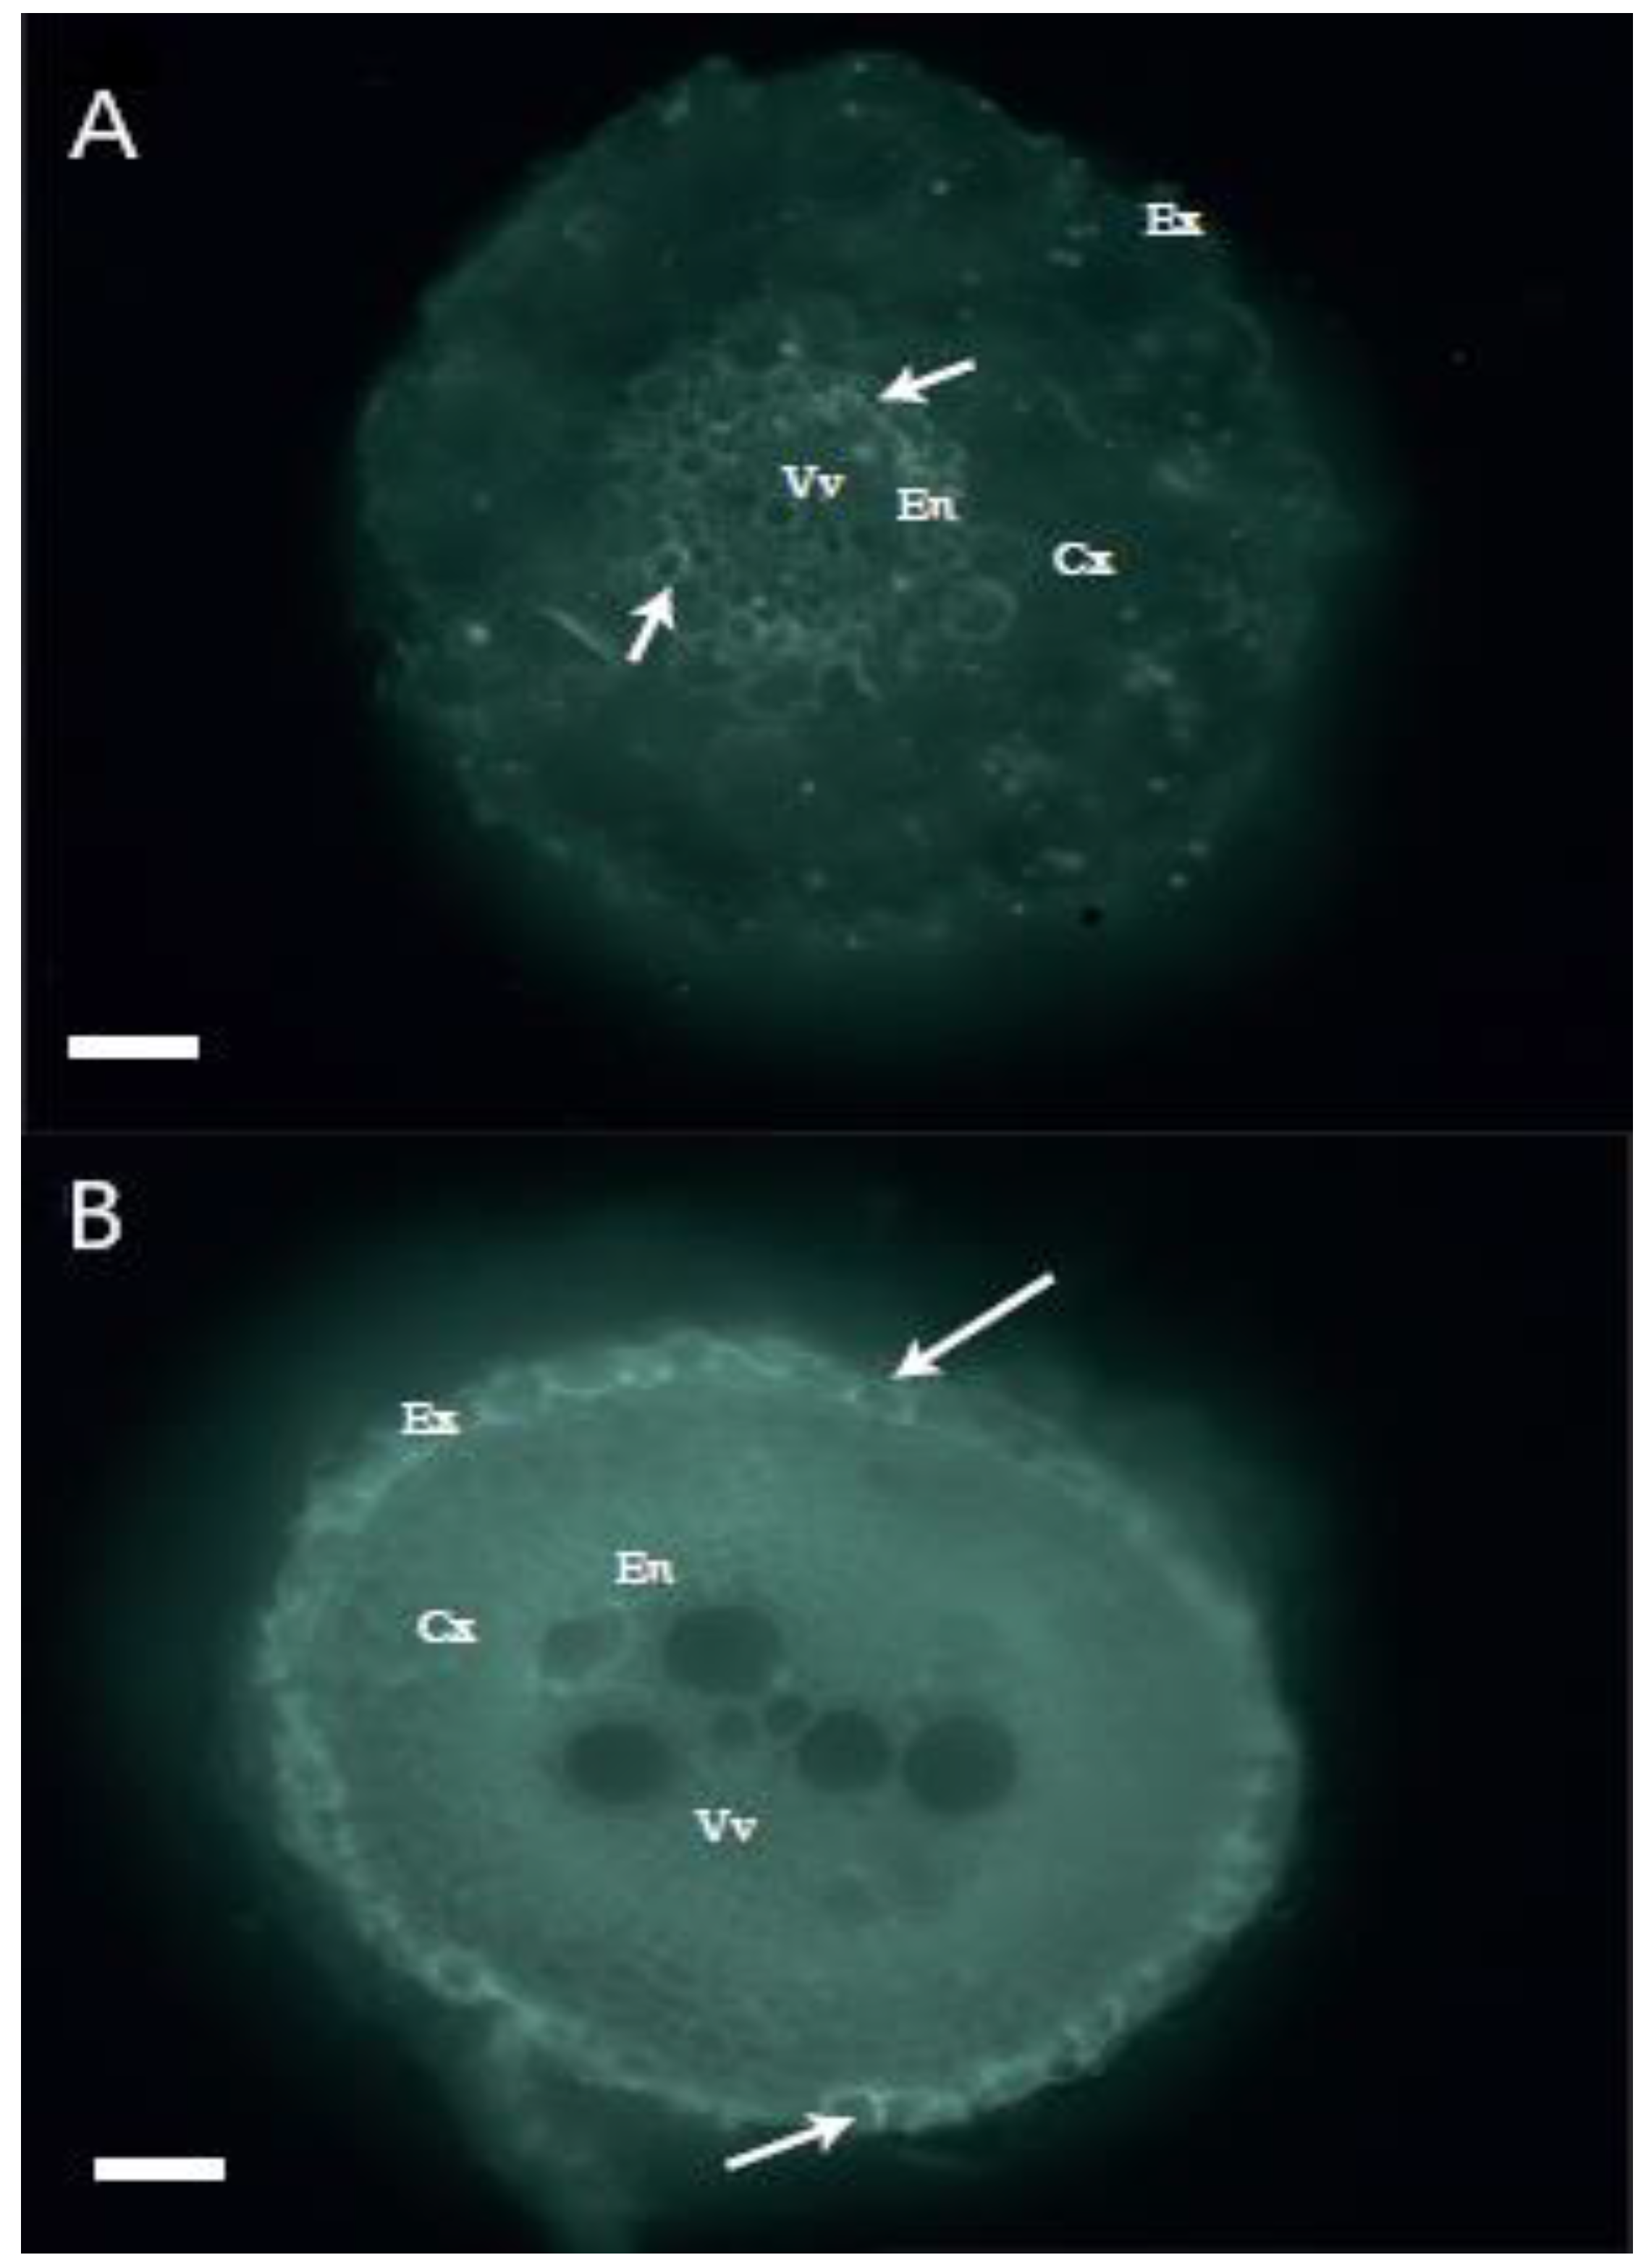
2.6. Histological Staining of Root Suberin

Root suberin staining was performed according to the method described by Vaculík et al. [28]. The roots of all treatments were washed with distilled water in order to clean the remains of vermiculite. Subsequently, to avoid the zone of differentiation and formation of root vessels, root sections were taken at a distance of 10 cm from the root apex. The sections were embedded in 4% agar. Once the agar had solidified, forming a block with the sample, the sections were cut by hand using razor blades and placed on a slide. Then, the cuts were included in 0.5% Toluidine Blue for 30 s and washed with distilled water 3 times. Once washed, they were transferred to a 2% solution of Fluorol-Yellow 088 (FY088), a specific fluorescent dye that binds to suberin, for 20 min in the dark. Then, the slices were washed 3 times with distilled water and covered with a solution of FeCl3 in 50% glycerol to maintain the fluorescence of the Fluorol-Yellow. Finally, a Leica DM CTR.6 (Leica Microsystems, Wetzlar, Germany) was used to observe the sections and take the images using a GPF filter with an excitation of 488 nm. In order to control the efficiency of the staining, a root section was photographed without adding the fluorescent dye, as can be observed in the Supplementary Materials section.

2.7. Mineral Elements Concentration

The mineral elements phosphorus (P), K, S, magnesium (Mg), Ca, boron (B), Mn, copper (Cu), Zn, iron (Fe), Se, and Cd were determined from a 150 mg sample of dry material. Dried leaves and roots were ground and then subjected to mineralization by wet digestion [29]. These samples were mineralized with a mixture of nitric acid (HNO3)/perchloric acid (HClO4) (v/v) and 30% H2O2. From the resulting mineralization, and after the addition of 20 mL of milli-Q water, the nutrient concentration was quantified by ICP-MS (X-Series II; Termo Fisher Scientific Inc., Waltham, MA, USA). The concentration of total nitrogen (N) was measured by colorimetry based on the Berthelot reaction according to the method described by Krorn [30].

2.8. Statistical Analysis

Results were statistically evaluated using a simple ANOVA analysis of variance with a 95% confidence interval using Statgraphics Centurion 16.1.03 software. Means were compared by Fisher’s least significant differences (LSDs). The significance levels were expressed as * p < 0.05, ** p < 0.01, *** p < 0.001, or NS (not significant).

3. Results and Discussion

3.1. Plant Biomass and Root Morphology

One of the most reliable indicators of the physiological and nutritional status of a plant is plant biomass. Under adverse growth conditions, biomass is affected, leading to a reduction in production. Furthermore, given that leaves and roots are organs for the accumulation of mineral elements, in biofortification and phytoremediation programs, the production of biomass must be studied [13,31]. In our experience, it was found that there were no statistically significant differences in leaf and root-dry biomass between the genotypes (Table 1). These data are in contrast to Baxter et al. [11], who observed a reduction in shoot-dry biomass in A. thaliana esb1 mutants. This fact suggests that the effect of an ESB1 mutation depends on the plant species and, in this sense, our TILLING esb1 mutants seem to have the advantage of not negatively affecting growth in B. rapa, which is important in the development of phytoremediation and biofortification programs, as it is a parameter that directly affects the viability of these agronomic techniques [17,31]. On the other hand, different morphological aspects of the root system, such as length and volume, were evaluated. The esb1 mutants showed a significant increase in root length (21%) compared to the WT plants (Table 1). The effect of the ESB1 protein mutation on the root growth of A. thaliana has been studied previously by Ranathunge and Schreiber [32]. The results obtained by these authors are like those presented in our work because they observed an increase in root length. Thus, possible changes in root suberin content and/or distribution could be related to the increase in root length. However, Ranathunge and Schreiber [32] observed an increase in root surface area, which does not agree with our results of root volume (Table 1).

3.2. Photosynthetic Pigments Concentration

In experiments with mutant plants, it is interesting to know the possible improved physiological and photosynthetic capacities derived from the mutation, which gives the plant advantages to tolerate abiotic or biotic stress situations. Therefore, different parameters related to photosynthesis, such as antenna pigments, were analyzed. Chl a and Chl b are photosynthetic pigments associated with protein complexes of photosystem I (PSI) and photosystem II (PSII), which play a key role in photosynthesis as they are involved in the uptake and transfer of light energy [32]. Carotenoids, in addition to acting as accessory light-harvesting pigments to increase the absorption spectrum of chlorophylls, are important because of their photoprotective role by dissipating excess energy [33]. Our results showed a significant increase in Chl a concentration in the esb1 mutants, while no significant differences were observed for Chl b and carotenoids (Table 2). On the other hand, the Chl a/b ratio is an indicator of the proportion of RCs and light-harvesting complexes (LHCII) because Chl a is associated with RCs while Chl b is found primarily in LHCII [23]. A significant increase in the Chl a/b ratio was observed in mutant plants (Table 2), suggesting that the mutant had a higher proportion of pigments acting as reaction centers compared to WT plants.
The photosynthetic pigment content in plant tissues is often used as an indicator of photosynthetic capacity. However, by only estimating the concentration of chlorophylls and carotenoids, we cannot reach definitive conclusions. Therefore, additional parameters specific to the photosynthetic process were measured using instruments, such as the fluorimeter and LICOR, which provide valuable and concise information on plant physiology.

3.3. Chl a Fluorescence

Photosynthesis describes the process in which light energy is captured and converted into chemical energy as organic carbon [32]. Generally, when chlorophyll molecules of the RC of PSII absorb energy and become excited, they give up an e through the electron transport chain (ETC). This e is accepted by quinone A (QA), a component of the ETC that is integrated into PSII, which is reduced. In a reduced state, QA does not accept e, so chlorophyll molecules release the excitation energy as heat or fluorescence [34]. After adapting leaves to a period of darkness, it is possible to measure the fluorescence emission of Chl a using a fluorimeter. This technique is widely used in plant physiology as it provides information on photosynthetic yield [35].
In addition, if QA is oxidized and, therefore, able to accept e, the fluorescence emission is minimal (Fo), and the RC is said to be open. In situations where QA is reduced and is not able to accept any more e, the fluorescence emission by Chl a is maximal (Fm), so the RC is closed, i.e., no e transfer through the ETC is possible [36]. The maximum quantum yield for primary photochemistry (Fv/Fm) represents the energy used for photosynthesis. According to the literature, healthy plants show Fv/Fm values close to 0.8, whereas in plants grown under stress conditions, Fv/Fm is drastically reduced due to damage to PSII. Therefore, Fv/Fm is often used as an indicator of stress in plants [23]. In our case, a significant decrease in Fv/Fm was observed in WT plants (Table 3), although this reduction cannot be considered drastic as the values were close to 0.84. Another stress indicator is RC/ABS, which indicates the proportion of active reaction centers. High RC/ABS values indicate that RCs are active and, therefore, have a higher stress tolerance [37]. There were no significant differences between treatments in relation to RC/ABS (Table 3).
On the other hand, estimating the transport of e through PSII is important to know whether the photosystem is damaged, as well as which specific area is being affected [36]. The efficiency of e movement through PSII can be estimated by the parameter ΦEo or maximum quantum product of e transport [28]. Once QA accepts an e and goes to a reduced state, in order to favor the correct functioning of the ETC, it must cede the e to the next acceptor, quinone B (QB). The efficiency with which an e is transferred from QA to the next acceptor is indicated by Ψo [28]. As shown in Table 3, no significant differences were observed in ΦEo and Ψo values. Finally, the performance index, or PIABS, indicates the overall vital state of a plant as well as its ability to tolerate external stresses [36]. No significant differences were found in relation to PIABS (Table 3). Therefore, chlorophyll a fluorescence parameters indicate that the esb1 mutation did not affect the electron transport and vitality of B. rapa plants.

3.4. Leaf Gas Exchange Parameters

In addition to the fluorimeter, there are instruments that provide valuable information on photosynthesis, such as LICOR (LI-6800), which measures the gas exchange at the leaf level and allows different parameters to be estimated. The net photosynthetic rate (A) is defined as the CO2 assimilated that is useful for photosynthesis [38]. In our study, no significant differences were found between treatments in terms of net photosynthetic rate (Table 4). Therefore, although the esb1 mutants had a higher Chl a content (Figure 1A), it was not sufficient to promote an increase in A.
The gas exchange, mainly CO2 and water vapor, between the internal and external environment of a plant takes place through microscopic structures called stomata located in the aerial part, mainly in leaves. Stomata consist of two cells delimiting a central pore, so changes in the turgor of these cells will influence the degree of stomatal opening, which is also called stomatal conductance (gs), and thus the intercellular CO2 content (Ci) and water loss through transpiration (E) [38]. No significant differences were observed for gs and, consequently, Ci. Nevertheless, an increase in E was observed in the esb1 mutant (Table 4). Water use efficiency (WUE) relates CO2 fixation by photosynthesis to water loss by transpiration (A/E) [38]. Due to increased transpiration, the esb1 mutant showed a significant decrease in WUE. (Table 4). Our results differ from those observed by Baxter et al. [11], where A. thaliana esb1 mutants showed a decrease in E and an increase in WUE. Therefore, the results show that our mutant could be more sensitive to low water availability conditions, such as drought or salinity stress, due to its lower WUE. However, higher transpiration may favor an increase in the transport of essential nutrients to the leaves in esb1, which is interesting for developing biofortification programs.

3.5. Histological Study of Root Suberin

In this section, the possible histological modifications at the root level as a consequence of the mutation have been studied. Cross-sections of roots were taken and stained with Fluorol Yellow 088 (FY 088), a specific fluorescent dye for visualizing suberin, which has been widely used in different studies on root histology in different plant species. The advantages of using FY 088 for suberin detection are that it is a relatively inexpensive and simple technique. However, being a qualitative method, like the other staining techniques, a suberin threshold is necessary for FY 088 to bind to suberin and emit a signal [39]. After observing the slices under the fluorescence microscope, the images corresponding to each treatment were selected and illustrated in Figure 1. Suberin deposits were observed in the WT endodermis (Figure 1A). Compared to WT plants, the esb1 mutant showed increased suberin deposition (Figure 1B), as indicated by the fluorescence intensity of FY088. As B. rapa has an exodermis, the esb1 mutation resulted not only in an increase in suberin but also in the root distribution of this biopolymer, which was mainly deposited in the exodermis. This histological modification of B. rapa esb1 mutants, in terms of suberin amount, is in line with the results obtained previously in the endodermis of A. thaliana esb1 mutants [11,32].

3.6. Essential Mineral Nutrients

In situations where root selective barriers are modified, the ionomic in the rest of the plant is also altered and the content of certain mineral elements may be increased [6]. Thus, esb1 mutants could be included in biofortification programs if the content of essential nutrients for animals is increased in the edible part of the plant. Similarly, if mutants could reduce the availability of toxic elements in the environment, they could be good candidates for use in phytoremediation. For this reason, an ionomic analysis was carried out on leaves and roots in order to evaluate the effect of the esb1 mutation on mineral element content and the potential use of these mutants in biofortification and/or phytoremediation programs.
The analysis of the ionomic profile revealed that our esb1 mutants showed, with respect to WT plants, an increase in N (87%), Mg (49%), Fe (28%), Mn (19%), and Zn (26%) concentrations in roots (Table 5). At the leaf level, we found an increase in P (6%), Fe (66%), B (27%), and Cu (53%) in the esb1 mutant plants (Table 6). In leaves of A. thaliana, Baxter et al. [11] found significant differences between esb1 mutants and WT plants in different mineral elements such as K, S, Ca, Mn, and Zn. However, they did not observe variations in the elements that have been affected in our study. For this reason, increased root suberin may affect the mineral element concentration differently between different species, even within the same family, such as A. thaliana and B. rapa.
From the results obtained, it is important to point out the significant differences with respect to Fe and Cu concentrations, which were around 66% and 53% higher in the leaves of esb1, respectively (Table 6). Fe deficiency is one of the most widespread and prevalent deficiencies in the population [40]. The recommended daily allowance (RDA) of Fe is between 8–18 mg day−1 [41]. Cu also plays several essential roles in human health. The RDA of Cu is between 1.0 and 1.6 mg day−1, and many studies on Cu biofortification have been carried out [41]. Therefore, the results of our study are particularly relevant to Fe and Cu biofortification programs using our esb1 mutant due to the increased translocation of these essential nutrients to the leaves in the mutant. Nevertheless, further research is needed to test this hypothesis.

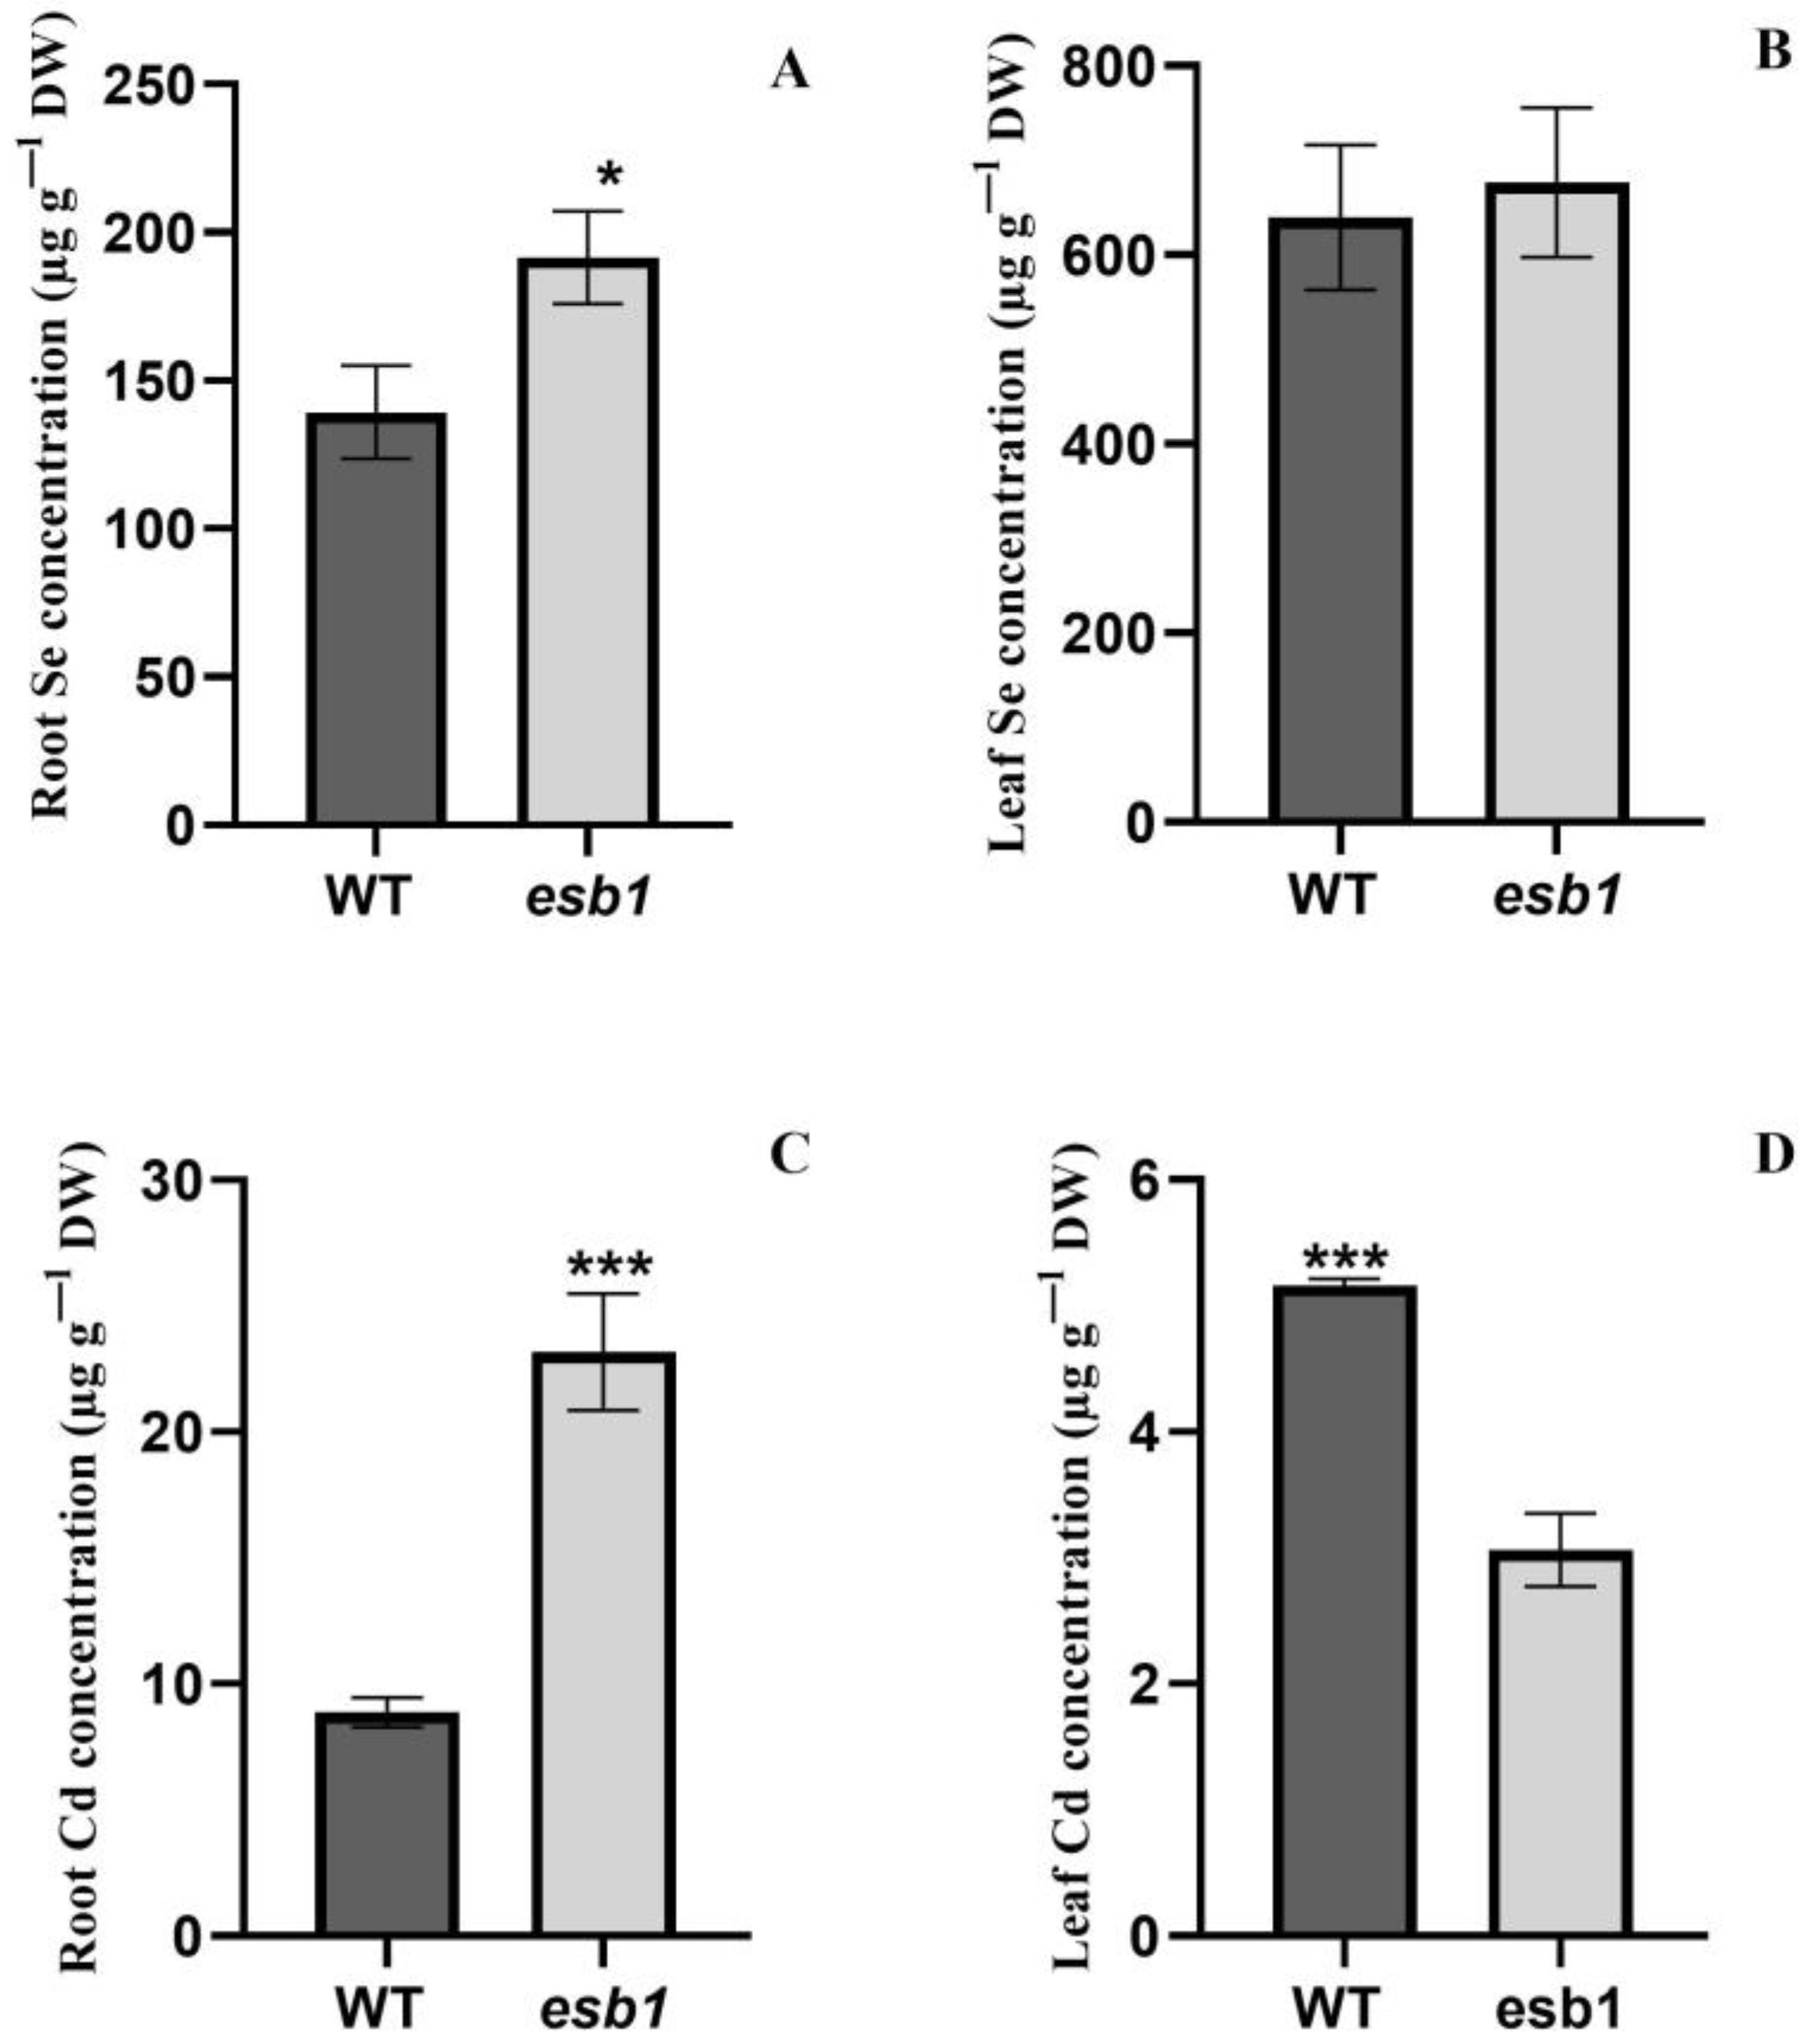
3.7. Se and Cd Concentration

At the root level, esb1 mutants showed a significant increase in Se content, which was 37% higher in relation to the wild genotype (Figure 2A). However, no significant differences in leaf Se content were observed between the two genotypes used for this study (Figure 2B). In the esb1 mutants of A. thaliana, the increase in endodermal suberin was correlated with an increase in leaf Se concentration [11], which contrasts with our study. According to our results, the esb1 mutants of B. rapa did not accumulate significantly more Se in leaves, which is the part that most Brassicaceae species used for human consumption. Therefore, we would rule out the possible use of our esb1 mutants in Se biofortification. On the other hand, significant differences in Cd concentration were observed between the two genotypes at both root and leaf levels. The esb1 mutants showed a significant increase in Cd concentration of 161% in the root (Figure 2C) and a reduction of around 41% in leaves (Figure 2D) compared to WT plants. In A. thaliana, increased root suberin did not affect Cd concentration in the leaves of mutant plants [11].
Among the responses of the plant to different environmental conditions, such as salt stress, deficit, or toxicity of certain mineral elements, is the modification of the degree of suberization of the exo- and endodermal barriers [8]. A typical response to exposure to heavy metals, such as Cd, is to reinforce the exo- and endodermal barriers by increasing root suberin deposition in order to limit Cd flux into the xylem and its translocation to the aerial part [42]. In a previous experiment on Oryza sativa L., an increase in suberin deposition after Cd exposure was observed [3]. Thus, as a consequence of the higher suberin deposition in their exodermis (Figure 2B), esb1 mutants would retain a higher amount of Cd in roots compared to the WT genotype, preventing their translocation to the aerial part. Due to the toxicity of Cd to plants and animals, many studies have focused on the phytoremediation of this heavy metal. The most widely used phytoremediation techniques are phytoextraction and phytostabilization. In the first technique, the plant absorbs the pollutant and accumulates it in leaves and stems, while phytostabilization consists of the immobilization of the heavy metal at the root level by its adsorption or precipitation [43]. Since our mutants of B. rapa accumulate Cd mainly in the root, reducing its translocation to the leaves, esb1 mutants could be studied for the development of future Cd phytoremediation programs, specifically phytostabilization. However, to test this hypothesis, it would be necessary to carry out more extensive studies applying only Cd at higher concentrations or under field conditions.

4. Conclusions

The present study provides the characterization of esb1 mutants in a plant species other than A. thaliana. With respect to root suberin content, esb1 showed a higher suberin deposition and a redistribution of root suberin to the exodermis compared to WT plants. According to physiological parameters, despite the higher Chl a concentration and Chl a/b ratio observed in the mutants, increased root suberin in the esb1 mutants had no effect on photosynthetic capacity and chlorophyll a fluorescence parameters. Nevertheless, an increase in E and a decrease in WUE were observed in esb1 mutants. On the other hand, due to root histological modifications, the absorption and transport of nutrients and, therefore, their concentration in roots and leaves, was altered. Thus, our study is further evidence that an increase in root suberin can affect nutrient transport across the root and its concentration in the rest of the tissues. We can conclude that our B. rapa esb1 mutant would not be a good candidate for Se biofortification. However, it could be useful for Cd phytoremediation and Fe and Cu biofortification, as the mutant reduced the translocation of Cd to the leaves and increased Fe and Cu uptake, although more studies are required.

Supplementary Materials

The following supporting information can be downloaded at https://www.mdpi.com/article/10.3390/agronomy13061642/s1, Figure S1: Cross-section of the WT B. rapa root unstained with FY 088.

Author Contributions

Conceptualization, J.J.R., J.M.R. and B.B. methodology, S.A.-C. and E.N.-L., validation, J.J.R., J.M.R. and B.B., formal analysis, J.J.R., E.N.-L., J.M.R. and B.B., data curation, S.A.-C.; writing—original draft preparation, S.A.-C., writing—review and editing, J.J.R., J.M.R. and B.B., supervision, J.J.R., J.M.R. and B.B. All authors have read and agreed to the published version of the manuscript.

Funding

This research was funded by the PAI program (Plan Andaluz de Investigación, Grupo de Investigación AGR282) and by a grant from the FPU of the Ministerio de Educación y Ciencia awarded to S.A.C., grant number FPU20/05049.

Data Availability Statement

The data in this article will be shared upon reasonable request to the corresponding author.

Acknowledgments

We thank Martin R. Broadley and Neil Graham from Nottingham University for providing us with the seeds utilized in this experiment.

Conflicts of Interest

The authors declare no conflict of interest. The funders had no role in the design of the study; in the collection, analyses, or interpretation of data; in the writing of the manuscript, or in the decision to publish the results.

References

  1. Ramakrishna, P.; Barberon, M. Polarized Transport across Root Epithelia. Curr. Opin. Plant. Biol. 2019, 52, 23–29. [Google Scholar] [CrossRef] [PubMed]
  2. Bachelier, J.B.; Razik, I.; Schauer, M.; Seago, J.L. Roots Structure and Development of Austrobaileya Scandens (Austrobaileyaceae) and Implications for Their Evolution in Angiosperms. Plants 2020, 9, 54. [Google Scholar] [CrossRef] [PubMed] [Green Version]
  3. Qi, X.; Tam, N.F.Y.; Li, W.C.; Ye, Z. The Role of Root Apoplastic Barriers in Cadmium Translocation and Accumulation in Cultivars of Rice (Oryza Sativa L.) with Different Cd-Accumulating Characteristics. Environ. Pollut. 2020, 264, 114736. [Google Scholar] [CrossRef] [PubMed]
  4. Ismael, M.A.; Elyamine, A.M.; Moussa, M.G.; Cai, M.; Zhao, X.; Hu, C. Cadmium in Plants: Uptake, Toxicity, and Its Interactions with Selenium Fertilizers. Metallomics 2019, 11, 255–277. [Google Scholar] [CrossRef]
  5. Chen, A.; Husted, S.; Salt, D.E.; Schjoerring, J.K.; Persson, D.P. The Intensity of Manganese Deficiency Strongly Affects Root Endodermal Suberization and Ion Homeostasis. Plant. Physiol. 2019, 181, 729–742. [Google Scholar] [CrossRef] [Green Version]
  6. Doblas, V.G.; Geldner, N.; Barberon, M. The Endodermis, a Tightly Controlled Barrier for Nutrients. Curr. Opin. Plant. Biol. 2017, 39, 136–143. [Google Scholar] [CrossRef]
  7. Barberon, M. The Endodermis as a Checkpoint for Nutrients. New Phytol. 2017, 213, 1604–1610. [Google Scholar] [CrossRef]
  8. Barbosa, I.C.R.; Rojas-Murcia, N.; Geldner, N. The Casparian Strip—One Ring to Bring Cell Biology to Lignification? Curr. Opin. Biotechnol. 2019, 56, 121–129. [Google Scholar] [CrossRef]
  9. Wang, P.; Calvo-Polanco, M.; Reyt, G.; Barberon, M.; Champeyroux, C.; Santoni, V.; Maurel, C.; Franke, R.B.; Ljung, K.; Novak, O.; et al. Surveillance of Cell Wall Diffusion Barrier Integrity Modulates Water and Solute Transport in Plants. Sci. Rep. 2019, 9, 4227. [Google Scholar] [CrossRef] [Green Version]
  10. Namyslov, J.; Bauriedlová, Z.; Janoušková, J.; Soukup, A.; Tylová, E. Exodermis and Endodermis Respond to Nutrient Deficiency in Nutrient-Specific and Localized Manner. Plants 2020, 9, 201. [Google Scholar] [CrossRef] [Green Version]
  11. Baxter, I.; Hosmani, P.S.; Rus, A.; Lahner, B.; Borevitz, J.O.; Muthukumar, B.; Mickelbart, M.V.; Schreiber, L.; Franke, R.B.; Salt, D.E. Root Suberin Forms an Extracellular Barrier That Affects Water Relations and Mineral Nutrition in Arabidopsis. PLoS Genet. 2009, 5, e1000492. [Google Scholar] [CrossRef] [PubMed] [Green Version]
  12. Sharma, R.; Yeh, K.C. The Dual Benefit of a Dominant Mutation in Arabidopsis IRON DEFICIENCY TOLERANT1 for Iron Biofortification and Heavy Metal Phytoremediation. Plant. Biotechnol. J. 2020, 18, 1200–1210. [Google Scholar] [CrossRef] [PubMed] [Green Version]
  13. Van Der Straeten, D.; Bhullar, N.K.; De Steur, H.; Gruissem, W.; MacKenzie, D.; Pfeiffer, W.; Qaim, M.; Slamet-Loedin, I.; Strobbe, S.; Tohme, J.; et al. Multiplying the Efficiency and Impact of Biofortification through Metabolic Engineering. Nat. Commun. 2020, 11, 5203. [Google Scholar] [CrossRef] [PubMed]
  14. Navarro-León, E.; Javier López-Moreno, F.; Ahmad, A.; Ruiz, J.M.; Blasco, B.; Navarro-León, E.; Ahmad, A.; Ruiz, J.M.; Blasco, B.; López-Moreno, F.J. Biofortification of Crops: Novel Insights and Approaches for Enhanced Nutrient Accumulation. In Conceptualizing Plant-Based Nutrition; Springer: Singapore, 2022; pp. 19–41. [Google Scholar] [CrossRef]
  15. Sarwar, N.; Akhtar, M.; Kamran, M.A.; Imran, M.; Riaz, M.A.; Kamran, K.; Hussain, S. Selenium Biofortification in Food Crops: Key Mechanisms and Future Perspectives. J. Food Compos. Anal. 2020, 93, 103615. [Google Scholar] [CrossRef]
  16. Schiavon, M.; Nardi, S.; dalla Vecchia, F.; Ertani, A. Selenium Biofortification in the 21st Century: Status and Challenges for Healthy Human Nutrition. Plant. Soil. 2020, 453, 245–270. [Google Scholar] [CrossRef] [PubMed]
  17. Izydorczyk, G.; Ligas, B.; Mikula, K.; Witek-Krowiak, A.; Moustakas, K.; Chojnacka, K. Biofortification of Edible Plants with Selenium and Iodine—A Systematic Literature Review. Sci. Total. Environ. 2021, 754, 141983. [Google Scholar] [CrossRef]
  18. Jaskulak, M.; Grobelak, A.; Vandenbulcke, F. Modelling Assisted Phytoremediation of Soils Contaminated with Heavy Metals–Main Opportunities, Limitations, Decision Making and Future Prospects. Chemosphere 2020, 249, 126196. [Google Scholar] [CrossRef]
  19. Genchi, G.; Sinicropi, M.S.; Lauria, G.; Carocci, A.; Catalano, A. The Effects of Cadmium Toxicity. Int. J. Environ. Res. Public. Health 2020, 17, 3782. [Google Scholar] [CrossRef]
  20. Wang, M.; Chen, Z.; Song, W.; Hong, D.; Huang, L.; Li, Y. A Review on Cadmium Exposure in the Population and Intervention Strategies Against Cadmium Toxicity. Bull. Env. Contam. Toxicol. 2021, 106, 65–74. [Google Scholar] [CrossRef]
  21. Rizwan, M.; Ali, S.; Zia ur Rehman, M.; Rinklebe, J.; Tsang, D.C.W.; Bashir, A.; Maqbool, A.; Tack, F.M.G.; Ok, Y.S. Cadmium Phytoremediation Potential of Brassica Crop Species: A Review. Sci. Total. Environ. 2018, 631–632, 1175–1191. [Google Scholar] [CrossRef]
  22. Li, X.; Wu, Y.; Li, B.; Yang, Y.; Yang, Y. Selenium Accumulation Characteristics and Biofortification Potentiality in Turnip (Brassica rapa var. rapa) Supplied with Selenite or Selenate. Front. Plant. Sci. 2018, 8, 2207. [Google Scholar] [CrossRef] [PubMed] [Green Version]
  23. Navarro-León, E.; Oviedo-Silva, J.; Ruiz, J.M.; Blasco, B. Possible role of HMA4a TILLING mutants of Brassica rapa in cadmium phytoremediation programs. Ecotoxicol. Environ. Saf. 2019, 180, 88–94. [Google Scholar] [CrossRef] [PubMed]
  24. Lochlainn, S.T.; Amoah, S.; Graham, N.S.; Alamer, K.; Rios, J.J.; Kurup, S.; Stoute, A.; Hammond, J.P.; Østergaard, L.; King, G.J.; et al. High Resolution Melt (HRM) Analysis Is an Efficient Tool to Genotype EMS Mutants in Complex Crop Genomes. Plant. Methods 2011, 7, 43. [Google Scholar] [CrossRef] [PubMed] [Green Version]
  25. Graham, N.S.; Hammond, J.P.; Lysenko, A.; Mayes, S.; Lochlainn, S.Ó.; Blasco, B.; Bowen, H.C.; Rawlings, C.J.; Rios, J.J.; Welham, S.; et al. Genetical and Comparative Genomics of Brassica under Altered CA Supply Identifies Arabidopsis CA-Transporter Orthologs. Plant. Cell 2014, 26, 2818–2830. [Google Scholar] [CrossRef] [Green Version]
  26. Wellburn, A.R. The Spectral Determination of Chlorophylls a and b, as Well as Total Carotenoids, Using Various Solvents with Spectrophotometers of Different Resolution. J. Plant. Physiol. 1994, 144, 307–313. [Google Scholar] [CrossRef]
  27. Strasser, R.J.; Tsimilli-Michael, M.; Srivastava, A. Analysis of the Chlorophyll a Fluorescence Transient. In Chlorophyll a Fluorescence: A Signature of Photosynthesis; Papageorgiou, G.C., Govindjee, Eds.; Springer: Dordrecht, The Netherlands, 2004; pp. 321–362. [Google Scholar] [CrossRef]
  28. Vaculík, M.; Konlechner, C.; Langer, I.; Adlassnig, W.; Puschenreiter, M.; Lux, A.; Hauser, M.T. Root Anatomy and Element Distribution Vary between Two Salix Caprea Isolates with Different Cd Accumulation Capacities. Environ. Pollut. 2012, 163, 117–126. [Google Scholar] [CrossRef] [Green Version]
  29. Wolf, B. A Comprehensive System of Leaf Analyses and Its Use for Diagnosing Crop Nutrient Status. Commun. Soil. Sci. Plant. Anal. 1982, 13, 1035–1059. [Google Scholar] [CrossRef]
  30. Krom, M.D. Spectrophotometric determination of ammonia: A study of a modified Berthelot reaction using salicylate and dichloroisocyanurate. Analyst 1980, 105, 305–316. [Google Scholar] [CrossRef]
  31. Shikha, D.; Singh, P.K. In Situ Phytoremediation of Heavy Metal–Contaminated Soil and Groundwater: A Green Inventive Approach. Environ. Sci. Pollut. Res. 2021, 28, 4104–4124. [Google Scholar] [CrossRef]
  32. Ranathunge, K.; Schreiber, L. Water and Solute Permeabilities of Arabidopsis Roots in Relation to the Amount and Composition of Aliphatic Suberin. J. Exp. Bot. 2011, 62, 1961–1974. [Google Scholar] [CrossRef]
  33. Sharkey, T.D. Emerging Research in Plant Photosynthesis. Emerg. Top. Life Sci. 2020, 4, 137–150. [Google Scholar] [CrossRef] [PubMed]
  34. Maoka, T. Carotenoids as Natural Functional Pigments. J. Nat. Med. 2020, 74, 1–16. [Google Scholar] [CrossRef] [Green Version]
  35. Pérez-Bueno, M.L.; Pineda, M.; Barón, M. Phenotyping Plant Responses to Biotic Stress by Chlorophyll Fluorescence Imaging. Front. Plant. Sci. 2019, 10, 1135. [Google Scholar] [CrossRef] [PubMed]
  36. Banks, J.M. Continuous Excitation Chlorophyll Fluorescence Parameters: A Review for Practitioners. Tree Physiol. 2017, 37, 1128–1136. [Google Scholar] [CrossRef]
  37. Kim, D.; Kwak, J.I.; An, Y.J. Physiological Response of Crop Plants to the Endocrine-Disrupting Chemical Nonylphenol in the Soil Environment. Environ. Pollut. 2019, 251, 573–580. [Google Scholar] [CrossRef]
  38. Bertolino, L.T.; Caine, R.S.; Gray, J.E. Impact of Stomatal Density and Morphology on Water-Use Efficiency in a Changing World. Front. Plant. Sci. 2019, 10, 225. [Google Scholar] [CrossRef] [Green Version]
  39. Kreszies, T.; Kreszies, V.; Ly, F.; Thangamani, P.D.; Shellakkutti, N.; Schreiber, L. Suberized Transport Barriers in Plant Roots: The Effect of Silicon. J. Exp. Bot. 2020, 71, 6799–6806. [Google Scholar] [CrossRef] [PubMed]
  40. Rehman, A.; Masood, S.; Ullah, N.; Abbasi, E.; Hussain, Z.; Ali, I. Molecular Basis of Iron Biofortification in Crop Plants; A Step towards Sustainability. Plant Breed. 2021, 140, 12–22. [Google Scholar] [CrossRef]
  41. Buturi, C.V.; Mauro, R.P.; Fogliano, V.; Leonardi, C.; Giuffrida, F. Mineral Biofortification of Vegetables as a Tool to Improve Human Diet. Foods 2021, 10, 223. [Google Scholar] [CrossRef]
  42. Wu, J.; Mock, H.P.; Giehl, R.F.H.; Pitann, B.; Mühling, K.H. Silicon Decreases Cadmium Concentrations by Modulating Root Endodermal Suberin Development in Wheat Plants. J. Hazard. Mater. 2019, 364, 581–590. [Google Scholar] [CrossRef] [PubMed]
  43. Muthusaravanan, S.; Sivarajasekar, N.; Vivek, J.S.; Paramasivan, T.; Naushad, M.; Prakashmaran, J.; Gayathri, V.; Al-Duaij, O.K. Phytoremediation of Heavy Metals: Mechanisms, Methods and Enhancements. Env. Chem. Lett. 2018, 16, 1339–1359. [Google Scholar] [CrossRef]
Figure 1. Transverse sections of B. rapa root stained with FY 088 and observed under fluorescence microscopy. (A) WT and (B) esb1. White arrows indicate suberin deposits. Ex: exodermis; Cx: cortex; En: endodermis; Vv: vascular vessels. The scale bar is 50 µm.
Agronomy 13 01642 g001
Figure 2. Se concentration in the root (A) and leaf (B), and Cd concentration in the root (C) and leaf (D) in WT plants and esb1 mutants of B. rapa. Columns represent mean values ± standard error (n = 3), and differences between means were compared by Fisher’s least significance test (LSD; p = 0.05). The levels of significance were represented by p > 0.05: NS (not significant), p < 0.05 (*), and p < 0.001 (***).
Agronomy 13 01642 g002
Table 1. Leaf and root biomass, root length, and root volume in WT and esb1 mutants.
Leaf DW
(g plant−1)
Root DW
(g plant−1)
Root Length (cm)Root Volume (cm3)
WT1.34 ± 0.170.11 ± 0.0132.94 ± 1.061.81 ± 0.17
esb11.46 ± 0.170.10 ± 0.0239.70 ± 2.132.14 ± 0.31
p-valueNSNS*NS
LSD0.050.540.044.990.74
Values are means ± standard error (n = 9), and differences between means were compared by Fisher’s least significance test (LSD; p = 0.05). The levels of significance were represented by p > 0.05: NS (not significant), p < 0.05 (*).
Table 2. Chlorophyll a, chlorophyll b, carotenoid concentration, and the ratio of Chl a/b in WT and esb1 mutants.
Chl a
(mg g−1 FW)
Chl b
(mg g−1 FW)
Carotenoids
(µg g−1 FW)
Ratio of Chl a/b
WT0.367 ± 0.0030.190 ± 0.00545.42 ± 1.361.94 ± 0.05
esb10.384 ± 0.0040.184 ± 0.00248.59 ± 1.632.13 ± 0.01
p-value**NSNS**
LSD0.050.010.014.510.12
Values are means ± standard error (n = 9), and differences between means were compared by Fisher’s least significance test (LSD; p = 0.05). The levels of significance were represented by p > 0.05: NS (not significant) and p < 0.01 (**).
Table 3. Chl a fluorescence parameters in WT and esb1 mutants.
Fv/FmRC/ABSΦEoΨoPIABS
WT0.839 ± 0.0010.76 ± 0.010.50 ± 0.010.60 ± 0.036.17 ± 0.60
esb10.844 ± 0.0010.74 ± 0.020.51 ± 0.010.61 ± 0.035.64 ± 0.77
p-value**NSNSNSNS
LSD0.050.0030.0590.0280.0320.692
Values are means ± standard error (n = 9), and differences between means were compared by Fisher’s least significance test (LSD; p = 0.05). The levels of significance were represented by p > 0.05: NS (not significant), and p < 0.01 (**).
Table 4. Leaf gas exchange parameters in WT and esb1 mutants.
A
(µmol m−2s−1)
gs
(mol m−2s−1)
Ci
(µmol mol−1)
E
(mmol m−2s−1)
WUE
WT29.03 ± 0.500.38 ± 0.02309.00 ± 7.904.52 ± 0.156.43 ± 0.11
esb130.69 ± 0.740.43 ± 0.02312.82 ± 8.915.44 ± 0.215.49 ± 0.18
p-valueNSNSNS***
LSD0.051.9870.07269.8730.5760.467
Values are means ± standard error (n = 9), and differences between means were compared by Fisher’s least significance test (LSD; p = 0.05). The levels of significance were represented by p > 0.05: NS (not significant), p < 0.05 (*), and p < 0.01 (**).
Table 5. Essential nutrient concentration in WT and esb1 mutant roots. Macronutrients are expressed as mg g 1 DW, and micronutrients are expressed as µg g 1DW.
NPKSCaMgFeBCuMnZn
WT30.40 ± 2.8717.21 ± 1.2331.22 ± 2.243.73 ± 0.2640.12 ± 5.4416.74 ± 2.39131,333.42 ± 470.4830.59 ± 4.0646.67 ± 9.50422.27 ± 8.2245.11 ± 0.64
esb156.93 ± 4.6418.48 ± 0.3829.62 ± 3.264.83 ± 0.3249.79 ± 3.4725.02 ± 1.30167,769.11 ± 415.4627.67 ± 3.3057.86 ± 5.12500.45 ± 17.8556.71 ± 1.94
p-value***NSNSNSNS***NSNS***
LSD0.0511.573.5910.991.1617.927.541742.6814.5429.9754.565.68
Values are means ± standard error (n = 9), and differences between means were compared by Fisher’s least significance test (LSD; p = 0.05). The levels of significance were represented by p > 0.05: NS (not significant), p < 0.05 (*), p < 0.01 (**), and p < 0.001 (***).
Table 6. Essential nutrient concentration in WT and esb1 mutant leaves. Macronutrients are expressed as mg g −1 DW, and micronutrients are expressed as µg g −1DW.
NPKSCaMgFeBCuMnZn
WT60.97 ± 3.797.32 ± 0.0362.57 ± 4.7734.97 ± 2.5347.39 ± 3.829.68 ± 0.85508.55 ± 35.64236.87 ± 11.919.17 ± 0.36221.77 ± 11.1328.91 ± 3.45
esb160.89 ± 2.527.75 ± 0.1558.88 ± 2.3735.50 ± 2.5948.13 ± 2.8210.14 ± 0.58840.08 ± 7.85300.68 ± 11.7414.07 ± 2.03234.41 ± 10.5720.96 ± 0.44
p-valueNS*NSNSNSNS******NSNS
LSD0.059.660.4214.7910.0613.192.86101.32246.441.9242.619.66
Values are means ± standard error (n = 9), and differences between means were compared by Fisher’s least significance test (LSD; p = 0.05). The levels of significance were represented by p > 0.05: NS (not significant), p < 0.05 (*), p < 0.01 (**), and p < 0.001 (***).
Disclaimer/Publisher’s Note: The statements, opinions and data contained in all publications are solely those of the individual author(s) and contributor(s) and not of MDPI and/or the editor(s). MDPI and/or the editor(s) disclaim responsibility for any injury to people or property resulting from any ideas, methods, instructions or products referred to in the content.

