Article

Chemical Fertilization Alters Soil Carbon in Paddy Soil through the Interaction of Labile Organic Carbon and Phosphorus Fractions

by
Suphathida Aumtong
1,*,
Chakrit Chotamonsak
2,3,
Paweenuch Pongwongkam
4 and
Kanchana Cantiya
5
1
Soil Science Program, Faculty of Agricultural Production, Maejo University, Chiang Mai 50290, Thailand
2
Department of Geology, Faculty of Social Sciences, Chiang Mai University, Chiang Mai 50200, Thailand
3
Environmental Science Research Center, Faculty of Science, Chiang Mai University, Chiang Mai 50200, Thailand
4
Office of Agricultural Research and Development Region 2, Phitsanulok 65130, Thailand
5
Phitsanulok Rice Research Center, Phitsanulok 65130, Thailand
*
Author to whom correspondence should be addressed.
Agronomy 2023, 13(6), 1588; https://doi.org/10.3390/agronomy13061588
Submission received: 10 May 2023 / Revised: 8 June 2023 / Accepted: 9 June 2023 / Published: 12 June 2023

Abstract

:
The influence of long-term chemical fertilization in paddy soils is based on the interaction between labile carbon and phosphorus fractions and the manner in which this influences soil organic carbon (SOC). Four soil depths (0–30 cm) were analyzed in this study. Easily oxidized organic carbon components, such as permanganate oxidized carbon (POXC) and dissolved organic carbon (DOC), and other physicochemical soil factors were evaluated. The correlation and principal component analyses were used to examine the relationship between soil depth and the parameter dataset. The results showed that Fe-P concentrations were greater in the 0–5 cm soil layer. DOC, inorganic phosphate fraction, and other soil physiochemical characteristics interacted more strongly with SOC in the 0–5 cm soil layer, compared to interactions in the 10–15 cm layer, influencing soil acidity. An increase in DOC in the 0–5 cm soil layer had a considerable effect on lowering SOC, consistent with P being positively correlated with POXC, but negatively with SOC and water-soluble carbon (WSC). The changes in SOC could be attributed to the relationship between DOC and inorganic phosphate fractions (such as Fe-P) under specific soil pH conditions. An increase in soil DOC could be caused by changes in the P fraction and pH. The DOC:Avai. P ratio could serve as a compromise for the C and P dynamic indicators. The soil depth interval is a critical element that influences these interactions. Agricultural policy and decision-making may be influenced by the P from chemical fertilization practices, considering the yields and environmental effects.

1. Introduction

Asia is the highest producer (89%) and the second-largest exporter of rice (approximately 57%) worldwide, with Thailand being the third-most prolific exporter. In 2022,the average amount of nitrogen, phosphorous (P2O5), and potassium (K2O) used in chemical fertilizers was 66.3, 16.6, and 25.6 kg ha−1, respectively, for all crops, and more than 200 million tons of nutrients were used (of which 56% was nitrogen) [1]. This was reflected in increases in both fertilizer use and agricultural productivity. Increased crop production is critical to ensure food security, sustainable development, and environmental quality. In Thailand, rice farmers tend to use more fertilizer during weather shocks [2]. This leads to an increase in irrigated areas, a decrease in farmed land, and an increase in fertilizer use [1]. Anoxic conditions increase the amount of soil organic carbon (SOC) that accumulates in paddy soils [3]; this soil sequestration of carbon is expected [4].
Owing to the long-term addition of synthetic fertilizer, an increase in the soil pH was observed in Thailand’s paddy soil at the national scale [5]. There were significant increases in the SOC, total and accessible nitrogen, extractable phosphorus, and exchangeable K in the soil analyzed from the 1960s to the 2010s [5]. In China, paddy rice production is conducive to soil C sequestration [6]. Applying chemical fertilizer and manure to paddy fields instead of rice straw is an effective way to increase SOC buildup, increase rice yield, and increase crop N usage efficiency in China’s subtropical rice production [7]. In southern Chinese paddy fields, the combined application of organic manure and chemical fertilizer improves SOC content and stock as well as the soil carbon management index [8]. Meanwhile, others in Bangladesh and Indonesia investigated long-term changes in soil pH and found significant decreases in soil pH [9,10]. The changes in the fertility of Thai paddy soils could be attributed to the increase in chemical fertilization [11]. In particular, nitrogenous fertilizers are the most popular in Thailand, with rice being the most demanding agricultural industry [1].
Chemical fertilization alters the biochemical properties of the soil owing to a reduction in soil pH and respiration rates, leading to a loss in microbial diversity and changes in the soil’s organic carbon structure [12,13]. The main cause of the increase in SOC is the chronic addition of N, which reduces the soil pH and soil respiration rates [12]. Therefore, soil properties and SOC variations can be explained in terms of the input of chemical fertilizers: they impact C storage and the accessibility of plant nutrients. The loss of microbial diversity with N addition is linked to the availability of soil nitrogen and soil carbon [13]. The features of SOC as a component of the soil structure are altered by the use of chemical fertilizers [14]. Long-term applications of composted manure combined with chemical nitrogen, phosphorus, and potassium (NPK) fertilizers increased soil pH, whereas single applications of chemical NPK fertilizers decreased it. Combined applications of manure and chemical NPK fertilizers can increase SOC concentrations, improving the physical environment and yield of rice grain [15]. However, chemical fertilization has had varying effects on soil fertility, and logical soil/fertilizer management plans should be developed for each nation and region [5], and even specific site.
The organic material present in the aqueous phase is known as dissolved organic matter (DOM), which is a mobile pool of dissolved organic carbon (DOC) [16]. When the proportion of SOC is low, DOM is a significant component of the soil organic matter [17]. Organic matter is depolymerized and enzyme-catalyzed in the soil to produce DOM [18]. This labile C fraction is easier to assimilate for the microbes as a source of energy, C, and nutrients due to the presence of low-molecular-weight compounds [18,19]. N enrichment increases the amount of soil C available for leaching; however, the application of synthetic NPK fertilizer only marginally increases soil C availability for leaching. According to Sinsabaugh et al. [20], following the addition of synthetic N to forests, the soil oxidative enzyme activity decreases but the DOC concentrations increase. The application of inorganic phosphorus to soil encourages the degradation of humic material into lower-molecular-weight compounds [21]. In addition, the enhanced desorption of DOC from the mineral phase of the soil, owing to phosphate exchange to DOC, demonstrated a higher capacity for sorption sites on mineral surfaces [22]. Permanganate oxidizable carbon (POXC) (i.e., easily oxidized carbon (EOC)) is another labile carbon that regulates primary substrates and affects crop nutrient availability [23], physicochemical properties, SOC decomposition, and carbon cycling [24]. POXC is affected by the addition of synthetic fertilizer, especially phosphate fertilization [21].
The availability of P is affected by the solid phase and residence time of soil, which, in turn, determine the soil’s ability to adsorb substances [25]. The inorganic P fractions of intensively acidic paddy soils increased as a result of long-term chemical NPK fertilizer treatments [26]. NPK-coupled animal manure fertilization increased inorganic phosphorus fractions in acidic paddy soils over 35 years [27]. Intermittent addition of labile carbon increases soil pH and the soluble Fe and P concentrations during Fe reduction [28]. This phenomenon could be attributed to the increased labile P in paddy soils. This study focuses on the relationship between DOC and inorganic P fractions, as well as the impact of P availability in intensive paddy soils.
There has been notable vertical movement of contemporary carbon within the soil profile [29]. Soil layers with deeper layers have a higher capacity to sequester SOC due to increased turnover time and chemical recalcitrance. [30]. During revegetation, soil carbon accumulation is a sluggish process in both shallow and deep layers, and SOC was responsible for the majority of the increase in soil carbon [31]. Therefore, large amounts of organic carbon are stored in deep soil, suggesting that managing terrestrial ecosystems effectively requires a deeper understanding of the stores and cycles of deep soil carbon [32]. The relationships between C, N, and P converge, indicating that various nutrient components play different roles in soil C cycling depending on the depth [33]
Therefore, the relationships between the factors, which would relate to the dynamics of the labile carbon fraction as DOC is related to changes in the inorganic P fractions and soil physiochemical property, could be used to explain C cycling in paddy soils. This study proposes that long-term chemical fertilization of paddy soils increases the amount of labile carbon, such as DOC and POXC, and alters soil properties. Differences in responses, explanations, and effects of labile C fraction dynamics result from differences in soil depth. This study aimed to gain a better understanding of the relationships between C fractions, particularly DOC, and changes in inorganic P fractions under long-term chemical fertilizer use in paddy soil.

2. Materials and Methods

Site study: The research area is located in Bann Donjiang, Sob-Poeng Subdistrict, Maetang, Chiang Mai Province, Northern Thailand. Traditional rice plantations are found here. The study areas are located at 19°05′47″ N 98°50′54″ E/19°09′64″ N 98°84′83″ E (Figure 1). The soil was classified as fine, mixed, semiactive, and isohyperthermic typic endoaqualfs. The parent material was alluvial, and the topography was almost level. The climate was tropical savannah. The soil sampling site, which was 360–400 m above the mean sea level, contained 11 farmer plots with the same topography. The types and amounts of synthetic fertilizer used, the extent to which the paddy soil was plowed, and how crop leftovers were handled are all discussed.
Interview: Questionnaires on land use and management under chemical and organic agricultural management methods served as the study tools. Data on the following five aspects were collected throughout the interview: information on the interviewee followed by descriptions of land usage and plantation management, water management in farmland areas, fertilizer use, and soil management. To obtain the necessary information, in-depth interviews were conducted with farmers in all target areas.
Observation by participants: We established connections with farmers who constituted the target population. This comprised members of the community with whom informal discussions and inquiries on a variety of subjects were conducted in accordance with the research aims. Observations were documented photographically and through other data collection methods to enhance the veracity of the information gleaned from the survey. To gather information by interviewing villagers and identifying farmers who practiced conventional practices, we surveyed the study site and conducted a community meeting with farmers. This revealed that rice farming utilizes a variety of soil management techniques. We interviewed 11 selected owners of the paddy plots, who provided information on the following: fertilization, types and amounts of fertilizer, and other soil management practices.
Soil management: In order to determine the intensity of fertilization, information from interviews and observations linked to soil management in the cropping system for each crop was taken into account. Following the application of chemical fertilizer at an N:P2O5:K2O ratio of 4:1:1 (i.e., 190–380 N, 47–94 P2O5, and 47–94 K2O kg ha−1 y−1), cow manure at a rate of 600–3000 kg ha−1 y−1 was used. This chemical fertilizer regimen in rice plantations in northern Thailand was demonstrated by [17]. Synthetic fertilization was applied as urea (46–0–0) and 15–15–15. Farmers who grew their own livestock provided cow dung. Seeds were scattered across the entire plot to prepare the soil for planting. For crop residue management and the fallow period, farmers burned stubble more frequently and intensively after rice harvesting, leaving crop remnants in the fields until they were plowed before the start of the new crop season. Before planting, tillage was regularly and frequently performed using small machinery around twice a week. The age of land use started in 1974, making it 40 years old (at the sampling date).
Soil sampling: A survey of the farming sites was conducted between November 2013 and May 2014 to identify 11 traditional farmers working in conventional paddy soil. Individuals collected soil samples from four different soil depths (i.e., 0–5, 5–10, 10–15, and 20 –30 cm), totaling 11 farmer plots for the data. Three soil sample replications were taken from each farmer plot, totaling 132 data points (11 farmers × 4 depths × 3 replications), and each replication was accompanied by three pseudo-replicate samples from individual farmer plots that were randomly combined into a composite sample. The mean of each depth forming a number of data points is n = 33. The P fraction data were from identical samples but from two different soil depths (i.e., 0–5 and 10–15 cm), totaling 66 data points.
Analysis of physiochemical characteristics and carbon fractions (water-soluble carbon): Individual soil samples were mixed with deionized water by shaking for 30 min; the soil suspension was filtered through a membrane filter and placed in an Erlenmeyer flask for carbon analysis through Cr2O7 oxidation. Deionized water was added to the tube containing soil samples from the WSC studies for determining the hot WSC (HWSC). The tube was incubated in a hot water bath at 80°C for 16 h. The soil suspension was filtered through a filter membrane (0.45 m), and the tube was centrifuged for at 5000 rpm (1677 × g) 20 min [34]. The DOC is = WSC + HWSC.
POXC preparation: A total of 3 g of air-dried soil was passed through a sieve (0.5 mm) and mixed with 20 mL of 0.02 M KMnO4 [35]. The total organic content of the soil was analyzed using K2Cr2O7 combined with heat [36]. P was assessed using the method of Bray II [37]. The cation exchange capacity (CEC) was evaluated using 1 N NH4AOC [38], and was then determined using the micro-Kjeldahl method. The soil particles measuring 2 mm in size were analyzed by suspending them in Calgon solution and were then assessed using a Bouyoucos hydrometer [39]. Soil pH was determined by measuring the suspension of soil and water in a 1:1 ratio using a digital pH meter.
Soil P-fractions were determined sequentially. First, the reductant soluble-P (Re.So.P) was determined. The soil sample was weighed into a 50 mL centrifuge tube, mixed with 1 M NH4Cl, and shaken for 30 min. The sample was centrifuged, and the P-solutions fraction was obtained. The Al-P fraction was extracted using 0.5 M NH4F (pH 8.2); the samples were mixed with shaking for 1 h, centrifuged, and washed with saturated NaCl. Fe-P was extracted using 0.1 M NaOH, with shaking for 17 h, centrifuged, and washed. The Re.So.P was extracted using 0.30 M Na3C6H5O7 combined with 1 M NaHCO3 and 1.0 g Na2S2O4. It was heated, stirred, heated, centrifuged, and washed, and the last step was the extraction of Ca-P using 0.25 M H2SO4 with shaking for 1 h, followed by centrifugation and washing upon complete extraction. The pH of all supernatants was adjusted using 2 M HCl (or 2 M NaOH) until the color changed from yellow to colorless [40]. In the final step, the P content was analyzed using the molybdenum blue method; ascorbic acid was used as a reducing agent [37]. All solutions were analyzed using a spectrophotometer.
Data analysis: A one-way analysis of variance (ANOVA) test and a comparison of the mean with the least significant difference (LSD) (P 0.05) were used to analyze soil data in order to ascertain the impact of soil depth on different soil attributes. The relationship between soil characteristics and SOC concentration was determined using SPSS version 28.24 and Pearson correlations. Principle component analysis (PCA) was conducted using R Version 4.2.1 (http//www.R-project.org; accessed on 12–30 January 2023) to evaluate the relationship between physiological soil properties, inorganic phosphorus fractions, labile carbon fractions, and soil carbon content. The components were explained and compared by the percentage of variability between the soil depths. The correlation coefficient heat maps were created using Phytron version 3.8.

3. Results

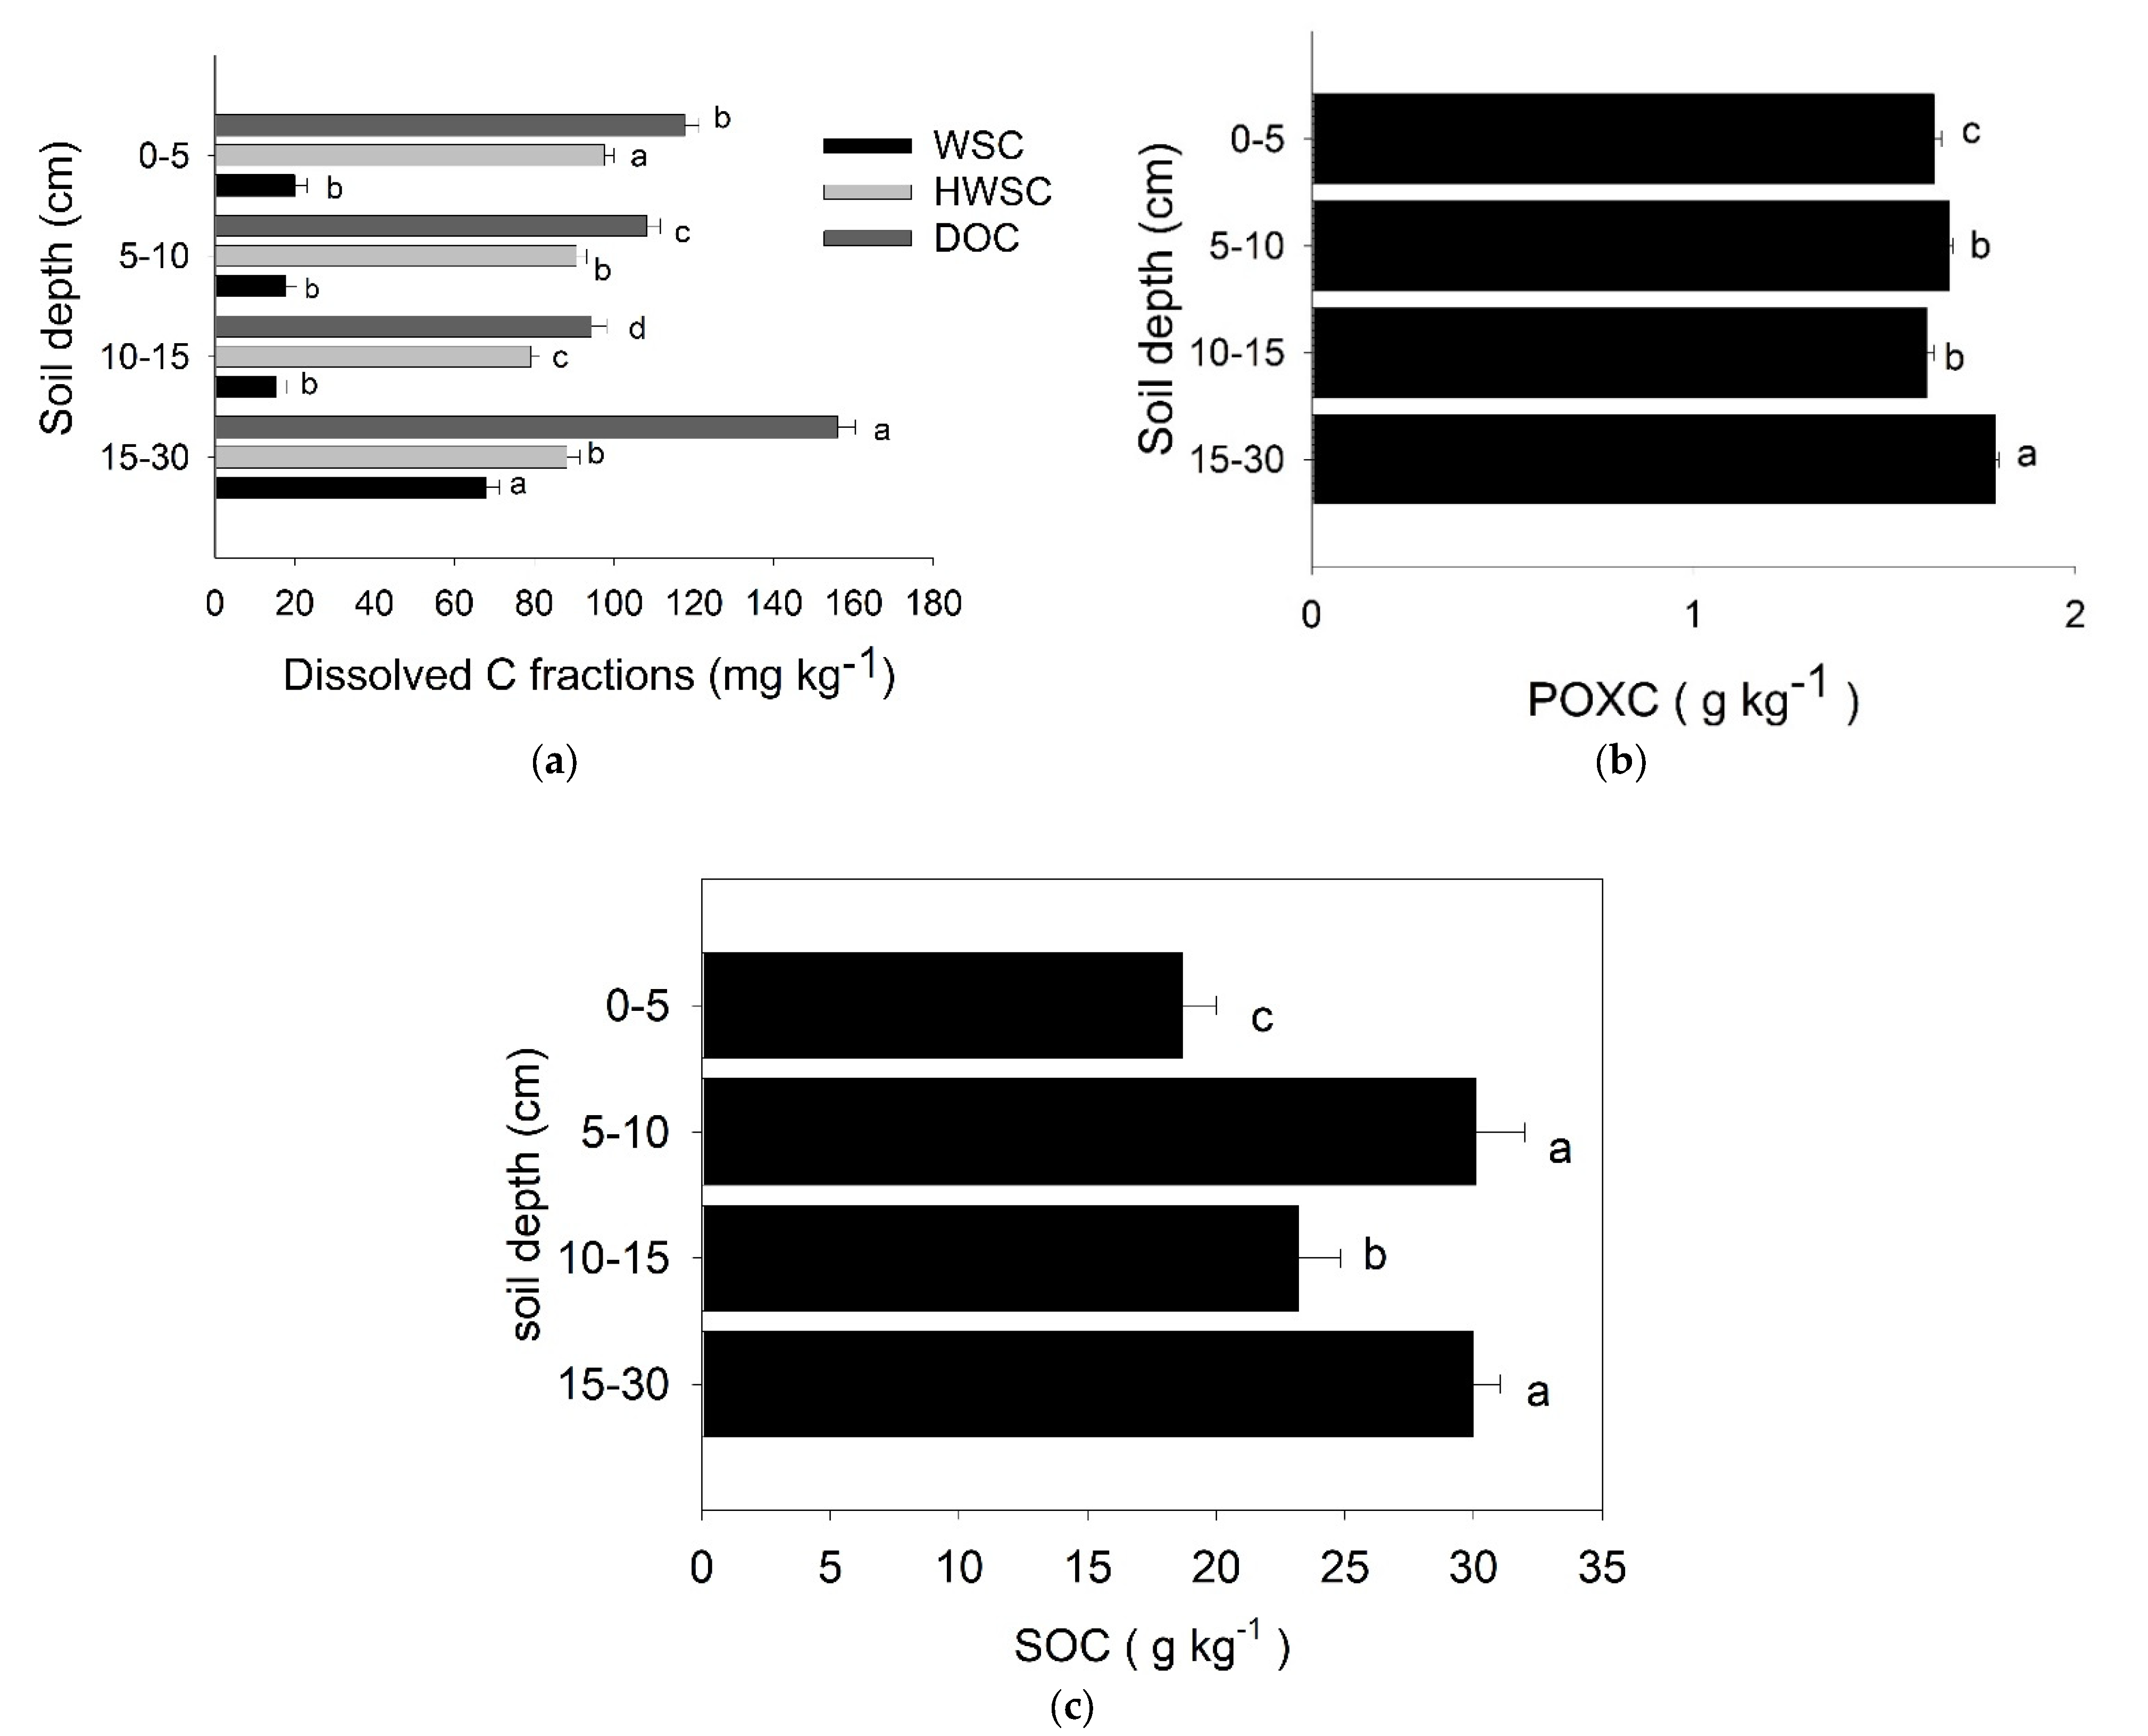
3.1. The Effects of Chemical Fertilization on the Labile Carbon Fractions and SOC of Long-Term Paddy Soil at Various Soil Depths

The amounts of WSC, HWSC, and DOC were 15.45–67.91 mg kg−1, 79.70–97.88 mg kg−1, and 95.15–155.21 mg kg−1 (p < 0.05), respectively (Figure 2a). The WSC at 15–30 cm was the highest, whereas it did not significantly change (p > 0.05) in the three distinct soil depths (0–5, 5–10, and 15–20 cm). HWSC was higher in the subsurface soils and was lower at the soil depth of 0–5 cm. DOC concentrations were higher in the subsurface soils. The amount of POXC was between 1607.5 and 1790 mg kg−1 and followed a pattern of distribution similar to that of WSC and DOC, peaking at the soil depth of 15–30 cm (Figure 2b). The SOC ranged between 18.8 and 32.2 g kg−1, with the significantly lowest SOC (p < 0.05) of 18.8 g kg−1 at the soil depth of 0–5 cm. The SOC increased with increasing soil depth (Figure 2c).

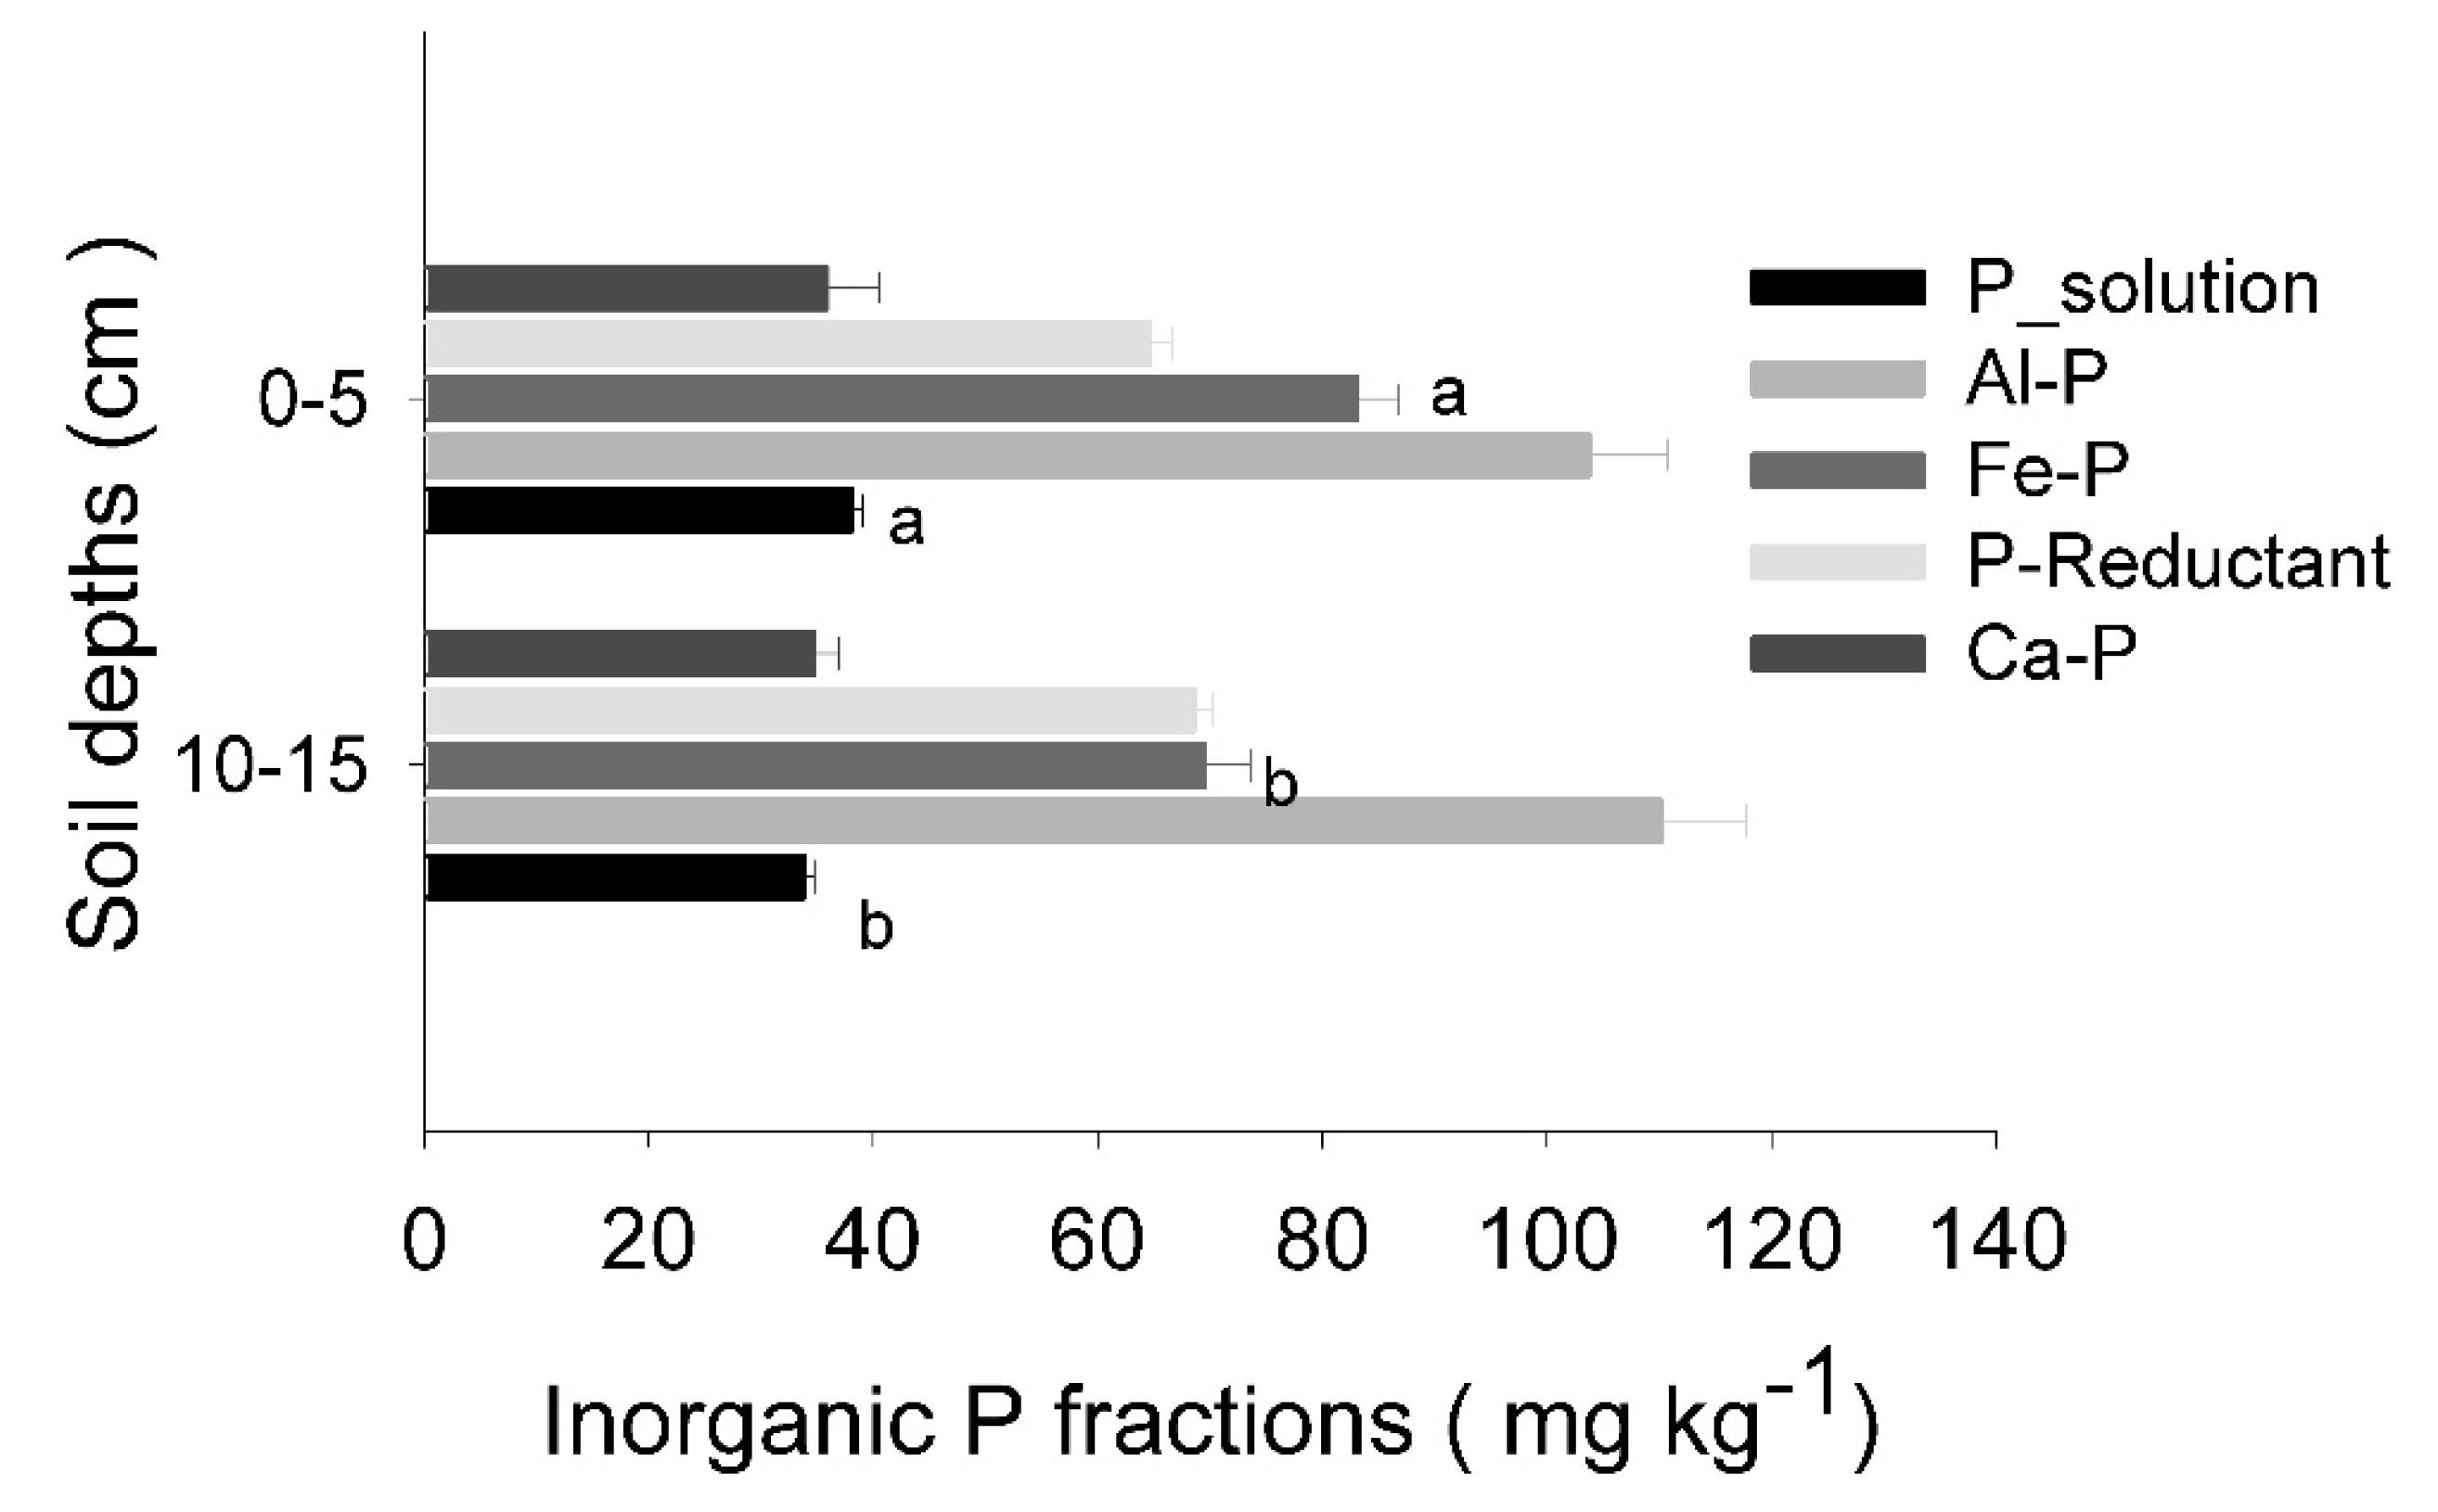
3.2. Phosphorus Fractions as an Indicator of P Adsorption in Long-Term Paddy Soil at Various Soil Depths

Solution-P and Fe-P were significantly higher in the 0–5 cm soil layer compared to that in the 10–15 cm soil layer (p < 0.05). The Al-P, Re-So-P, and Ca-P content did not differ between the two soil depths (Figure 3). Therefore, the increase in the Fe-P and P-solutions in paddy soil was achieved by adding cattle manure and long-term NPK.

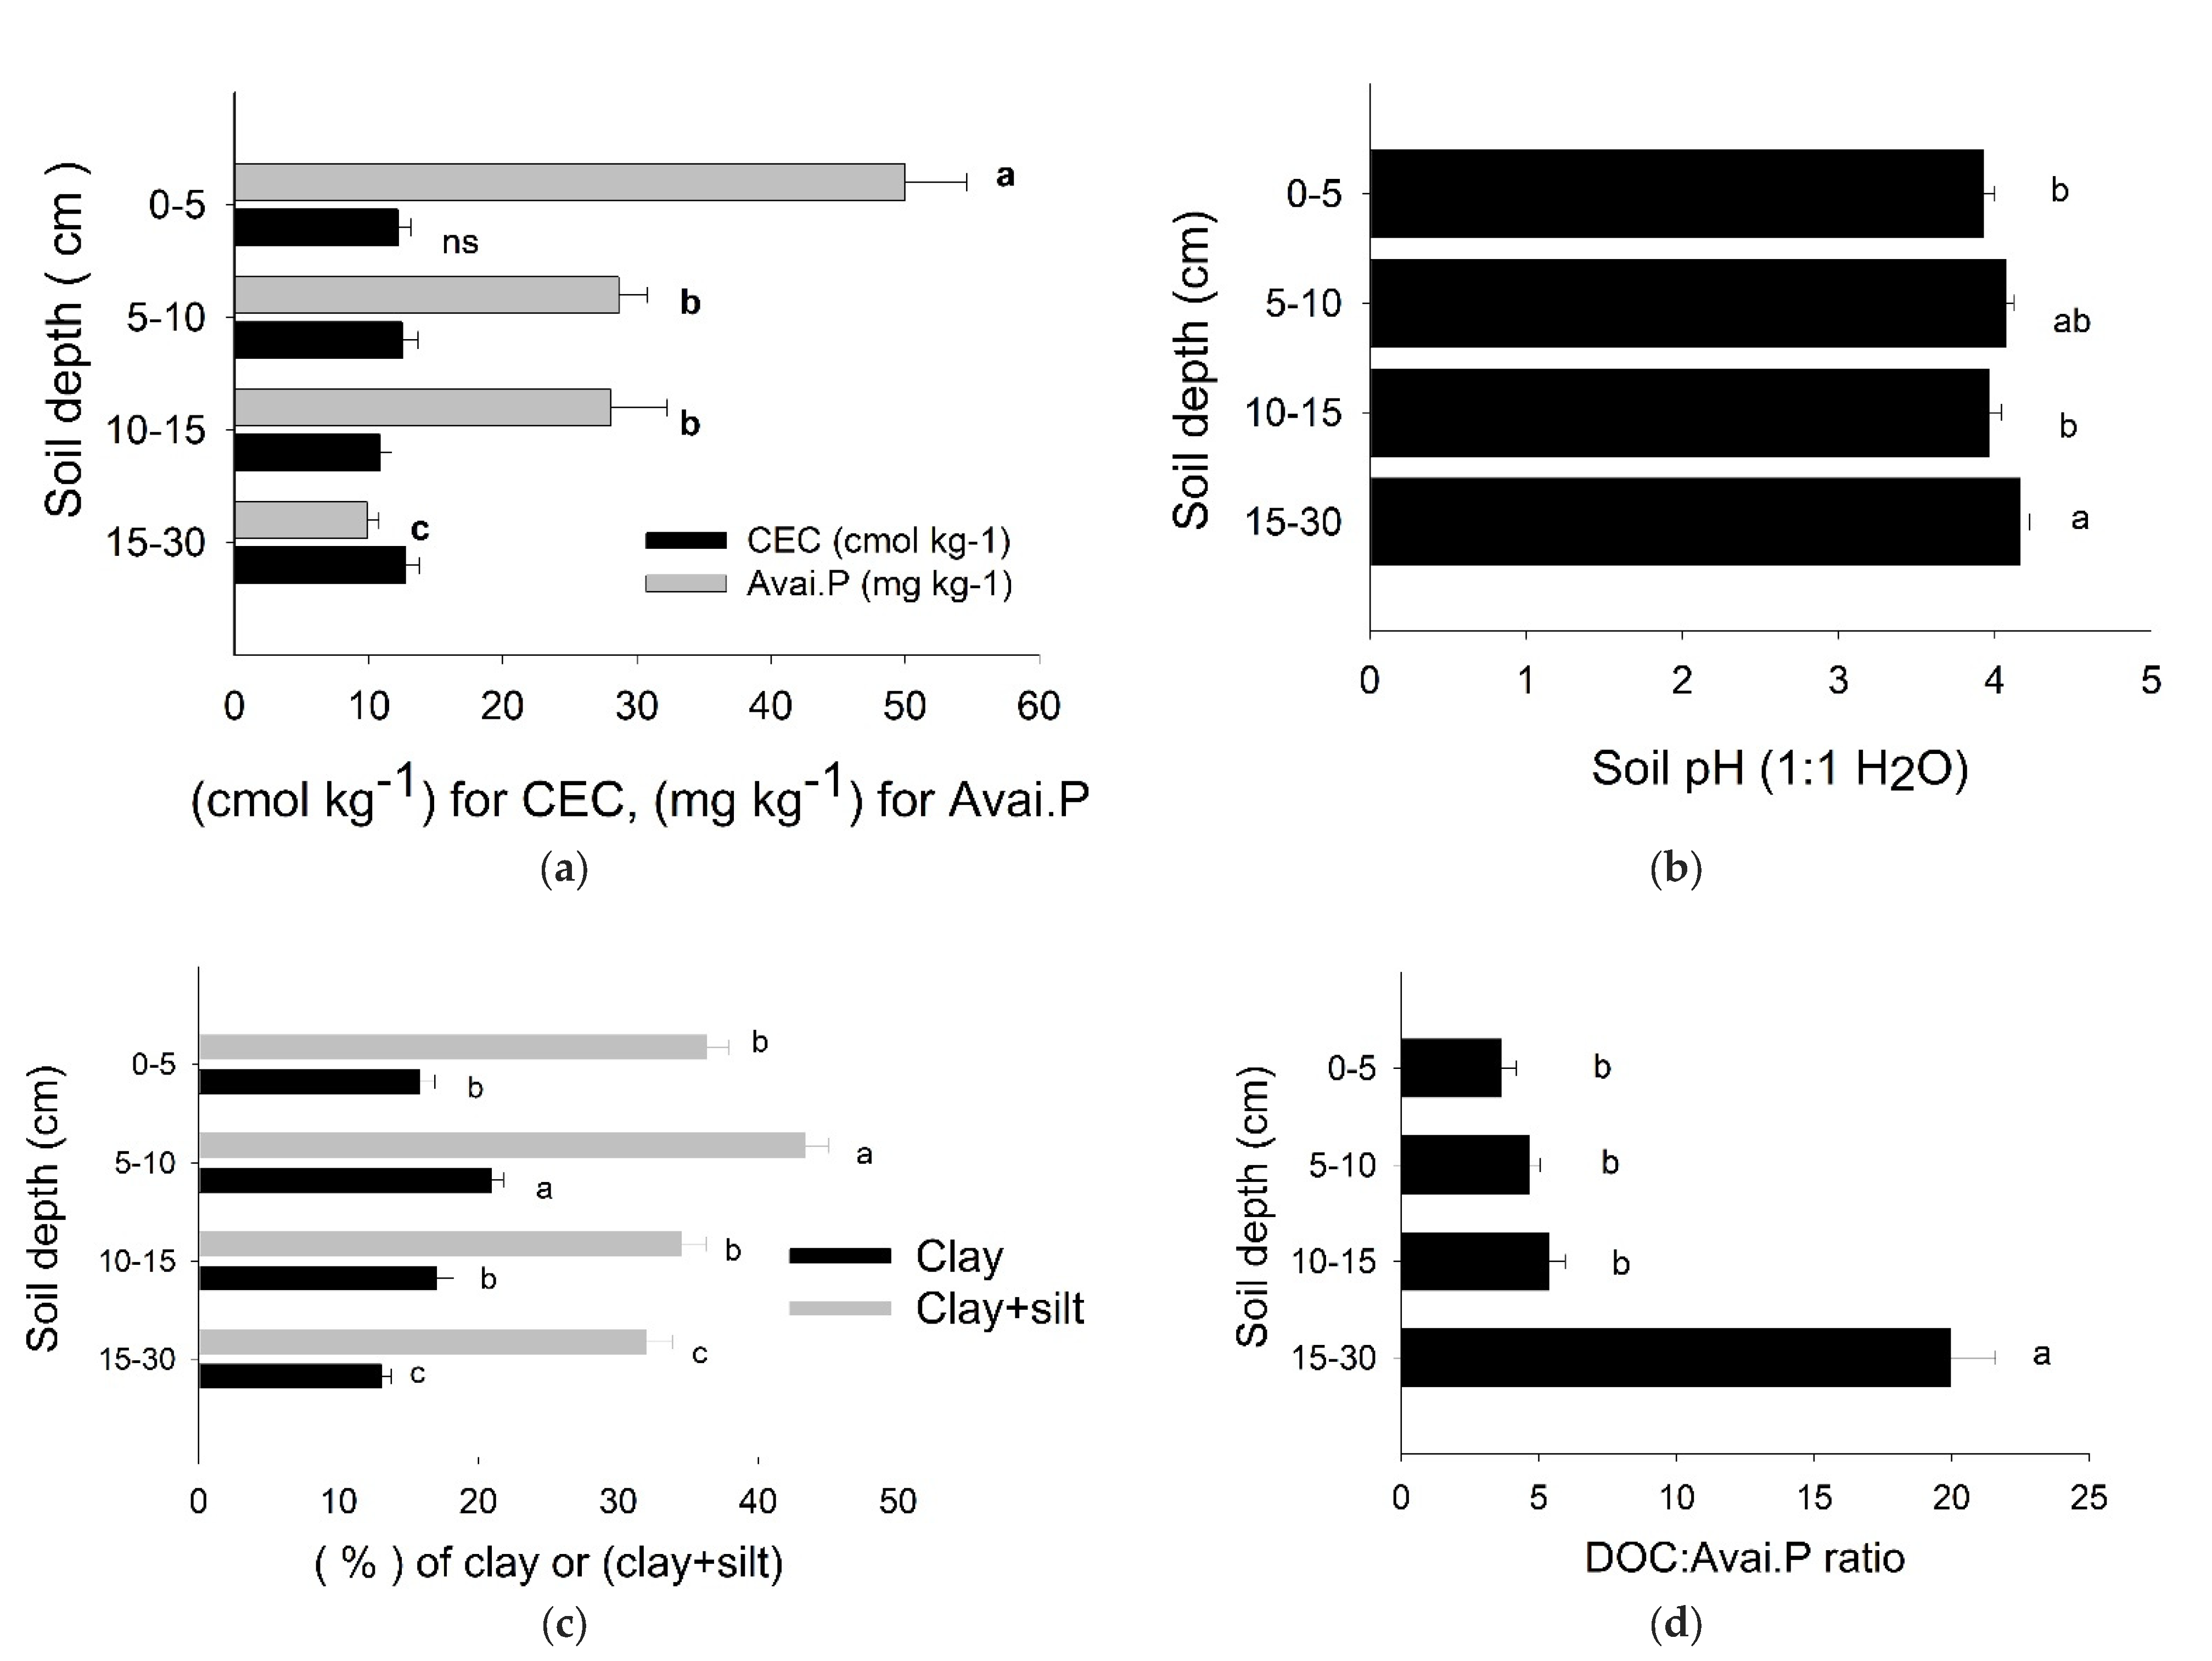
3.3. The Long-Term Use of Synthetic Fertilization Changes the Physiochemical Properties of Paddy Soil

The CEC ranged from 10.68 to 13.11 cmol kg−1; however, there was no statistically significant difference (p > 0.05) (Figure 4a). P availability increased as soil depth decreased (p < 0.05), peaking at the 0–5 cm soil depth (Figure 4a). At all soil depths, the acidity varied from 3.94 to 4.15 (p < 0.05), with the lowest soil pH was observed at the soil depth of 0–5 cm (Figure 4b). The clay percentage in the underlying soil ranged from 13.18–20.93% despite being greater than that in the statistically different surfaces (p < 0.05) (Figure 4c). Figure 4d shows the DOC: Avai. P ratio (3.93–19.57), which was significantly correlated with soil depth (p < 0.05) and matched the concentrations of DOC and P.

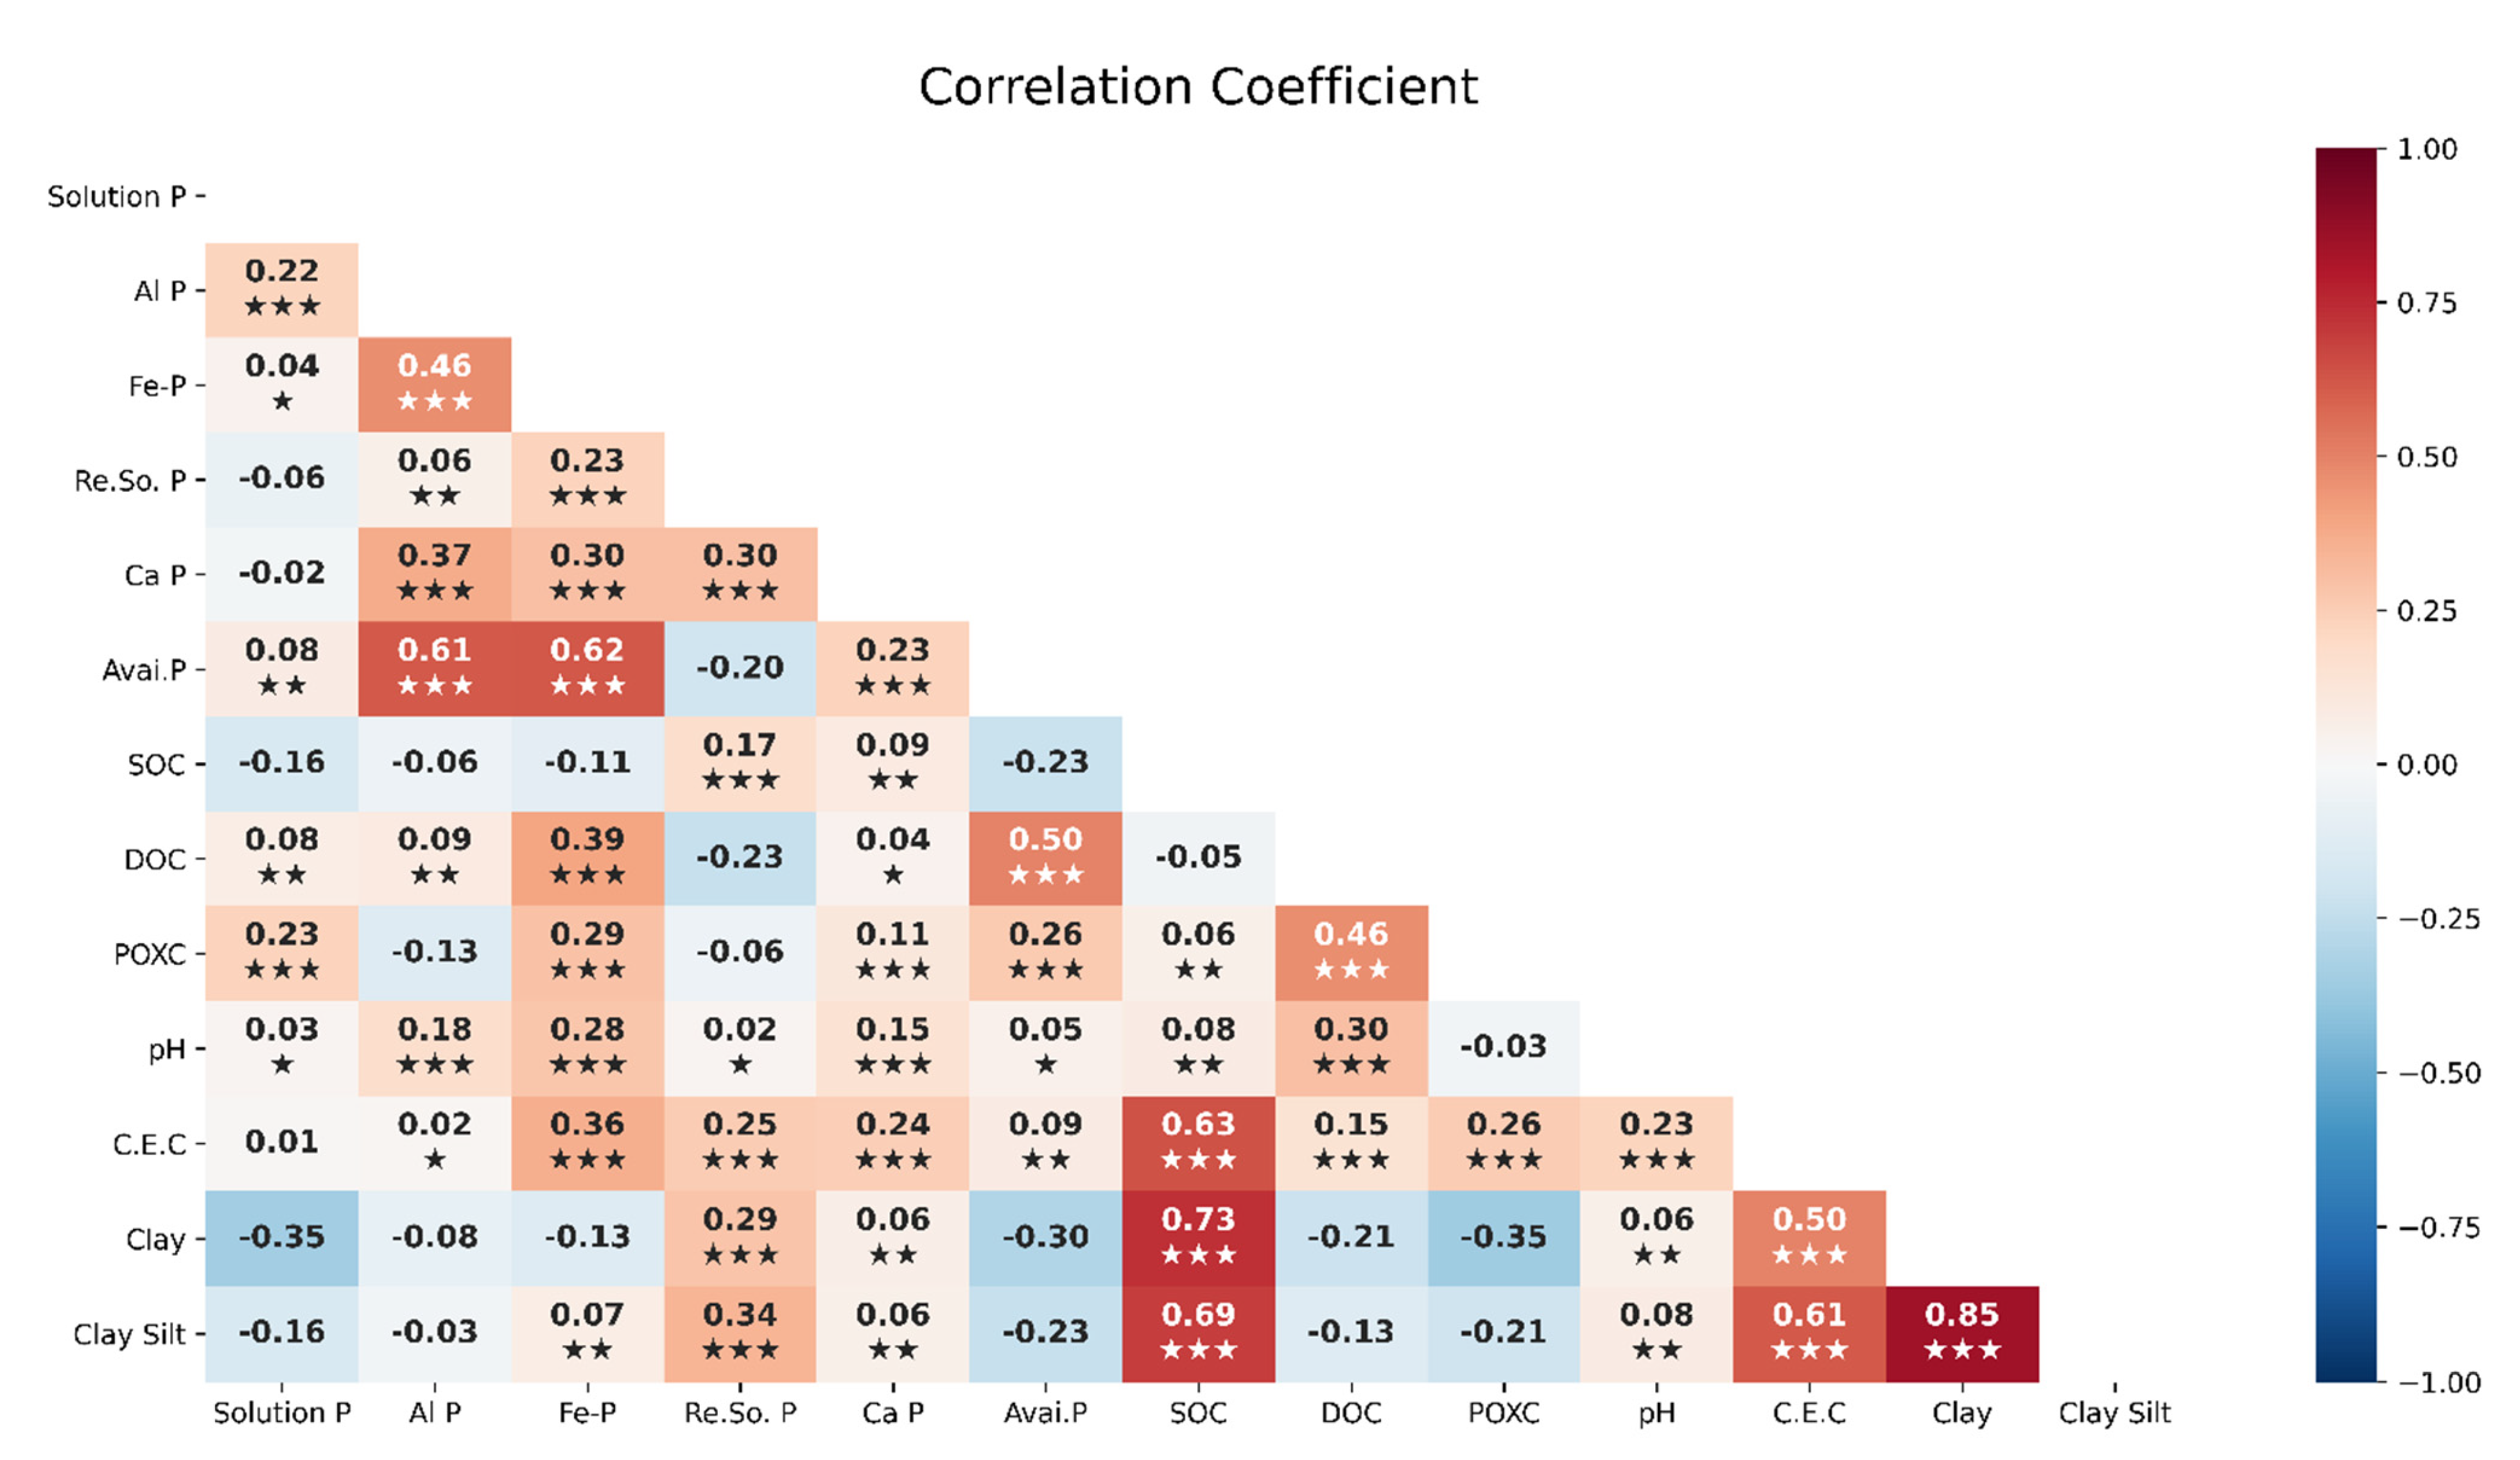
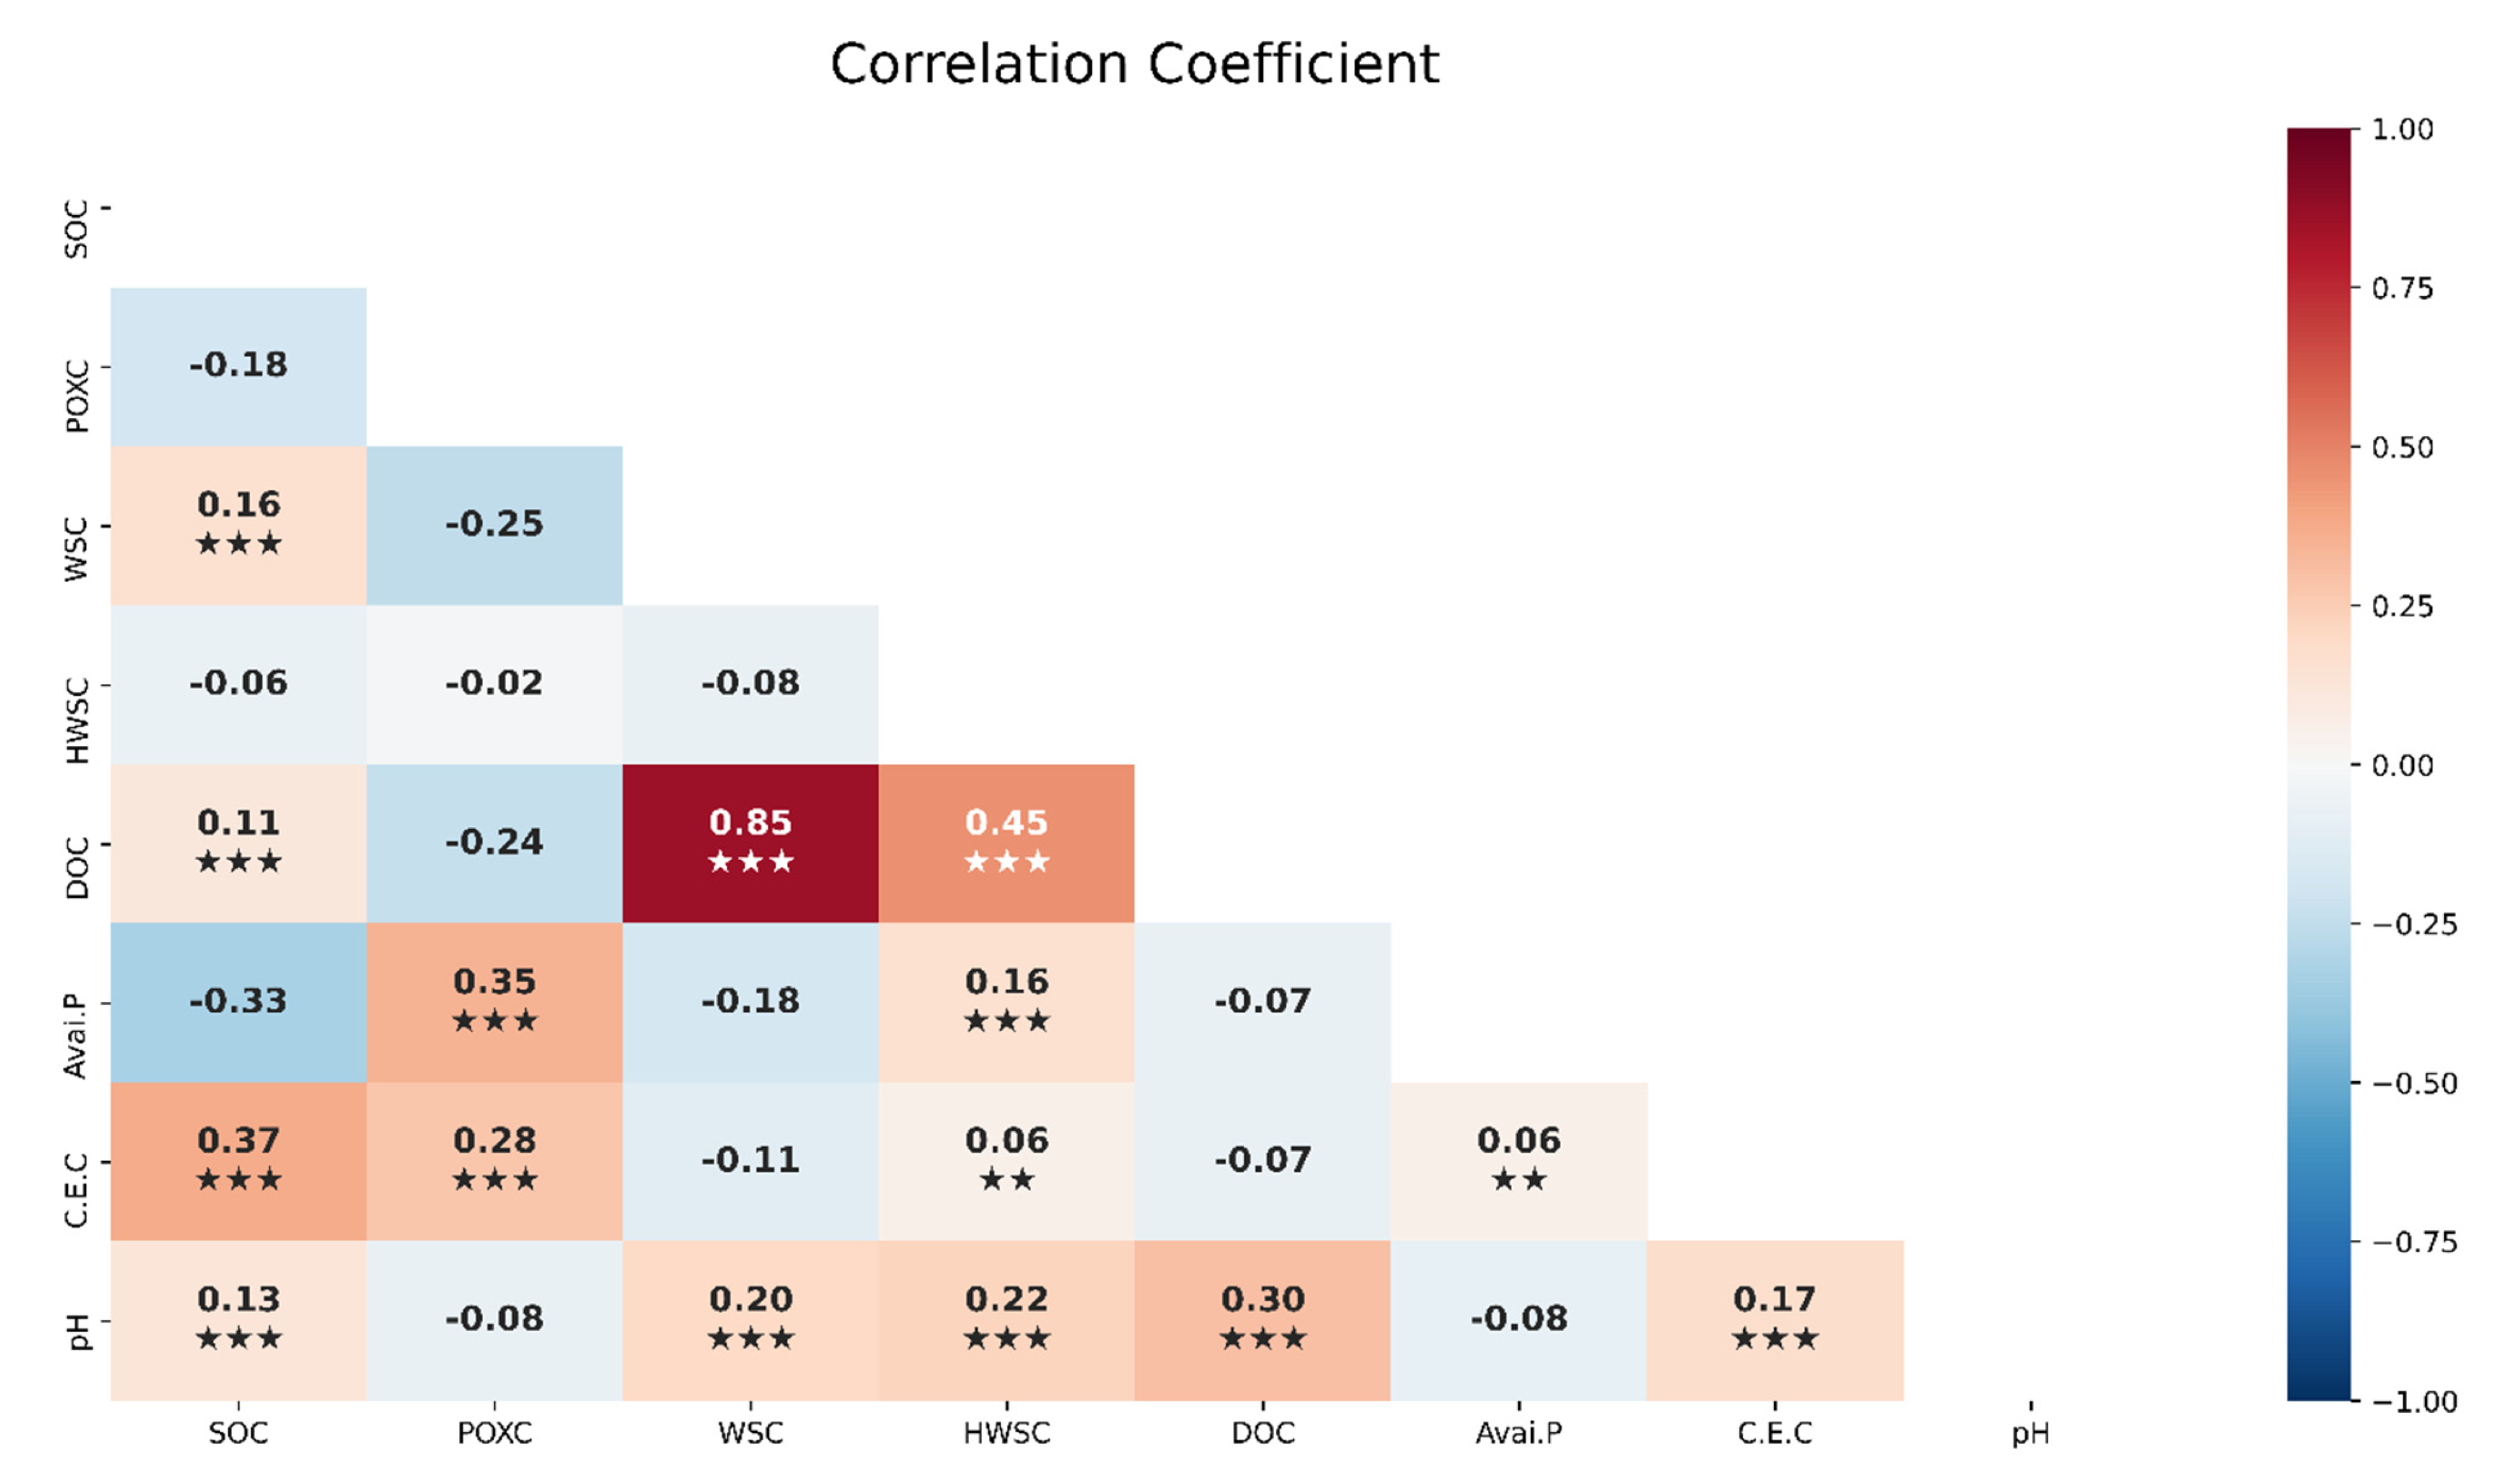
3.4. The Interrelation between Soil Organic Carbon, Inorganic Phosphorus Fractions, and Soil Physiochemical Properties

Two soil-depth datasets (such as 0–5 and 10–15 cm) were merged (Figure 5). The correlation coefficients among soil SOC, inorganic P fractions, and soil properties were verified. Fe-Pi and Al-Pi fractions and Avai. P had a strong positive correlation, but the Fe-Pi, Al-Pi, and Ca-Pi relationships were favorable. The relationship between DOC and POXC was very good, and there was a strong relationship between DOC and Fe-Pi. All three variables (DOC, Fe-Pi, and pH) showed positional correlations. The correlation of SOC with POXC, clay content, CEC, and clay + silt content were all highly significantly positive. An inverse relationship was observed between the clay content, P solution, and POXC (Figure 5).

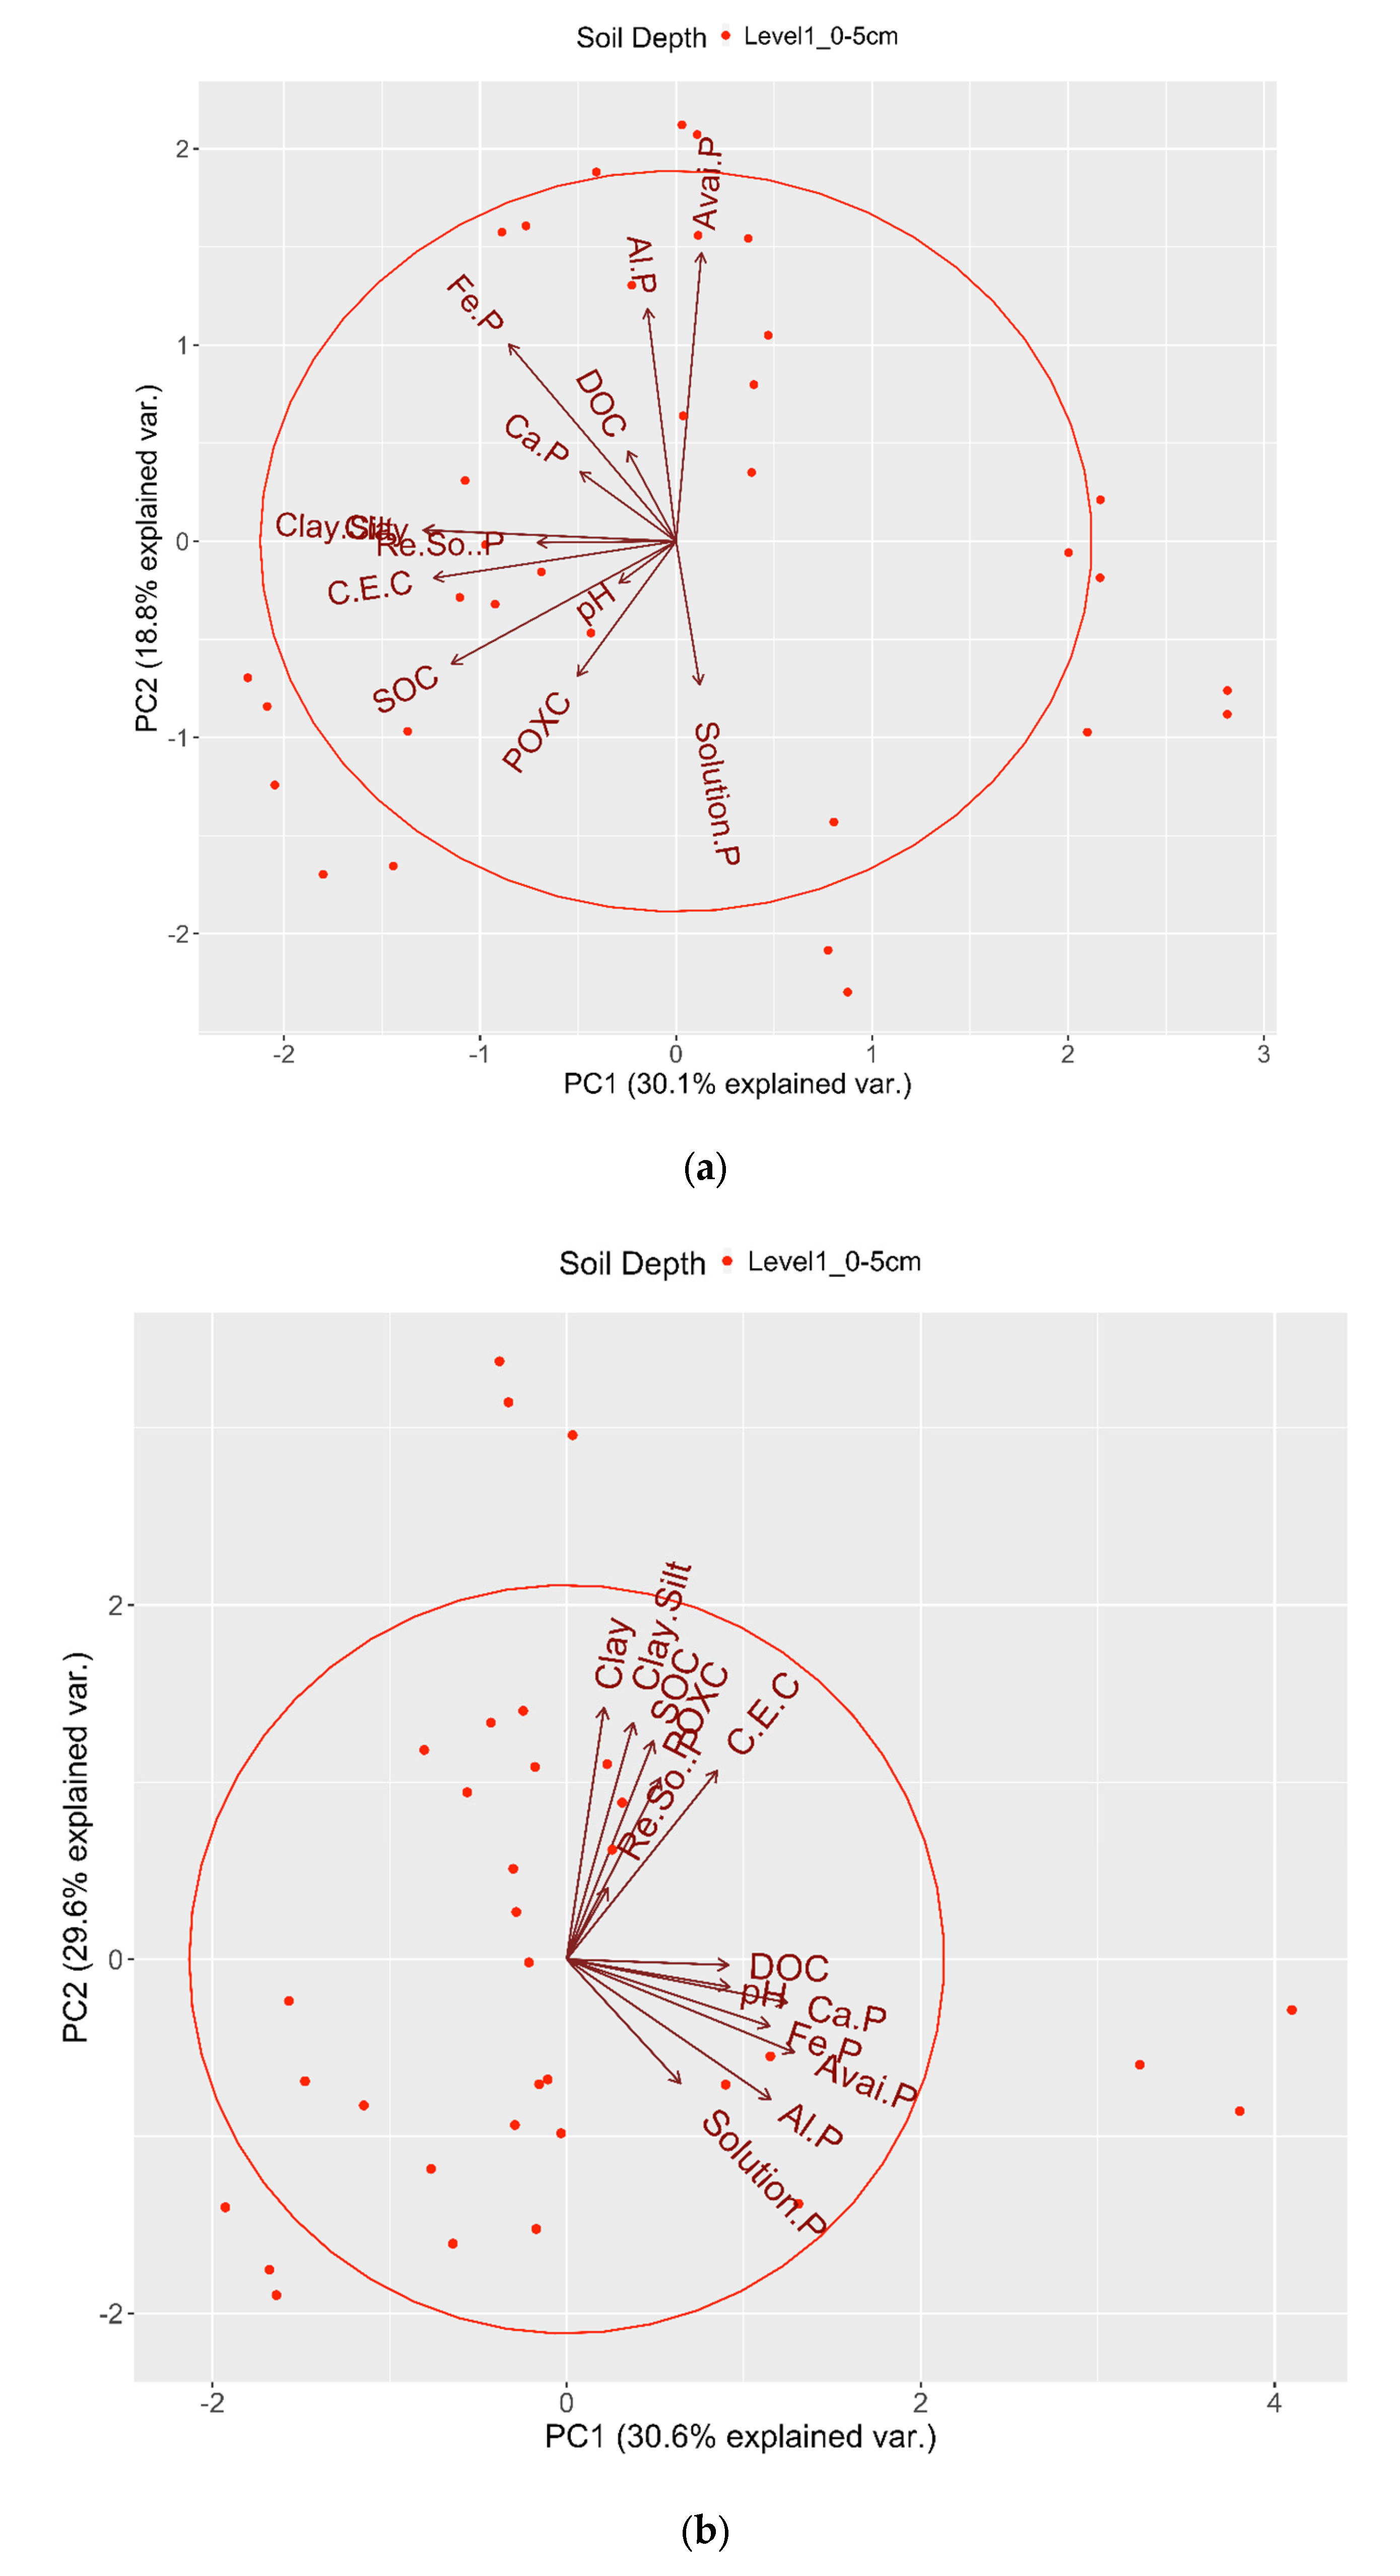
3.5. The Interactions Segregated by Soil Depth and Analyzed Using PCA
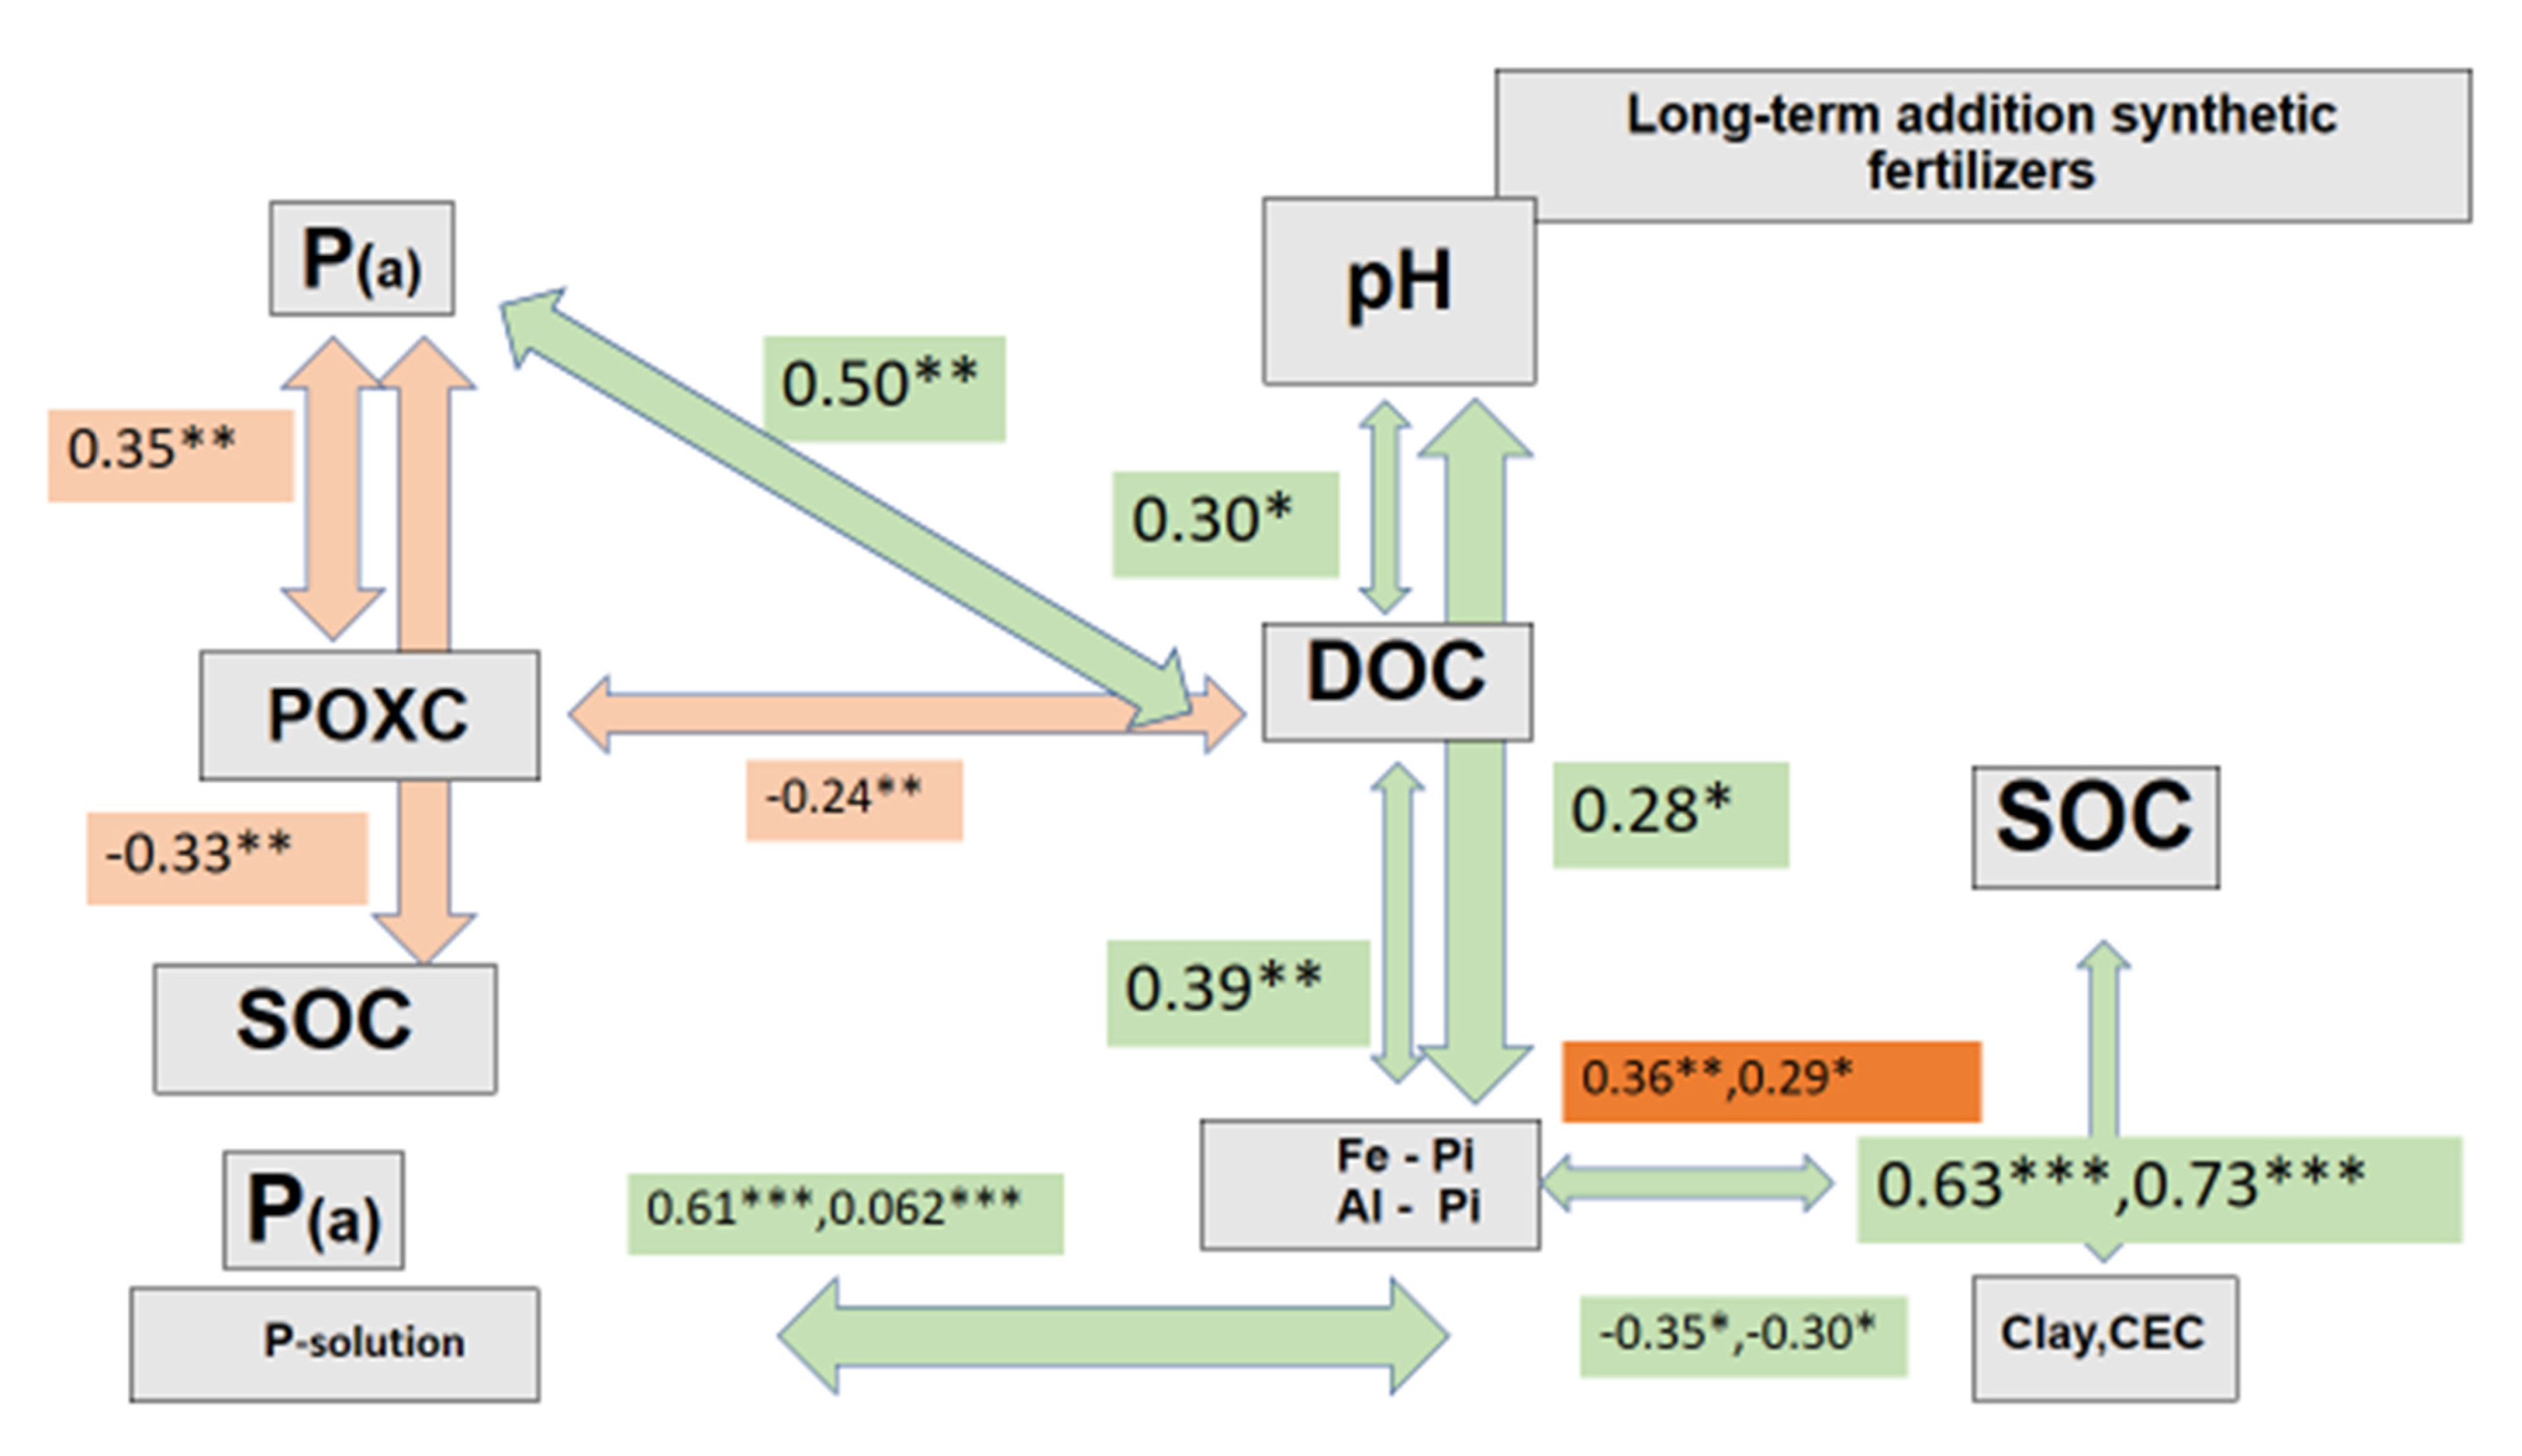
PCA was used to determine the relationships between labile carbon fractions, inorganic phosphorus fractions, and soil properties in conventional paddy soils. The 0–5 cm soil layer had a 60.5% variability explanation (Figure 6a), with the former explaining the relationships between clay, silt, CEC, POXC, and Re.So.P, which was positively correlated with SOC, and the latter explaining the relationships between Avai. P and P components (such as Fe-P, Al-P, Ca-P, and solution-P) and DOC, which was negatively correlated with SOC; in particular, pH was positively correlated with DOC but negatively correlated with SOC (Figure 6a). However, at a soil depth of 10–15 cm, 48.9% of the two groups could be explained (Figure 6b). DOC, Fe-Pi, Al-Pi, P-solution, and available P had a negative relationship with SOC, Re.So.P, clay, and silt, while CEC had a favorable relationship with SOC. The results revealed that pH was positively correlated with Ca-Pi in both 0–5 cm and 10–15 cm layers, while SOC was positively correlated with pH in the 10–15 cm layer (Figure 6b). The soil depths within the topsoil layer need to be separated because of variations in soil characteristics, especially in terms of pH (Figure 6a,b). Consistent with the PCA and Pearson correlation analyses, Avai. P had positive relationships with POXC but negative relationships with SOC and WSC. These findings suggest that changes in SOC are related to the interaction between DOC and inorganic phosphate fractions (for example, Avai. P) in paddy (Figure 7 and Figure 8). Moreover, the findings indicated that changes in SOC could result from the relationship between DOC and inorganic phosphate fractions (such as Fe-P) in paddies, and that an increase in DOC in soil could be the result of changes in the P fraction and soil pH. The soil depth interval is the fundamental factor affecting the parameters that would be affected by these interactions.

4. Discussion

4.1. Intensive Synthetic Chemical Fertilization Increases Soil Acidity in Paddy Soil

This study showed that the soil acidity at all soil depths between 0–30 cm, especially in the 0–5 cm layer, was significantly lower than that at greater soil depths. The residual effects of long-term chemical fertilization observed in this study indicate that increased soil acidity is a result of N fertilization (in the form of urea) for over 40 years. Comparing synthetic soil data at the national scale for paddy soils in Thailand with that of tropical soils and highly weathered acidic soils with a low buffering capacity [41] showed that the acidification of Thai paddy soil increased as a result of the application of nitrogen fertilizer [5]. In addition, the accelerated decrease in soil pH could have resulted from massive anthropogenic influences; intensive agricultural practices with N addition strongly accelerate soil acidification [41,42]. A comparison with the control soil and that mixed with inorganic and pig manure fertilizers [43] showed that inorganic fertilizers considerably decreased soil pH. Soil pH decreased under long-term fertilization (i.e., inorganic nitrogen, phosphorus, and potassium fertilization) and NPKM (combined inorganic NPK fertilizer and manure application) compared to soils that were not treated with fertilizer [44]. The addition of chemical N fertilizer accelerated the pH decline in the soil, particularly at the surface (0–5 cm) [45]. Long-term N fertilization increased soil acidity at the depths of 0–7.5 cm and 0–30 cm, consistent with previous findings [45]. Ramirez et al. [12]. analyzed three soil types and showed that none were consistent with the pH of the deceased soil. However, the decrease in respiration rates, rather than the decrease in soil pH, is caused by the addition of N [12]. There was a decrease in microbial turnover rates; microbial growth and breakdown rates contribute to SOC accumulation in acidic soils [46]. A significant reduction in Ca2+ and Mg2+ could be associated with a decrease in soil pH, and this could have an indirect effect on other soil parameters [45]. Using nitrogen fertilizer to boost crop output removes basic cations from the soil [45]. Bacterial communities are predominantly affected by soil pH; however, soil organic carbon did not significantly influence bacterial communities. Soil pH was significantly and positively correlated with bacterial organizational unit abundance and soil bacterial diversity; these were not correlated with soil nutrients [47]. pH is the primary factor regulating DOC generation, accounting for 60% of total DOC release, irrespective of reductive dissolution [48,49]. Prolonged N addition with low pH contributes to reduced microbial activity [47]. It increases soil acidity, suppresses bacterial activity [50], and, consequently, may enhance P adsorption [51] and DOC accumulation. However, correlation and PCA analyses in our study showed a strong relationship between pH and the amount of DOC. This indicates that an increase in pH resulted in a greater concentration of DOC, particularly in the surface soil. In addition, it influences the transformation of the added P into Fe-P.

4.2. The Long-Term Application of a Combination of Synthetic Fertilizer and Cattle Manure Increased DOC in Paddy Soil

4.2.1. Phosphorus

Avai. P had a negative correlation with SOC and WSC according to the Pearson correlation and PCA analysis. However, Avai. P had a positive correlation with POXC. Changes in SOC were associated with the interaction between DOC and inorganic phosphate fractions (such as Avai. P) in this study.
Due to the Green Revolution, Thailand’s paddy soil has typically been more fertile during the past 50 years. The most notable shift over this time has been a more than 10-fold increase in the accessible P content [5]. High Avai. P addition reduces SOC sequestration [22], which is consistent with the results of the present study. Phosphorus fertilization of the labile carbon fractions alters the complications of SOC; P input enhances the structural simplicity of DOM), makes it more biodegradable, and increases the number of bacteria and fungi that can sequester carbon in rice fields [21]. The results from this study are in accordance with the results of studies by Shen et al. [52]; the availability of P from synthetic fertilizer can be crucial to altering the pattern of physical and chemical stabilization of SOC, highlighting the roles of P management in the C cycle. Phosphate addition to soils can cause SOC instability and limit sorption sites [22]. By desorbing organic carbon, the rising phosphate content of synthetic fertilizers may increase the DOC concentration in the soil solution [53,54]. Following P fertilization, an increase in DOC promotes soil microbial activity [55,56]. Therefore, the DOC has more opportunities to be respired. The present study demonstrated that Avai. P showed a significant positive relation with DOC. Using PCA, we showed that within the same group, DOC, Fe-P, and P solutions had positive relationships. In addition, the DOM concentrations in cattle dung are extremely high [57]. P addition increased soil DOC concentration owing to its ability to compete for sorption sites on mineral surfaces [55]. Phosphate fertilization can increase the DOC concentration in the soil solution [53,54], stimulating the activity of soil microorganisms [55,56]. CEC showed a positive correlation with inorganic P fractions, suggesting fewer sites bound with P or P adsorption in the 0–5 cm soil layer, and consequences such as the increase in solution-P and Fe-P should be considered for crop nutrition. The loss/removal of SOC decreased the adsorption capacity for P in topsoils [58], but phosphate addition increased microbial activity and stimulated soil respiration [59]. Consistent with our previous discussion regarding high Avai. P (by Bray-2), annual fertilizer additions of P were consistently higher than crop P removal. With long-term production, soil total P and Avai. P (by Bray-P1) increased, but P sorption capacity declined [60].
The phosphate adsorbed to mineral surfaces could subsequently contribute to the sorbed organic carbon substance; the dissolved organic carbon would be released, as indicated by the low SOC in the 0–5 cm layer and the subsequent high P–solution fraction and Avai. P. Consistently, it was demonstrated that this layer’s DOC:Avai. P ratio was lower than that of a deeper soil layer. The DOC:Avai. P ratios of the soil were the key factors impacting the growth of the total bacterial and pho D-harboring bacterial communities (i.e., bacteria regulate P cycling and are sensitive to fertilizer inputs [61]. Moreover, we suggested the DOC:Avai. P ratio could be associated with the P adsorption capacity and could serve as a compromise for the C and P dynamic indicators. The DOC/Avai. P ratio reflects the desorption and adsorption of DOC and Avai. P and, consequently, the deceased SOC. Labile P and Avai. P in paddy soil are the primary drivers of soil P transformation [44].
According to Zhang et al. [62], DOC is the main factor regulating fungal communities, whereas POXC is the main factor regulating bacterial communities. The increase in POXC could be attributed to the addition of synthetic fertilizer, especially phosphate fertilization, which might accelerate the formation of labile C and contribute to higher inputs of microbial residue-derived DOC. Therefore, the decreasing trend in SOC was associated with a high amount of Avai. P; this could be attributed to the alteration in the levels of structurally labile organic carbon such as DOC.

4.2.2. Nitrogen

Another explanation for the amount of DOC was the long-term use of synthetic fertilizers in the paddy soil. Increasing N addition (deposition) boosts soil DOC concentrations or storage; however, in some studies, the DOC concentrations or storage declined or barely changed [19]. Nitrogen pollution deposition in the atmosphere and soil acidification recovery is associated with the potential causes of increased DOC in upland waterways [63]. However, synthetic NPK fertilization only slightly increases the amount of DOC in the soil [18]. According to Sinsabaugh et al. [20] and Tain et al. [18], adding N to forests decreases the soil’s oxidative enzyme activity, while increasing the dissolved organic carbon concentration. According to Yue et al. [64], the type of N has an impact on the concentration of DOC; NO3 increases it, while NH4 addition decreases it. DOC is accumulated deeper (15–30 cm) than in the surface soil. Mobile exudates of roots [65], microorganisms [66], and their decay products are examples of the first type. Organic compounds leach from the top soil strata into deeper soil [67,68]. Our results showed an increased DOC accumulation in the deeper layers of soil.

4.3. The Use of Chemical Fertilizer with Cattle Manure Alters the Composition of DOC

Synthetic N, P, and K decrease the levels of amino acids and reduced sugars and increase the soluble phenol content. WSC comprises these organic materials; they are lower in the upper soil layer because they are employed by soil microbes as substrates. These easily decomposable components are used as a measure for SOC mineralization [18]. The stability of SOC in cropland soils under long-term fertilization showed that NPK+ manure significantly improved SOC storage and increased the total SOC in the paddy soil. The highest proportion of labile pool was associated with unfertilized paddy soil, while the highest recalcitrance index was highest under NPK + manure [69]. The combined application of organic manure and inorganic fertilizer increases soil fertility by enhancing labile carbon fractions and enzymatic activity [70], and the accumulation of microbial residues in soil increases [71]. Meanwhile, the organic paddy soils (i.e., those that received only organic fertilization for 10 years) were less labile and had higher average DOC and SOC than the fields investigated in this study. Additional organic fertilizers increased the adsorption capacity of the soil mineral surfaces, resulting in the Fe-P fraction responding to the increased adsorption capacity and showing, along with the DOC and P, that they were lower in organic paddy soil [72].
However, owing to the addition of N, the WSC and DOC fractions in the deeper soil layers may include condensed aromatic dissolved carbon. During a 22-year investigation of the wheat-maize cropping system in China, researchers discovered that clay, pH, and the soil C:N ratio contributed to the transformation of SOC into a more complex structure [73]. A survey of rice fields revealed that fungal residues have a more notable impact on the physical components of SOC than chemical fertilizers. In addition, the bacterial diversity and the makeup of the fungal community mediated the chemical composition of the SOC. These results imply that the microbial community, biomass, and soil characteristics are crucial for the buildup of mineral-associated organic carbon (MAOC) [74]. The addition of synthetic nitrogen alters the molecular size and aromaticity of the DOM [14]. Synthetic fertilizers alter the molecular structure of DOC. Nuclear magnetic resonance analysis was utilized by [18] to demonstrate that the addition of nitrogen increased the amount of carbohydrates and aromatics in DOM while decreasing the amount of aliphatic compounds [18]; the alteration of DOC composition increased the molecular weight of DOC [14], the content of aromatic compounds in DOC molecules, and the accumulation of DOM.

4.4. Long-Term Chemical Fertilizer Applications Affect the Transformation of Inorganic Phosphorus and Are Related to DOC Desorption in Paddy Soil

The levels of P-solution and Fe-P were higher in the top 5 cm of the soil, leading to higher availability of phosphorus and DOC (Figure 4). The soil pH, CEC, Avai. P, and labile organic C fractions (such as DOC and POXC) were significantly related to the Fe-P level; this could explain the 60.5% of the total variance observed in the 0–5 cm soil layer. The 0–5 cm soil layer responded to pH and inorganic phosphorus more strongly than the 10–15 cm layer. Therefore, an acidic soil pH is a crucial indicator for controlling P transformation.
Long-term fertilization increased Fe-P and Al-P in NPK and NPKM (NPK and manure), leading to a decrease in occlusion-P and a change in P solid-phase partitioning. Manure application may have caused a change in P solid-phase partitioning [27]. N fertilization increased Fe-P in paddy soils, and the acidity of the soil was influenced by the chemical fertilizer residue. In contrast, AlPO4 was found in the presence of additional N without P fertilization [75]. Organic amendments can increase P sorption in the Fe-P fraction, with a higher Fe-P formation when chemical fertilizers and animal dung are combined [76]. The yearly average rate of increase in Fe-P was 10.4 mg kg−1 y−1 during the initial period of long-term (18 years) application of mixed chemical fertilizer (NPK) and animal manure. It decreased to 4.1 mg kg−1 in the second period of the subsequent 10 years [27]. Elrys et al. [77] reported that P adsorption capacity was higher in soils treated with NPK and animal manure, but lower in soils without fertilization. High inorganic P addition can enhance the Fe-P (NaOH-Pi) and NaOH-Po fractions in organic fertilization [78]. CEC and clay content have positive relationships with Fe-P and Al-P (Figure 5, Figure 6 and Figure 7), whereas the adsorbed phosphate is linked to Fe(III) (hydr)oxide coatings [79]. Moreover, our study showed that in the 0–5 cm soil layer, SOC negatively affects phosphate adsorption under acidic soil pH conditions [80]. The decrease in SOC leads to a larger reduction in binding sites than amorphous metal oxides; this could be explained by the increased sorption of P as soil pH decreases [27]. PCA analysis indicated that the availability of P and the pH influence P transformation; in our study, we found significant positive relationships between the availability of P and the pH and the Fe-P fraction. Therefore, the residual P in the soil following crop harvest could be explained by the increased accumulation of P in the less accessible areas of the soil following the addition of phosphate fertilizer. Eventually, this phosphorus migrates to more labile components and becomes available to crops [81].
We suggested that this soil was rich in Fe-P and possibly in Al-P after four decades of heavy fertilization, which may have lowered its P sorption capability. Based on this finding, fertilizer usage recommendations for the sustainability of agricultural intensification and C-dynamic impacts in tropical paddy soil should be developed. Chemical P fertilization should be considered for tropical soils with limited P adsorption capacity.

5. The Influence of Anaerobic Conditions on DOC and Changes in SOC

Anaerobic soil bacteria use Fe oxides as electron acceptors under anoxic conditions [82,83] to alter the mineral surfaces of paddy soils. The reductive dissolution of Fe oxide can mobilize colloidal C and nanoparticulate OM into the liquid phase [84,85]. Anaerobic microbes control the release of OM from MAOC [64]; decreasing proton concentrations have a greater impact [86]. DOC is derived under saturated conditions [87] because soil microbes transfer electrons to extracellular electron acceptors [88]. This indicates that in the submerged/saturated soil, DOC is released with Fe (II), causing mineralization of C3-derived C and leading to a decline in the previously protected C [87].
The coupling of DOC with Fe fluxes suggests that increased DOC export could be caused by increased Fe reduction activities, possibly due to the increased wetness of the riparian wetlands or a shift from sulfate to Fe reduction [89]. The persistence of Fe oxides under anoxic conditions suggests that DOC co-precipitated with Fe oxide and was released into the solution via the oxide’s reductive breakdown [90]. Anaerobic microbes are responsible for the Fe mobilization of SOC [82].
The relationship between the DOC and Pi fractions and P availability in intensive paddy soils was the main focus of this study. The enhanced P availability in the paddy soil was caused not only by direct P supply from organic manure absorption, but also by a reduction in P sorption in the solid phase of the paddy soil by DOC (such as that formed from organic fertilizer) [91]. DOC may stimulate redox reactions [92]. During Fe reduction, intermittent labile carbon inputs to the soil increase soil pH and soluble Fe and P concentrations [28]. Although DOC was released during the reduction of Fe (III), this may have aided in the desorption of P into the P solution (at the 0–5 cm layer), which would have improved the availability of P as an energy source and electron donor [93].
In addition, the inorganic P fractions involved in the Fe mobilization of OC depend on anaerobic microbes [82]. Positive correlations between DOC and the inorganic P fraction were observed, suggesting that some of the P liberated during Fe-P reduction was re-adsorbed to freshly precipitated Fe(OH)2 [28]. Some SOC could be lost owing to this process, particularly at the surface (0−5 cm). DOC flocculation with oxidizing Fe can lead to a decrease in pH and Fe concentrations during the transition from anoxic wetland pore water to toxic stream water [89]. The DOC released in the saturated or wet soil as a result of Fe reduction is bioavailable to soil microbes and is respired as CO2 and CH4. This would result in a noticeable fall in SOC [87].
Increased DOC and inorganic P fractions resulted from the application of synthetic fertilizers in paddy soils. Both were positively correlated with soil acidity and were consistent with P availability, particularly at the soil surface. These are important for organic matter degradation and plant nutrient cycling in paddy soils. Their interactions are crucial for understanding C dynamics in paddy soils. These interactions provide valuable insights into C, P, and Fe cycling under periodically fluctuating anoxic conditions. These findings would improve our understanding of fertilization techniques and potentially influence policy-making and decision-making processes, taking into consideration the impacts on crop yields and the environment. However, this study lacks information on the characteristics of P adsorption, organic P fraction, and the correlation between DOC and Avai. P with regard to the mobilization of C during microbial reactions at an appropriate soil depth. Therefore, further investigation is warranted. Moreover, this study examined the effects of prolonged chemical fertilization (i.e., 40 years old), evaluated those effects, and made comparisons within soil depth results. The farmers in Ban Donjiang still practice it today, despite it having been passed down for ten years since the soil sampling date. For the purposes of comparing legacy soil properties to present data and tracking the evolution of soil properties, it would be more wide-ranging and meaningful to take interval soil depth into account.

6. Conclusions

Synthetic NPK and cattle manure are added to the paddy soil to increase Fe-P, DOC, and other soil properties. The concentrations of DOC and POXC increased with increasing soil depth, whereas the Fe-P concentrations were higher in the 0–5 cm soil layer. P from synthetic fertilization may decrease SOC content by changing DOC and POXC in conventional paddy soils, particularly in surface soils. Moreover, the changes in SOC could be attributed to the relationship between DOC and inorganic phosphate fractions (as Fe-P) in paddy. An increase in DOC in the soil would be the result of changes in the P fraction and soil pH. The DOC:Avai. P ratio could serve as a compromise for the C and P dynamic indicators. The soil depth interval is the fundamental factor affecting the interactions. Fertilizer usage recommendations should be developed for sustainable agricultural intensification and C-dynamic impacts.

Author Contributions

Conceptualization, S.A. and C.C.; methodology, S.A.; software, C.C.; validation, S.A., C.C., P.P., and K.C.; formal analysis, C.C.; investigation, S.A.; resources, S.A. and C.C.; data curation, P.P. and K.C.; writing—original draft preparation, S.A. and C.C.; writing—review and editing, S.A. and C.C.; visualization, C.C.; supervision, S.A.; project administration, S.A. All authors have read and agreed to the published version of the manuscript.

Funding

This research received no external funding.

Informed Consent Statement

Not applicable.

Data Availability Statement

Not applicable.

Acknowledgments

This research work was partially supported by Maejo University (MJU) and Chiang Mai University (CMU), Chiang Mai, Thailand. Our sincere appreciation goes to the Donjaing farmers who graciously provided the farmland necessary for collecting the soil samples.

Conflicts of Interest

The authors declare no conflict of interest.

References

  1. FAO. World Food and Agriculture—Statistical Yearbook 2022. In Rome; FAO: Québec City, QC, Canada, 2022. [Google Scholar]
  2. Nguyen, T.T.; Do, M.H.; Rahut, D. Shock, risk attitude and rice farming: Evidence from panel data for Thailand. Environ. Chall. 2022, 6, 100430. [Google Scholar] [CrossRef]
  3. Keiluweit, M.; Gee, K.; Denney, A.M.; Fendorf, S. Anoxic microsites in upland soils dominantly controlled by clay content. Soil Biol. Biochem. 2018, 118, 42–50. [Google Scholar] [CrossRef]
  4. Pan, G.; Xu, X.; Smith, P.; Pan, W.; Lal, R. An increase in topsoil SOC stock of China’s croplands between 1985 and 2006 revealed by soil monitoring. Agric. Ecosyst. Environ. 2010, 136, 133–138. [Google Scholar] [CrossRef]
  5. Yanai, J.; Hirose, M.; Tanaka, S.; Sakamoto, K.; Nakao, A.; Dejbhimon, K.; Sriprachote, A.; Kanyawongha, P.; Lattirasuvan, T.; Abe, S. Changes in paddy soil fertility in Thailand due to the Green Revolution during the last 50 years. Soil Sci. Plant Nutr. 2020, 66, 889–899. [Google Scholar] [CrossRef]
  6. Fan, M.; Lal, R.; Zhang, H.; Margenot, A.J.; Wu, J.; Wu, P.; Zhang, L.; Yao, J.; Chen, F.; Gao, C. Variability and determinants of soil organic matter under different land uses and soil types in eastern China. Soil Tillage Res. 2020, 198, 104544. [Google Scholar] [CrossRef]
  7. Zhou, P.; Sheng, H.; Li, Y.; Tong, C.; Ge, T.; Wu, J. Lower C sequestration and N use efficiency by straw incorporation than manure amendment on paddy soils. Agric. Ecosyst. Environ. 2016, 219, 93–100. [Google Scholar] [CrossRef]
  8. Tang, H.; Li, C.; Xiao, X.; Pan, X.; Cheng, K.; Shi, L.; Li, W.; Wen, L.; Wang, K. Effects of long-term fertiliser regime on soil organic carbon and its labile fractions under double cropping rice system of southern China. Acta Agric. Scand. B Soil Plant Sci. 2020, 70, 409–418. [Google Scholar] [CrossRef]
  9. Ali, M.M.; Saheed, S.M.; Kubota, D.; Masunaga, T.; Wakatsuki, T. Soil degradation during the period 1967–1995 in Bangladesh. Soil Sci. Plant Nutr. 1997, 43, 879–890. [Google Scholar] [CrossRef] [Green Version]
  10. Darmawan; Kyuma, K.; Saleh, A.; Subagjo, H.; Masunaga, T.; Wakatsuki, T. Effect of green revolution technology from 1970 to 2003 on sawah soil properties in Java, Indonesia: I. Carbon and nitrogen distribution under different land management and soil types. Soil Sci. Plant Nutr. 2006, 52, 634–644. [Google Scholar] [CrossRef]
  11. FAO. World Food and Agriculture—Statistical Pocketbook; FAO: Québec City, QC, Canada, 2018; p. 254. [Google Scholar]
  12. Ramirez, K.S.; Craine, J.M.; Fierer, N. Nitrogen fertilization inhibits soil microbial respiration regardless of the form of nitrogen applied. Soil Biol. Biochem. 2010, 42, 2336–2338. [Google Scholar] [CrossRef]
  13. Wang, C.; Liu, D.; Bai, E. Decreasing soil microbial diversity is associated with decreasing microbial biomass under nitrogen addition. Soil Biol. Biochem. 2018, 120, 126–133. [Google Scholar] [CrossRef]
  14. Wang, D.; Yi, W.; Zhou, Y.; He, S.; Tang, L.; Yin, X.; Zhao, P.; Long, G. Intercropping and N application enhance soil dissolved organic carbon concentration with complicated chemical composition. Soil Tillage Res. 2021, 210, 104979. [Google Scholar] [CrossRef]
  15. Cui, X.; Zhang, Y.; Gao, J.; Peng, F.; Gao, P. Long-term combined application of manure and chemical fertilizer sustained higher nutrient status and rhizospheric bacterial diversity in reddish paddy soil of Central South China. Sci. Rep. 2018, 8, 16554. [Google Scholar] [CrossRef] [PubMed] [Green Version]
  16. Kaiser, K.; Kalbitz, K. Cycling downwards—Dissolved organic matter in soils. Soil Biol. Biochem. 2012, 52, 29–32. [Google Scholar] [CrossRef]
  17. Aumtong, S.; Chotamonsak, C.; Glomchinda, T. Study of the innteraction of dissolved organic carbon, available nutrients, and clay content driving soil carbon storage in the rice rotation cropping system in northern Thailand. Agronomy 2023, 13, 142. [Google Scholar] [CrossRef]
  18. Tian, L.; Dell, E.; Shi, W. Chemical composition of dissolved organic matter in agroecosystems: Correlations with soil enzyme activity and carbon and nitrogen mineralization. Appl. Soil Ecol. 2010, 46, 426–435. [Google Scholar] [CrossRef]
  19. McDowell, W.H.; Magill, A.H.; Aitkenhead-Peterson, J.A.; Aber, J.D.; Merriam, J.L.; Kaushal, S.S. Effects of chronic nitrogen amendment on dissolved organic matter and inorganic nitrogen in soil solution. For. Ecol. Manag. 2004, 196, 29–41. [Google Scholar] [CrossRef]
  20. Sinsabaugh, R.L.; Zak, D.R.; Gallo, M.; Lauber, C.; Amonette, R. Nitrogen deposition and dissolved organic carbon production in northern temperate forests. Soil Biol. Biochem. 2004, 36, 1509. [Google Scholar] [CrossRef]
  21. Zhang, Z.; Wang, X.; Liang, L.; Huang, E.; Tao, X. Phosphorus fertilization alters complexity of paddy soil dissolved organic matter. J. Integr. Agric. 2020, 19, 2301–2312. [Google Scholar] [CrossRef]
  22. Spohn, M.; Diáková, K.; Aburto, F.; Doetterl, S.; Borovec, J. Sorption and desorption of organic matter in soils as affected by phosphate. Geoderma 2022, 405, 115377. [Google Scholar] [CrossRef]
  23. Chantigny, M.H.; Angers, D.A.; Rochette, P. Fate of carbon and nitrogen from animal manure and crop residues in wet and cold soils. Soil Biol. Biochem. 2002, 34, 9. [Google Scholar]
  24. Dikgwatlhe, S.B.; Chen, Z.D.; Lal, R.; Zhang, H.L.; Chen, F. Changes in soil organic carbon and nitrogen as affected by tillage and residue management under wheat-maize cropping system in the North China Plain. Soil Tillage Res. 2014, 144, 9. [Google Scholar] [CrossRef]
  25. Bhadha, J.H.; Daroub, S.H.; Lang, T.A. Effect of kinetic control, soil: Solution ratio, electrolyte cation, and others, on equilibrium phosphorus concentration. Geoderma 2012, 173, 6–209. [Google Scholar] [CrossRef]
  26. Li, N.; Xu, Y.Z.; Han, X.-Z.; He, H.-B.; Zhang, X.D.; Zhang, B. Fungi contribute more than bacteria to soil organic matter through necromass accumulation under different agricultural practices during the early pedogenesis of a Mollisol. Eur. J. Soil Biol. 2015, 67, 51–58. [Google Scholar] [CrossRef]
  27. Huang, X.; Wang, H.; Zhang, M.; Horn, R.; Ren, T. Soil water retention dynamics in a mollisol during a maize growing season under contrasting tillage systems. Soil Tillage Res. 2021, 209, 104953. [Google Scholar] [CrossRef]
  28. Chacon, N.; Silver, W.L.; Dubinsky, E.A.; Cusack, D.F. Iron reduction and soil phosphorus solubilization in humid tropical forests soils: The roles of labile carbon pools and an electron shuttle compound. Biogeochemistry 2006, 78, 67–84. [Google Scholar] [CrossRef]
  29. Leith, F.I.; Garnett, M.H.; Dinsmore, K.J.; Billett, M.F.; Heal, K.V. Source and age of dissolved and gaseous carbon in a peatland–riparian–stream continuum: A dual isotope (14C and δ13C) analysis. Biogeochemistry 2014, 119, 415–433. [Google Scholar] [CrossRef] [Green Version]
  30. Simo, I.; Schulte, R.; O’Sullivan, L.; Creamer, R. Digging deeper: Understanding the contribution of subsoil carbon for climate mitigation, a case study of Ireland. Environ. Sci. Policy 2019, 98, 61–69. [Google Scholar] [CrossRef]
  31. Chen, Y.L.; Zhang, Z.-S.; Zhao, Y.; Hu, Y.-G.; Zhang, D.-H. Soil carbon storage along a 46-year revegetation chronosequence in a desert area of northern China. Geoderma 2018, 325, 28–36. [Google Scholar] [CrossRef]
  32. Yu, H.; Zha, T.; Zhang, X.; Ma, L. Vertical distribution and influencing factors of soil organic carbon in the Loess Plateau, China. Sci. Tot. Environ. 2019, 693, 133632. [Google Scholar] [CrossRef]
  33. Qiao, Y.; Wang, J.; Liu, H.; Huang, K.; Yang, Q.; Lu, R.; Yan, L.; Wang, X.; Xia, J. Depth-dependent soil C-N-P stoichiometry in a mature subtropical broadleaf forest. Geoderma 2020, 370, 114357. [Google Scholar] [CrossRef]
  34. Ghani, A.; Sarathchandra, U.; Ledgard, S.; Dexter, M.; Lindsey, S. Microbial decomposition of leached or extracted dissolved organic carbon and nitrogen from pasture soils. Biol. Fertil. Soils 2013, 49, 747–755. [Google Scholar] [CrossRef]
  35. Weil, R.; Islam, K.; Stine, M.; Gruver, J.; Samson, L.S. Estimating active carbon for soil quality assessment: A simplified method for laboratory and field use. Am. J. Alt. Agric. 2003, 18, 1–15. [Google Scholar]
  36. Nelson, D.W.; Sommers, L.E. Total Carbon, Organic Carbon, and Organic Matter. In Methods of Soil Analysis; Sparks, D.L.A.L.P., Helmke, P.A., Loeppert, R.H., Soltanpour, P.N., Tabatabai, M.A., Johnston, C.T., Sumner, M.E., Eds.; SSSA Book Series; Wiley Online Library: Hoboken, NJ, USA, 1996; Volume 84, pp. 961–1010. [Google Scholar]
  37. Murphy, J.; Riley, J.P. A modified single solution method for the determination of phosphate in natural waters. Anl. Chim. Acta 1962, 27, 31–36. [Google Scholar] [CrossRef]
  38. Peech, M. Determination of exchangeable cation and exchange capacity of soil: Rapid micro methods ultilizing centrifuge and spectrophotometer. Soil Sci. 1945, 59, 25–28. [Google Scholar] [CrossRef]
  39. Gee, G.W.; Or, D. Particle-Size Analysis in Methods. In Methods of Soil Analysis; Dane, J.H., Topp, G.C., Eds.; Soil Science Society of America Inc.: Madison, WI, USA, 2002; Volume 5, pp. 255–293. [Google Scholar]
  40. Zhang, H.; Kovar, J.L. Fractionation of soil phosphorus. In Methods of Phosphorus Analysis for Soils, Sediments, Residuals, and Waters; Kovar, J., Pierzynski, G., Eds.; Southern Cooperative Series Bulletin 408: Southern Extension and Research Activity (SERA); Virginia Tech University: Blacksburg, VA, USA, 2009; pp. 50–60. [Google Scholar]
  41. Singh, M.; Sarkar, B.; Sarkar, S.; Churchman, J.; Bolan, N.; Mandal, S.; Menon, M.; Purakayastha, T.J.; Beerling, D.J. Chapter Two—Stabilization of Soil Organic Carbon as Influenced by Clay Mineralogy. In Advances in Agronomy; Sparks, D.L., Ed.; Academic Press: Cambridge, MA, USA, 2018; Volume 148, pp. 33–84. [Google Scholar]
  42. Averill, C.; Waring, B. Nitrogen limitation of decomposition and decay: How can it occur? Glob. Chang. Biol. 2018, 24, 1417–1427. [Google Scholar] [CrossRef] [Green Version]
  43. Qaswar, M.; Yiren, L.; Liu, K.; Zhenzhen, L.; Hongqian, H.; Lan, X.; Jianhua, J.; Ahmed, W.; Lisheng, L.; Mouazen, A.M.; et al. Interaction of Soil Nutrients and Arsenic (As) in Paddy Soil in a Long-Term Fertility Experiment. Sustainability 2022, 14, 11939. [Google Scholar] [CrossRef]
  44. Qaswar, M.; Ahmed, W.; Jing, H.; Hongzhu, F.; Xiaojun, S.; Xianjun, J.; Kailou, L.; Yongmei, X.; Zhongqun, H.; Asghar, W.; et al. Soil carbon (C), nitrogen (N) and phosphorus (P) stoichiometry drives phosphorus lability in paddy soil under long-term fertilization: A fractionation and path analysis study. PLoS ONE 2019, 14, e0218195. [Google Scholar] [CrossRef] [Green Version]
  45. Divito, G.A.; Rozas, H.R.S.; Echeverría, H.E.; Studdert, G.A.; Wyngaard, N. Long term nitrogen fertilization: Soil property changes in an Argentinean Pampas soil under no tillage. Soil Tillage Res. 2011, 114, 117–126. [Google Scholar] [CrossRef]
  46. Malik, A.A.; Puissant, J.; Buckeridge, K.M.; Goodall, T.; Jehmlich, N.; Chowdhury, S.; Gweon, H.S.; Peyton, J.M.; Mason, K.E.; van Agtmaal, M. Land use driven change in soil pH affects microbial carbon cycling processes. Nat. Commun. 2018, 9, 3591. [Google Scholar] [CrossRef] [Green Version]
  47. Wang, C.; Zhou, X.; Guo, D.; Zhao, J.; Yan, L.; Feng, G.; Gao, Q.; Yu, H.; Zhao, L. Soil pH is the primary factor driving the distribution and function of microorganisms in farmland soils in northeastern China. Ann. Microbiol. 2019, 69, 1461–1473. [Google Scholar] [CrossRef] [Green Version]
  48. Grybos, M.; Davranche, M.; Gruau, G.; Petitjean, P.; Pédrot, M. Increasing pH drives organic matter solubilization from wetland soils under reducing conditions. Geoderma 2009, 154, 13–19. [Google Scholar] [CrossRef]
  49. Nurzakiah, S.; Sutandi, A.; Sabiham, S.; Djajakirana, G.; Sudadi, U. Controls on the net dissolved organic carbon production in tropical peat. J. Soil Sci. Agroclim. 2020, 17, 161–169. [Google Scholar] [CrossRef]
  50. Che, J.; Zhao, X.Q.; Zhou, X.; Jia, Z.J.; Shen, R.F. High pH-enhanced soil nitrification was associated with ammoniaoxidizing bacteria rather than archaea in acidic soils. Appl. Soil Ecol. 2015, 85, 9. [Google Scholar] [CrossRef]
  51. Wang, H.; Zhu, J.; Fu, Q.; Hu, H. Adsorption of phosphate on pure and humic acid-coated ferrihydrite. J. Soil Sediments 2015, 15, 1500–1509. [Google Scholar] [CrossRef]
  52. Shen, D.; Ye, C.; Hu, Z.; Chen, X.; Guo, H.; Li, J.; Du, G.; Adl, S.; Liu, M. Increased chemical stability but decreased physical protection of soil organic carbon in response to nutrient amendment in a Tibetan alpine meadow. Soil Biol. Biochem. 2018, 126, 11–21. [Google Scholar] [CrossRef]
  53. Kaiser, K.; Zech, W. Release of natural organic matter sorbed to oxides and a subsoil. Soil Sci. Soc. Am. J. 1999, 63, 1157–1166. [Google Scholar] [CrossRef]
  54. Spohn, M.; Schleuss, P.M. Addition of inorganic phosphorus to soil leads to desorption of organic compounds and thus to increased soil respiration. Soil Biol. Biochem. 2019, 130, 220–226. [Google Scholar] [CrossRef]
  55. Spohn, M. Phosphorus and carbon in soil particle size fractions: A synthesis. Biogeochemistry 2020, 147, 225–242. [Google Scholar] [CrossRef] [Green Version]
  56. Uchida, Y.; Nishimura, S.; Akiyama, H. The relationship of water-soluble carbon and hot-water-soluble carbon with soil respiration in agricultural fields. Agric. Ecosyst. Environ. 2012, 156, 116–122. [Google Scholar] [CrossRef]
  57. Gao, S.J.; Gao, J.S.; Cao, W.D.; Zou, C.Q.; Huang, J.; Bai, J.S.; Dou, F.G. Effects of long-term green manure application on the content and structure of dissolved organic matter in red paddy soil. J. Integr. Agric. 2018, 17, 1852–1860. [Google Scholar] [CrossRef] [Green Version]
  58. Debicka, M.; Kocowicz, A.; Weber, J.; Jamroz, E. Organic matter effects on phosphorus sorption in sandy soils. Arch. Agron. Soil Sci. 2016, 62, 16. [Google Scholar] [CrossRef]
  59. Fisk, M.; Santangelo, S.; Minick, K. Carbon mineralization is promoted by phosphorus and reduced by nitrogen addition in the organic horizon of northern hardwood forests. Soil Biol. Biochem. 2015, 81, 212–218. [Google Scholar] [CrossRef]
  60. Roy, E.D.; Willig, E.; Richards, P.D.; Martinelli, L.A.; Vazquez, F.F.; Pegorini, L.; Spera, S.A.; Porder, S. Soil phosphorus sorption capacity after three decades of intensive fertilization in Mato Grosso, Brazil. Agric. Ecosyste Environ. 2017, 249, 206–214. [Google Scholar] [CrossRef]
  61. Fei, C.; Zhang, S.; Zhang, L.; Ding, X. Straw is more effective than biochar in mobilizing soil organic phosphorus mineralization in saline-alkali paddy soil. Appl. Soil Ecol. 2023, 186, 104848. [Google Scholar] [CrossRef]
  62. Zhang, Z.; Yan, J.; Han, X.; Zou, W.; Chen, X.; Lu, X.; Feng, Y. Labile organic carbon fractions drive soil microbial communities after long-term fertilization. Global Ecol. Conserv. 2021, 32, e01867. [Google Scholar] [CrossRef]
  63. Evans, C.; Goodale, C.; Caporn, S.; Dise, N.; Emmett, B.; Fernandez, I.; Field, C.; Findlay, S.; Lovett, G.; Meesenburg, H.; et al. Does elevated nitrogen deposition or ecosystem recovery from acidification drive increased dissolved organic carbon loss from upland soil? A review of evidence from field nitrogen addition experiments. Biogeochemistry 2008, 91, 13. [Google Scholar] [CrossRef]
  64. Yue, K.; Peng, Y.; Peng, C.; Yang, W.; Peng, X.; Wu, F. Stimulation of terrestrial ecosystem carbon storage by nitrogen addition: A meta-analysis. Sci. Rep. 2016, 6, 19895. [Google Scholar] [CrossRef] [Green Version]
  65. Mendez Millan, M.; Dignac, M.F.; Rumpel, C.; Rasse, D.P.; Bardoux, G.; Derenne, S. Contribution of maize root derived C to soil organic carbon throughout an agricultural soil profile assessed by compound specific 13C analysis. Org. Geochem. 2012, 42, 1502–1511. [Google Scholar] [CrossRef]
  66. Rumpel, C.; Kögel Knabner, I. Deep soil organic matter—A key but poorly understood component of terrestrial C cycle. Plant Soil 2011, 338, 143–158. [Google Scholar] [CrossRef]
  67. Kaiser, K.; Guggenberger, G. The role of DOM sorption to mineral surfaces in the preservation of organic matter in soils. Org. Geochem. 2000, 31, 711–725. [Google Scholar] [CrossRef]
  68. Kalbitz, K.; Kaiser, K. Contribution of dissolved organic matter to carbon storage in forest mineral soils. J. Plant Nutr. Soil Sci. 2008, 171, 52–60. [Google Scholar] [CrossRef]
  69. Mustafa, A.; Xu, H.; Sun, N.; Liu, K.; Huang, Q.; Nezhad, M.T.; Xu, M. Long-Term Fertilization Alters the Storage and Stability of Soil Organic Carbon in Chinese Paddy Soil. Agronomy 2023, 13, 1463. [Google Scholar] [CrossRef]
  70. Mohanty, S.; Nayak, A.K.; Swain, C.K.; Dhal, B.R.; Kumar, A.; Kumar, U.; Tripathi, R.; Shahid, M.; Behera, K.K. Impact of integrated nutrient management options on GHG emission, N loss and N use efficiency of low land rice. Soil Tillage Res. 2020, 200, 104616. [Google Scholar] [CrossRef]
  71. Ding, X.; Han, X.; Zhang, X.; Qiao, Y.; Liang, Y. Continuous manuring combined with chemical fertilizer affects soil microbial residues in a Mollisol. Biol. Fertil. Soils 2013, 49, 387–393. [Google Scholar] [CrossRef]
  72. Aumtong, S.; Chotamornsak, C.; Somchit, B. The increased carbon storage by changes in adsorption capacity with a decrease of phosphorus availability in the organic paddy soil. Ilmu Pertan. (Agric. Sci.) 2022, 7, 91–98. [Google Scholar] [CrossRef]
  73. He, Y.T.; He, X.H.; Xu, M.G.; Zhang, W.J.; Yang, X.Y.; Huang, S.M. Long-term fertilization increases soil organic carbon and alters its chemical composition in three wheat-maize cropping sites across central and south China. Soil Tillage Res. 2018, 177, 79–87. [Google Scholar] [CrossRef]
  74. Geng, H.; Wang, X.; Shi, S.; Ye, Z.; Zhou, W. Fertilization makes strong associations between organic carbon composition and microbial properties in paddy soil. J. Environ. Manag. 2023, 325, 116605. [Google Scholar] [CrossRef]
  75. Chen, D.; Zhou, Y.; Xu, C.; Lu, X.; Liu, Y.; Yu, S.; Feng, Y. Water-washed hydrochar in rice paddy soil reduces N2O and CH4 emissions: A whole growth period investigation. Environ. Pollut. 2021, 274, 116573. [Google Scholar] [CrossRef]
  76. Yan, X.; Wei, Z.; Hong, Q.; Lu, Z.; Wu, J. Phosphorus fractions and sorption characteristics in a subtropical paddy soil as influenced by fertilizer sources. Geoderma 2017, 295, 80–85. [Google Scholar] [CrossRef]
  77. Elrys, A.S.; Ali, A.; Zhang, H.; Cheng, Y.; Zhang, J.; Cai, Z.C.; Muller, C.; Chang, S.X. Patterns and drivers of global gross nitrogen mineralization in soils. Glob. Chang. Biol. 2021, 27, 5950–5962. [Google Scholar] [CrossRef] [PubMed]
  78. Iyamuremye, F.; Dick, R.P.; Baham, J. Organic amendments and phosphorus dynamics: II distribution of soil phosphorus fractions. Soil Sci. 1996, 161, 436–443. [Google Scholar] [CrossRef]
  79. Toor, G.S.; Bahl, G.S.; Vig, A.C. Pattern of P Availability in Different Soils as Assessed by Different Adsorption Equations. J. Ind. Soc. Soil Sci. 1997, 45, 719–723. [Google Scholar]
  80. Borgnino, L.; Giacomelli, C.E.; Avena, M.J.; Pauli, C.P. Phosphate adsorbed on Fe(III) modified montmorillonite: Surface complexation studied by ATR-FTIR spectroscopy. Colloids Surf. 2010, 353, 238–244. [Google Scholar] [CrossRef]
  81. Pavinato, P.S.; Merlin, A.; Rosolem, C.A. Phosphorus fractions in Brazilian Cerrado soils as affected by tillage. Soil Tillage Res. 2009, 105, 149–155. [Google Scholar] [CrossRef]
  82. Zhao, Q.; Adhikari, D.C.; Huang, R.; Patel, A.; Wang, X.; Tang, Y.; Obrist, D.; Roden, E.E.; Yang, Y. Coupled dynamics of iron and iron-bound organic carbon in forest soils during anaerobic reduction. Chem. Geol. 2017, 464, 118–126. [Google Scholar] [CrossRef]
  83. Quantin, C.; Becquer, T.; Berthelin, J. Mn-oxide: A major source of easily mobilisable Co and Ni under reducing conditions in New Caledonia Ferralsols. CR Geosci. 2002, 334, 273–278. [Google Scholar] [CrossRef]
  84. Henderson, R.; Kabengi, N.; Mantripragada, N.; Cabrera, M.; Hassan, S.; Thompson, A. Anoxia-Induced Release of Colloid- and Nanoparticle-Bound Phosphorus in Grassland Soils. Environ. Sci. Technol. 2012, 46, 11727–11734. [Google Scholar] [CrossRef]
  85. Zhao, Q.; DunhamCheatham, S.M.; Adhikari, D.C.; Chen, C.; Patel, A.; Poulson, S.R.; Obrist, D.; Verburg, P.S.; Wang, X.; Roden, E.R.; et al. Oxidation of soil organic carbon during an anoxic-oxic transition. Geoderma 2020, 377, 114584. [Google Scholar] [CrossRef]
  86. Gu, S.; Gruau, G.; Dupas, R.; Petitjean, P.; Li, Q.; Pinay, G. Respective roles of Fe-oxyhydroxide dissolution, pH changes and sediment inputs in dissolved phosphorus release from wetland soils under anoxic conditions. Geoderma 2019, 338, 365–374. [Google Scholar] [CrossRef]
  87. Huang, W.; Hall, S.J. Elevated moisture stimulates carbon loss from mineral soils by releasing protected organic matter. Nat. Commun. 2017, 8, 1774. [Google Scholar] [CrossRef] [PubMed] [Green Version]
  88. Reguera, E. The Effect of Salinity on Species Survival and Carbon Storage on the Lower Eastern Shore of Maryland Due to Saltwater Intrusion. Ph.D. Thesis, Maryland College University of Maryland, College Park, MD, USA, 2019. [Google Scholar]
  89. Knorr, K.H. DOC-dynamics in a small headwater catchment as driven by redox fluctuations and hydrological flow paths—Are DOC exports mediated by iron reduction/oxidation cycles? Biogeosciences 2013, 10, 891–904. [Google Scholar] [CrossRef] [Green Version]
  90. Chadwick, S.P.; Babiarz, C.L.; Hurley, J.P.; Armstrong, D.E. Influences of iron, manganese, and dissolved organic carbon on the hypolimnetic cycling of amended mercury. Sci. Tot. Environ. 2006, 368, 177–188. [Google Scholar] [CrossRef] [PubMed]
  91. Guo, B.; Liang, Y.; Li, Z.; Han, F. Phosphorus Adsorption and Bioavailability in a Paddy Soil Amended with Pig Manure Compost and Decaying Rice Straw. Commun. Soil Sci. Plant Anal. 2009, 40, 2185–2199. [Google Scholar] [CrossRef]
  92. Kar, S.; Maity, J.P.; Jean, J.S.; Liu, C.C.; Nath, B.; Yang, H.J.; Bundschuh, J. Arsenic-enriched aquifers: Occurrences and mobilization of arsenic in groundwater of Ganges Delta Plain, Barasat, West Bengal, India. Appl. Geochem. 2010, 25, 1805–1814. [Google Scholar] [CrossRef]
  93. Khan, I.; Fahad, S.; Wu, L.; Zhou, W.; Xu, P.; Sun, Z.; Salam, A.; Imran, M.; Mengdie, J.; Kuzyakov, Y.; et al. Labile organic matter intensifies phosphorous mobilization in paddy soils by microbial iron (III) reduction. Geoderma 2019, 352, 185–196. [Google Scholar] [CrossRef]
Figure 1. Conventional rice plantations used in this study.
Agronomy 13 01588 g001
Figure 2. The WSC, HWSC, and DOC (a), POXC (b), and SOC (c) at different soil depths. Note: differences in soil depth across the latter means are significant (p < 0.05). The lines above the bars represent the standard error. SOC = soil organic carbon; POXC = permanganate oxidizable carbon; HWSC = hot water-soluble carbon; DOC = dissolved organic carbon.
Agronomy 13 01588 g002
Figure 3. The fractionation of inorganic phosphorus in conventional paddy soil at specific soil depths between 0−5 and 10−15 cm. Note: There were substantial differences between the selected soil depths (0−5 and 10−15 cm) between the small case and bar (p < 0.05). The lines above the bars represent the standard error. P− solution was extracted using 0.1 M NH4Cl; Al−P was extracted using 0.5 M NH4F; and Fe−P was extracted using 0.1 M NaOH. Red−So−P = Reductant soluble P, which was extracted using a mixture of Na3C3H6O7, NaHCO3, and Na2S2O4. Ca−P was extracted using 0.25 M H2SO4.
Agronomy 13 01588 g003
Figure 4. Physiochemical properties of paddy soil at various soil depths; CEC and Avai. P (a), soil pH (b), clay and silt (c), and DOC/Avai. P ratio (d). Note: There were substantial differences between the selected soil depths (0–5 and 10–15 cm), as shown by the differences in the latter (p < 0.05). The lines above the bars represent the standard error. CEC = cation exchange capacity (1 N NH4OAC pH = 7), where P is available phosphorus assessed using the Bray II method; pH = soil pH (1:1 H2O); clay and silt are percentages of clay and silt content; and DOC/P is the ratio of DOC to P.
Agronomy 13 01588 g004
Figure 5. The correlation coefficient between the physiological soil properties and inorganic phosphorus fractions and the labile carbon fractions and soil carbon content determined using principal component analysis. Note:  p < 0.05, ★★ p < 0.01, and ★★★ p < 0.001. Solution–P was extracted using 0.1 M NH4Cl; Al–P was extracted using 0.5 M NH4F; and Fe–P was extracted using 0.1 M NaOH. Re.So.P = Reductant soluble P, which was extracted using a mixture of Na3C3H6O7, NaHCO3, and Na2S2O4; and Ca–P was extracted using 0.25 M H2SO4. SOC, soil organic carbon; WSC, water-soluble carbon; HWSC, hot water-soluble carbon; DOC, dissolved organic carbon; POXC, permanganate oxidizable carbon; Avai. P, available phosphorus; pH, soil pH; CEC, cation exchange capacity; clay and silt, percentages of clay and silt.
Agronomy 13 01588 g005
Figure 6. The principal correlation analysis of soil properties and inorganic phosphorus fractions at differing soil depths: 0–5 cm (a) and 10–15 cm (b). Note: Solution–P was extracted using 0.1 M NH4Cl; Al–P was extracted using 0.5 M NH4F; and Fe–P was extracted using 0.1 M NaOH. Re.So.P = Reductant soluble P, which was extracted using a mixture of Na3C3H6O7, NaHCO3, and Na2S2O4; and Ca–P was extracted using 0.25 M H2SO4. SOC, soil organic carbon; WSC, water-soluble carbon; HWSC, hot water-soluble carbon; DOC, dissolved organic carbon; POXC, permanganate oxidizable carbon; Avai. P, available phosphorus; pH, soil pH; CEC, cation exchange capacity; clay and silt, percentages of clay and silt.
Agronomy 13 01588 g006
Figure 7. The correlation coefficient between soil properties, SOC, and the labile organic carbon fraction at various soil depths. Note:  p < 0.05, ★★ p < 0.01, and ★★★ p < 0.001. SOC, soil organic carbon; WSC, water-soluble carbon; HWSC, hot water-soluble carbon; DOC, dissolved organic carbon; POXC, permanganate oxidizable carbon; P, available phosphorus; pH, soil pH; CEC, cation exchange capacity; clay and silt, percentages of clay and silt.
Agronomy 13 01588 g007
Figure 8. The effect of long-term synthetic fertilization on the changes in SOC and C dynamics in the paddy soil. Note: The numbers in the boxes indicate the relationships between the correlation coefficients of the indicators. Solution–P was extracted using 0.1 M NH4Cl; Al–P was extracted using 0.5 M NH4F; and Fe–P was extracted using 0.1 M NaOH. Re.So.P = Reductant soluble P, which was extracted using a mixture of Na3C3H6O7, NaHCO3, and Na2S2O4; and Ca-P was extracted using 0.25 M H2SO4. SOC, soil organic carbon; WSC, water-soluble carbon; HWSC, hot water-soluble carbon; DOC, dissolved organic carbon; POXC, permanganate oxidizable carbon; Avai. P, available phosphorus; pH, soil pH; CEC, cation exchange capacity; clay and silt, percentages of clay and silt. The numbers in the green boxes varied between the datasets 0–5 and 10–15 cm, while the numbers in the orange boxes came from a 0–30 cm soil depth dataset. Note:  p < 0.05, ★★ p < 0.01, and ★★★ p < 0.001.
Agronomy 13 01588 g008
Disclaimer/Publisher’s Note: The statements, opinions and data contained in all publications are solely those of the individual author(s) and contributor(s) and not of MDPI and/or the editor(s). MDPI and/or the editor(s) disclaim responsibility for any injury to people or property resulting from any ideas, methods, instructions or products referred to in the content.

