Article

Spectral Response of Camelina (Camelina sativa (L.) Crantz) to Different Nitrogen Fertilization Regimes under Mediterranean Conditions

1
Department of Agriculture, Food and Environment, University of Pisa, Via del Borghetto 80, 56124 Pisa, Italy
2
Centro di Ricerche Agro-Ambientali “Enrico Avanzi”, Via Vecchia di Marina 6, 56122 Pisa, Italy
*
Author to whom correspondence should be addressed.
These authors contributed equally to this work.
Agronomy 2023, 13(6), 1539; https://doi.org/10.3390/agronomy13061539
Submission received: 6 May 2023 / Revised: 23 May 2023 / Accepted: 30 May 2023 / Published: 31 May 2023

Abstract

:
Knowledge about the spectral response of camelina under different regimes of nitrogen (N) fertilization is very scarce. Therefore, 2-year open-field trials were carried out in the 2021 and 2022 growing seasons with the aim of evaluating the spectral response of spring camelina to four different N fertilization regimes by using remote (UAV) and proximal (leaf-clip Dualex) sensing techniques. The tested treatments were: (i) control: no N application (T0); (ii) top dressing: 60 kg N ha−1 before stem elongation (T1); basal dressing: 60 kg N ha−1 at sowing (T2); basal + top dressing combination: 60 kg N ha−1 at sowing + 60 kg N ha−1 before stem elongation (T3). Camelina seed yield and N use efficiency were strongly affected by fertilization regimes, with the best results obtained at T2. A reduction in plant development and seed yield was detected in 2022, probably due to the rise in air temperatures. A significant effect of both growing season and N fertilization was observed on the photosynthetic pigments content with the T1 highest values in 2022. The highest seed oil content was achieved at T1, while the protein content increased with increasing N, with the best values at T3. Positive and significant correlations were observed among several vegetation indices obtained through UAV flights (NDVI, MRS705, FGCC) and seed yield, as well as between FGCC and leaf N concentration. Overall, these findings demonstrate the feasibility of utilizing remote sensing techniques from UAVs for predicting seed yield in camelina.

1. Introduction

Nowadays, the great potential arising from technological progress seems to be able to meet the challenges of modern agriculture aimed at increasing the sustainability and quality of cropping systems [1]. The application of new monitoring techniques to manage intensive agriculture is crucial. Indeed, modern technologies allow farmers to keep plants healthy and achieve high and stable yields, and, at the same time, reduce environmental impacts. Particular attention is generally paid to nitrogen (N) fertilization, as N is an essential mineral nutrient known to enhance photosynthetic capacity and improve crop yield [2,3]. In agriculture, nitrogen use efficiency (NUE) is generally quite low, and nitrogen losses, mainly through leaching (nitrates) and gas emissions (nitrous oxide and ammonia), cause serious environmental concerns such as water contamination and climate change [4,5]. Therefore, dynamic monitoring of crop nutrition status is a key point to rationalize N management by ensuring higher yield and food quality and minimizing the negative environmental impacts due to fertilizer losses [6,7]. However, traditional methods based on N analysis of plant tissues are often expensive and time consuming because of the large number of samples required. Moreover, they do not provide real-time information about the nutritional status of the crop, and thus, they do not allow timely management of nitrogen fertilization [8]. Conversely, remote and proximal sensing are able to provide non-destructive and real-time information on leaf N and can be considered a viable alternative to laboratory analyses [8,9,10,11,12]. Indeed, many authors reported that foliar chlorophyll meters are a good proxy of plant photosynthetic activity, which in turn is affected by nitrogen content in addition to environmental stresses such as drought, salinity, disease, and pests [13,14,15].
Moreover, multispectral and hyperspectral imagery captured through unmanned aerial vehicles (UAVs) can be used to calculate several vegetation indices (VIs) widely used for the prediction of crop yields and the evaluation of nutritional status and stress conditions of plants [16]. They are calculated by considering the reflectance of a single (or a combination of two or more) wavelengths [17,18,19]. In this way, maps based on the variable rate distribution of fertilizers are created to match nitrogen supply with crop needs, both in space and time, combining crop yield, N efficiency, and compliance with the environment.
In this context, the literature about Camelina sativa (L.) Crantz’s response to different nitrogen fertilization rates—as well as on the use of remote/proximal sensing for evaluating its N status—is scarce.
Camelina, an oilseed crop belonging to the Brassicaceae family, is mainly used in biofuel production, thanks to its ability to reduce greenhouse gas emissions. Recently, it has gained renewed interest due to its numerous favorable agronomic traits and multiple uses in food, feed, and bio-based industry [20,21]. It shows a considerably high seed oil content (up to 49% dry matter) with an unusual fatty acid profile of which α-linolenic acid (C18:3, ALA) accounts for almost 28–50%, while linoleic acid (C18:2, LA) accounts for approximately 15–23% of all FAs [21,22]. Its seeds are also characterized by a good crude protein content (28–32%) and by the presence of high amounts of bioactive compounds with high antioxidant activity, such as phenolic acids, flavonoids, tocopherols, and xanthophylls [22]. Moreover, camelina seed cake, a co-product deriving from oil extraction, can be used as an ingredient in livestock feed diets due to its high protein content (up to 45% DM) with a favorable amino acid profile and energetic value [23,24,25]. This end-use of camelina cake represents the main driving force for the expansion of this crop in Europe, where the current shortage in the domestic production of vegetable proteins and oils for feed use has imposed a strong dependence on foreign imports.
Camelina is a short-season crop with a crop cycle varying from 90 to 250 days, with spring and autumn sowing [26]. It is resistant to drought, cold, pests, and diseases and has low agricultural input requirements, thus showing broad environmental adaptability, including in poor and marginal soils [26,27]. Furthermore, the ability of camelina to adapt well to the agricultural equipment available on farms and the possibility of being introduced as the main crop, cover crop, and relay crop make it a winning and sustainable diversification strategy for European cropping systems. However, camelina is characterized by lower yield stability compared to other Brassica crops [28]. This fact, together with the lack of adequate agronomic knowledge, often represents the main obstacle to its introduction and diffusion into current cropping systems.
Therefore, it is of primary importance to optimize the N management in order to increase crop yield and improve production quality. Unfortunately, the literature is scarce about camelina’s response to different nitrogen fertilization rates and, even more, about the use of remote/proximal sensing in evaluating its nitrogen status.
This study was conducted to explore the use of digital technologies on Camelina sativa (L.) Crantz under different N availabilities in order to: (i) optimize N fertilization and (ii) evaluate the suitability of remote and proximal sensing in monitoring nutritional status. In particular, the effects of different N fertilizer regimes (rate and timing) on crop growth (seed yield and yield components) and quality (protein and oil seed content) were assessed, along with traditional (destructive diagnosis) and non-destructive methods (Dualex portable sensor and UAVs equipped with RGB and high-definition multispectral cameras).

2. Materials and Methods

2.1. Experimental Setup and Site Description

Two-year experimental field trials were conducted during 2021 and 2022 growing seasons at the Experimental Center of the Department of Agriculture, Food, and Environment (DAFE) of the University of Pisa, San Piero a Grado, Pisa, Italy (43°40′ N; 10°19′ E; 5 m above sea level). In both years of cultivation, winter wheat (Triticum turgidum L. subsp. durum (Desf.) Husn.) preceded camelina. An integrated management system was adopted with conventional tillage practices and mineral fertilization. Pre-planting phosphorus and potassium fertilizations were performed at a rate of 80 kg P2O5 ha−1 as triple superphosphate and 50 kg K2O ha−1 as potassium sulfate. Both years, spring sowing of camelina was performed by a Wintersteiger plot drill on 0.15 m spaced rows and a depth of 0.01 m on 8 March. The seeding rate, in both years, was around 6.5 kg ha−1, considering percent seed germination as well as 1000-seed weight (TSW), in order to reach a target of 500 plants m−2. For these experiments, the commercial variety Calena was used, and different nitrogen levels (applied as ammonium nitrate, NH4NO3) and timing (basal and top dressing) were compared. The tested treatments were: T0 = control: no N application; T1 = top dressing: 60 kg N ha−1 before stem elongation; T2 = basal dressing: 60 kg N ha−1 at sowing; T3 = basal + top dressing combination: 60 kg N ha−1 at sowing + 60 kg N ha−1 before stem elongation. A completely randomized block design was adopted with three replications for each treatment (plot size: 8 m × 6 m). No chemical treatments for pests and diseases were necessary during the whole experiment, and weeds were controlled by hand weeding.
Daily meteorological data (temperature and rainfall) were measured through an automatic meteorological station located near the experimental site. The climate in the area is Mediterranean (Csa according to Köppen classification), characterized by hot and dry summers, with rainfall concentrated during winter. Long-term (20 years) rainfall in the March–June period was 212 mm, while in the same period, temperature varied from a minimum of 5.8 °C (1st decade of March) to a maximum of 26.6 °C (3rd decade of June).
Soils on which trials were carried out are classified as Typic Xerofluvens according to USDA soil taxonomy. In both growing seasons, soil samples were collected at 0–30 cm depth at the beginning of the trial (spring 2021 and spring 2022) for physical and chemical analysis. According to USDA soil texture classes, in both years (2021 and 2022), field trials were characterized by loamy soils with a sub-alkaline pH, good soil organic matter (SOM) content, medium–low levels of total nitrogen content and available phosphorus, and medium–high levels of exchangeable potassium (Table 1). Soil pH determination was performed on a 1:2.5 soil:water suspension following McLean procedure [29]. Electrical conductivity (EC) was measured at 20 °C by using a GLP-31 Crison conductimeter (52.93 electrode) (Montepaone s.r.l., San Mauro Torinese, Torino, Italy). Soil total nitrogen was evaluated using the macro-Kjeldahl digestion procedure [30], available phosphorus by colorimetric analysis using the Olsen method [31], and the cation exchange capacity (CEC) following Mehlich method [32]. The exchangeable K was determined using the Thomas method [33]. Soil organic matter was calculated by multiplying by 1.724 the soil organic carbon concentration, measured using the modified Walkley–Black wet combustion method [34].

2.2. Crop Growth Cycle Monitoring

For each growing season, the crop growth cycle was monitored, and the main phenological phases of camelina, including basal rosette (BBCH 19), beginning of stem elongation (BBCH 31), full flowering (BBCH 65), and seed maturation (BBCH 89), were determined using the extended BBCH scale described by Martinelli and Galasso [35]. In addition, number of days and accumulated growing degree days (GDD) for both years of cultivation (2021 and 2022) were calculated using daily maximum air temperature (Tmax), daily minimum air temperature (Tmin), and base temperature (Tbase) of 4 °C [36], as follows:
GDD = Σ [(Tmax + Tmin)/2 − Tbase]

2.3. Non-Destructive Analysis and Destructive Sampling

Proximal and remote sensing methods, in combination with destructive methods, were carried out when camelina plants were at full flowering stage (BBCH 65) (21 and 12 May, in 2021 and 2022, respectively). In particular, aerial surveys were carried out on two sites of camelina cultivation using the DJI MAVIC 2 PRO drone equipped with a Hasselblad L1D-20C camera and a PARROT SEQUOIA multispectral camera (Parrot Drones S.A.S., Paris, France) with four spectral bands (Green, Red, Red-edge, NIR). The flights were performed at an altitude of 15 m, with an overlap of 80%, and a spatial resolution in terms of pixels on the ground equal to 3.5 mm for the RGB camera and 14 mm for the multispectral camera. The multispectral sensor was calibrated using a calibration panel (provided by the sensor producer), which must be scanned after take-off and before landing to correct the acquired data based on the incident light conditions during the flight. The survey activities were preceded by the identification on the ground, with the use of the total station, of 13 ground control points (GCPs), with known coordinates, useful for the georeferencing of all the surveys in a common reference system (ETRF2000 UTM 32N). These points were then materialized with clearly visible “targets” from drones, useful for the georeferencing of the models and orthophotos obtained from the processing of aerial images. Data obtained from UAV flights were used for the calculation of some vegetation indices (VIs) reported in Table 2.
After aerial surveys, three leaves randomly chosen from three plants for each plot were clipped with a field-portable leaf-clip sensor Dualex® Force-A (Orsay, Cedex, France) for the evaluation of chlorophyll content (μg cm−2), flavonols (Abs unit), anthocyanins (Abs unit), and nitrogen balance index (NBI). This instrument performs simple, fast, and non-destructive measurements acquiring information from the UV absorbance measurement of the leaf epidermis by double excitation of chlorophyll fluorescence [37]. Two measurements for each leaf per plant and per plot were performed on both the adaxial and abaxial sides, with 72 total measurements detected. Chlorophyll and anthocyanin values were obtained as average between adaxial and abaxial sides, while the flavonol value was the sum, and NBI was the ratio between chlorophyll and flavonol values.
Table 2. Vegetation indices (VIs) evaluated in this study.
Vegetation IndicesFormula
Normalized difference vegetation index (NDVI) [38]NDVI = (NIR − RED)/(NIR + RED)
Ratio vegetation index (RVI) [39]RVI = RED/NIR
Transformed normalized difference vegetation index [40]TNDVI = (NIR − RED)/(NIR + RED) + 0.5]1/2
Renormalize difference vegetation index (RDVI) [41]RDVI = (NIR − RED)/(NIR + RED)1/2
Improved modified chlorophyll absorption ratio index (MCARI2) [42]MCARI 2 = 1.5 × [2.5 × (NIR − RED) − 1.3 × (NIR − GREEN)]/{[2NIR + 1]2 − [6NIR − 5 × (RED)1/2] − 0.5}
Modified red edge simple ratio index (MSR705) [43]MSR 705 = (NIR/RED − 1)/(NIR/RED + 1)1/2
Soil adjustment vegetation index (SAVI) [44]SAVI = (NIR − RED) × (1 × L)/(NIR + RED + L); L = 0.5
In order to validate the collected data non-destructively, three fresh leaf discs (Ø 0.8 cm) from each leaf per three plants per plot were sampled immediately after Dualex® Force-A measurements and processed for chlorophyll and carotenoid content according to Lichtentahler and Buschmann [45]. The extraction was carried out in 4 mL of 80% acetone by placing the samples in a cold chamber to reduce the volatility of acetone and in the dark so as not to interfere with chlorophyll activity. Finally, destructive plant samplings (~0.075 m2) were performed for N determination in the different plant organs (stems, leaves, and inflorescences). Fresh weight was measured, and plants subsequently allowed to dry in a ventilated oven (70 °C) for dry weight determination and evaluated for their moisture content. Soil samples were collected in the same area of destructive plant samplings to analyze soil moisture and nitrate concentration (NO3). The soil moisture was calculated with the gravimetric method (samples were weighed twice before and after oven drying at 60 °C until constant weight). NO3 content was determined on the same samples taken to monitor soil moisture by pooling the first three (0–30 cm) and the last two (30–50 cm) layers. The ion chromatography method was used (Dx-500 ion chromatograph; Dionex, Sunnyvale, CA, USA).

2.4. Image Processing

The RGB and multispectral images of experimental field plots acquired from the UAVs were orthorectified and mosaicked using Agisoft Photoscan Professional Edition 1.1.6 (Agisoft LLC, St. Petersburg, Russia) in order to correct the possible perspective deformations of the single frames. Finally, subsets of the orthomosaics were created by isolating the various test plots using Erdas Imagine software by Hexagon AB. The RGB images of the textures were then processed using Canopeo, which analyzes the images using color values in the red (R), green (G), and blue (B) system and classifies all the pixels according to three selection parameters: R/G, B/G, and the green excess index (GEI = 2G-R-B) [46,47,48,49]. The primary image was transformed into a binary image depending on whether or not the pixels met the selection criteria (R/G < 0.95, B/G < 0.95, and GEI > 20, default values). The final result of the image processing is, therefore, a percentage index of FGCC (fraction green canopy cover), which expresses the number of pixels complying with the aforementioned parameters and which are therefore classified as green, with respect to the number of total pixels. The multispectral images were processed using the Erdas Imagine 2020 software, a tool for geospatial digital image processing developed by Hexagon AB [50].

2.5. Crop Production and Yield Component

Camelina plants were harvested by manually sampling 7 rows from the central portion of each plot for a length of 1.5 m (sampling area = 1.58 m2) at full seed ripening, when more than 90% of siliques were dried and turned brown, and most seeds were reddish-brown in color (seed moisture ≤ 12%, BBCH 89). Spring-sown camelina were harvested on 24 and 20 June, in 2021 and 2022, respectively. Plant density, plant height, branching, aboveground biomass dry weight (stems, empty siliques, and seeds), seed yield, and yield components (number of siliques, number of seeds per silique, 1000-seeds weight) were evaluated. To assess seed yield, the plants were threshed by a fixed machine, using sieves suitable for small seeds. Fresh weight was measured, and plants subsequently allowed to dry in a ventilated oven (70 °C) for dry weight determination and evaluated for their moisture content. The harvest index (HI), an important trait associated with crop yields and the successful partitioning of photosynthates to harvestable products, was calculated by dividing dry seed weight by the dry weight of total aboveground biomass.
Thousand seed weight (TSW, g DW) was also assessed at the Seed Research and Testing Laboratory of DAFE on representative seed samples deriving from each plot according to the International Rules for Seed Testing [51]. The content of N (determined by macro-Kjeldahl digestion procedure) in the different plant organs (stems, straw, and seeds) was also evaluated. Fresh weight was measured, and plant organs subsequently allowed to dry in a ventilated oven (70 °C) for dry weight determination and evaluated for their moisture content. Moreover, Agronomic Efficiency of applied Nitrogen (AE, kg seed yield per kg N applied) was calculated as the difference between the seed yield of treatments with N and the achene yield of the non-fertilized control, divided by the N rate applied. Apparent recovery efficiency (ARE) is defined as the difference in N accumulation between plots receiving fertilizer and unfertilized plots and is in proportion to the amount of N fertilizer applied. AE and ARE indices were then calculated with the following equations [52,53]:
A E = f e r t i l i z e d p l o t s e e d y i e l d   k g h a 1 u n f e r t i l i z e d p l o t s e e d y i e l d   [ k g h a 1 ] N f e r t i l i z a t i o n   [ k g N h a 1 ]
A R E = f e r t i l i z e d p l o t N u p t a k e   k g N h a 1 u n f e r t i l i z e d p l o t N u p t a k e   [ k g N h a 1 ] N f e r t i l i z a t i o n   [ k g N h a 1 ]
where N uptake was computed by multiplying biomass yield per N tissue concentration.

2.6. Seed Quality

Seed oil and protein contents were determined on representative samples from each plot. Oil content was determined using a Soxhlet extractor apparatus (mod. R 306) from Behr Labor-Technik (Düsseldorf, Germany). Briefly, about 30 g of camelina seeds were finely ground in a coffee grinder for 40 s. An aliquot of 1.5 g of ground material was exactly weighed in a cellulose extraction thimble (22 mm × 80 mm) from Axiva Sichem Biotech (Delhi, India). The thimble was successively inserted in a glass extractor, and oil extraction was carried out for two hours in a Soxhlet extractor using 60 mL of n-hexane as an organic solvent. The extract containing the oily fraction was then filtered with anhydrous sodium sulfate in a 100 mL flat bottom flask and removed under reduced pressure at 30 °C in a rotary evaporator. The residual oil was dried under a gentle nitrogen flow for 5 min with the flask in a water bath (50–55 °C), exactly weighed, transferred by means of 5 mL of n-hexane/i-propanol 4/1 (v/v) in a 10 mL Teflon screw-cap glass tube, and stored at −18 °C. Solvents used were of analytical grade. Oil yield (kg DM ha−1) was obtained by multiplying seed yield by seed oil content of each individual replicate. Seed crude protein content was calculated by multiplying the total nitrogen percentage by 6.25, and total N content was determined by means of the mini-Kjeldahl method on different plant organs (stems, empty siliques, and seeds).

2.7. Statistical Analysis

Data were subjected to statistical analysis using the software COSTAT cohort V6.201 (2002). Before ANOVA, Levene’s test was used to verify homoscedasticity, and Shapiro–Wilk test was used to check the normal distribution of residuals. A two-way ANOVA for evaluating the effects of growing season (2021 vs. 2022) and the different N fertilization regimes (control, T0, T1, T2, and T3) on agronomic and qualitative parameters were performed. Means were compared using Tukey’s HSD test when ANOVA F-test was significant at p ≤ 0.05. For each year, Pearson’s correlation coefficients were computed between VIs and Dualex chlorophyll and seed yield, leaf chlorophyll, and leaf N concentration.

3. Results

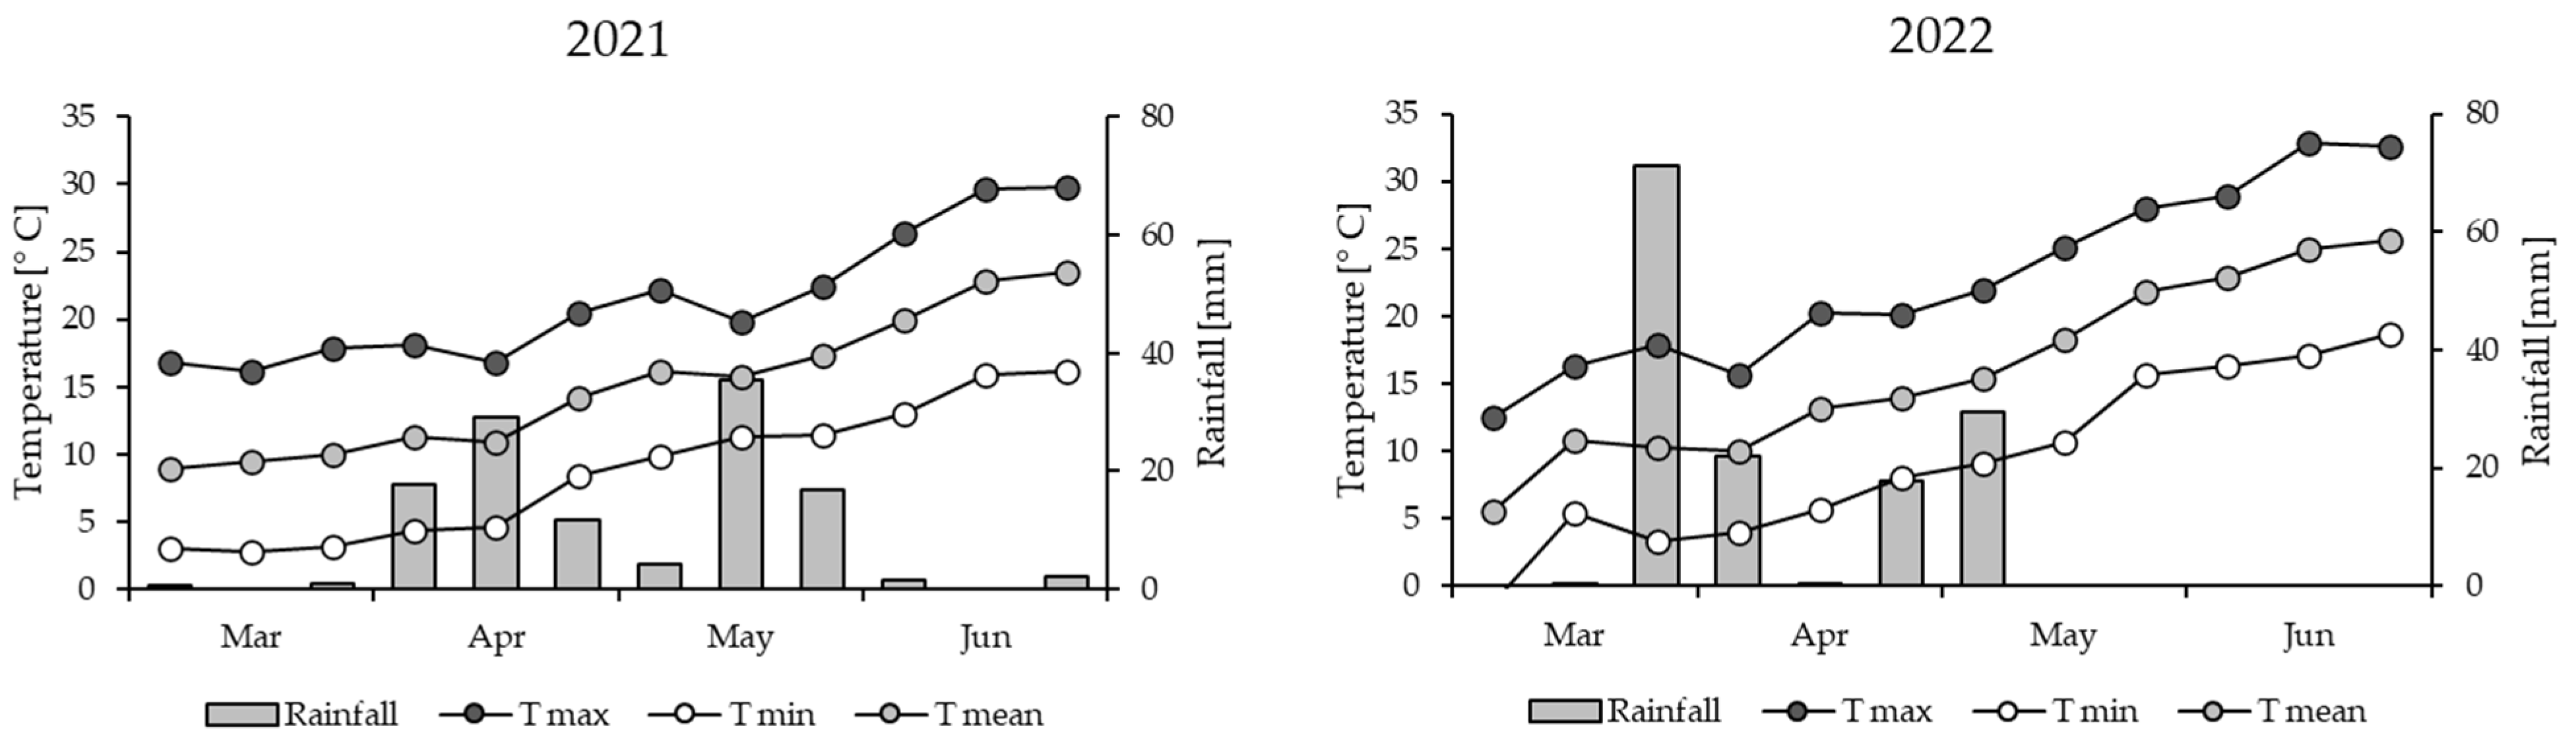
3.1. Meteorological Data and Crop Phenology

Weather conditions recorded over the study timespan are reported in Figure 1. The average minimum and maximum temperatures referring to the camelina growing period (from March to June) were very similar for both years, with a minimum of 8.7 °C and 9.6 °C, and a maximum of 21.4 °C and 21.8 °C in spring 2021 and 2022, respectively. In the first growing season, the increase in temperature occurred in the third decade week of April 2021, while in the second growing season, temperatures started to rise significantly from the second decade of April 2022. A shortening of about 10 days in the vegetative growth phase of the second year of experimentation was induced by the differences in the trend of average temperatures (Table 3). In the first growing season (spring 2021), cumulative rainfall and the GDD from sowing to seed maturity were equal to 117.9 mm and 1195.2, respectively, while in the second growing season (2022), they were 140.8 mm and 1241.9 GDD, respectively. A few days of cycle length discern the two spring sowings; in fact, the plants completed their growth cycle in 109 and 105 days in 2021 and 2022, respectively (Table 3).

3.2. Vegetation Indices (VIs)

Results of the statistical two-way analysis (F-Test, ANOVA), related to the effects of year (Y) and N fertilization regimes (F) and their interaction (Y × F), are reported in Table 4. The effect of the year (Y) was significant for the indices NDVI, RVI, TNDVI, WvVI, MSR705, SAVI, and FGGC calculated on the images acquired from the drone. While the effect of N fertilization (F) was statistically appreciable only for NDVI, MSR705, and FGGC, the interaction between year and fertilization was significant only for NDVI.

3.3. Dualex Detection and Destructive Samplings

The effects of year (Y) and N fertilization (F) and their reciprocal interactions were evaluated on Dualex parameters and on destructive samplings. In particular, flavonols and NBI values detected by the Dualex leaf-cleap sensor were significantly affected by the year, and only flavonols were also affected by the Y x F interaction (Table 5). Specifically, the flavonols showed an average value of the different N fertilizers higher than T0 in the first year (+17.4%). T0, in the second year, instead, showed the highest value (+21.34%) compared to the average of all other N fertilizers, except for T1. Furthermore, the NBI detected in 2021 showed an average value higher (+12.4%) than in 2022.
Regarding destructive samplings, a significant effect of both Y and F and their reciprocal interaction was also observed in the content of chlorophylls and carotenoids deriving from spectrophotometric assays with some exceptions, as reported in Table 5. Specifically, chlorophyll a content was higher at the top dressing in the second year: T2 (+36.2%) and T3 (+32.3%). T0 and T2 in 2022, despite having lower values, were, on average, higher (+39%) than all fertilizers in 2021. The concentration of chlorophyll b, on the other hand, was, on average, higher in the second year (+41%), with T1 and T2 exhibiting higher average values (+12.9%) than T0 and T3. The concentration of carotenoids was, on average, higher in T0 and T2 in 2022 (+13.9%) than in T1 and T3 and compared to the average in 2021 (+69%).
Soil moisture and nitrate concentration were only affected by the year, while total aboveground biomass produced by the crop was significantly affected by both Y and F, as well as by their reciprocal interaction (Table 5). In particular, soil moisture percentage was higher in 2022 (+17%) compared to 2021, and nitrate concentration was also higher in the second year of the experimentation (+42.5%) than in the first one.

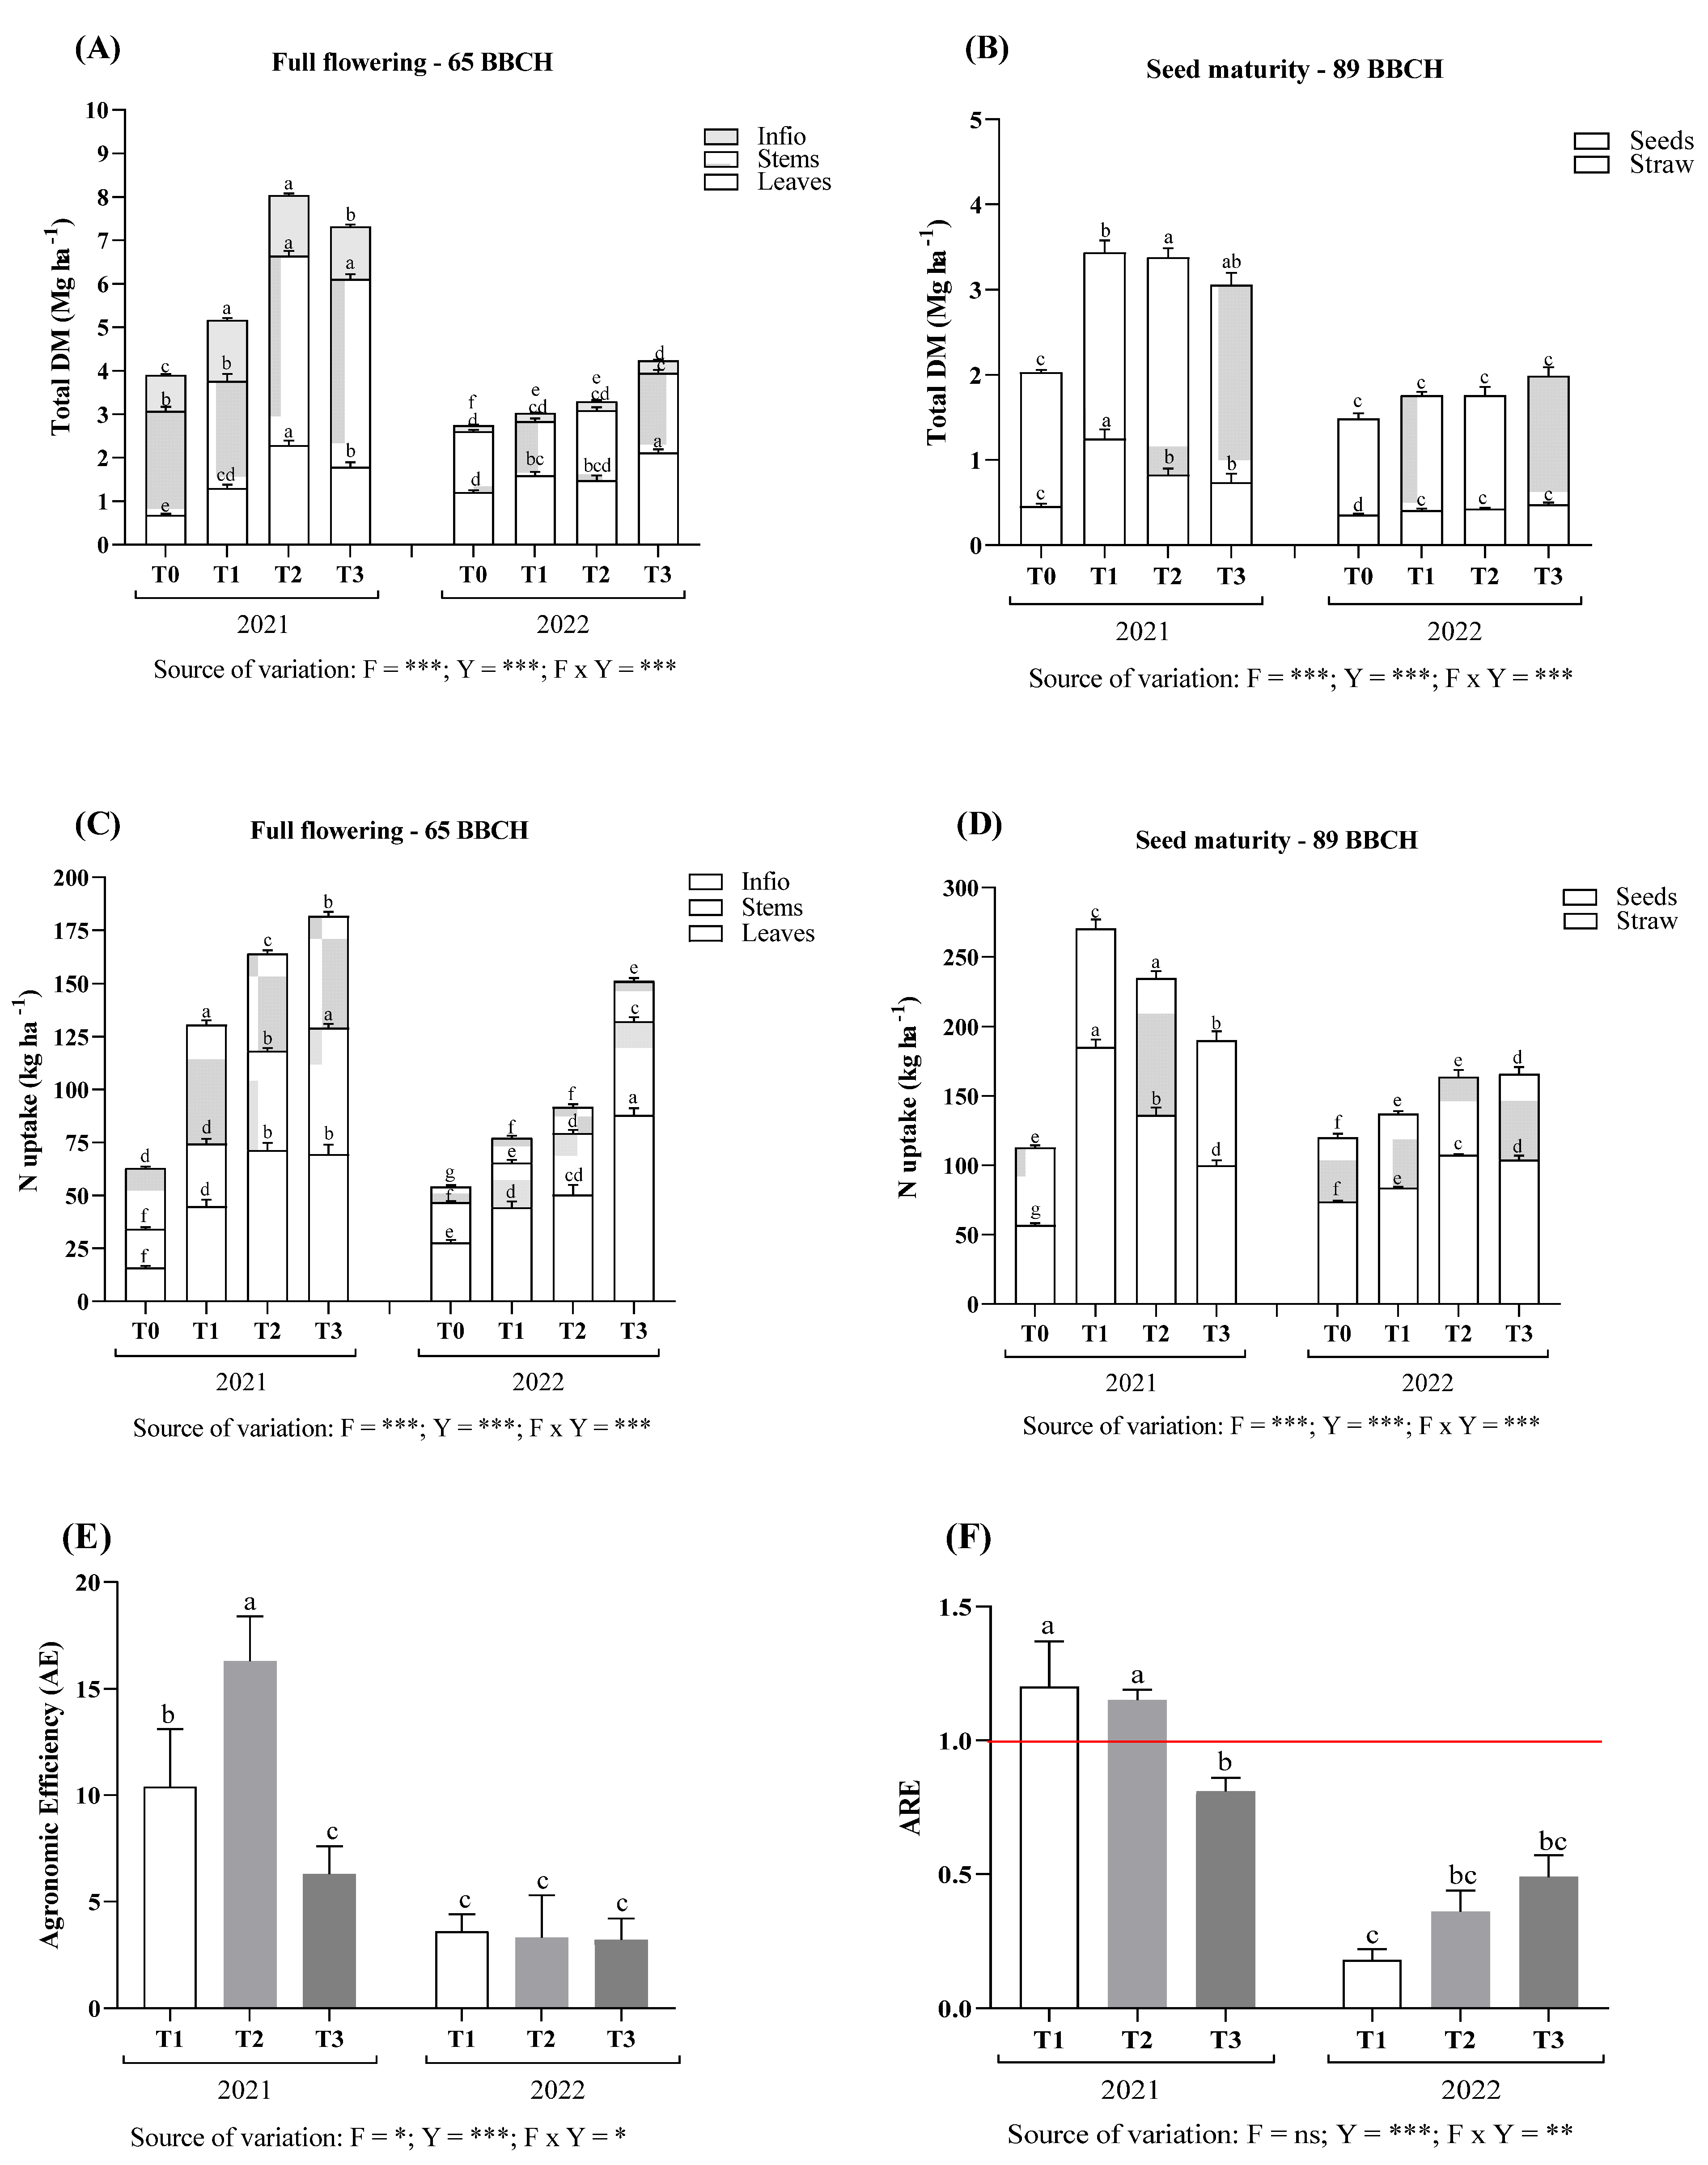
3.4. Dry Matter Accumulation and Nitrogen Uptake

At full flowering, the total aboveground biomass was significantly higher in 2021 (+43%) than in 2022 (Figure 2A). Considering the dry matter partitioned in the different organs, camelina plants produced more stems and inflorescences in 2021 than in 2022, except for leaf biomass production. In fact, T2 (2021) and T3 (2022) produced more leaves than the other treatments. Among these, all N fertilizer treatments were more productive than the control in two years (Figure 2A). At seed maturity, camelina plants produced more total aboveground biomass at harvest when they were treated with top-dressing N fertilizer (T1) and with basal + top dressing combination (T3) in 2021 (+41%) and 2022 (+23.5%) compared to the other respective treatments. Nevertheless, 2021 showed clearly higher average values of biomass produced than those of 2022 (+45.5%) (Figure 2B).
Total N uptake by camelina plants when they were at full flowering, was higher in 2021 (+33%), with a better distribution of N uptake among organs (leaves, stems, and inflorescences) than in 2022 (Figure 2C). At seed maturity, in the first year of cultivation, camelina plants treated with N fertilization showed an average N straw uptake higher (+30%) than in the second one, although the control showed an opposite trend. Additionally, N seed uptake was also higher in 2021 (+37.4%) compared to 2022 if considering the different N fertilizer levels (Figure 2D).
Agronomic efficiency (AE), described as the economic production obtained per unit of nitrogen applied, was significantly highest in 2021 and when the plants were treated with N-fertilizer at sowing (T2) followed by top-dressing N-fertilizer (T1) (Figure 2E). Furthermore, the apparent recovery efficiency (ARE), commonly defined as the difference in nutrient uptake in aboveground parts of the plant between the fertilized and unfertilized crop relative to the quantity of nutrients applied, was significantly higher in 2021 when plants were treated with N-fertilizer both at sowing and top-dressing (Figure 2F).

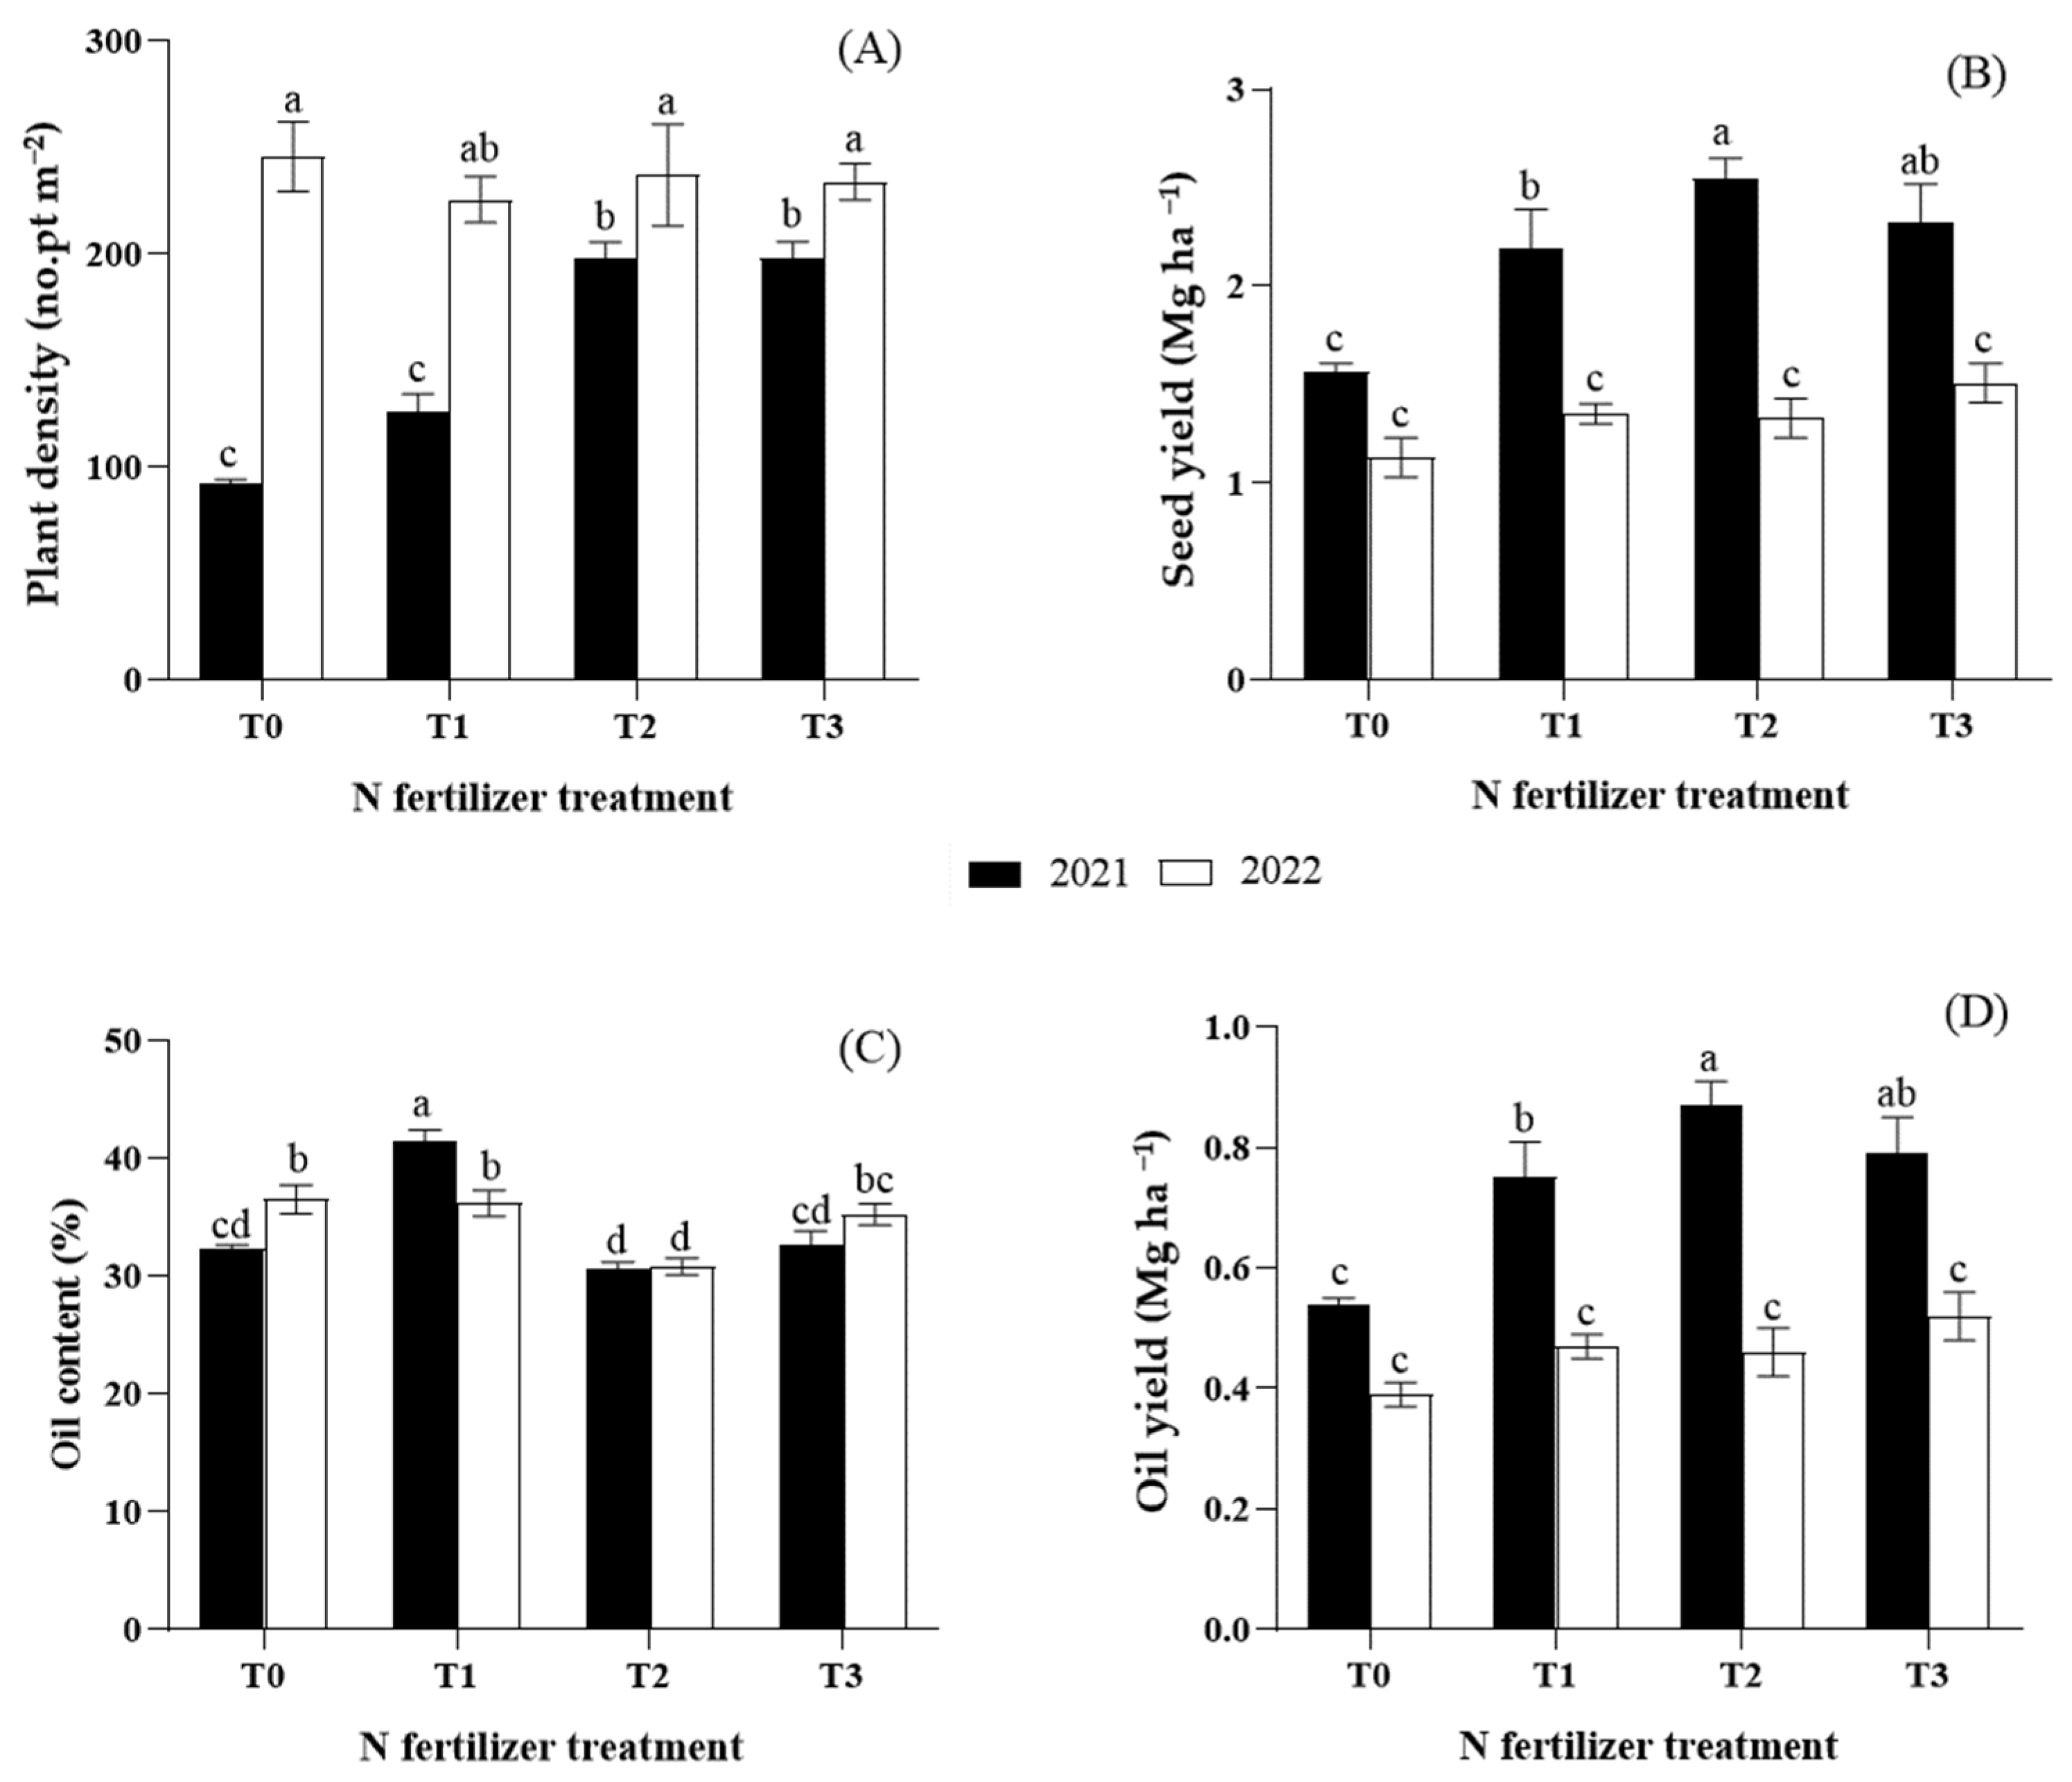
3.5. Yield, Yield Components, and Seed Quality

The effects of year (Y) and N fertilization (F) and their reciprocal interaction were evaluated on different agronomic and seed qualitative characteristics, as reported in Table 6. The results obtained showed that plant height was significantly influenced by both Y and F, with the highest values recorded in camelina plants in the first year of experimentation, with an average of 13 cm taller compared to the second year. No differences in plant height were observed between the T0 and T1 treatments, although both were smaller (−9.2 cm) than the T2 and T3. Furthermore, a significant effect of the year (Y) was highlighted, while N fertilization was significant only for plant density, branching, and number of siliques per plant. For plant density, a statistically significant interaction between the year and N fertilization was found. In addition, except for plant density, a significant decrease in branching (−0.8 stems per plant), siliques per plant (−11.1 siliques), seeds per silique (−0.8 seeds), and TSW (−3.7%) were observed in the second growing season (2022). In N fertilized plots, the application of 60 + 60 kg N ha−1 (T3) increased branching on average of +16.6%, +33.6%, and +48.5% compared to T2, T0, and T1, respectively, while no statistical differences with the application of 60 kg N ha−1 (T2) and control (T0) was observed. In the first year, only T2 had a higher plant density compared to the untreated control, while in the second year, no significant differences emerged between N fertilizer treatments and control (Figure 3A). Considering the seed yield, a significant effect of both year of cultivation (Y) and N fertilizer treatment (F) and their reciprocal interaction was observed (Table 6). Camelina crop produced a higher seed yield in the first year (+38%) with respect to the second one. All the fertilizer treatments showed higher seed yield (1.9 Mg ha−1 as the average value) compared to the control (1.4 Mg ha−1) (Table 6). By the Y x F interaction, the N fertilizer showed, only in 2021, the highest seed yield (2.4 Mg ha−1) compared to the control and all the treatments in 2022 (Figure 3B).
No statistical difference between the two years of cultivation was observed in the oil content, although it was affected by N fertilization, with the highest value achieved when camelina plants were top-dressing fertilized (T1), as reported in Table 6 and Figure 3C. Regarding oil yield, a significant effect of both Y and F, as well as of their interaction (Y × F), was observed (Table 6). In particular, camelina produced a higher oil yield in 2021 (+38%) compared to 2022, with an average value of the different N fertilizer treatments higher (+29%) than the control (Figure 3D). Finally, a significant effect of both Y and F was observed on the crude protein content (Table 6). Specifically, a slight increase (+6%) was observed in 2022 compared to 2021, with the highest value obtained when camelina plants were treated with basal + top dressing N fertilizer (T3) (25.3%), followed by T1 (24.8%) and T2 (24.4%).

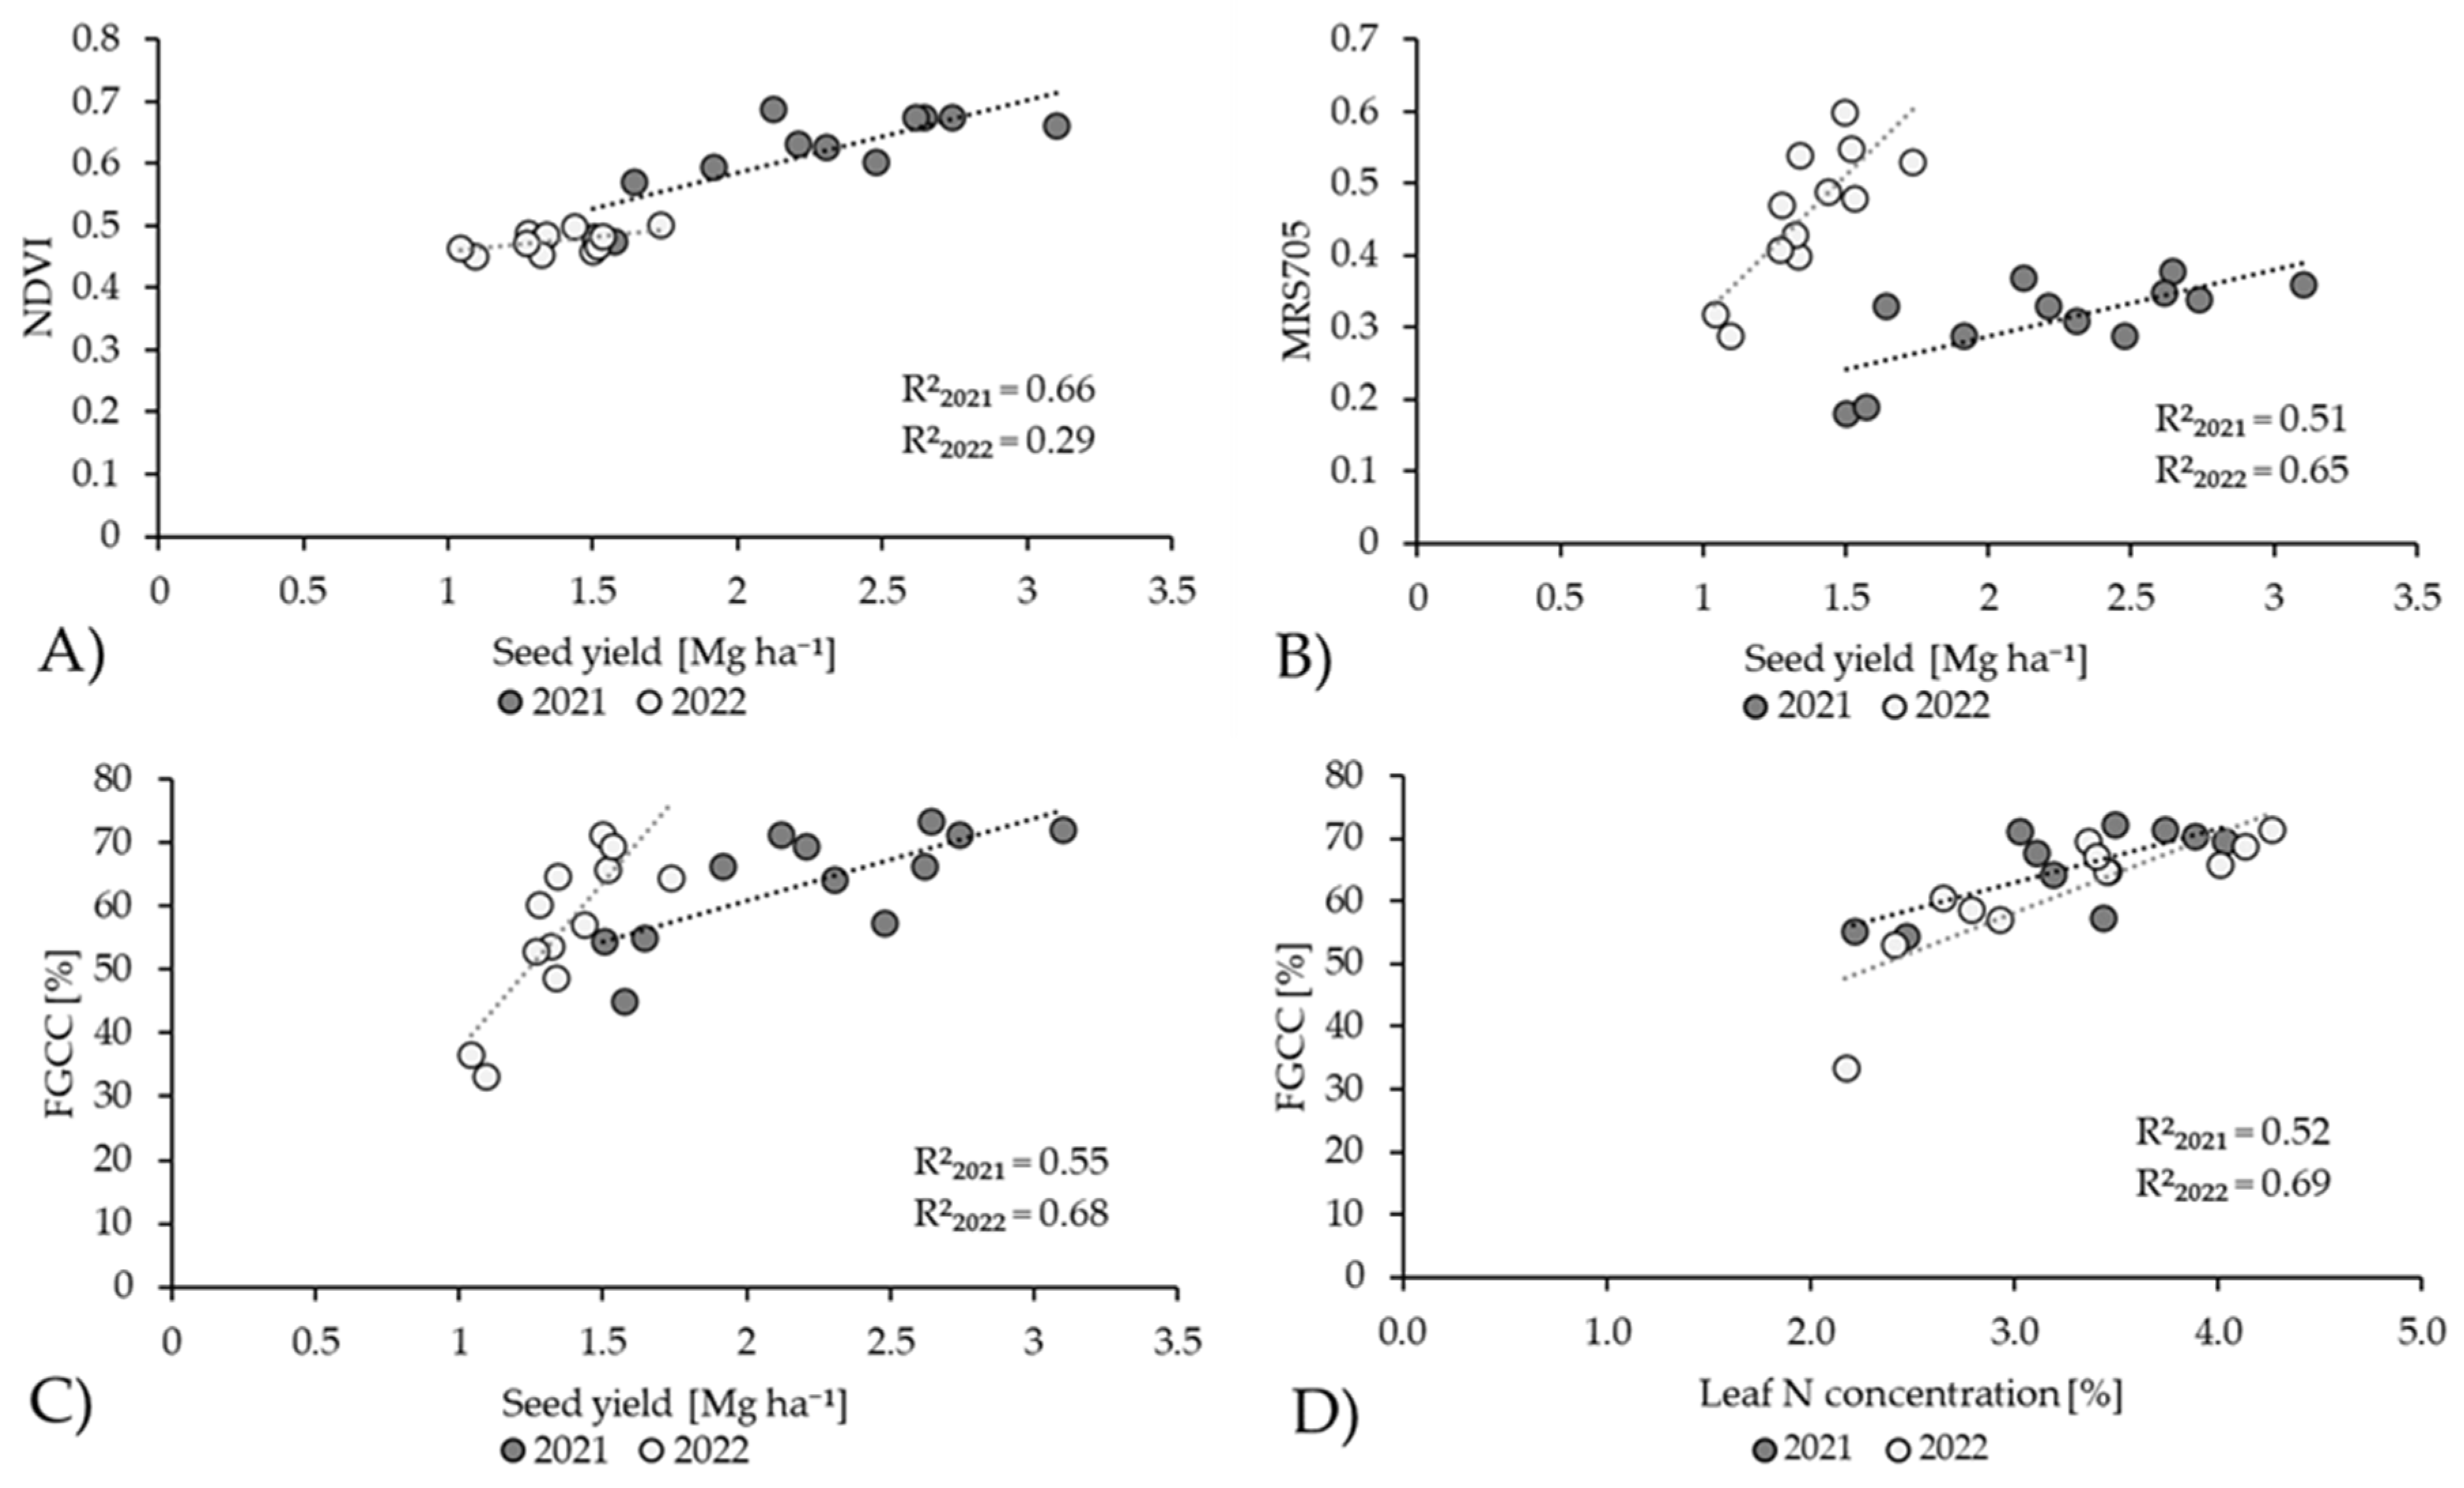
3.6. Correlation Analysis

The vegetation indices (VIs) calculated on the spectral data acquired from the drone and chlorophyll obtained with Dualex leaf-clip sensor were correlated with the seed yield, leaf laboratory chlorophyll content, and leaf N concentration (Table 7). During the first year of experimentation (2021), a significantly high level of positive correlation was obtained by NDVI, TNDVI, MSR705, and FGCC indices (0.81, 0.73, 0.72, and 0.74, respectively), followed by WvVi (r = 0.67) and SAVI (0.64), while only RVI showed negative correlation (−0.69). The MCARI2 index, on the other hand, was not significantly correlated to the seed yield. In the second year of experimentation (2022), however, only MSR705 (r = 0.80) and FGCC (r = 0.82) indices had a good level of correlation, followed by NDVI (r = 0.53). The other indices were not significantly correlated with camelina seed yield. The only indices significantly correlated with seed yield in both years of experimental trials (Figure 4) were NDVI (Figure 4A), MSR705 (Figure 4B), and FGCC (Figure 4C), with the latter presenting higher significance values on average. The correlation analysis between the same vegetation indices previously mentioned and the chlorophyll leaf content obtained by the spectrophotometric method did not reveal significantly good correlations for any of the parameters analyzed (Table 7). Low correlation levels in the first year of camelina cultivation (2021) were recorded on NDVI and MCARI2, which, however, were not statistically acceptable (r < 0.52). In the first growing season, leaf N concentration was significantly and positively correlated with NDVI (r = 0.68) and FGCC (r = 0.72), while in the second growing season, a strong positive correlation was found with MSR705 (r = 0.90) and FGCC (r = 0.83). However, only FGCC was found to have a significant correlation with foliar N at full flowering in both years of the trials (Figure 4D). A significant correlation was highlighted by Dualex with seed yield in the first year of cultivation (2021) (r = 0.50) and with leaf chlorophyll content in 2021 (r = 0.51). A non-significant correlation was confirmed, instead, in 2022. During the first growing season, a significant positive correlation was found between leaf N concentration and Dualex chlorophyll; however, this correlation was not found during the second growing season.

4. Discussion

The use of remote sensing has proved to be a valid tool for estimating the seed production of camelina. In fact, the NDVI, MSR 705 indices, and FGCC% showed good levels of correlation with the recorded seed yields. In line with what has been reported in other works [54,55,56], the NDVI was significantly correlated with the grain yield in a linear positive way, with a Pearson coefficient equal to 0.81 in the first year of the trial and 0.53 in the second. While the MSR705 index, although not significantly correlated with the leaf chlorophyll content, as reported in other works [43,57,58], is instead significantly correlated with the grain yield of the crop in 2021 (r = 0.72), more than in 2022 (0.80). The FGCC%, derived from Canopeo measurements, is a widely used tool for estimating biomass production [59,60], but there are still few works that use this data to predict grain production [61]. In this trial, a good correlation was found between FGCC and seed yield, in agreement with what was reported by other authors [61,62]. Considering the low cost necessary to calculate this data, from an application point of view, it would seem to be the best among those proven to be reliable. In our study, FGCC was the only VIs capable of providing an indication of camelina nutritional status since it was correlated with leaf N concentration. In the literature, it is reported that the use of FGCC for yield prediction can be obtained with greater precision during the reproductive phase [63], in line with our results. However, for agronomic purposes, the most useful phase for the determination of nutritional stress is during vegetative development in order to adequately calibrate top-dressing fertilization. In this regard, further studies are needed to verify whether the identified index (FGCC) can give reliable indications of camelina nutritional status even during early vegetative phases.
In our trials, meteorological differences among growing seasons were not remarkable; however, in the second year, the increase in air temperatures during spring occurred almost 10 days earlier compared to 2021. It is likely that the rise in temperatures caused the reduction in vegetative development length, with negative effects on the accumulation of vegetative biomass. Consequently, the decrease in photosynthesizing biomass probably contributed to the reduction in seed yield observed in the second growing season. Anyhow, the overall duration of plant development and GDD accumulation are comparable to those already reported in the literature for spring-sown camelina in Central Italy [26]. In the first-year trial, all yield components of camelina gave better results, and this was probably partially due to the rainfall that occurred during the reproductive phase. Therefore, water availability in this phase could have contributed to reducing potential water deficit and improving yield component performances. It has been observed that the occurrence of post-anthesis water stress conditions can lead to negative effects on yield components in various crops, such as rapeseed [64], chickpea [65], and wheat [66]. Secchi et al. [67] reported that in Brassica napus L., water stress during pod formation has a higher negative effect on the number and weight of seeds. In camelina, it has been observed that the absence of water availability or irrigation can induce a decrease in the number of siliques and branching per plant [68]. Similarly, in our trials, the number of siliques per branch showed a higher drop in the second year in comparison with the other yield components. Although there may have been an effect of early temperature rise and post-anthesis water stress during the second growing season, it is not possible to establish to what extent each of these factors influenced seed yield or individual yield components. These two stress events occurred in different periods of plant development, and, to the best of our knowledge, no research describes the sequence and timing of yield component formation in camelina. In this regard, further investigations on the production physiology of camelina are needed. In both years of our study, the increase in N dose from 60 to 120 kg N ha−1 did not lead to a significant increase in the seed yield, although it had a positive effect on the branching level. However, it is reported that camelina can be responsive to N inputs up to 300 kg N ha−1 [69]. Probably, in our study, when the environmental conditions were less favorable, as in the second growing season, the effect of nitrogen fertilization on total aboveground biomass, seed yield, and yield components was deleted. Coherently to Jankowsky et al. [70], in our study, the agronomic efficiency of fertilization in camelina varies between the two years, dropping dramatically during the second growing season. Bronson et al. [71] reported that in camelina, fertilizer agronomic efficiency can be influenced by soil water level, so the AE differences observed in our study between the two growing seasons could be attributed to different rainfall patterns. In addition, AE was not influenced by the N application rate, differently from that observed by Jankowsky et al. [70], who reported that fertilization agronomic efficiency started to decrease from the distribution of 80 kg N ha−1. Similar to our findings, Allen et al. [72], in a 5-year trial, reported that in the Brassicaceae taxon, ARE (named nitrogen recovery index) varied among growing seasons, and for camelina, an average value of 0.3 was detected. Similarly, Afchar et al. [73] observed an increase in the apparent efficiency of nitrogen use in the growing seasons characterized by more favorable conditions for rainfed camelina growth. Contrarywise, in Mahli et al. [74], environmental factors (site–year) did not affect ARE (named percent recovery of applied N). During the first year, high values of ARE were reached, even exceeding the threshold value of 1.0, indicating a condition in which N removals exceeded the N distribution. On the contrary, in the second year, environmental conditions reduced plant development, at the same time decreasing N uptake deriving from fertilization in all fertilized plots, and probably leaving some unused N in the soil, likely to be lost in the environment via leaching. A reduction in root uptake during the second year is confirmed by soil analysis carried out at flowering, which showed an increase in the presence of N and moisture observed compared to the first growing season. This further underlines the necessity of identifying new methodologies to assess the crop nutritional status, also in terms of early seed yield prediction, to properly calibrate top-dressing fertilization. Finally, the oil content measured in our trials resulted in slightly lower values compared to those measured for spring-sown camelina in Central Italy [26], but nonetheless, in line with values (range 28 to 49% DM) obtained from camelina spring cultivation in Central Europe [75]. As expected, while the highest seed oil content was achieved at T1, the protein content increased with increasing N with the highest values at T3. With regard to the protein content (%), even if in previous studies values up to 32% [21] have been found, our results showed an average value of around 25%, which, however, was good and comparable.

5. Conclusions

Our results confirmed the low productive stability of camelina in the Mediterranean areas and highlighted how the effect of nitrogenous fertilization is dependent on meteorological conditions, especially for spring sowings.
Aside from these evaluations, the further value of this study is for demonstrating the possibility of applying remote and proximal techniques to camelina cultivation, with particular attention to N management. This aspect is of fundamental importance for optimizing agronomic management and for increasing cropping system sustainability and quality. Among the different N fertilization rates and timing tested in the present study, satisfactory seed yields and high NUE, as well as good seed oil content, were reached with the application of 60 kg N ha−1 before sowing in spring camelina.
We find that UAV-derived vegetation indices during flowering are a good seed yield predictor in camelina. In particular, FGCC was the only VIs capable of providing an indication of camelina nutritional status. Anyway, further studies are needed to verify whether the UAV-derived VIs can give reliable indications on camelina nutritional status even during early vegetative phases. Although preliminary, these results can help in developing proper strategies for N application rates for camelina and for site-specific recommendations for its cultivation in Central Italy.

Author Contributions

Conceptualization, S.T., N.S. and L.G.A.; methodology, S.T., N.S. and L.G.A.; software, L.F., N.G., C.C. and L.E.; formal analysis, C.C., A.R. and L.E.; investigation, C.C., A.R. and L.E.; resources, S.T., N.S. and L.G.A.; data curation, C.C., A.R., L.E., L.F. and N.G.; writing—original draft preparation, all authors; writing—review and editing, all authors; visualization, S.T., C.C., A.R. and L.E.; supervision, S.T., N.S. and L.G.A.; project administration, S.T., N.S. and L.G.A.; funding acquisition, S.T., N.S. and L.G.A. All authors have read and agreed to the published version of the manuscript.

Funding

This research was partially funded by the Research Project of National Relevance—PRIN2017 LZ3CHF_001 “ARGENTO—Agronomic and genetic improvement od camelina for sustainable poultry feeding and healthy food products”. Furthermore, this study was carried out partly within the (i) Agritech National Research Center and received funding from the European Union Next-Generation EU (PIANO NAZIONALE DI RIPRESA E RESILIENZA (PNRR)—MISSIONE 4 COMPONENTE 2, INVESTIMENTO 1.4—D.D. 1032 17/06/2022, CN00000022) and within (ii) the PE NEST—Network 4 Energy Sustainable Transition, SPOKE 3 Bioenergy and New Biofuels for a Sustainable Future, funding from the European Union Next-Generation EU (PIANO NAZIONALE DI RIPRESA E RESILIENZA—PNRR)—Mission 4 Component 2 Investment 1.3—D.D. 341 del 15/03/2022, PE0000021). This manuscript reflects only the authors’ views and opinions; neither the European Union nor the European Commission can be considered responsible for them.

Data Availability Statement

The data presented in this study are available on request from the corresponding author.

Conflicts of Interest

The authors declare no conflict of interest. The funders had no role in the design of the study; in the collection, analyses, or interpretation of data; in the writing of the manuscript, or in the decision to publish the results.

References

  1. Khan, N.; Ray, R.L.; Sargani, G.R.; Ihtisham, M.; Khayyam, M.; Ismail, S. Current Progress and Future Prospects of Agriculture Technology: Gateway to Sustainable Agriculture. Sustainability 2021, 13, 4883. [Google Scholar] [CrossRef]
  2. Feng, W.; Guo, B.B.; Wang, Z.J.; He, L.; Song, X.; Wang, Y.H.; Guo, T.C. Measuring leaf nitrogen concentration in-winter wheat using double-peak spectral reflection remote sensing data. Field Crops Res. 2012, 159, 43–52. [Google Scholar] [CrossRef]
  3. Nasar, J.; Khan, W.; Khan, M.Z.; Gitari, H.I.; Gbolayori, H.F.; Moussa, A.A.; Mandozai, A.; Rizwan, N.; Anwari, G.; Maroof, S.M. Photosynthetic Activities and Photosynthetic Nitrogen Use Efficiency of Maize Crop Under Different Planting Patterns and Nitrogen Fertilization. J. Soil Sci. Plant Nutr. 2021, 21, 2274–2284. [Google Scholar] [CrossRef]
  4. Mahmud, K.; Panday, D.; Mergoum, A.; Missaoui, A. Nitrogen Losses and Potential Mitigation Strategies for a Sustainable Agroecosystem. Sustainability 2021, 13, 2400. [Google Scholar] [CrossRef]
  5. Li, Z.; Cui, S.; Zhang, Q.; Xu, G.; Feng, Q.; Chen, C.; Li, Y. Optimizing wheat yield, water, and nitrogen use efficiency with water and nitrogen inputs in China: A synthesis and life cycle assessment. Front. Plant Sci. 2022, 13, 930484. [Google Scholar] [CrossRef]
  6. He, L.; Zhang, H.Y.; Zhang, Y.S.; Song, X.; Feng, W.; Kang, G.Z.; Wang, C.Y.; Guo, T.C. Estimating canopy leaf nitrogen concentration in winter wheat based on multi-angular hyperspectral remote sensing. Eur. J. Agron. 2016, 73, 170–185. [Google Scholar] [CrossRef]
  7. Esteves, E.; Locatelli, G.; Bou, N.A.; Ferrarezi, R.S. Sap Analysis: A Powerful Tool for Monitoring Plant Nutrition. Horticulturae 2021, 7, 426. [Google Scholar] [CrossRef]
  8. Guo, B.B.; Qi, S.L.; Heng, Y.R.; Duan, J.Z.; Zhang, H.Y.; Wu, Y.P.; Feng, W.; Xie, Y.X.; Zhu, Y.J. Remotely assessing leaf N uptake in winter wheat based on canopy hyperspectral red-edge absorption. Eur. J. Agron. 2017, 82, 113–124. [Google Scholar] [CrossRef]
  9. Luisa España-Boquera, M.; Cárdenas-Navarro, R.; López-Pérez, L.; Castellanos-Morales, V.; Lobit, P. Estimating the nitrogen concentration of strawberry plants from its spectral response. Commun. Soil Sci. Plant Anal. 2006, 37, 2447–2459. [Google Scholar] [CrossRef]
  10. Sishodia, R.P.; Ray, R.L.; Singh, S.K. Applications of Remote Sensing in Precision Agriculture: A Review. Remote Sens. 2020, 12, 3136. [Google Scholar] [CrossRef]
  11. Weiss, M.; Jacob, F.; Duveiller, G. Remote sensing for agricultural applications: A meta-review. Remote Sens. Environ. 2020, 236, 111402. [Google Scholar] [CrossRef]
  12. Mezera, J.; Lukas, V.; Horniaček, I.; Smutný, V.; Elbl, J. Comparison of Proximal and Remote Sensing for the Diagnosis of Crop Status in Site-Specific Crop Management. Sensors 2022, 22, 19. [Google Scholar] [CrossRef]
  13. Berger, K.; Verrelst, J.; Féret, J.B.; Wang, Z.; Wocher, M.; Strathmann, M.; Danner, M.; Mauser, W.; Hank, T. Crop nitrogen monitoring: Recent progress and principal developments in the context of imaging spectroscopy missions. Remote Sens. Environ. 2020, 242, 111758. [Google Scholar] [CrossRef]
  14. Zhang, J.; Zhang, D.; Cai, Z.; Wang, L.; Wang, J.; Sun, L.; Fan, X.; Shen, S.; Zhao, J. Spectral technology and multispectral imaging for estimating the photosynthetic pigments and SPAD of the Chinese cabbage based on machine learning. Comput. Electron. Agric. 2022, 195, 106814. [Google Scholar] [CrossRef]
  15. Kamarianakis, Z.; Panagiotakis, S. Design and Implementation of a Low-Cost Chlorophyll Content Meter. Sensors 2023, 23, 2699. [Google Scholar] [CrossRef]
  16. Zarco-Tejada, P.J.; Berjon, A.; Lopez-Lozano, R.; Miller, J.R.; Martin, P.; Cachorro, V.; Gonzalez, M.R.; de Frutos, A. Assessing vineyard condition with hyperspectral indices: Leaf and canopy reflectance simulation in a row-structured discontinuous canopy. Remote Sens. Environ. 2005, 99, 271–287. [Google Scholar] [CrossRef]
  17. Fang, H.; Liang, S. Reference Module in Earth Systems and Environmental Sciences. In Encyclopedia of Ecology; Elsevier Reference Collection; Elsevier: Amsterdam, The Netherlands, 2014; pp. 2139–2148. ISBN 978-0-12-409548-9. [Google Scholar]
  18. Liu, S.; Li, L.; Fan, H.; Guo, X.; Wang, S.; Lu, J. Real-time and multi-stage recommendations for nitrogen fertilizer topdressing rates in winter oilseed rape based on canopy hyperspectral data. Ind. Crops Prod. 2020, 154, 112699. [Google Scholar] [CrossRef]
  19. Amiri, M.; Pourghasemi, H.R. Mapping the NDVI and monitoring of its changes using Google Earth Engine and Sentinel-2 images. In Computers in Earth and Environmental Sciences in: Artificial Intelligence and Advanced Technologies; Elsevier: Amsterdam, The Netherlands, 2022; pp. 127–136. [Google Scholar]
  20. Berti, M.; Gesch, R.; Eynck, C.; Anderson, J.; Cermak, S. Camelina uses, genetics, genomics, production, and management. Ind. Crop Prod. 2016, 94, 690–697. [Google Scholar] [CrossRef]
  21. Zanetti, F.; Alberghini, B.; Marjanović, A.; Jeromela, A.M.; Grahovac, N.; Rajković, D.; Kiprovski, B.; Monti, A. Camelina, an ancient oilseed crop actively contributing to the rural renaissance in Europe: A review. Agron. Sustain. Dev. 2021, 41, 2. [Google Scholar] [CrossRef]
  22. Kurasiak-Popowska, D.; Stuper-Szablewska, K. The phytochemical quality of Camelina sativa seed and oil. Soil Plant Sci. 2019, 70, 39–47. [Google Scholar] [CrossRef]
  23. Oryschak, M.A.; Christianson, C.B.; Beltranena, E. Camelina sativa cake for broiler chickens: Effects of increasing dietary inclusion on clinical signs of toxicity, feed disappearance, and nutrient digestibility. Transl. Anim. Sci. 2020, 4, 1263–1277. [Google Scholar] [CrossRef]
  24. Juodka, R.; Nainienė, R.; Juškienė, V.; Juška, R.; Leikus, R.; Kadžienė, G.; Stankevičienė, D. Camelina (Camelina sativa (L.) Crantz) as Feedstuffs in Meat Type Poultry Diet: A Source of Protein and n-3 Fatty Acids. Animals 2022, 12, 295. [Google Scholar] [CrossRef]
  25. Cullere, M.; Singh, Y.; Pellattiero, E.; Berzuini, S.; Galasso, I.; Clemente, C.; Dalle Zotte, A. Effect of the dietary inclusion of Camelina sativa cake into quail diet on live performance, carcass traits and meat quality. Poult. Sci. 2023, 102, 102650. [Google Scholar] [CrossRef]
  26. Angelini, L.G.; Abou Chehade, L.; Foschi, L.; Tavarini, S. Performance and potentiality of camelina (Camelina sativa L. Crantz) genotypes in response to sowing date under Mediterranean Environment. Agronomy 2020, 10, 1929. [Google Scholar] [CrossRef]
  27. Vollmann, L.J.; Moritz, T.; Kargl, C.; Baumgartner, S.; Wagentristl, H. Agronomic evaluation of camelina genotypes selected for seed quality characteristics. Ind. Crop Prod. 2007, 26, 270–277. [Google Scholar] [CrossRef]
  28. Jankowsky, K.; Sokolski, M. Spring camelina: Effect of mineral fertilization on the energy efficiency of biomass production. Energy 2021, 220, 119731. [Google Scholar] [CrossRef]
  29. McLean, E.O. Soil pH and lime requirement. In Methods of Soil Analysis, Part 2: Chemical and Microbiological Properties; Page, A.L., Miller, R.H., Keeney, D.R., Eds.; American Society of Agronomy, Inc.: Madison, WI, USA, 1982; pp. 199–224. [Google Scholar]
  30. Bremner, J.M.; Mulvaney, C.S. Nitrogen total. In Methods of Soil Analysis, Part 2: Chemical and Microbiological Properties; Page, A.L., Miller, R.H., Keeney, D.R., Eds.; American Society of Agronomy, Inc.: Madison, WI, USA, 1982; pp. 595–624. [Google Scholar]
  31. Olsen, S.R.; Sommers, L.E. Phosphorus. In Methods of Soil Analysis, Part 2: Chemical and Microbiological Properties, 2nd ed.; Page, A.L., Miller, R.H., Keeney, D.R., Eds.; Agronomy Monograph 9; American Society of Agronomy, Inc.: Madison, WI, USA, 1982; pp. 403–430. [Google Scholar]
  32. Mehlich, A. Determination of cation- and anion-exchange properties of soils. Soil Sci. 1948, 66, 429–446. [Google Scholar] [CrossRef]
  33. Thomas, G.W. Exchangeable cations. In Methods of Soil Analysis, Part 2: Chemical and Microbiological Properties; Page, A.L., Miller, R.H., Keeney, D.R., Eds.; American Society of Agronomy, Inc.: Madison, WI, USA, 1982; pp. 159–165. [Google Scholar]
  34. Nelson, P.W.; Sommers, C.E. Total Carbon, organic Carbon and organic matter. In Methods of Soil Analysis, Part 2: Chemical and Microbiological Properties; Page, A.L., Miller, R.H., Keeney, D.R., Eds.; American Society of Agronomy, Inc.: Madison, WI, USA, 1982; pp. 539–579. [Google Scholar]
  35. Martinelli, T.; Galasso, I. Phenological growth stages of Camelina sativa according to the extended BBCH scale. Ann. Appl. Biol. 2011, 158, 87–94. [Google Scholar] [CrossRef]
  36. Gesch, R.W. Influence of genotype and sowing date on camelina growth and yield in the north central U.S. Ind. Crop Prod. 2014, 54, 209–215. [Google Scholar] [CrossRef]
  37. Cerovic, Z.G.; Masdoumier, G.; Ghozlen, N.B.; Latouche, G. A new optical leaf-clip meter for simultaneous non-destructive assessment of leaf chlorophyll and epidermal flavonoids. Physiol. Plant. 2012, 146, 251–260. [Google Scholar] [CrossRef]
  38. Xie, Q.; Dash, J.; Huang, W.; Peng, D.; Qin, Q.; Mortimer, H.; Casa, R.; Pignatti, S.; Laneve, G.; Pasucci, S.; et al. Vegetation indices combining the red and red-edge spectral information for leaf area index retrieval. IEEE J. Sel. Top. Appl. Earth Obs. Remote Sens. 2018, 11, 1482–1493. [Google Scholar] [CrossRef] [Green Version]
  39. Pearson, R.L.; Miller, L.D. Remote mapping of standing crop biomass for the estimation of the productivity of the short-grass prairie, Pawnee National Grasslands, Colorado. In Proceedings of the 8th International Symposium on Remote Sensing of Environment, Ann Arbor, MI, USA, 2–6 October 1972; pp. 1357–1381. [Google Scholar]
  40. Bannari, A.; Asalhi, H.; Teillet, P.M. Transformed difference vegetation index (TDVI) vor vegetation cover mapping. In Proceedings of the IEEE International Geoscience and Remote Sensing Symposium, Toronto, ON, Canada, 24–28 June 2002; Volume 5, pp. 3053–3055. [Google Scholar]
  41. Sun, H.Y.; Liu, C.M.; Zhang, X.Y.; Shen, Y.J.; Zhang, Y.Q. Effects of irrigation on water balance yield and WUE of winter wheat in the North China Plan. Agric. Water Manag. 2006, 85, 211–218. [Google Scholar] [CrossRef]
  42. Badura, G.P.; Bachmann, C.M.; Tyler, A.C.; Goldsmith, S.; Eon, R.S.; Lapszynsky, C.S. A novel approach for deriving LAI of salt marsh vegetation using structure from motion and multiangular spectra. IEEE J. Sel. Top. Appl. Earth Obs. Remote Sens. 2019, 12, 599–613. [Google Scholar] [CrossRef]
  43. Sims, D.A.; Gamon, J.A. Relationship between leaf pigment content and spectral reflectance across a wide range of species, leaf structures and developmental stages. Remote Sens. Environ. 2002, 81, 331–354. [Google Scholar] [CrossRef]
  44. Mokhtari, A.; Noory, H.; Vazifedoust, M.; Bahrami, M. Estimating net irrigation requirement of winter theat using model and satellite based single and basal crop coefficient. Agric. Water Manag. 2018, 208, 95–106. [Google Scholar] [CrossRef]
  45. Lichtentahler, H.K.; Buschmann, C. Chlorophylls and carotenoids: Measurement and characterization by UV-VIS spectroscopy. Curr. Protoc. Food Anal. Chem. 2001, 1, F4. 3.1–F4. 3.8. [Google Scholar] [CrossRef]
  46. Paruelo, J.M.; Lauenroth, W.K.; Roset, P.A. Estimating aboveground plant biomass using a photographic technique. Range Ecol. Manag. 2000, 53, 190–193. [Google Scholar] [CrossRef]
  47. Richardson, A.D.; Jenkis, J.P.; Braswell, B.H.; Hollinger, D.Y.; Ollinger, S.V.; Smith, M.L. Use of digital webcam images to track spring green-up in a deciduous broadleaf forest. Oecologia 2007, 152, 323–334. [Google Scholar] [CrossRef]
  48. Chen, L.; Zhang, J.G.; Su, H.F.; Guo, W. Weed identification method based on probabilistic neural network in the corn seedlings field. In Proceedings of the 2010 International Conference on Machine Learning and Cybernetics, Haifa, Istrael, 11–14 July 2010; Volume 3, pp. 1528–1531. [Google Scholar]
  49. Liang, L.; Schwartz, M.D.; Fei, S. Photographic assessment of temperate forest understory phenology in relation to springtime meteorological drivers. Int. J. Biometeorol. 2012, 56, 343–355. [Google Scholar] [CrossRef]
  50. Nelson, S.A.; Khorram, S. Image Processing and Data Analysis with ERDAS IMAGINE®; CRC Press: Boca Raton, FL, USA, 2018. [Google Scholar]
  51. ISTA (The International Seed Testing Association). International Rules for Seed Testing; ISTA: Bassersdorf, Switzerland, 2015; Volume 215. [Google Scholar]
  52. Congreves, K.A.; Otchere, O.; Ferland, D.; Fazadfar, S.; Williams, S.; Arcand, M.M. Nitrogen use efficiency definitions of today and tomorrow. Front. Plant Sci. 2021, 12, 637108. [Google Scholar] [CrossRef]
  53. Fageria, N.K.; Baligar, V.C. Enhancing nitrogen use efficiency in crop plants. Adv. Agron. 2005, 88, 97–185. [Google Scholar]
  54. Lukas, V.; Huňady, I.; Kintl, A.; Mezera, J.; Hammerschmiedt, T.; Sobotková, J.; Brtnický, M.; Elbl, J. Using UAV to Identify the Optimal Vegetation Index for Yield Prediction of Oil Seed Rape (Brassica napus L.) at the Flowering Stage. Remote Sens. 2022, 14, 4953. [Google Scholar] [CrossRef]
  55. Janousek, J.; Jambor, V.; Marcoň, P.; Dohnal, P.; Synková, H.; Fiala, P. Using UAV-based photogrammetry to obtain correlation between the vegetation indices and chemical analysis of agricultural crops. Remote Sens. 2021, 13, 1878. [Google Scholar] [CrossRef]
  56. Tucker, C.J.; Holben, B.N.; Elgin Jr, J.H.; Mcmurtrey III, J.E. Relationship of spectral data to grain yield variation. Photogramm. Eng. Remote Sens. 1980, 46, 657–666. [Google Scholar]
  57. Curran, P.J.; Dungan, J.L.; Peterson, D.L. Estimating the foliar biochemical concentration of leaves with reflectance spectrometry: Testing the Kokaly and Clark methodologies. Remote Sens. Environ. 2001, 76, 349–359. [Google Scholar] [CrossRef]
  58. Zhao, D.; Li, J.; Qi, J. Hyperspectral characteristic analysis of a developing cotton canopy under different nitrogen treatments. Agronomy 2004, 24, 463–471. [Google Scholar] [CrossRef] [Green Version]
  59. Jáuregui, J.M.; Delbino, F.G.; Bonvini, M.I.B.; Berhongaray, G. Determining yield of forage crops using the Canopeo mobile phone app. J. N. Z. Grassl. 2019, 81, 41–46. [Google Scholar] [CrossRef]
  60. Chung, Y.S.; Choi, S.C.; Silva, R.R.; Kang, J.W.; Eom, J.H.; Kim, C. Case study: Estimation of sorghum biomass using digital image analysis with Canopeo. Biomass Bioenergy 2017, 105, 207–210. [Google Scholar] [CrossRef]
  61. Reed, V.; Arnall, D.B.; Finch, B.; Bigatao Souza, J.L. Predicting winter wheat grain yield using fractional green canopy cover (FGCC). Int. J. Agron. 2021, 2021, 1443191. [Google Scholar] [CrossRef]
  62. Goodwin, A.W.; Lindsey, L.E.; Harrison, S.K.; Paul, P.A. Estimating wheat yield with normalized difference vegetation index and fractional green canopy cover. Crop Forage Turfgrass Manag. 2018, 4, 1–6. [Google Scholar] [CrossRef] [Green Version]
  63. Schmitz, P.K.; Kandel, H.J. Using canopy measurements to predict soybean seed yield. Agronomy 2021, 13, 3260. [Google Scholar] [CrossRef]
  64. Champolivier, L.; Merrien, A. Effects of water stress applied at different growth stages to Brassica napus L. var. oleifera on yield, yield components and seed quality. Eur. J. Agron. 1996, 5, 153–160. [Google Scholar]
  65. Leport, L.; Turner, N.C.; Davies, S.L.; Siddique, K.H.M. Variation in pod production and abortion among chickpea cultivation under terminal drought. Eur. J. Agron. 2006, 24, 236–246. [Google Scholar] [CrossRef]
  66. Ercoli, L.; Lulli, L.; Mariotti, M.; Masoni, A.; Arduini, I. Post-anthesis dry matter and nitrogen dynamics in durum wheat as affected by nitrogen supply and soil water availability. Eur. J. Agron. 2008, 28, 138–147. [Google Scholar] [CrossRef]
  67. Secchi, M.A.; Fernandez, J.A.; Stamm, M.J.; Durret, T.; Vara Prasad, P.V.; Messina, C.D.; Ciampitti, I.A. Effects of heat and drought on canola (Brassica napus L.) yield, oil, and protein: A meta-analysis. Field Crops Res. 2023, 293, 108848. [Google Scholar] [CrossRef]
  68. Ahmed, Z.; Liu, J.; Waraich, E.A.; Yan, Y.; Qi, Z.; Gui, D.; Zeng, F.; Tariq, A.; Shareed, M.; Iqbal, H.; et al. Differential physio-biochemical and yield responses of Camelina sativa L. under varying irrigation water regimes in semi-arid climatic conditions. PLoS ONE 2020, 15, e0242441. [Google Scholar] [CrossRef]
  69. Solis, A.; Vidal, I.; Paulino, L.; Johnson, B.L.; Berti, M.T. Camelina seed yield responses to nitrogen, sulphur, and phosphorus fertilizer in South Central Chile. Ind. Crops Prod. 2013, 44, 132–138. [Google Scholar] [CrossRef]
  70. Jankowsky, K.J.; Sokolski, M.; Kordan, B. Camelina: Yield and quality response to nitrogen and sulfur fertilization in Poland. Ind. Crops Prod. 2019, 141, 111776. [Google Scholar] [CrossRef]
  71. Bronson, K.F.; Hunsaker, D.J.; Thorp, K.R. Nitrogen fertilizer and irrigation effects on seed yield and oil in camelina. Agron. J. 2019, 111, 1712–1719. [Google Scholar] [CrossRef] [Green Version]
  72. Allen, B.L.; Lenssen, A.W.; Sainju, U.M.; Caesar-TonThat, T.; Evans, R.G. Nitrogen use in durum and selected Brassicaceae oilseed in two-year rotations. Agron. J. 2019, 106, 821–830. [Google Scholar] [CrossRef] [Green Version]
  73. Afshar, R.K.; Lin, R.; Mohammed, Y.A.; Chen, C. Agronomic effects of urease and nitrification inhibitors on ammonia volatilization and nitrogen utilization in a dryland farming system: Field and laboratory investigation. J. Clean. Prod. 2018, 172, 4130–4139. [Google Scholar] [CrossRef]
  74. Mahli, S.S.; Johnson, E.N.; Hall, L.M.; May, W.E.; Phelps, S.; Nybo, B. Effects of nitrogen fertilizer application on seed yield, N uptake, and seed quality of Camelina sativa. Can. J. Soil Sci. 2014, 94, 35–47. [Google Scholar]
  75. Krzyżaniak, M.; Stolarski, M.J.; Tworkowski, J.; Puttick, D.; Eynck, C.; Załuski, D.; Kwiatkowski, J. Yield and seed composition of 10 spring camelina genotypes cultivated in the temperate climate of Central Europe. Ind. Crops Prod. 2019, 138, 111443. [Google Scholar] [CrossRef]
Figure 1. Monthly rainfall (mm) and mean minimum and maximum air temperatures (°C) during the spring camelina cultivation in 2021 and 2022 at San Piero a Grado, Pisa.
Agronomy 13 01539 g001
Figure 2. Effect of different N fertilization regimes and year of cultivation on total DM accumulation (A,B), N uptake of camelina (C,D) both at full flowering stage (65 BBCH) and seed maturity (89 BBCH), and on agronomic efficiency (AE) (E) and apparent recovery efficiency (ARE) (F). Means ± standard error followed by identical letters are not significantly different for p ≤ 0.05, according to Tukey’s HSD post-hoc test. Significance is indicated as follows: *, p ≤ 0.05; **, significant at p ≤ 0.01; ***, significant at p ≤ 0.001. Red line in sub-image F: values >1 indicate that N up-taken by crop was higher than that applied as fertilizer.
Agronomy 13 01539 g002
Figure 3. Effect of the year and N fertilization interaction (Y × F) on camelina plant density (A), seed yield (B), oil content (C), and oil yield (D). Means followed by the same letter are not significantly different at p < 0.05 based on Tukey’s HSD test. T0 = control; T1 = 0 + 60 N kg ha−1; T2 = 60 N kg ha−1 + 0; T3 = 60 N + 60 N kg ha−1.
Agronomy 13 01539 g003
Figure 4. Linear relationship of NDVI (A), MRS705 (B), FGCC (C) with camelina seed yield, and FGCC (D) with leaf nitrogen concentration in the two growing seasons (spring 2021 and 2022).
Agronomy 13 01539 g004
Table 1. Physical and chemical characteristics of the soil in experimental spring trials (2021 and 2022).
CharacteristicsSpring 2021Spring 2022
Clay (<0.002 mm, %) 15.114.6
Silt (0.05–0.002 mm, %) 35.942.0
Sand (2–0.05 mm, %)48.943.4
pH (H2O 1:2.5 soil:water suspension; McLean method) 8.28.1
Total Nitrogen (Kjeldahl method, g kg−1) 0.91.2
Organic matter (Walkley–Black method, %) 2.12.8
Available phosphorus (Olsen method, mg kg−1) 3.48.0
Exchangeable potassium (Thomas method, mg kg−1) 65.0146.0
EC (μS cm−1) 53.778.0
CEC (Method BaCl2, pH 8.1, meq 100 g−1)13.78.4
Table 3. Length (days), growing degree days (GDD) (°C d), and cumulative rainfall (mm) corresponding to vegetative and reproductive cycles of camelina sown in spring 2021 and 2022. Data are averaged over all N fertilizer treatments.
Growing SeasonCycle Length (Days)GDD (°C d)Cumulative Rainfall (mm)
Vegetative †Reproductive ††VegetativeReproductiveVegetativeReproductive
Spring 20217534633.3561.899.418.5
Spring 20226639531.8710.1140.80
† Vegetative cycle corresponds to the period from sowing till start of flowering. †† Reproductive cycle corresponds to the period from start of flowering till seed maturity.
Table 4. Effect of year (Y) and N fertilization (F) and their interaction on different vegetation indices calculated on image acquisition by UAV.
Vegetation Indices (Vis)
Main EffectsNDVIRVITNDVIWvViMcari2MSR705SAVIFGGC
Y************ns*******
F***nsnsnsns***ns***
Y x F**nsnsnsnsnsnsns
The significance of variability factors according to the F-test: ns, not significant; *, significant at p ≤ 0.05; **, significant at p ≤ 0.01; ***, significant at p ≤ 0.001 level.
Table 5. Results of two-way ANOVA for Dualex parameters, plant leaf, and soil analysis carried out when camelina plants were at full flowering stage (BBCH 65).
Main EffectsFactor LevelDualexPlant Leaf AnalysisSoil Analysis
Chls (μg cm−2)Anth (Abs Units)Flav (Abs Units)NBIChl_a (μg cm−2)Chl_b (μg cm−2)Chl_a + b (μg cm−2)Chl_a/bCar (μg cm−2)M (%)NO3
Year (Y)202124.9 ± 0.40.117 ± 0.0021.15 ± 0.03 b21.8 ± 0.4 a9.6 ± 0.3 b4.3 ± 0.1 b13.8 ± 0.5 b2.3 ± 0.011.2 ± 0.01 b12.7 ± 0.2 b23.9 ± 4.7 b
202224.1 ± 0.40.110 ± 0.0031.29 ± 0.05 a19.1 ± 0.9 b17.0 ± 0.5 a7.3 ± 0.2 a24.4 ± 0.7 a2.3 ± 0.13.7 ± 0.1 a15.3 ± 0.2 a41.6 ± 7.5 a
N fertilizer thesis (F)T023.3 ± 0.70.114 ± 0.0021.24 ± 0.1019.4 ± 1.712.4 ± 1.7 b5.0 ± 0.7 b17.4 ± 2.3 b2.5 ± 0.1 a2.5 ± 0.614.1 ± 0.622.1 ± 6.1
T125.1 ± 0.30.113 ± 0.0051.18 ± 0.0421.4 ± 0.914.7 ± 2.2 a6.4 ± 0.8 a21.1 ± 3.0 a2.3 ± 0.1 b2.7 ± 0.714.5 ± 0.740.0 ± 13.3
T224.8 ± 0.50.115 ± 0.0041.29 ± 0.0519.5 ± 1.113.2 ± 1.1 ab6.0 ± 0.6 a19.2 ± 1.7 ab2.2 ± 0.1 b2.3 ± 0.514.1 ± 0.621.6 ± 4.3
T324.9 ± 0.60.113 ± 0.0031.16 ± 0.0221.5 ± 0.312.9 ± 1.9 b5.8 ± 0.7 b18.7 ± 2.6 b2.2 ± 0.1 b2.3 ± 0.513.3 ± 0.647.3 ± 8.5
Significance
Y nsns*************ns*******
F nsnsnsns*********nsnsns
Y × F nsns**ns***ns******nsns
Means ± standard error followed by identical letters are not significantly different for p < 0.05, according to Tukey’s HSD post-hoc test. The significance of variability factors according to the F-test: ns, not significant; *, significant at p ≤ 0.05; **, significant at p ≤ 0.01; ***, significant at p ≤ 0.001 level. Chls = chlorophylls; Anth = anthocyanins; Flav = flavonols; NBI = nitrogen balance index; Car = carotenoids; M = moisture content; NO3 = nitrate concentration.
Table 6. Main effects of the year (Y), N fertilization (F), and their interaction on camelina biometric characteristics, seed yield, yield components, and qualitative traits.
Agronomic and Seed Quality FeaturesMain Effects
Year (Y)N Fertilizer Regimes (F)Significance
20212022T0T1T2T3YFYxF
Plant height (cm)77.1 ± 1.4 a64.1 ± 2.0 b64.3 ± 4.2 b67.6 ± 3.2 b75.5 ± 2.6 a74.5 ± 2.8 a******ns
Branching (no. stems plant−1)6.8 ± 0.3 a6.0 ± 0.3 b5.9 ± 0.3 bc6.7 ± 0.2 b5.3 ± 0.2 c7.8 ± 0.3 a*****ns
Plant density (plants m−2)153.5 ± 14.2 b235.5 ± 7.2 a168.9 ± 35.1 b175.9 ± 23.0 b217.4 ± 14.3 a215.9 ± 9.5 a********
no. Silique plant−1224.2 ± 13.3 a132.0 ± 3.7 b193.3 ± 30.7 a180.4 ± 20.2 ab141.4 ± 18.8 b197.1 ± 23.1 a****ns
no. Seeds silique−18.2 ± 0.2 a7.4 ± 0.1 b8.0 ± 0.47.6 ± 0.28.1 ± 0.27.6 ± 0.4*nsns
Seed yield (Mg ha−1 DW)2.2 ± 0.1 a1.3 ± 0.1 b1.4 ± 0.1 b1.8 ± 0.2 a1.9 ± 0.3 a1.9 ± 0.2 a*******
TSW (g)1.1 ± 0.02 a1.1 ± 0.02 b1.0 ± 0.021.1 ± 0.031.1 ± 0.021.1 ± 0.02*nsns
Oil content (% dry weight)34.2 ± 1.634.7 ± 0.9734.4 ± 1.66 b38.8 ± 1.66 a30.7 ± 0.46 c33.9 ± 1.05 bcns*****
Oil yield (Mg ha−1)0.7 ± 0.04 a0.5 ± 0.02 b0.5 ± 0.04 b0.7 ± 0.08 a0.6 ± 0.09 a0.7 ± 0.07 a*******
Crude protein (%)23.7 ± 0.3 b25.2 ± 0.4 a23.3 ± 0.3 b24.8 ± 0.3 ab24.4 ± 0.3 ab25.3 ± 0.5 a***ns
Values ± standard error followed by identical letters are not significantly different for p < 0.05, according to Tukey’s HSD post-hoc test. The significance of variability factors according to the F-test: ns, not significant; *, significant at p ≤ 0.05; **, significant at p ≤ 0.01; ***, significant at p ≤ 0.001 level.
Table 7. Pearson’s correlation coefficient (r) between VIs, obtained by UAV images, and chlorophyll obtained by Dualex leaf-clip sensor, in relation to camelina seed yield, chlorophyll leaf content, and foliar N % in the two growing seasons (2021 and 2022).
ParametersGrowing SeasonVIs by UAV ImagesDualex
NDVIRVITNDVIWvViMCARI2MSR705SAVIFGCCChls
Seed yield20210.81 ***−0.69 **0.73 **0.67 **0.43 ns0.72 **0.64 *0.74 **0.50 *
20220.53 *0.25 ns−0.12 ns−0.18 ns−0.03 ns0.80 ***−0.19 ns0.82 ***0.29 ns
Leaf Chl content20210.51 *−0.37 ns0.43 ns0.36 ns0.59 *0.35 ns0.32 ns0.37 ns0.51 ***
20220.49 ns−0.02 ns0.07 ns0.08 ns0.47 ns0.22 ns0.05 ns0.13 ns0.17 ns
Leaf N%20210.68 *−0.56 ns0.58 ns0.61 ns0.24 ns0.50 ns0.43 ns0.72 *0.92 ***
2022−0.07 ns−0.18 ns0.44 ns0.28 ns0.14 ns0.90 **0.23 ns0.83 **0.03 ns
The significance of variability factors according to the F-test: ns, not significant; *, significant at p ≤ 0.05; **, significant at p ≤ 0.01; ***, significant at p ≤ 0.001 level.
Disclaimer/Publisher’s Note: The statements, opinions and data contained in all publications are solely those of the individual author(s) and contributor(s) and not of MDPI and/or the editor(s). MDPI and/or the editor(s) disclaim responsibility for any injury to people or property resulting from any ideas, methods, instructions or products referred to in the content.

