Article

An Improved Craig–Gordon Isotopic Model: Accounting for Transpiration Effects on the Isotopic Composition of Residual Water during Evapotranspiration

1
School of Water and Environment, Chang’an University, Xi’an 710054, China
2
Key Laboratory of Subsurface Hydrology and Ecological Effects in Arid Region of the Ministry of Education, Chang’an University, Xi’an 710054, China
3
Key Laboratory of Agricultural Soil and Water Engineering in Arid and Semiarid Areas, Ministry of Education, Northwest A&F University, Yangling 712100, China
4
Faculty of Modern Agricultural Engineering, Kunming University of Science and Technology, Kunming 650500, China
*
Authors to whom correspondence should be addressed.
Agronomy 2023, 13(6), 1531; https://doi.org/10.3390/agronomy13061531
Submission received: 24 April 2023 / Revised: 20 May 2023 / Accepted: 30 May 2023 / Published: 31 May 2023

Abstract

:
Evapotranspiration (ET) is a crucial process in the terrestrial water cycle, and understanding its stable isotopic evolution is essential for comprehending hydrological processes. The Craig–Gordon (C-G) model is widely used to describe isotopic fractionation during pure evaporation. However, in natural environments, ET involves both transpiration (T) and evaporation (E), and the traditional C-G model does not account for the effect of transpiration on isotopic fractionation. To address this gap, we propose the evapotranspiration-unified C-G (ET-UCG) model, which extends the C-G model by incorporating transpiration’s effect on water isotopes. We verified the validity of the ET-UCG model by comparing its simulation results with the traditional C-G model’s discrete results for a special scenario that simulated the isotopic evolution of residual water after daily transpiration consumption. Further, we simulated two different ET process scenarios using the ET-UCG model to investigate transpiration’s effect on the residual water’s isotopic composition. Our numerical experiments show that transpiration indirectly affects the degree of water isotope fractionation by reducing the true evaporation ratio, even though it does not directly produce isotope fractionation. Therefore, the isotopic composition of residual water estimated by the ET-UCG model is consistently lighter than that estimated using the traditional C-G model in the simulation of ET. Despite different T/ET conditions, the isotopic evolution process follows the same evaporation line. These results highlight the importance of considering transpiration effects when using the C-G model and provide valuable insights into ET processes with potential applications in the field.

1. Introduction

Evapotranspiration (ET) is one of the central components of the terrestrial water cycle [1,2], with about 60% of rainfall returning to the atmosphere through this process [3]. Accurate quantification of the soil evaporation loss fraction (f) and partition ET is vital for comprehending the water balance of a region, effectively managing water resources, and predicting the impacts of climate change on water availability.
Numerous methods have been devised for investigating ET. Traditional methods of field measurement, such as lysimeters and eddy covariance, are both expensive and labor-intensive, and limited to providing point measurements. Although certain models are capable of estimating soil evaporation over extended periods, they are unable to accurately estimate under-canopy E and partition ET. In recent decades, water isotope tracing has undergone significant developments [4,5], with stable isotopes such as δ2H and δ18O serving as natural tracers in studying the dynamics of soil water evaporation [6,7], quantifying the water balance [8], and partitioning ET [9,10]. Unlike other methods, isotope-based methods provide estimates for an extended period before the soil sampling and do not require continuous field observations [7,11], making them especially beneficial in areas where water resources are scarce or conventional methods are unfeasible [12]. Moreover, isotope-based methods can partition ET and offer insights into the underlying mechanisms. As a result, isotope-based techniques have emerged as a promising alternative for estimating ET in the future.
Isotopic fractionation occurs during ET processes as lighter water molecules are selectively evaporated, leaving behind heavy isotopes of hydrogen and oxygen in the residual water [13]. In contrast, transpiration does not cause isotopic fractionation [14]. The Craig–Gordon model (C-G model), proposed by Harmon Craig and Louis Gordon [15], is a renowned isotopic model that explains the combined effect of equilibrium and kinetic isotopic fractionation during the phase transition from liquid water to vapor [16,17,18]. This model is commonly used to interpret and model the isotopic composition of oceans [19], lakes, atmospheric water, soil water, and other natural water systems [8,20,21]. It has become an important theoretical method for isotopic studies of the hydrological cycle, both regionally and globally.
In the natural environment, the simultaneous occurrence of transpiration and evaporation poses a challenge to accurately determine the isotopic composition of water, which is not only directly affected by evaporation but also indirectly influenced by transpiration [20,22]. Despite the widespread use of the traditional C-G model to explain isotopic fractionation during the phase transition from liquid water to vapor, it is limited to the evaporation process and does not consider the effect of water loss by transpiration on water isotopes during evaporation, thereby failing to accurately depict the isotopic change process of natural water (e.g., pore water in soil under vegetation cover) undergoing ET [17,18,19]. As such, the development of an isotope evaporation fractionation model that includes transpiration is urgently needed.
The main objective of this study was to develop an improved isotopic model, which integrates the effects of both transpiration (T) and evaporation (E) on the isotopic composition of water during the ET process. The newly developed model was used to simulate the isotopic composition of water under different T/ET conditions, while also examining the impact of transpiration on evaporation fractionation. Specifically, we address the following key questions: (i) What are the disparities in quantifying water isotopes for C-G models with and without considering transpiration? (ii) How does the isotopic composition of residual water transform with the loss of water and time during ET? The findings of this research have the potential to yield valuable insights into ET processes and offer novel applications in the field.

2. Materials and Methods

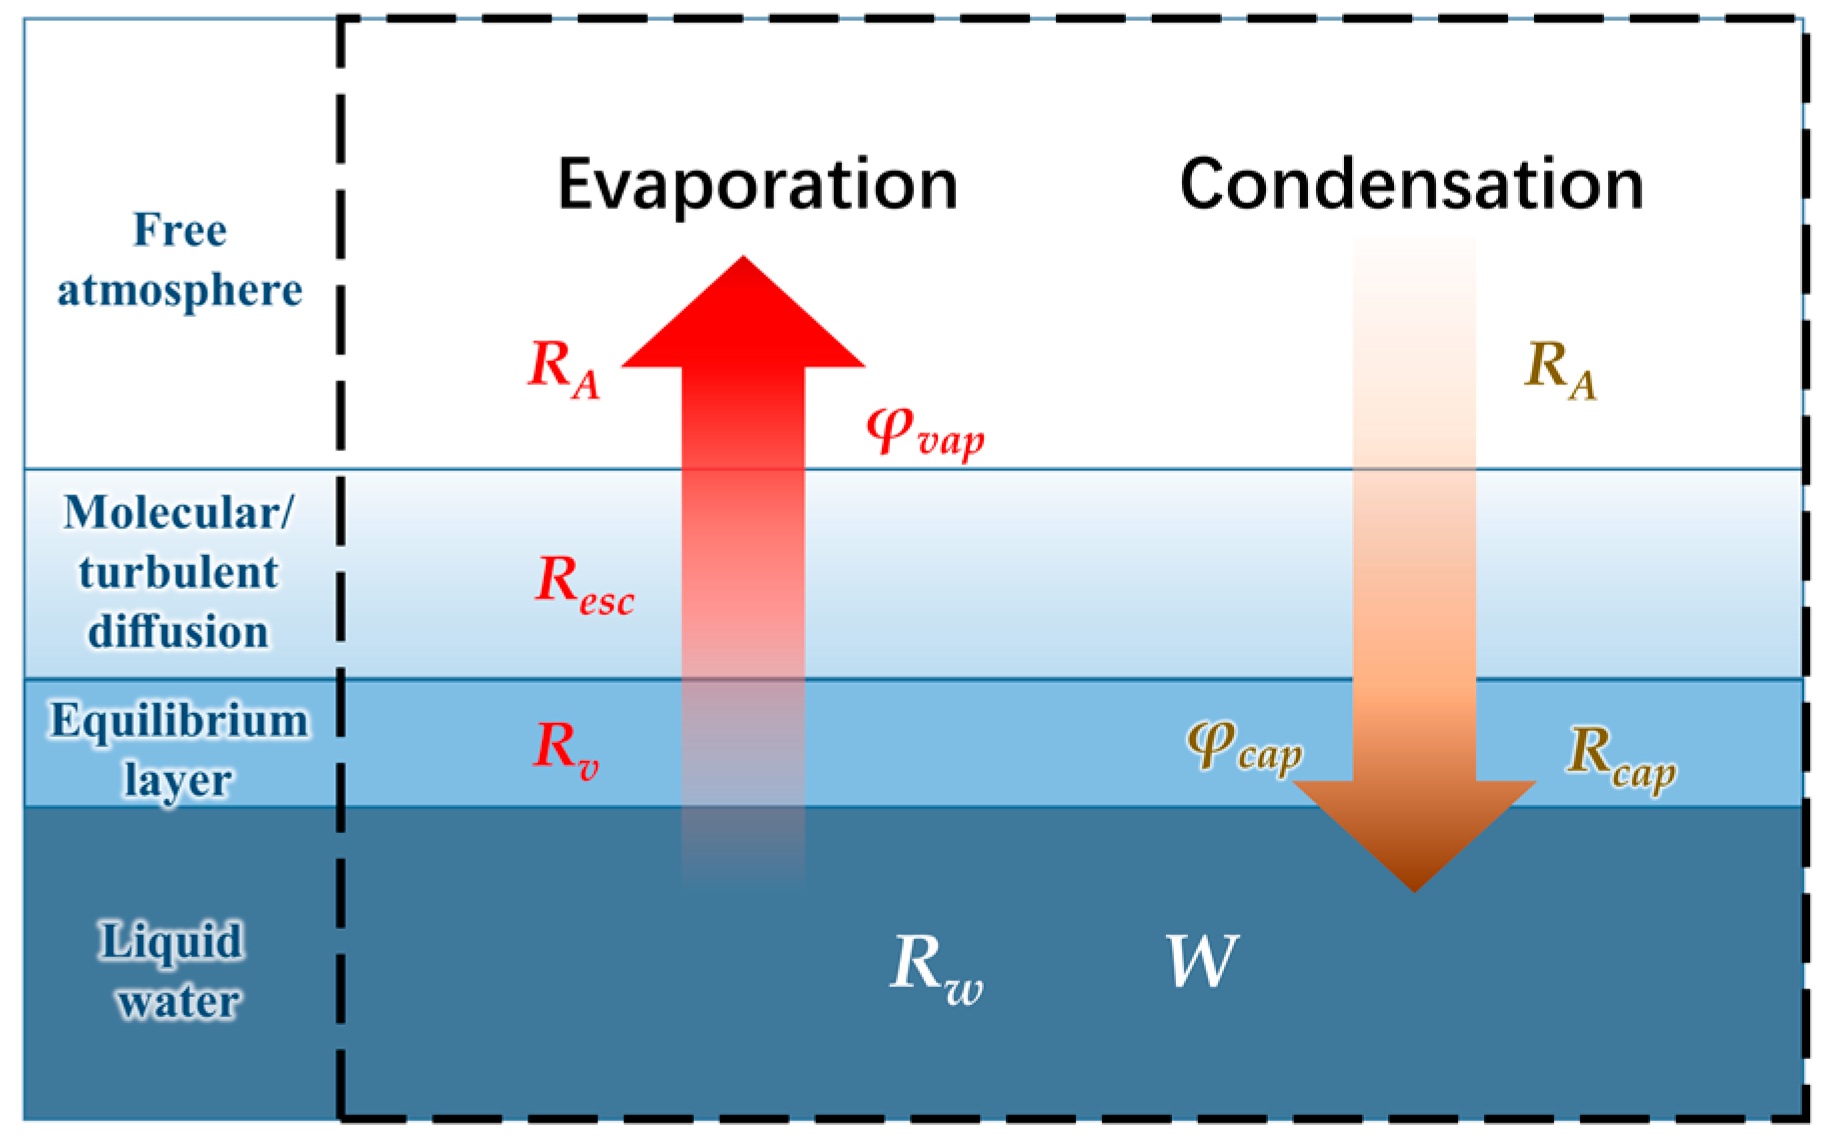
2.1. Theoretical Background of the C-G Model

The C-G model, which was initially introduced by Craig and Gordon [15], has been widely used to estimate the isotopic fractionation that occurs during the transition from liquid water to vapor. Building on this work, Gonfiantini et al. [17] proposed an enhanced version, called the unified C-G analytical model (UCG model), which can accurately quantify all the relevant variables involved in the evaporation of both fresh and saline water. These models can be used to determine the isotopic composition of evaporated water, taking into account vapor escape and condensation (Figure 1). The detailed quantitative processes involved in this method are as follows:
(a) When H2O molecules transition from liquid to vapor phase, the hydrogen bonds that keep them in the liquid phase are broken, and a layer of saturated vapor is formed above the liquid surface. This vapor layer is in isotopic equilibrium with the liquid water phase, and the equilibrium fractionation factor α eq describes the isotopic composition differences between the liquid and vapor phases at equilibrium. The α eq is as follows:
α e q = R W R V
where RW is the isotopic ratio 2H/1H or 18O/16O in the water subjected to evaporation, RV is the isotopic ratio of the vapor layer in contact with the liquid.
The α e q value is slightly greater than 1, indicating that lighter water molecules tend to vaporize more easily and hence are more dominant in the vapor phase. Furthermore, the α eq values can be calculated as a function of temperature T (K) by utilizing the well-established experimental data provided by Majoube [23]:
ln α e q = a T 2 + b T 1 + c
At equilibrium, the values of these coefficients are: a = 24,844, b = 76.248, c = 0.05261 for 2H, and a = 1137, b = −0.4156, c = −0.00207 for 18O.
(b) Thereafter, the vapor escapes from the equilibrium ‘layer’ by molecular diffusion and/or by turbulent diffusion, and is vented into the free atmosphere. The kinetic fractionation factor α diff X quantifies isotopic effects during net evaporation associated with the higher diffusivities of isotopically lighter molecules:
α diff X = R V R esc
where Resc is the isotope ratio of the vapor that escapes from the equilibrium ‘layer’, α diff is the isotopic fractionation factor due to molecular diffusion, and its variations are generally dominated by the relative humidity (h) of the air overlying the evaporating surface. Commonly accepted α diff values are provided by Merlivat [24]: 1.0251 for 2H and 1.0285 for 18O. X is the fractional ‘turbulence index’. When X = 1, vapor escapes solely by molecular diffusion, and the isotope fractionation factor is α diff . However, when X = 0, vapor escapes only due to turbulent diffusion, which is isotopically non-fractionating, and the isotope fractionation factor α diff X is 1 [25].
(c) The vapor present in the free atmosphere follows the reverse path to reach the virtual, saturated vapor layer at the water–air interface, and is eventually captured by the liquid water through the re-equilibration process. Its isotopic ratio, Rcap, is related to that of the free atmosphere RA by:
α diff X = R A R cap
(d) Based on the fractionation mechanism mentioned above, Gonfiantini et al. [17] proposed the UCG model:
δ w = δ 0 + 1 + A B δ A + 1 f B 1 + A B δ A + 1
where δw is the isotopic composition of residual water, f is the fraction of residual liquid water, and δ0 and δA indicate the isotopic compositions of the initial water and the atmosphere, respectively. A = h α d i f f X γ h , B = γ α e q α d i f f X γ h 1 , γ is the thermodynamic activity coefficient of the evaporating water (equal to 1 for pure water and dilute solutions, and <1 for saline solutions), and h is the relative humidity of the free atmosphere normalized to the temperature of the evaporating water.
As an introductory example, we applied Equations (1)–(5) with the parameters T = 25 °C, h = 0.65, and X = 1 to simulate the isotopic evolution of a single water volume. The resulting evolution of hydrogen and oxygen δw of the residual water during the evaporation process is presented in Figure 2. As the evaporation progresses and the fraction of residual liquid decreases, the isotopic composition of the residual liquid gradually approaches the limiting composition. Under steady-state evaporation conditions, the isotopic composition of the evaporated water is a function of the residual water ratio f. During the process of evaporation, the lighter water molecules vaporize faster than the heavier ones, leading to gradual enrichment of the isotopic composition of the residual liquid, which approaches the atmospheric isotope-controlled limit [20].

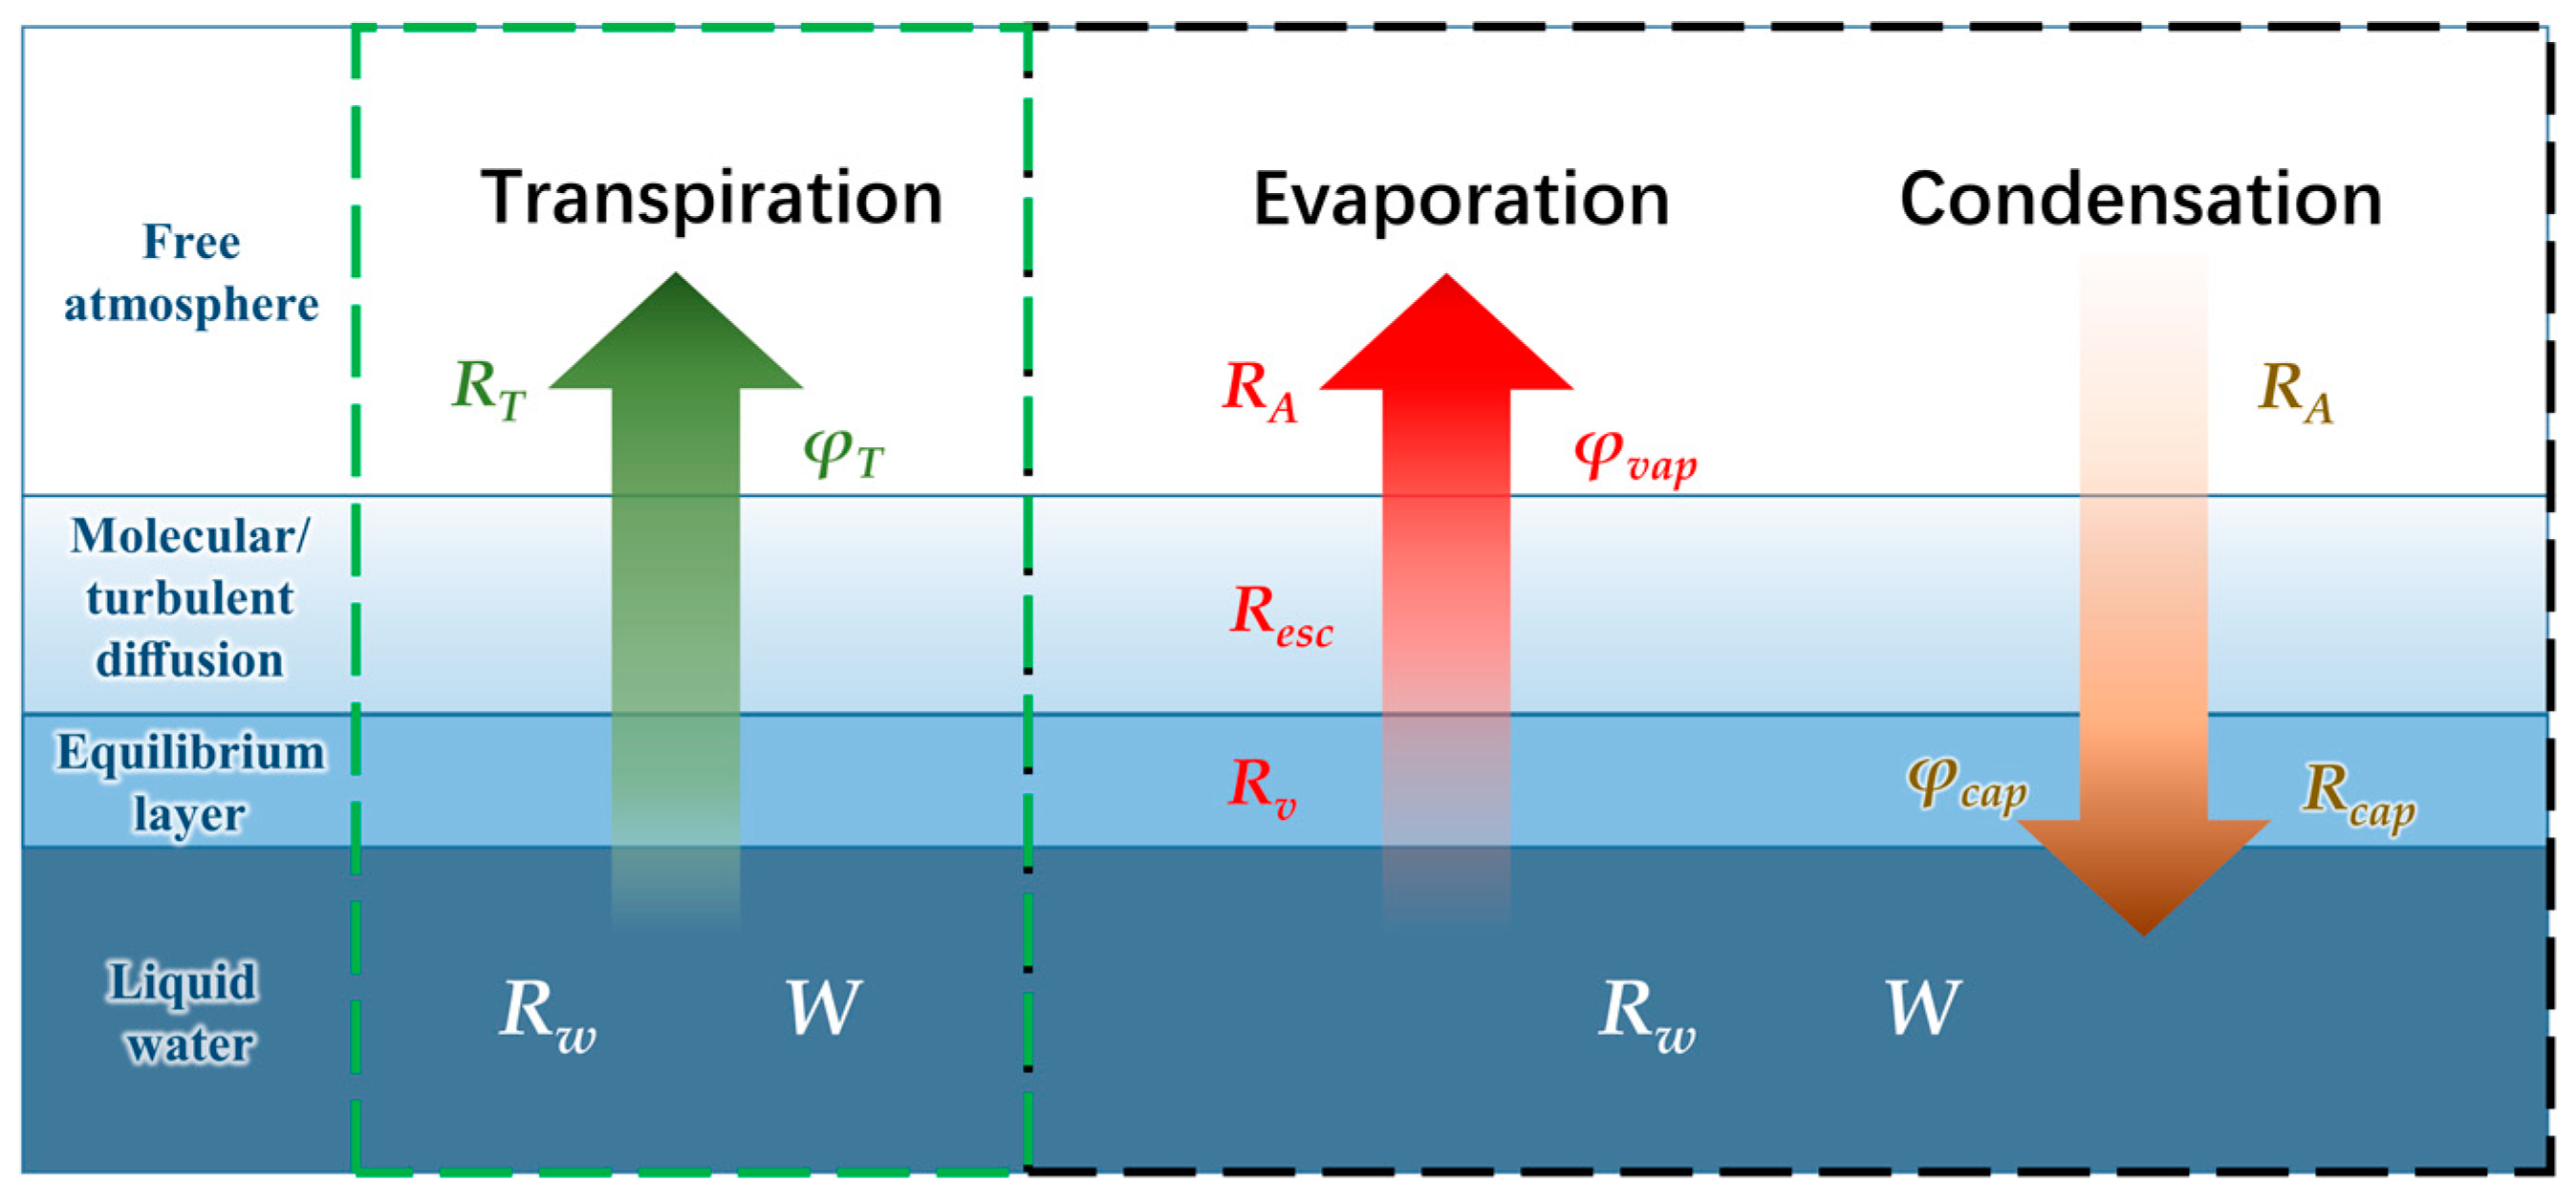
2.2. An Improved C-G Model Accounting for the Effects of Both Transpiration and Evaporation

In order to more precisely characterize the isotopic variations of water during ET, we develop an improved C-G model, namely evapotranspiration-unified C-G (ET-UCG) model, which integrates the effect of transpiration (water loss from plants) based on the UCG framework, as depicted in Figure 3.
The evapotranspiration (ET) of liquid water is the sum of net evaporation rate ( φ E ) and transpiration rate ( φ T ), while the net evaporation equals the difference between the vaporization rate φ vap and the atmospheric vapor capture rate φ cap (i.e., condensation) by the liquid water.
ET = d W d t = φ E + φ T = φ v a p φ c a p + φ T = γ h + m φ v a p 0
where W is the liquid water mass, φ v a p 0 is the vaporization rate of pure water, γ is the thermodynamic activity coefficient of the evaporating water (equal to 1 for pure water and dilute solutions, and <1 for saline solutions [17]), and h is the relative humidity of the free atmosphere normalized to the temperature of the evaporating water. Thus, the vaporization rate of liquid water is γ φ v a p 0 , and the condensation rate of atmospheric vapor on the liquid water is h φ v a p 0 . Here, we define the transpiration rate φ T as m φ v a p 0 .
The isotopic variation of evaporating water could be described by isotopic mass balance:
d R w d t = 1 W R w φ v a p φ c a p + φ T R e s c φ e s c + R cap φ cap R T φ T
As we know, transpiration process does not lead to isotope fractionation, thus,
R T = R w
Dividing Equation (7) by Equation (6), we obtain:
d R w d W = R w W + γ R e s c + m R T h R c a p W γ + m h
Using Equations (3), (4), (8) and (9) becomes:
d R w d W = R w W + γ R w α e q α d i f f X + m R h R A α d i f f X W γ + m h
By introducing the fraction of residual liquid water f = W W 0 (W is the liquid water mass, W 0 is the initial liquid water mass), we obtain:
d R w d l n f = R w γ α e q α d i f f X γ + m h + m γ + m h 1 R A h α d i f f X γ + m h
Equation (11) can be rewritten as:
d R L d l n f = R w B + R A A
where A = h α d i f f X γ + m h , B = γ α e q α d i f f X γ + m h + m γ + m h 1 , A B = h α e q γ α e q α d i f f X γ h .
By assuming that during evapotranspiration all parameters in A and B have constant values under steady-state conditions, Equation (12) can be integrated into a new C-G model, namely the ET-UCG model:
BR w + AR A = BR w 0 + AR A f B
where R w 0 is the initial isotopic ratio of the evaporating liquid water.
Using the familiar δ-value notation ( δ = R w R s t d 1 ), Equation (13) becomes:
δ w = δ 0 + 1 + A B δ A + 1 f B 1 + A B δ A + 1

2.3. Numerical Experiments

To investigate the effect of transpiration on the isotopic composition of residual water during evapotranspiration, we simulated various T/ET conditions using the ET-UCG model. To keep the example simple, we assumed a steady-state evapotranspiration process (pure water, γ = 1) with the meteorological parameters T = 25 (°C), h = 0.65, and X = 1, and an initial water body of 100 mm m−2. The initial isotopic composition δ0 of the water was assumed to be −72.65‰ for 2H and −9.89‰ for 18O (local tap water), with atmospheric water isotopic composition of −130‰ for 2H and −28‰ for 18O. The isotopic composition of the residual water was calculated using Equations (8)–(14) for each day, taking into account the coefficient m related to transpiration, which is calculated as:
m = γ h · T ET 1 T ET .
Specifically, we set up two different evapotranspiration process scenarios as follows:
Scenario 1: Constant ET and varying T/ET. We conducted a simulation experiment with a constant total evapotranspiration rate (T/ET) of 5 mm/day, while varying the proportion of transpiration to evapotranspiration (T/ET) from 0% to 100%. The simulation lasted for 20 days, during which 100 mm of water was completely lost. We compared the results of the ET-UCG model with those of the traditional C-G model, which does not consider transpiration, to identify any differences in the simulation outcomes. By using this approach, we aimed to elucidate the potential effects of transpiration on the isotopic evolution of residual water during evapotranspiration and to clarify the importance of considering transpiration on residual water isotope changes in isotopic models used for simulating evapotranspiration.
Scenario 2: Constant E and varying T/ET. To investigate the evolution process of residual water isotopes in an area subjected to varying transpiration conditions (it can be approximated as different vegetation types), we conducted a simulation experiment assuming a constant evaporation rate (E = 3 mm/day) and varying transpiration rates (T) ranging from 0 to 10 mm/day. The time required for water to be lost completely varies depending on T. Through an analysis of the isotopic evolution of residual water under these conditions, our study aimed to provide insight into the impact of transpiration rates on the isotopic composition of residual water in actual ecosystems. This approach can further our understanding of how transpiration rates associated with different land use types affect the isotopic composition of residual water in real-world scenarios.

3. Results

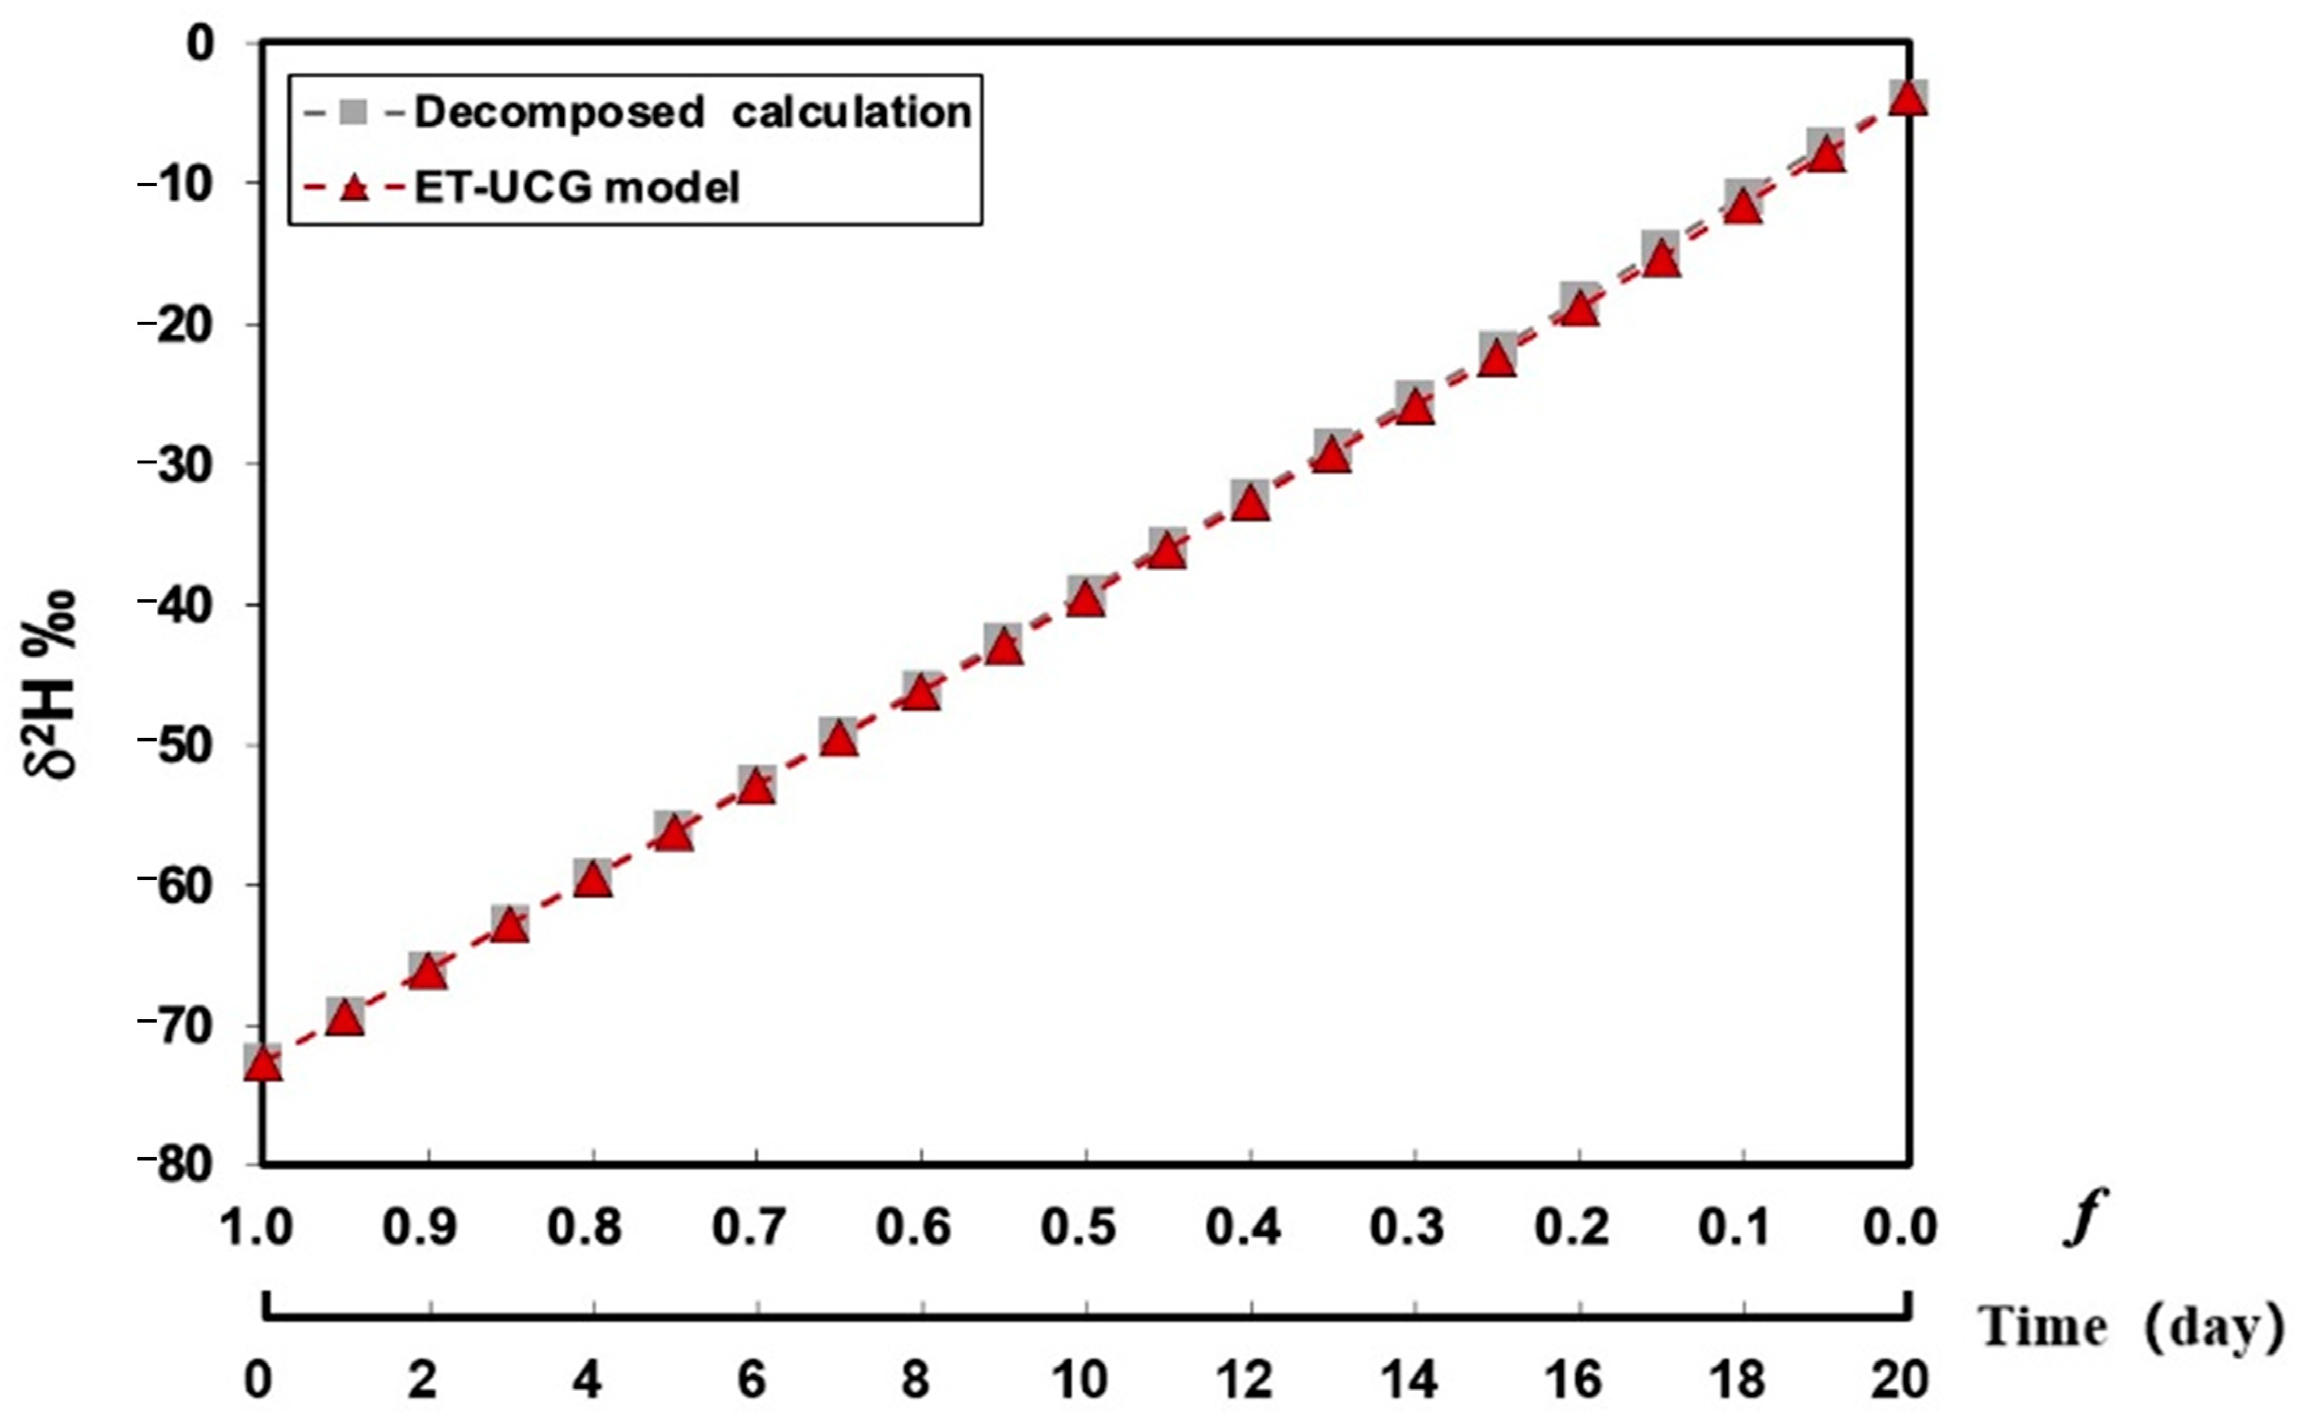
3.1. Validation of the ET-UCG Model by Theoretical Tests

To assess the validity of the ET-UCG model, we employed an artificial decomposition of evapotranspiration into distinct processes of evaporation and transpiration. In doing so, we devised a specialized scenario employing the conventional C-G model, which simulated the isotopic evolution of the residual water body following daily transpiration water consumption. Specifically, the C-G model simulation assumed that evaporation takes place at the beginning of each day, causing fractionation in the isotopic composition of the water body. It further assumed that transpiration takes place at the end of the day, without causing fractionation in the isotopic composition of the water body but resulting in a decrease in the total body of water due to water consumption. The isotopic composition of the residual water was then modeled based on the ratio of evaporated water day by day.
In the above scenario, the evaporation fraction x at each day was calculated according to Equation (16):
x = 1 f = E · Δ t W ET · t = 1 T ET Δ t W ET t
where t is the cumulative evapotranspiration time ( d a y ) of water body.
Assuming the total amount of liquid water mass W = 100   mm , evapotranspiration ET = 5   mm / day , Δ t = 1   day , the simulation lasted for 20 days, during which 100 mm of water was completely lost. Equation (16) can be simplified as:
x = 1 T ET 20 t
Based on Equation (17), the daily evaporation fraction (x = 1 − f) leading to isotope fractionation in the evapotranspiration process increases with time, and the rate of change of x also increases with time. The evaporation fraction is smaller when T/ET is larger, resulting in less isotope fractionation (Figure 4). For instance, the true evaporation fraction of T/ET = 0.4 and 0.9 throughout the entire evapotranspiration process is always smaller than that of T/ET = 0. Moreover, the isotopes of the remaining water increase with the evaporation ratio x (Figure 2). Therefore, the water isotopes under evapotranspiration are always less enriched than those under evaporation alone. To sum up, transpiration does not directly produce isotope fractionation, but it indirectly affects the degree of water isotope fractionation by reducing the true evaporation ratio x .
Taking the evaporation ratio (1 − f) under T/ET = 0.4 in the above scenario as an example, we conducted simulations of the daily evolution process of residual water isotopes using the traditional C-G model. Comparing the results of this scenario with those obtained using the ET-UCG model (Figure 5), it was observed that the isotope evolution trends obtained using the C-G model decomposed calculation method (gray rectangle) and the ET-UCG model (red triangle) are in good agreement, with a high correlation coefficient (R2 = 1.0) and a low root mean square error (RMSE = 0.38‰). This indicates that the ET-UCG model, which considers the transpiration process, provides an accurate and objective description of the isotopic evolution process during evapotranspiration. However, due to the discrete nature of the decomposed calculations, there are slight discrepancies between the two results, with the ET-UCG model producing continuous results.

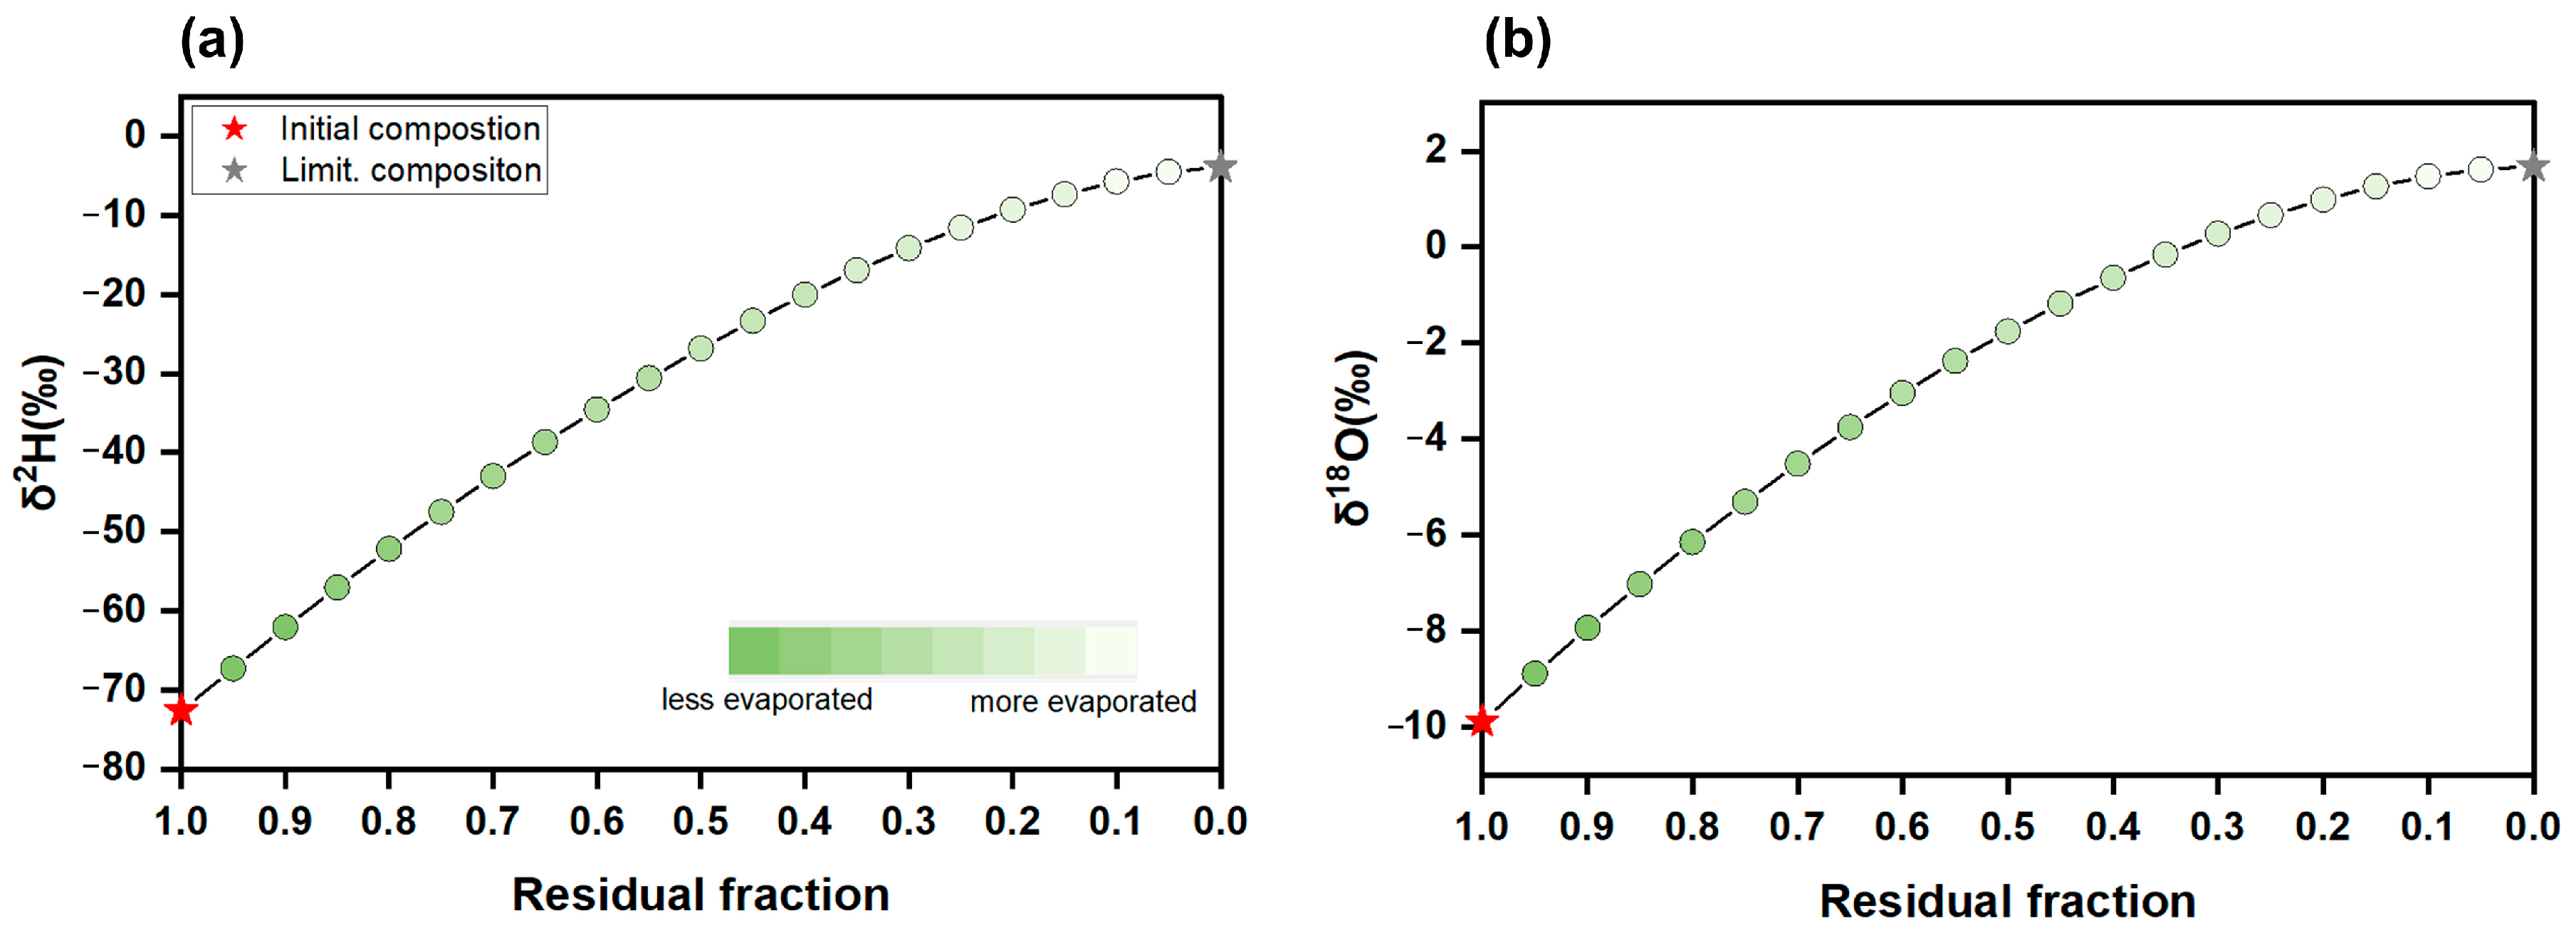
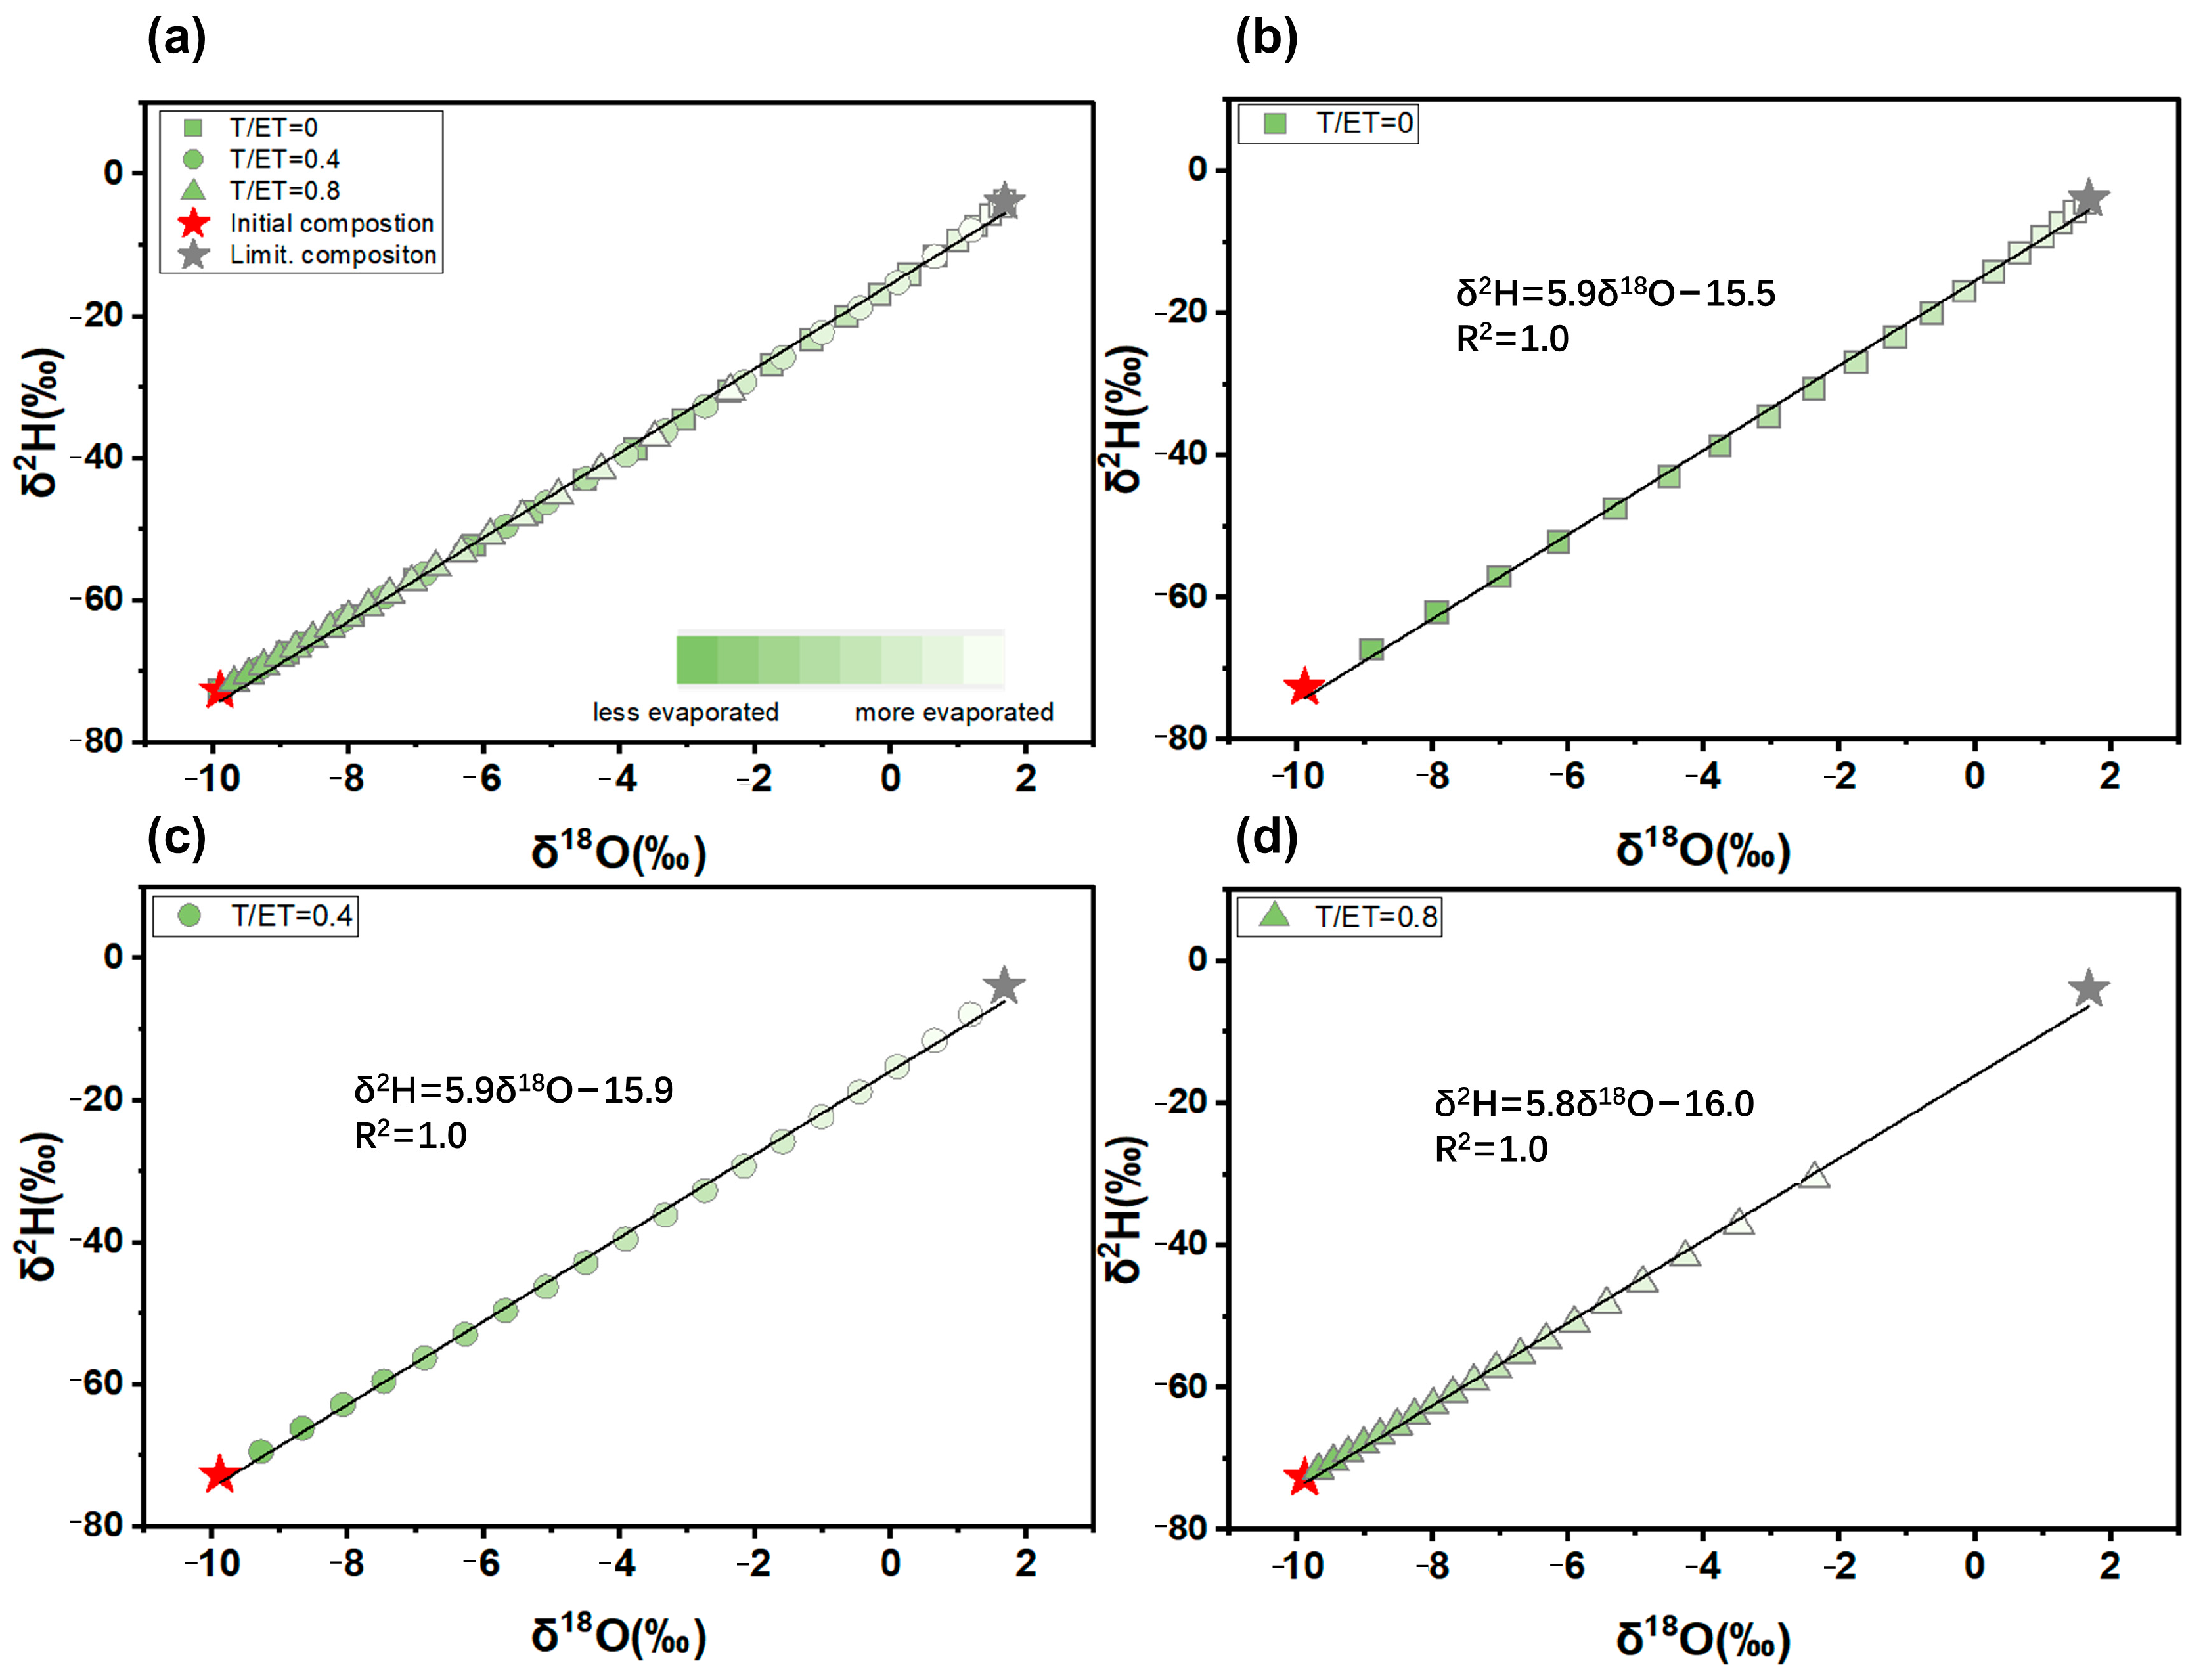
3.2. Isotopic Patterns in Water Body Undergoing Evapotranspiration

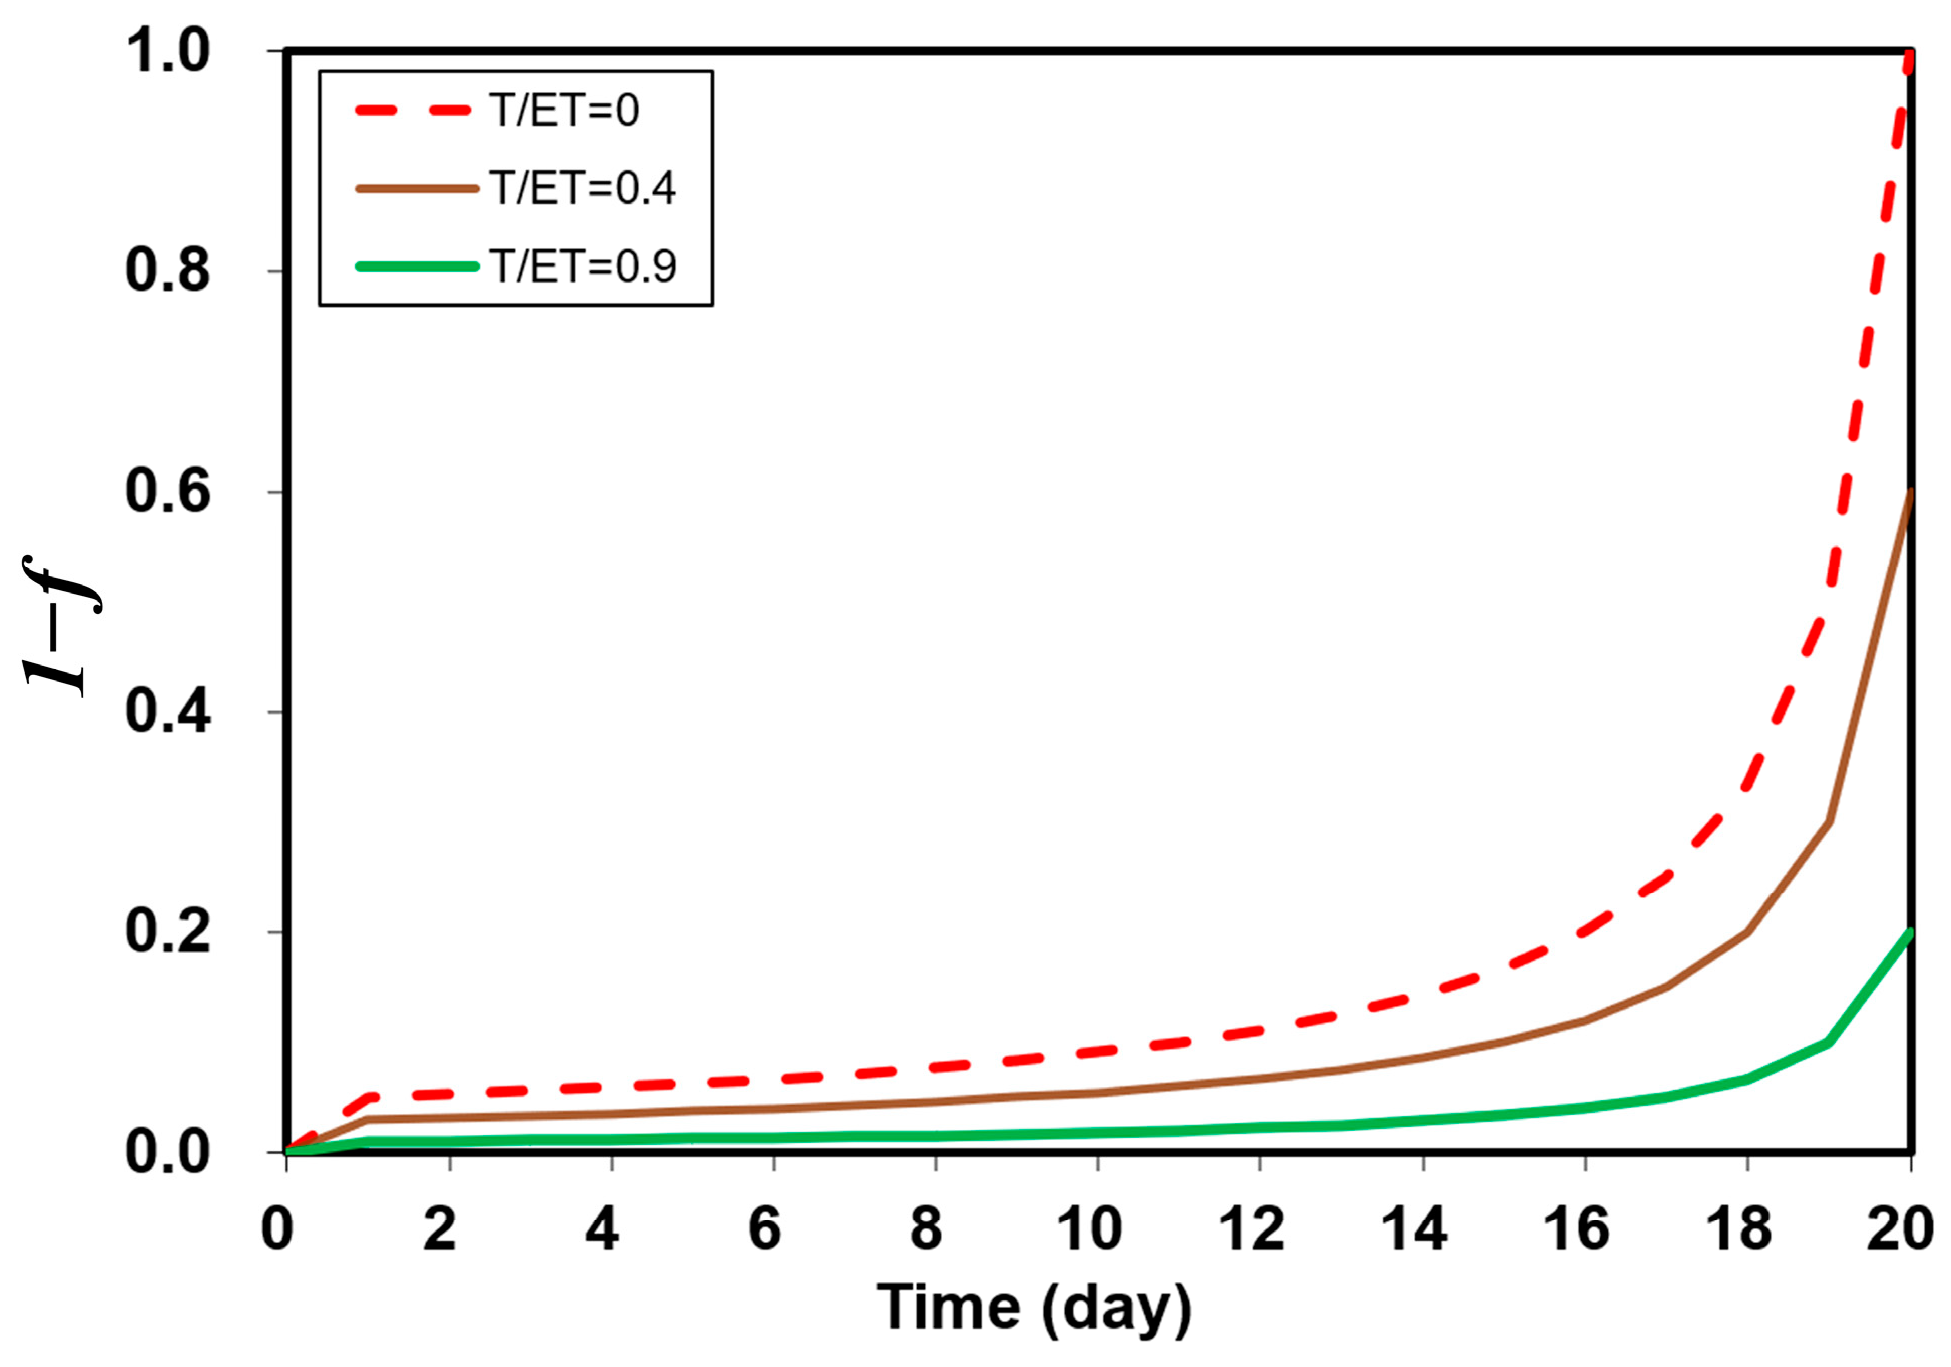
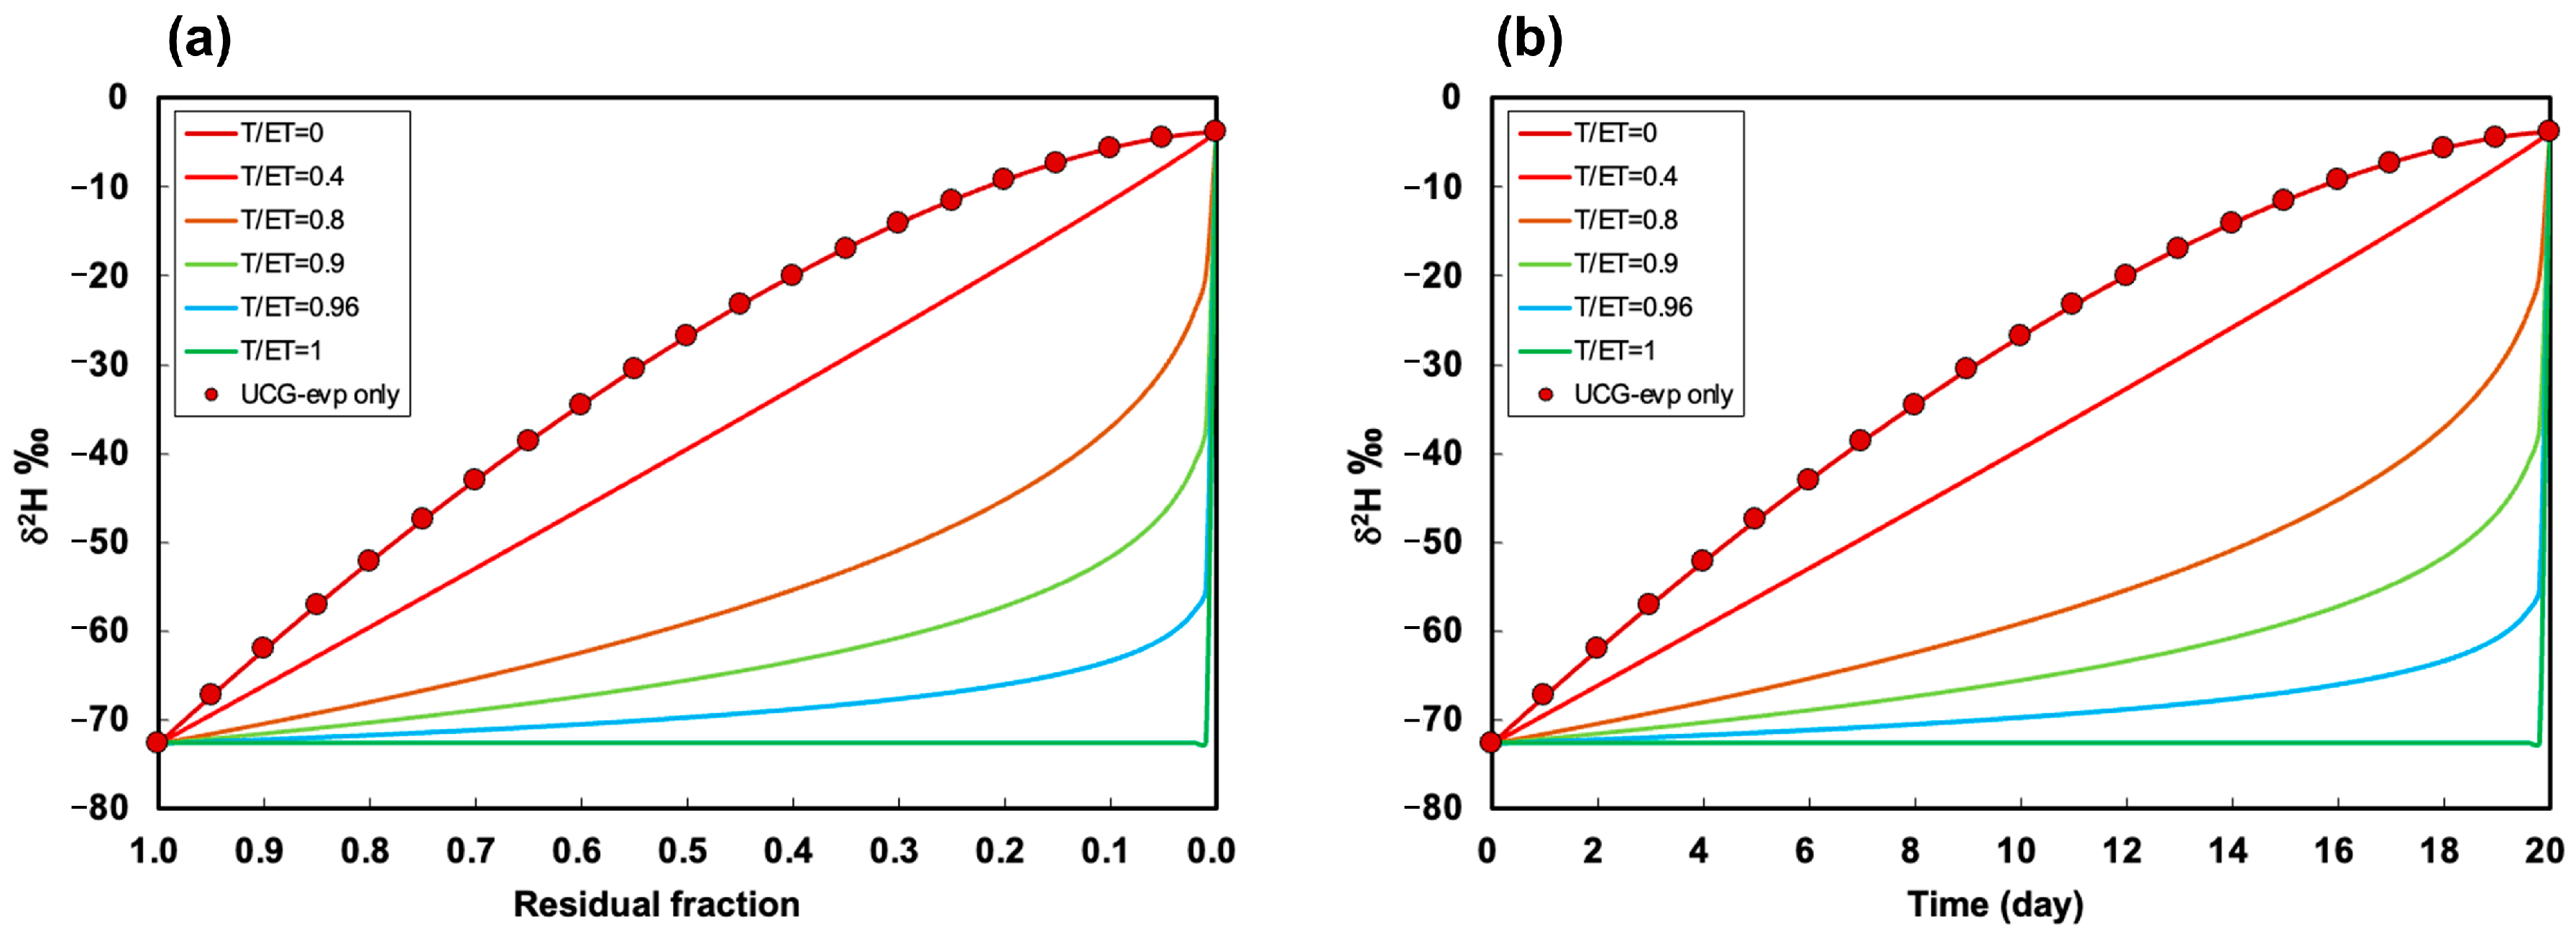
3.2.1. Scenario 1: Constant ET and Varying T/ET

Figure 6 presents the impact of transpiration on the isotopic evolution process of residual water during evapotranspiration. When T/ET = 0, the simulation results of UCG and ET-UCG are consistent, validating the accuracy of the ET-UCG model in describing the stable isotope evolution process of pure evaporative water. However, when T/ET > 0, the residual water isotope evolution line simulated by the ET-UCG model is significantly lower than that simulated by the UCG model, indicating that transpiration plays a significant role in residual water isotope changes. The traditional C-G model may overestimate the degree of residual water isotope enrichment, particularly at high T/ET values, where the remaining water is less enriched. As T/ET increases, the isotopic evolution line of residual water during evapotranspiration gradually transforms from a convex curve to a concave curve, with the water isotopes of residual water during evapotranspiration eventually converging to the same point. In addition, the evolution law of isotopes over time is consistent with that of the residual water fraction (Figure 6b), since the water loss rate is linearly dependent on time under constant ET conditions. These results demonstrate that although the initial and final isotopic composition of an independent water body are the same under different evapotranspiration, the isotopic evolution process of the water body significantly differs during the process of evapotranspiration, and its change rate is controlled by T/ET.
Figure 7 displays the relationship between stable isotopes of hydrogen and oxygen in residual water during evapotranspiration. It shows that the evaporation lines of evapotranspiration water under different T/ET conditions are nearly identical (δ2H = (5.9 ± 0.05) δ18O + (−15.8 ± 0.22)). This finding implies that the isotopic evolution process follows the same evaporation line, even though the processes are different. Additionally, Figure 7b–d highlights that T/ET has an impact on the spread of the residual water isotopes along the evaporation line. Specifically, when the remaining water has a higher T/ET, the isotope points are closer to the initial water, and when T/ET is lower, the isotope points are nearer to the isotope limit points.

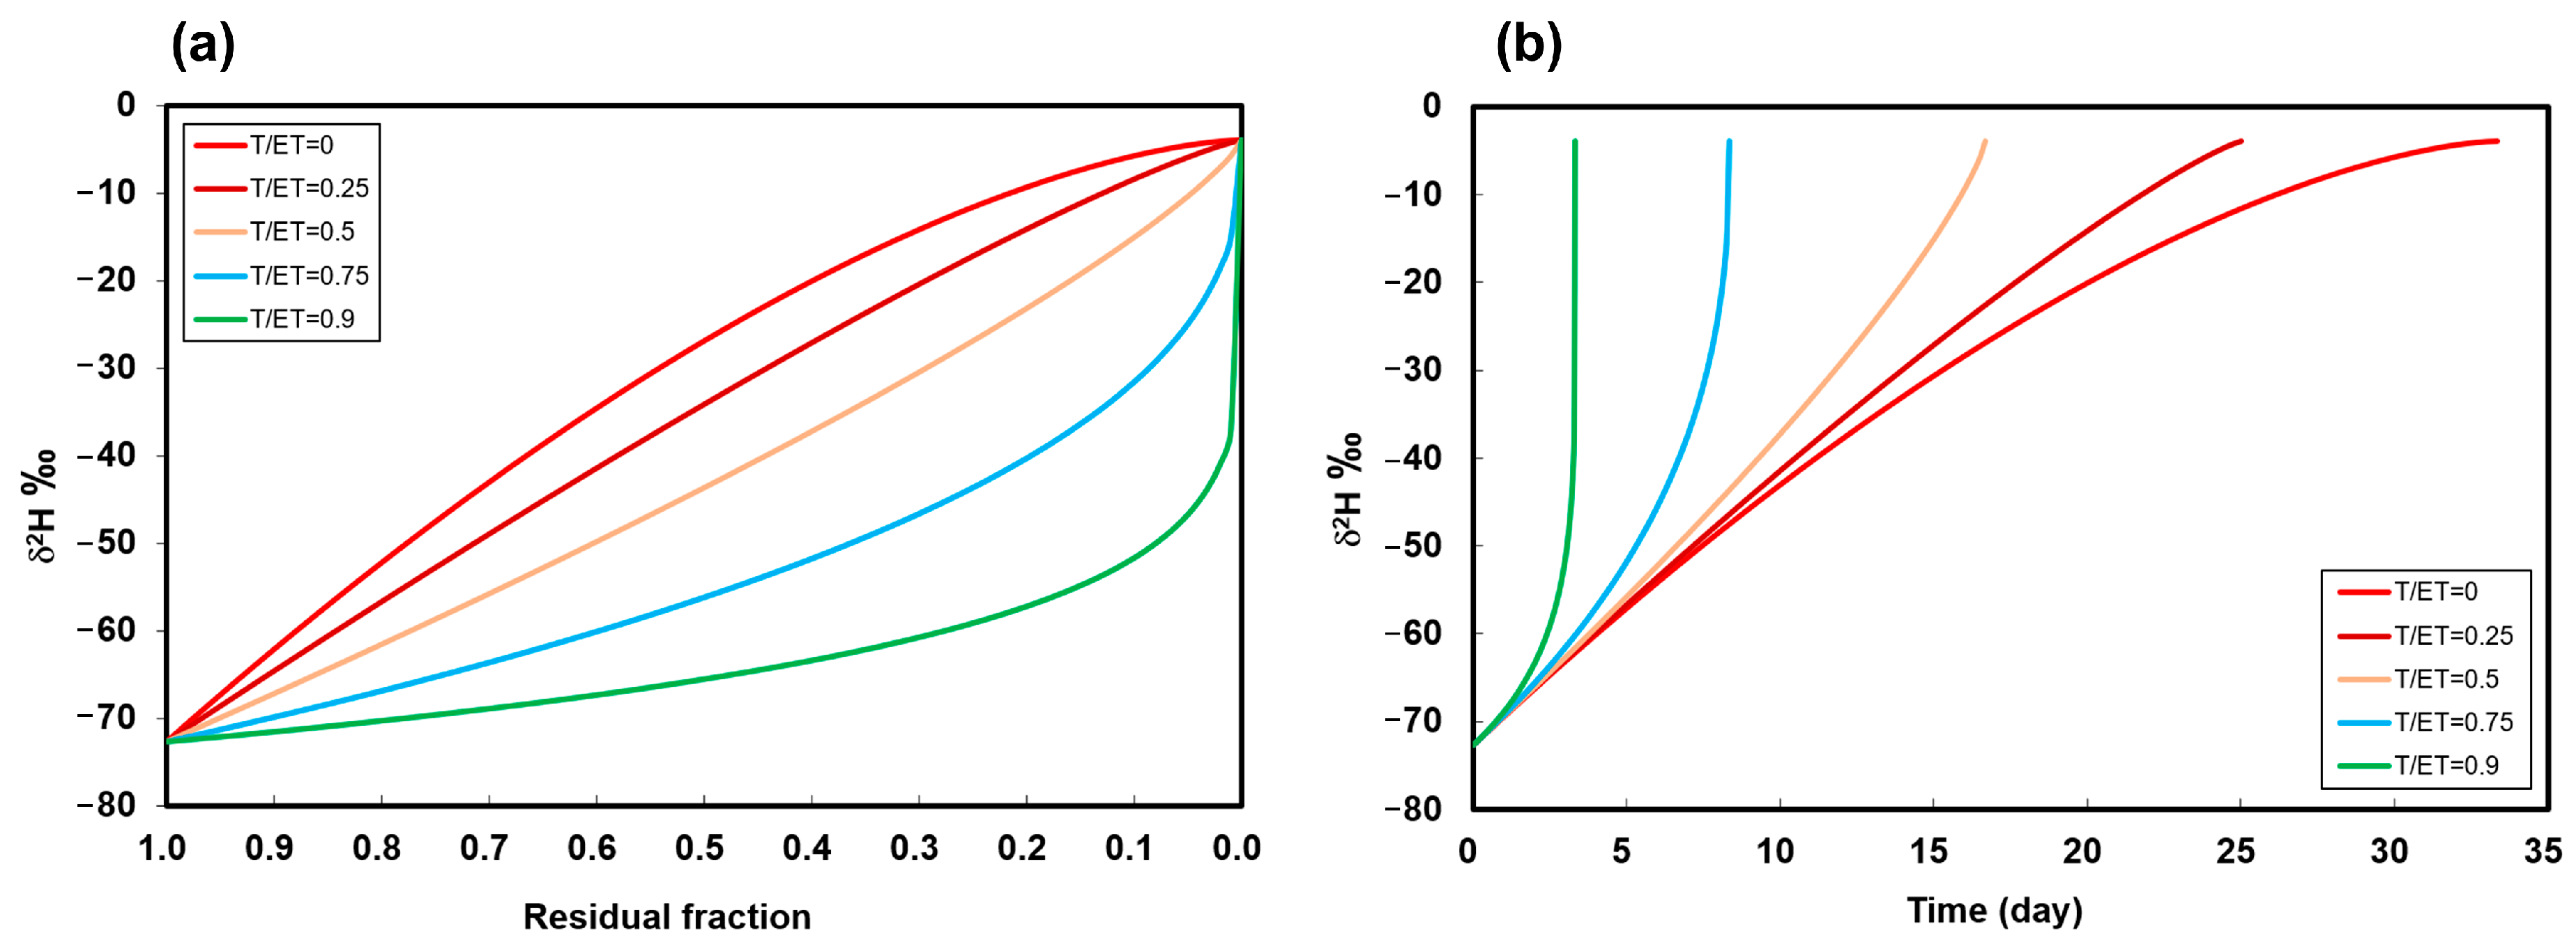
3.2.2. Scenario 2: Constant E and Varying T/ET

In Figure 8, the evolution process of water isotopes with water loss fraction and time under constant E is illustrated. Assuming a constant evaporation rate (E), the water loss rate (equal to ET) increases with the increase in transpiration rate (T), resulting in a varying time for complete water loss depending on T/ET. As depicted in Figure 8a, when T/ET > 0, the isotopic evolution process lines are below the single evaporation process line (T/ET = 0). Furthermore, the isotopes of residual water under the same water loss fraction f, but different evapotranspiration processes, converge to the same point when f = 0, and the larger the transpiration rate, the less enriched the isotopes of residual water. Figure 8b shows the isotopic enrichment process of transpiration water over time, and indicates that at the same time point, the isotopes of residual water are more enriched with a larger T/ET, implying that additional water loss by transpiration promotes the enrichment of residual water despite constant evaporation rate.

4. Discussion

In this study, we observed that water loss through transpiration played a significant role in the isotopic evolution of an evaporation water body. Although transpiration is a non-fractionation process, its influence on the isotopic composition of water is not negligible. Our analysis showed that in the absence of transpiration, the isotopic composition of evaporated samples would evolve along the UCG simulated line (Figure 5). However, in the case of evapotranspiration, the fractionation of water isotopes was controlled by two factors: isotopic fractionation due to evaporation and additional water loss caused by transpiration. The former occurs because lighter water molecules vaporize faster than heavier ones, resulting in the enrichment of 2H and 18O in the remaining liquid [26]. The strength of this fractionation depends on environmental factors such as temperature, humidity, and aerodynamic conditions [27]. On the other hand, the isotopic composition of the residual water was also found to be a function of evaporation fraction (Equation (5)). Transpiration accelerated the loss of water but reduced the true evaporation ratio, thereby indirectly affecting the degree of water isotope fractionation (Figure 4). As a result, the isotopic composition of water under evapotranspiration was less enriched compared to that under evaporation alone. Our findings highlight the importance of considering transpiration when studying the isotopic composition of water in evapotranspiration processes.
The evolution pattern of the residual water isotopes varied with the T/ET value. Our results showed that the evolution line transformed from a convex curve to a concave curve as T/ET increased, and T ET 0.4 corresponded to a sort of ‘divide’ for 2H variations in evaporating water (Figure 6a). This indicated that the presence of transpiration altered the variation rate of the isotopes. As can be seen from Equation (14), the isotopic value (δw) is an exponential function of residual fraction (f). When the exponent B equals 1 (i.e., T ET = 2 1 h ), the isotopic composition of the evaporating water will vary linearly with residual water fraction during evaporation. If the T ET < 2 1 h , it follows that B < 1, and the isotopic composition in evaporating water changes with increasing rate. While T ET > 2 1 h , it follows that B > 1, and therefore the 2H concentration changes with decreasing rate.
However, it was observed that the end points of evapotranspiration water body remained constant under different T/ET conditions (Figure 6 and Figure 8). A comparison of Equations (5) and (14) revealed that the ET-UCG model and UCG are equivalent in form but have distinct parameters, A and B. The A/B ratio, given by the expression A B = h α e q γ α e q α d i f f X γ h , is independent of the transpiration parameter (m), which ensures its consistency across various T/ET conditions. Consequently, the residual water isotope δ value is a function of f and B. When the water is lost completely, (f = 0), δ e n d = 1 A B δ A + 1 . This is consistent with the previous research reporting that the isotopic composition of final evaporated water is influenced by atmospheric water isotopes [28]. Therefore, at the end of the evaporation process, the isotopic composition of residual water is mainly determined by the H and O isotopic composition of the atmospheric air moisture, regardless of the original isotopic composition of the water. This implies that water with different initial isotopic compositions but subjected to similar environmental conditions (temperature, relative humidity, and turbulence) will eventually converge towards the same end δ-value.
It is noteworthy that although the isotopic composition of residual water undergoing evapotranspiration was distinct from that of water undergoing evaporation, the evaporation lines were found to be nearly identical under various T/ET conditions (Figure 7). As can be seen from Figure 2, δ value is only dependent on f under a steady-state evapotranspiration process. Equation (14) can be written as:
δ   = M · f B + N
where M = δ 0 + 1 + A B δ A + 1 and N = 1 A B δ A + 1 , so δ derivative with respect to f:
d δ d f = MB · f B 1
The slope of evaporation line can be obtained by differentiating the derivation of δ H 2 and δ O 18 ,
K = d ( δ 2 H ) d ( δ 18 O ) = M H B H · f B H 1 M O B O · f B O 1
Since the equilibrium fractionation coefficient and dynamic fractionation coefficient of H and O are close to 1 ( α eq 1 ,   α diff X 1 ), B h γ + m h will be independent of isotope type and B H   = B O . Therefore,
K = M H M O = δ 0 2 H + 1 + A H B H δ A 2 H + 1 δ 0 18 O + 1 + A O B O δ A 18 O + 1
According to Equation (21), the slope of evaporation line (K) is just related to meteorological parameters, isotopic value of initial water and atmospheric water. With meteorological parameters (T = 25 °C, h = 0.65 and X = 1), initial value (δ02H = −72.65‰ and δ018O = −9.89‰), and atmospheric water isotopic value (δ02H = −130‰ and δ018O = −28‰), we can obtain an evaporation line slope K ≈ 5.9, which was consistent with the result in Figure 7. As mentioned above, A B is independent on transpiration, so the slopes of evapotranspiration line were identical under different T/ET condition.
The use of hydrogen and oxygen isotopes to quantify evaporation has been based on the assumption that isotopes fractionate only during physical evaporation, and this approach has been widely applied in hydrological studies [14,29,30]. However, this study provides the first evidence that the non-fractionation process of transpiration can also play an important role in controlling stable isotopic changes in evapotranspiration water. In terrestrial ecosystems, transpiration is likely to have a greater influence on soil water isotopic variability, due to its larger proportion in the water cycle [31]. With this in mind, the isotope signatures of a sampled water, such as soil water, may be a result of the combined effects of both evaporation and transpiration. Therefore, when interpreting water isotopic variation or calculating evaporation ratios using the traditional C-G model under evapotranspiration conditions, ignoring the contribution of transpiration may lead to errors in the estimated results.

5. Conclusions

This study has proposed an ET-UCG model to assess the isotopic evolution of water bodies undergoing evapotranspiration. The novel ET-UCG model, in contrast to the traditional C-G model, incorporates the effect of water loss by transpiration on water isotopes during evapotranspiration. Our numerical experiments demonstrated that the residual water isotope composition undergoing evapotranspiration was consistently lighter than that of evaporated water. However, transpiration variability did not impact the evaporation line. Our analyses highlight that the Isotopic composition of residual water during evapotranspiration should be interpreted as a result of combined evaporation and transpiration effects. Therefore, when applying isotope-based methods to simulate evapotranspiration, only considering evaporation fractionation while using the C-G model may lead to significant errors.

Author Contributions

Conceptualization, Y.L. and M.W.; data curation, H.W.; formal analysis, Y.L.; funding acquisition, Y.L.; investigation, J.L. and H.W.; methodology, Y.L. and M.W.; resources, P.L. and M.L.; supervision, M.W., P.L. and J.L.; validation, M.W., P.L. and J.L.; visualization, Y.L., H.W. and M.L.; writing—original draft, Y.L. and M.W.; writing—review and editing, Y.L., M.W. and P.L. All authors have read and agreed to the published version of the manuscript.

Funding

This research was funded by the National Natural Science Foundation of China (NSFC) grant number [42107068 and 41877017], the China Postdoctoral Science Foundation grant number [2021M692744], and the Fundamental Research Funds for the Central Universities, CHD grant number [300102291303].

Data Availability Statement

Data available in a publicly accessible repository.

Acknowledgments

We thank the anonymous reviewers for their valuable suggestions and comments.

Conflicts of Interest

The authors have no conflict of interest to declare.

References

  1. Brooks, J.R. Water, Bound and Mobile. Science 2015, 349, 138–139. [Google Scholar] [CrossRef]
  2. Evaristo, J.; Jasechko, S.; McDonnell, J.J. Global Separation of Plant Transpiration from Groundwater and Streamflow. Nature 2015, 525, 91–94. [Google Scholar] [CrossRef] [PubMed]
  3. Or, D.; Lehmann, P. Surface Evaporative Capacitance: How Soil Type and Rainfall Characteristics Affect Global-Scale Surface Evaporation. Water Resour. Res. 2019, 55, 519–539. [Google Scholar] [CrossRef]
  4. Sprenger, M.; Leistert, H.; Gimbel, K.; Weiler, M. Illuminating Hydrological Processes at the Soil-Vegetation-Atmosphere Interface with Water Stable Isotopes. Rev. Geophys. 2016, 54, 674–704. [Google Scholar] [CrossRef]
  5. Sprenger, M.; Tetzlaff, D.; Soulsby, C. Soil Water Stable Isotopes Reveal Evaporation Dynamics at the Soil–Plant–Atmosphere Interface of the Critical Zone. Hydrol. Earth Syst. Sci. 2017, 21, 3839–3858. [Google Scholar] [CrossRef]
  6. Braud, I.; Biron, P.; Bariac, T.; Richard, P.; Canale, L.; Gaudet, J.P.; Vauclin, M. Isotopic Composition of Bare Soil Evaporated Water Vapor. Part I: RUBIC IV Experimental Setup and Results. J. Hydrol. 2009, 369, 1–16. [Google Scholar] [CrossRef]
  7. Mahindawansha, A.; Külls, C.; Kraft, P.; Breuer, L. Investigating Unproductive Water Losses from Irrigated Agricultural Crops in the Humid Tropics through Analyses of Stable Isotopes of Water. Hydrol. Earth Syst. Sci. 2020, 24, 3627–3642. [Google Scholar] [CrossRef]
  8. Skrzypek, G.; Mydłowski, A.; Dogramaci, S.; Hedley, P.; Gibson, J.J.; Grierson, P.F. Estimation of Evaporative Loss Based on the Stable Isotope Composition of Water Using Hydrocalculator. J. Hydrol. 2015, 523, 781–789. [Google Scholar] [CrossRef]
  9. Dubbert, M.; Cuntz, M.; Piayda, A.; Maguás, C.; Werner, C. Partitioning Evapotranspiration—Testing the Craig and Gordon Model with Field Measurements of Oxygen Isotope Ratios of Evaporative Fluxes. J. Hydrol. 2013, 496, 142–153. [Google Scholar] [CrossRef]
  10. Rothfuss, Y.; Biron, P.; Braud, I.; Canale, L.; Durand, J.-L.; Gaudet, J.-P.; Richard, P.; Vauclin, M.; Bariac, T. Partitioning Evapotranspiration Fluxes into Soil Evaporation and Plant Transpiration Using Water Stable Isotopes under Controlled Conditions. Hydrol. Process. 2010, 24, 3177–3194. [Google Scholar] [CrossRef]
  11. Al-Oqaili, F.; Good, S.P.; Peters, R.T.; Finkenbiner, C.; Sarwar, A. Using Stable Water Isotopes to Assess the Influence of Irrigation Structural Configurations on Evaporation Losses in Semiarid Agricultural Systems. Agric. For. Meteorol. 2020, 291, 108083. [Google Scholar] [CrossRef]
  12. Allison, G.B.; Barnes, C.J. Estimation of Evaporation from Non-Vegetated Surfaces Using Natural Deuterium. Nature 1983, 301, 143–145. [Google Scholar] [CrossRef]
  13. Zimmermann, U.; Münnich, K.O.; Roether, W.; Kreutz, W.; Schubach, K.; Siegel, O. Tracers Determine Movement of Soil Moisture and Evapotranspiration. Science 1966, 152, 346–347. [Google Scholar] [CrossRef] [PubMed]
  14. Jasechko, S.; Sharp, Z.D.; Gibson, J.J.; Birks, S.J.; Yi, Y.; Fawcett, P.J. Terrestrial Water Fluxes Dominated by Transpiration. Nature 2013, 496, 347–350. [Google Scholar] [CrossRef] [PubMed]
  15. Craig, H.; Gordon, L.I. Deuterium and Oxygen 18 Variations in the Ocean and Marine Atmosphere; Consiglio Nationale delle Ricerche Laboratorio di Geologia Nucleare: Pisa, Italy, 1965. [Google Scholar]
  16. Gibson, J.J.; Birks, S.J.; Yi, Y. Stable Isotope Mass Balance of Lakes: A Contemporary Perspective. Quat. Sci. Rev. 2016, 131, 316–328. [Google Scholar] [CrossRef]
  17. Gonfiantini, R.; Wassenaar, L.I.; Araguas-Araguas, L.; Aggarwal, P.K. A Unified Craig-Gordon Isotope Model of Stable Hydrogen and Oxygen Isotope Fractionation during Fresh or Saltwater Evaporation. Geochim. Cosmochim. Acta 2018, 235, 224–236. [Google Scholar] [CrossRef]
  18. Horita, J.; Rozanski, K.; Cohen, S. Isotope Effects in the Evaporation of Water: A Status Report of the Craig–Gordon Model. Isotopes Environ. Health Stud. 2008, 44, 23–49. [Google Scholar] [CrossRef]
  19. Dar, S.S.; Ghosh, P.; Swaraj, A.; Kumar, A. Craig-Gordon Model Validation Using Observed Meteorological Parameters and Measured Stable Isotope Ratios in Water Vapor over the Southern Ocean. Atmos. Chem. Phys. 2019, 1–19. [Google Scholar] [CrossRef]
  20. Benettin, P.; Volkmann, T.H.M.; von Freyberg, J.; Frentress, J.; Penna, D.; Dawson, T.E.; Kirchner, J.W. Effects of Climatic Seasonality on the Isotopic Composition of Evaporating Soil Waters. Hydrol. Earth Syst. Sci. 2018, 22, 2881–2890. [Google Scholar] [CrossRef]
  21. Mahindawansha, A.; Kulls, C.; Kraft, P.; Breuer, L.J.H.; Discussions, E.S.S. Estimating Water Flux and Evaporation Losses Using Stable Isotopes of Soil Water from Irrigated Agricultural Crops in Tropical Humid Regions. Hydrol. Earth Syst. Sci. 2019, 213, 1–28. [Google Scholar] [CrossRef]
  22. Barnes, C.J.; Allison, G.B. Tracing of Water Movement in the Unsaturated Zone Using Stable Isotopes of Hydrogen and Oxygen. J. Hydrol. 1988, 100, 143–176. [Google Scholar] [CrossRef]
  23. Majoube, M. Oxygen-18 and Deuterium Fractionation between Water and Steam. J. Chim. Phys. Phys.-Chim. Biol. 1971, 68, 1423–1436. [Google Scholar] [CrossRef]
  24. Merlivat, L. Molecular Diffusivities of H216O, HD16O, and H218O in Gases. J. Chem. Phys. 1978, 69, 2864. [Google Scholar] [CrossRef]
  25. Barkan, E.; Luz, B. Diffusivity Fractionations of H216O/H217O and H216O/H218O in Air and Their Implications for Isotope Hydrology. Rapid Commun. Mass Spectrom. 2007, 21, 2999–3005. [Google Scholar] [CrossRef]
  26. Clark, I.D.; Fritz, P. Environmental Isotopes in Hydrology; Lewis Publisher: Boca Raton, FL, USA, 1997. [Google Scholar]
  27. Xie, C.; Xiao, W.; Zhang, M.; Liu, S.; Qian, Y.; Zhu, H.; Zhang, Z.; Liu, Q.; Hu, Y.; Wang, J.; et al. Isotopic Kinetic Fractionation of Evaporation from Small Water Bodies. J. Hydrol. 2021, 603, 126974. [Google Scholar] [CrossRef]
  28. Tanny, J.; Cohen, J. Revisiting the Boundary Layer Structure Used in Craig and Gordon’s Model of Isotope Fractionation in Evaporation. Isot. Environ. Health Stud. 2008, 44, 11–21. [Google Scholar] [CrossRef]
  29. Good, S.P.; Soderberg, K.; Guan, K.; King, E.G.; Scanlon, T.M.; Caylor, K.K. δ 2 H Isotopic Flux Partitioning of Evapotranspiration over a Grass Field Following a Water Pulse and Subsequent Dry Down. Water Resour. Res. 2014, 50, 1410–1432. [Google Scholar] [CrossRef]
  30. Xiang, W.; Si, B.; Li, M.; Li, H.; Lu, Y.; Zhao, M.; Feng, H. Stable Isotopes of Deep Soil Water Retain Long-Term Evaporation Loss on China’s Loess Plateau. Sci. Total Environ. 2021, 784, 147153. [Google Scholar] [CrossRef]
  31. Schlesinger, W.H.; Jasechko, S. Transpiration in the Global Water Cycle. Agric. For. Meteorol. 2014, 189–190, 115–117. [Google Scholar] [CrossRef]
Figure 1. The Craig–Gordon (C-G) model is presented in a schematic format to illustrate the two processes involved in the interaction of water to the atmosphere, namely fractionation process in evaporation and condensation of water vapor when it meets a water surface. The symbols in the schematic include RA, the isotope ratio of the vapor in the free atmosphere; RW, the isotopic ratio in the water; RV, the isotope ratio of the vapor layer in contact with the liquid; Resc, the isotope ratio of the vapor that escapes from the equilibrium layer; and Rcap, the isotope ratio of the vapor present in the free atmosphere captured by the liquid water through re-equilibration process; φ v a p and φ c a p are the vaporization rate and the atmospheric vapor capture rate by the liquid water, respectively.
Agronomy 13 01531 g001
Figure 2. Introductory example showing the evolution of the isotopic composition of residual water δw for the case of an isolated volume of liquid water that evaporates into the atmosphere. The initial composition of the source water is δ0, which is −9.89‰ for δ18O and −72.65‰ for δ2H. (a,b) show the hydrogen and oxygen isotopic composition increasing with the decreasing fraction of residual liquid, as they approach the limiting composition.
Agronomy 13 01531 g002
Figure 3. Schematic presentation of the evapotranspiration-unified C-G (ET-UCG) model, involving three essential processes in evapotranspiration, including water returns back to the atmosphere through non-fractionation process in transpiration and fractionation process in evaporation, and water vapor in the atmosphere condenses when it meets water surface. RA, the isotope ratio of the vapor in the free atmosphere; RW, the isotopic ratio in the liquid water; RV, the isotope ratio of the vapor layer in contact with the liquid; Resc, the isotope ratio of the vapor that escapes from the equilibrium layer; Rcap, the isotope ratio of the vapor present in the free atmosphere captured by the liquid water through re-equilibration process; RT, the isotope ratio of the liquid water converted to vapor by transpiration. The φ v a p , φ c a p , and φ T are the vaporization rate, the atmospheric vapor capture rate, and the transpiration rate by the liquid water, respectively.
Agronomy 13 01531 g003
Figure 4. The evaporation ratio (1 − f) varies with time under different evapotranspiration conditions (T/ET = 0, 0.4, and 0.9).
Agronomy 13 01531 g004
Figure 5. Hydrogen isotope evolution of the residual water modeled by the evapotranspiration-unified C-G (ET-UCG) model and the decomposed calculation with the traditional Craig–Gordon (C-G) model, respectively.
Agronomy 13 01531 g005
Figure 6. Isotopic evolution of water along residual fraction (a) and time (b) under varying T/ET with the same meteorological condition and initial water. The simulations of the non-considering transpiration C-G model (UCG) are in agreement with the simulations of the ET-UCG model under the T/ET = 0 condition.
Agronomy 13 01531 g006
Figure 7. Examples of evaporation lines with different T/ET conditions are almost identical (a), while the distribution on the line is different from each other (bd).
Agronomy 13 01531 g007
Figure 8. Isotopic evolution of water along residual fraction (a) and time (b) under varying T/ET with the same meteorological condition and initial water.
Agronomy 13 01531 g008
Disclaimer/Publisher’s Note: The statements, opinions and data contained in all publications are solely those of the individual author(s) and contributor(s) and not of MDPI and/or the editor(s). MDPI and/or the editor(s) disclaim responsibility for any injury to people or property resulting from any ideas, methods, instructions or products referred to in the content.

