Article

Evaluation of Different Methods and Models for Grass Cereals’ Production Estimation: Case Study in Wheat

by
Florin Sala
1,2 and
Mihai Valentin Herbei
3,*
1
Department of Soil Science, University of Life Sciences “King Mihai I”, 300645 Timisoara, Romania
2
Agricultural Research and Development Station Lovrin, 307250 Lovrin, Romania
3
Department of Sustainable Development and Environmental Engineering, University of Life Sciences “King Mihai I”, 300645 Timisoara, Romania
*
Author to whom correspondence should be addressed.
Agronomy 2023, 13(6), 1500; https://doi.org/10.3390/agronomy13061500
Submission received: 8 May 2023 / Revised: 27 May 2023 / Accepted: 28 May 2023 / Published: 30 May 2023

Abstract

:
Adequate management of agricultural crops requires, among other things, accessible and sufficiently accurate methods for assessing plant nutrition and crop vegetation status and for agricultural production estimation. Sustainable technologies are based on correct decisions, prompt interventions and appropriate works, and correct information in real time, and the obtaining information methods can be simple, accessible, and appropriate in relation to different user categories (e.g., farmers, researchers, decision makers). This study used mineral fertilization (NPK), with 11 experimental variants, to ensure a controlled differentiated nutrition of the wheat plants, “Alex” cultivar. Regression analysis was used to obtain models in estimating wheat production, by methods based on: (a) NPK fertilizers applied (F) in the 11 experimental variants; (b) physiological indices (PI), represented by the chlorophyll content (Chl), and plant nutrition status on the experimental variants, in terms of macroelement content in the leaves, evaluated by foliar diagnosis (Nfd, Pfd, Kfd); (c) imaging analysis (IA) based on digital images of the wheat experimental variants, and calculated indices. A set of models was obtained, with different precision levels and statistical safety: R2 = 0.763, p = 0.013 for the model based on applied fertilizers (NPKF); R2 = 0.883, p < 0.01 for the model based on foliar diagnosis (NPKfd); R2 = 0.857, p < 0.01 for the model based on chlorophyll content (Chl); R2 = 0.975, p < 0.01 for the model based on normalized rgb color parameters (RGB color system); R2 = 0.925, p < 0.01 for the model based on the DGCI calculated index. The model based on applied fertilizers (F model) was tested in relation to wheat production data, for a period of six years, communicated by other studies. Fit degree analysis between predicted yield based on the F model and real yield (six-year average) was confirmed by R2 = 0.717, compared to R2 = 0.763 for the F model in this study. The models obtained in this study, related to the “Alex” wheat cultivar, can be used for other studies, but with a certain margin of error, given the coefficient values, specific to the obtained equations. The approach concept, methods, and models presented can be opportunities for other studies to facilitate their comparative analysis, their adaptation, and/or development in the form of new models that are useful in different studies, research, or agricultural practices, for their integration into crop management strategies.

1. Introduction

In current and future agronomic practices, tools and methods that can provide real-time information on plants and crops’ vegetation status and facilitate production estimation are very useful for proper crop management through the appropriate adjustment of agricultural technologies [1,2,3]. The rapid technological progress and high performance in the field of sensors and cameras with digital image capture over a wide spectral range [4,5], combined with information technology for storage, transmission, and image processing [6,7], has increasingly attracted the scientific community around the world [8,9]. Imaging analysis methods are based on the good correlation of plant color, in different vegetation stages, with their specific physiological properties, such as nutrient supply levels, and especially nitrogen content [10,11], chlorophyll content [12,13], photosynthetic activity [14,15], stress factors [16,17], plant health status [18,19], and plant properties that ultimately determine quantitative and qualitative production [20,21].
Soil and plant analysis are basic techniques (classical methods) for assessing soil fertility, nutrient available content for plant nutrition, and fertilizer interventions [22,23], but they are disadvantageous in terms of time, human resources, and costs. At the same time, imaging methods based on remote sensing, UAV, or terrestrial images provide very accurate real-time information on soil quality and fertility [24,25], crops’ response to fertilizer application [26,27], and plants’ nutrition status [10,28,29]. The use of vegetation indices by imaging analysis can remove or mitigate disturbing factors in crop evaluation, such as differences in plant species, canopy coverage, soil background, atmospheric condition, illumination, shadowing, solar angle, etc. [30,31].
Starting more than four decades ago, research into plants’ physiological parameters by spectral techniques (or various analyses of the natural plant carpet, especially of agricultural crops) has led to the proposal and used of various specific indices, such as the Ratio Vegetation Index (RVI) [32,33], Normalized Difference Vegetation Index (NDVI) [34,35], Difference Vegetation Index (DVI) [36], Soil Adjusted Vegetation Index (SAVI) [37,38], Green Normalized Difference Vegetation Index (GNDVI) [39,40], and many others [41,42], being indices that use other spectral bands in addition to the visible spectrum. The DGCI index was proposed by Karcher and Richardson [43], by converting RGB values into the more intuitive hue, saturation, and brightness (HSB) color spectrum, which is based on human perception of color. Dark Green Color Index values were a more consistent measure of green color than were individual RGB values across all turf varieties, corn and cotton, and N treatments [44,45]. For wheat (Triticum aestivum L.), corn (Zea mays L.), cotton (Gossypium sp.), and turf grass (Lolium sp.), strong relationships between processed digital photos, in the form of Dark Green Color Index (DGCI) and N concentration, have also been identified [44,45,46,47].
Recent technological developments in photo-electronics and computer science have also established themselves in the field of image processing and analysis [48,49]. This has facilitated some research in the direction of imaging approaches in the visible spectrum, which are also possible with commercial digital cameras [4,50], of some aspects regarding the quality of the vegetal carpet, nutrition, and plant development as an alternative to spectral, multispectral, or hyperspectral investigation methods, which are more precise but at the same time, much more expensive.
Management in agriculture, from the micro-plot level to the farm level, benefits from the facilities offered by imaging and informatics in soil and agricultural crops’ knowledge, planning of technological works, and specific interventions for obtaining economically efficient yields [51,52]. Estimating production using accessible and safe methods is of interest in relation to crop technologies and influencing factors, including harvesting, transport and production storage, products’ market, and other segments in the agri-food chain [53,54,55].
In the context of the research directions presented, the objectives of this study were to evaluate different accessible methods and models for wheat production estimation based on (i) applied fertilizers (F), (ii) physiological indices (PI) of wheat plants, (iii) imaging analysis (IA), with information representation in different color systems and some calculated specific indices. The model based on applied fertilizers (F model) was verified in relation to other wheat production data, and the safety of results was evaluated comparatively in order of ranking the models obtained based on wheat production prediction safety.

2. Materials and Methods

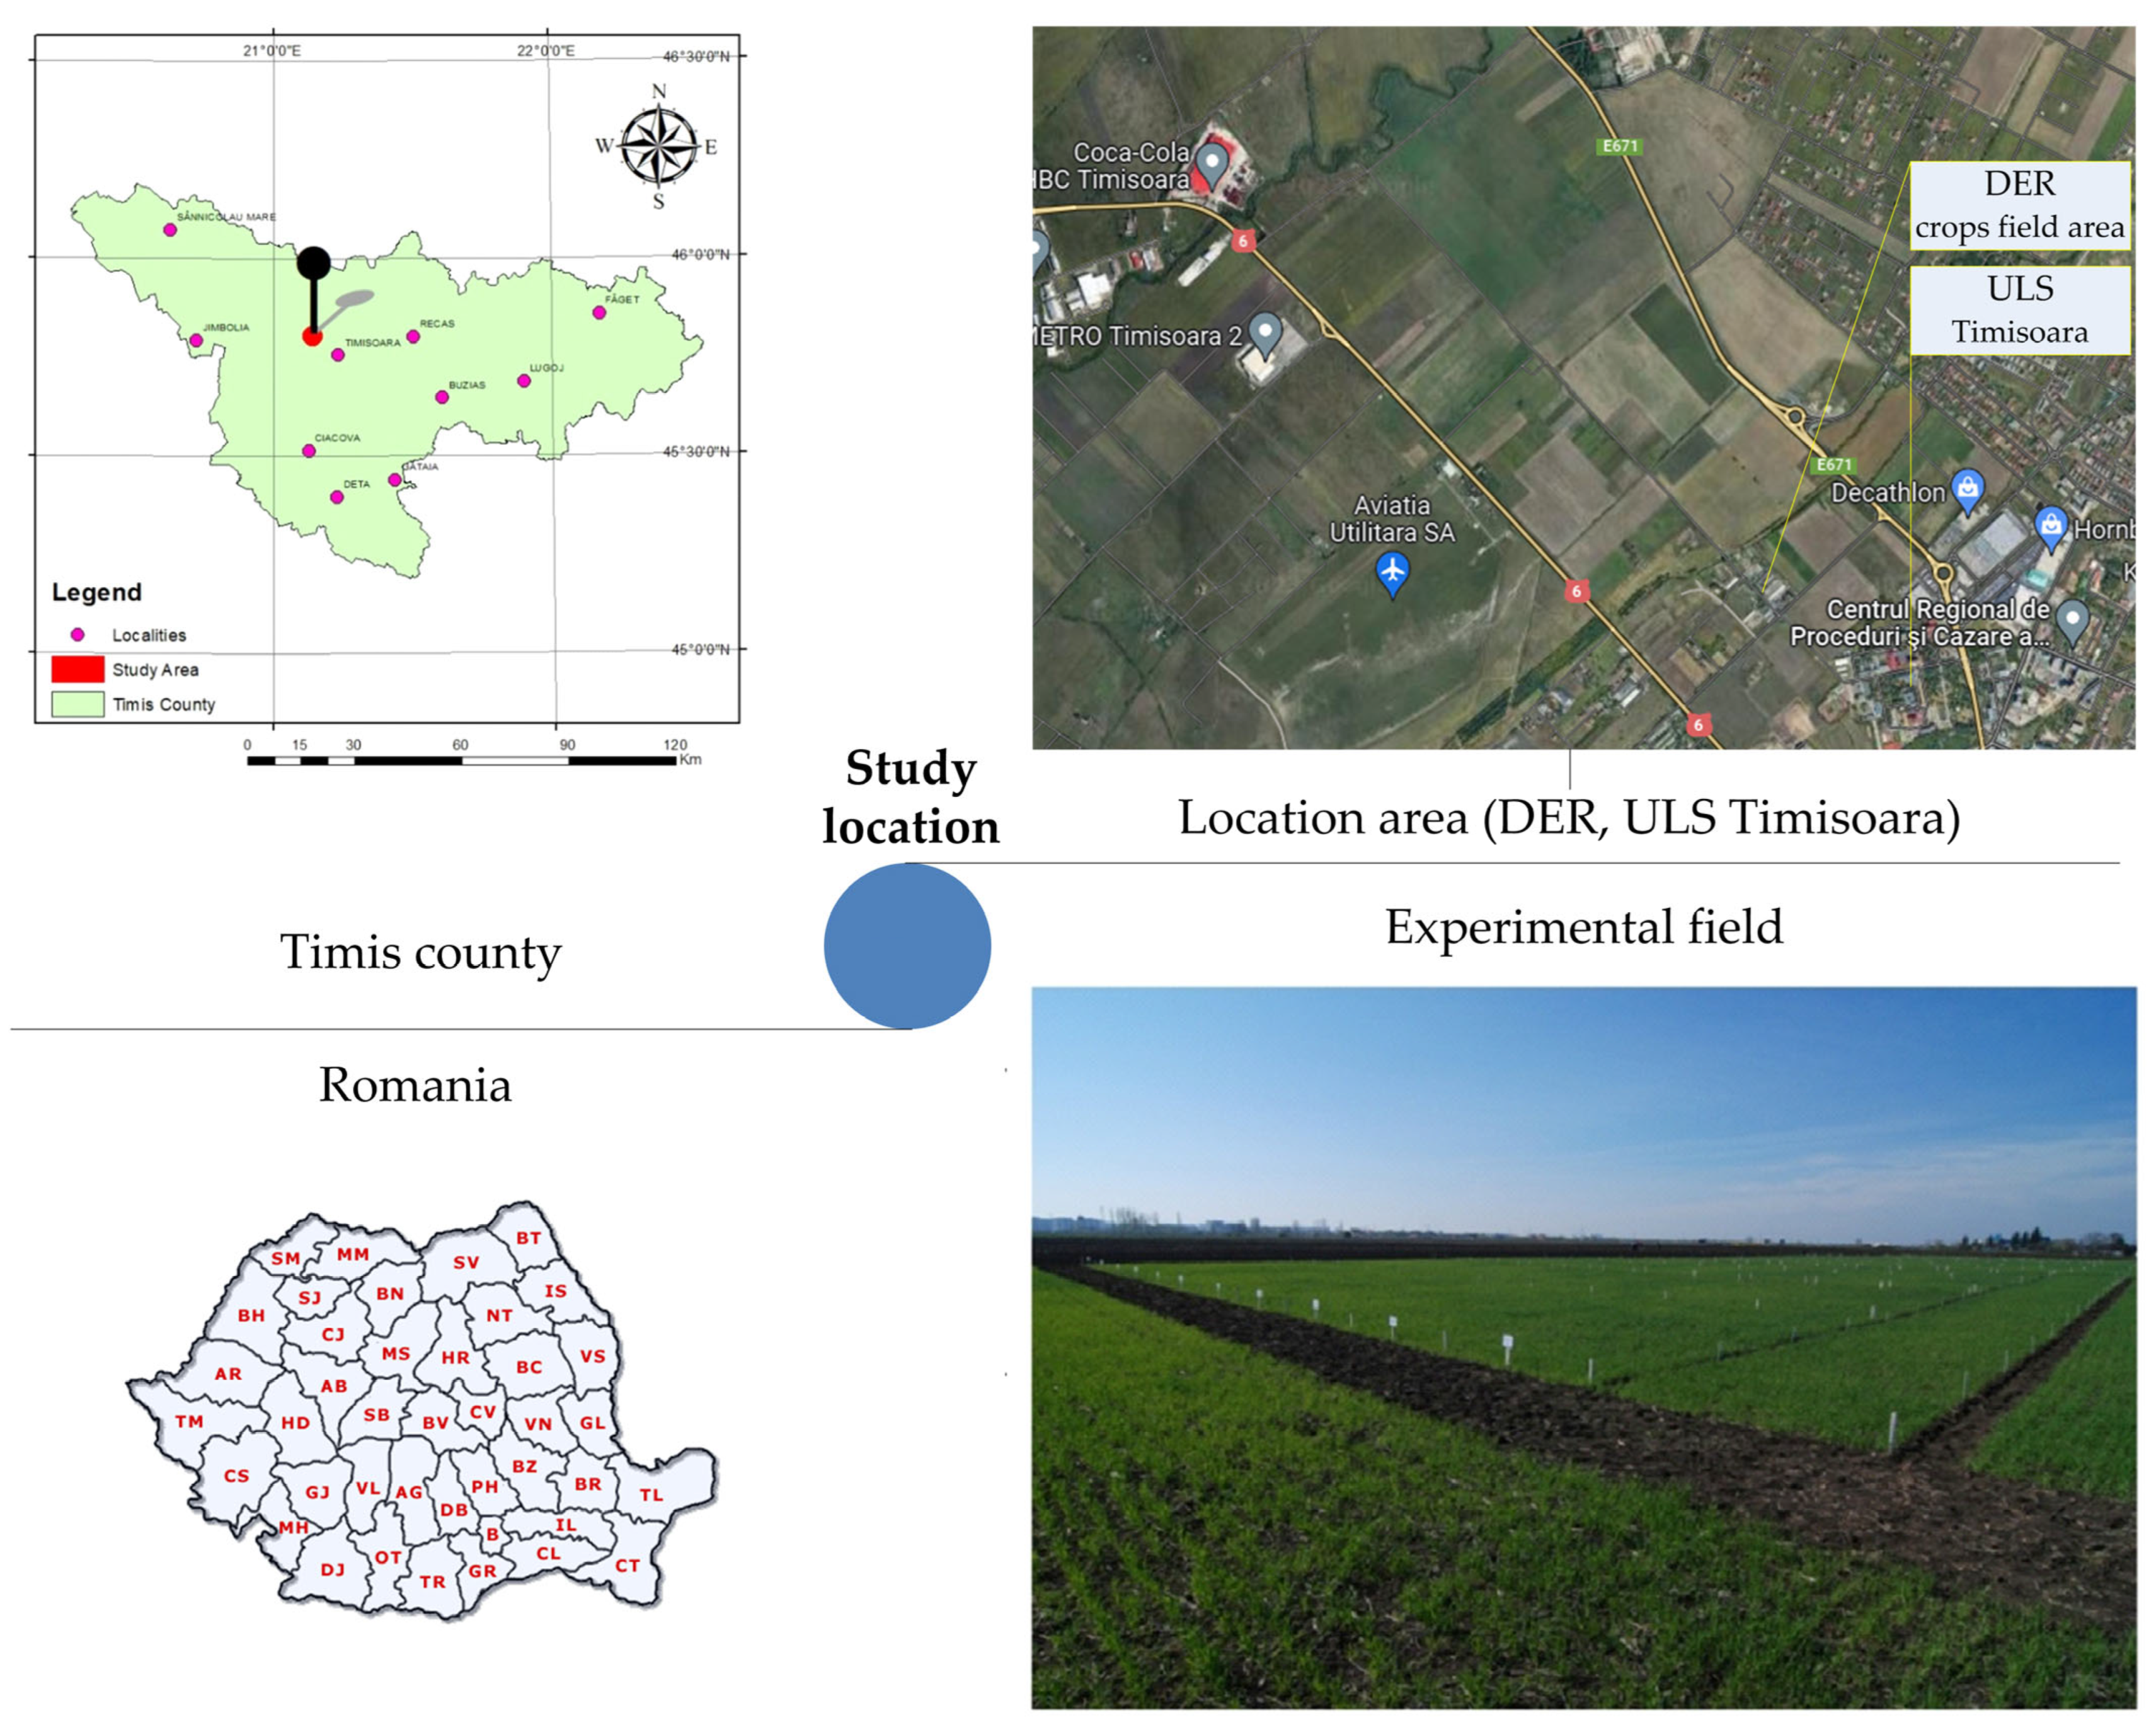
2.1. Field Experiment Location

The experiment was performed at the Didactic and Experimental Resort (DER) of the University of Life Sciences’ “King Mihai I” from Timisoara, Romania (ULS Timisoara). The experimental field was located in plot A 363, topographic coordinates 45°28′30.9″ N, 21°7′9.8″ E, shown in Figure 1. The biological material was represented by the “Alex” wheat cultivar, with high production potential and good quality indices. The “Alex” wheat cultivar is semi-early and has very good tillering capacity. The plants’ height varies between 85 and 100 cm. The ear is ridged, cylindrical–pyramidal, semi-compact, and 6–9 cm long. The grain is ovoid, red in color, and semi-crystalline, with TKW = 45–50 g (TKW—the weight of a thousand grains). The “Alex” wheat cultivar shows good resistance to wintering, good resistance to sprouting in the ear, and medium resistance to lodging, and has good baking indices. The genetic potential of grain production is 7000–8000 kg ha−1. Sowing was performed in autumn (first decade of October), with a 270 kg ha−1 seed rate. The wheat culture was in a non-irrigated system, with an appropriate maintenance technology (herbicide in the spring; no other phytosanitary treatments were applied). The maintenance of the space (access roads) between the repetitions of the experimental variants was performed with a milling machine.

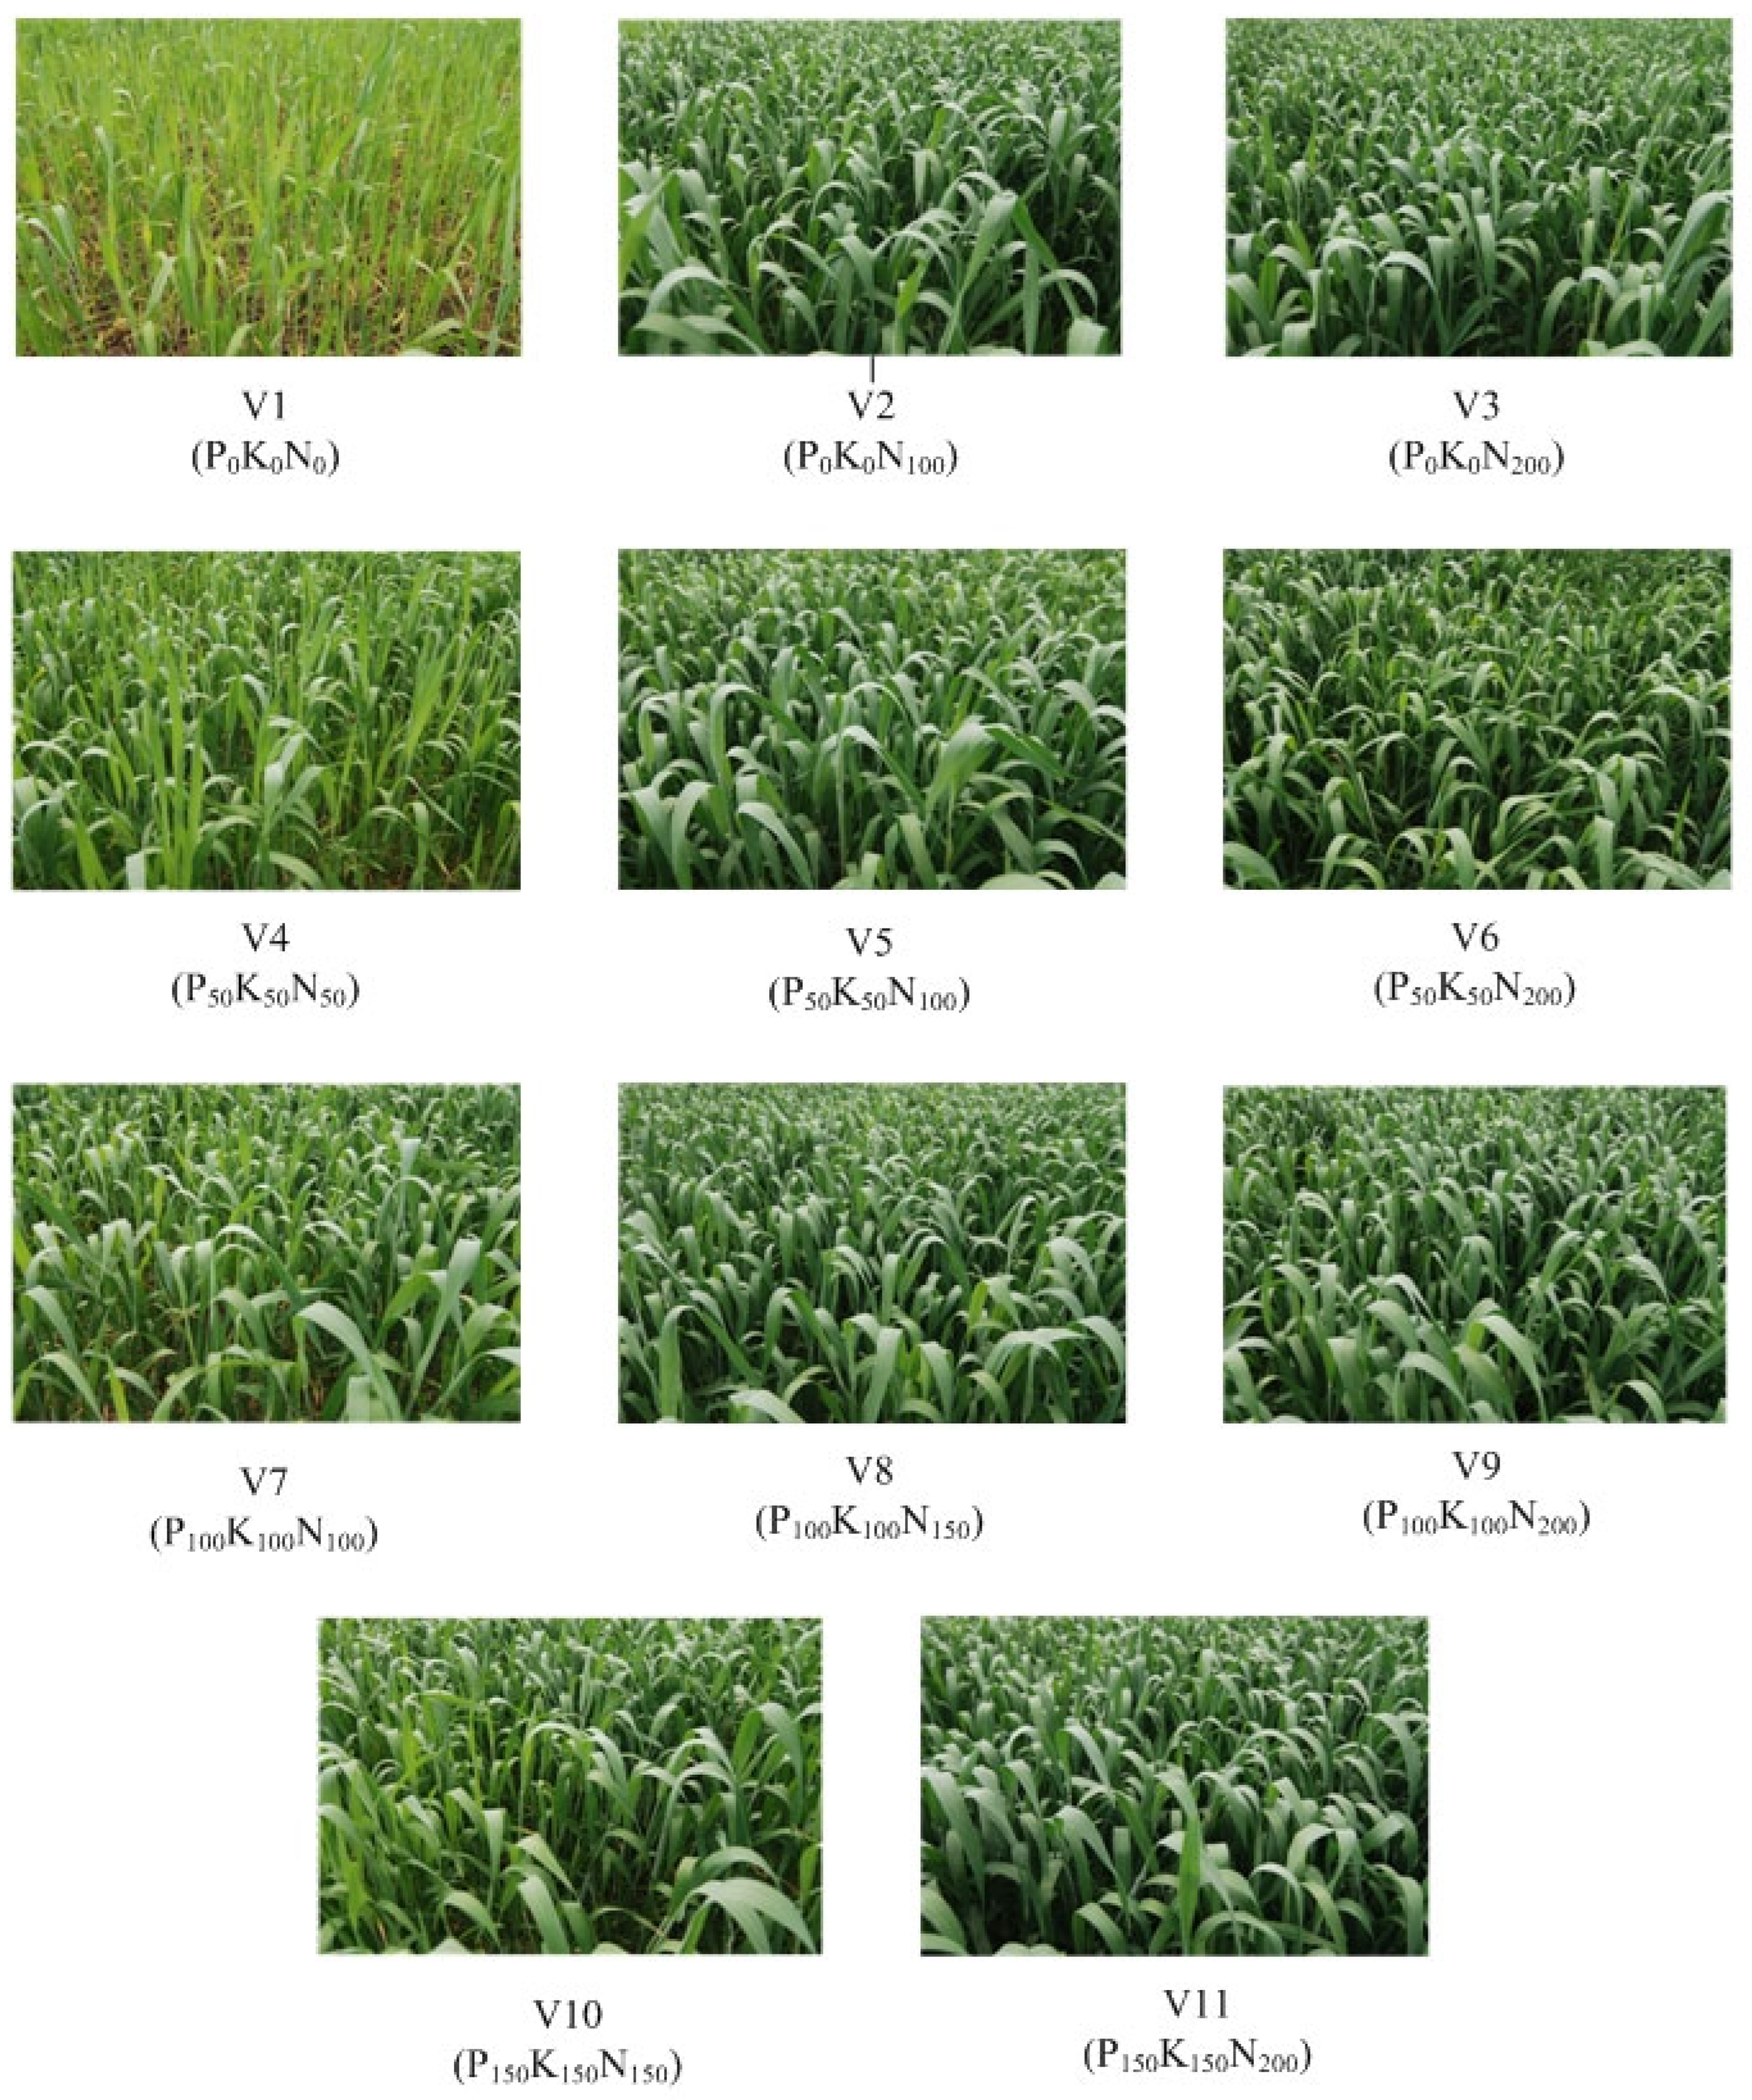
2.2. Experimental Conditions

The specific climatic conditions of the area are characterized by a multiannual average rainfall of 603.3 mm and an average temperature of 10.9 °C, specific to the temperate continental climate with Mediterranean influences. During the experimental period, 2011–2012 agricultural years, the precipitation regime (527.4 mm precipitation) was below the multiannual average and the thermal regime was 1.3 °C above average.
The October 2011–March 2012 period, which represented the first part of the wheat crop vegetation period, recorded an 84.4 mm rainfall deficit compared to the multiannual average, associated with an average temperature 0.6 °C higher than the multiannual average. The second part of the wheat vegetation period (April–July 2012), the most active in terms of plant growth, development, and nutrient consumption, recorded an 11.5 mm slight rainfall surplus compared to the multiannual average and temperatures 2.1 °C above the multiannual average.
The soil within the experimental field is of the cambic chernozem type, with medium–high fertility, expressed by pH = 6.87, H = 3.12% (good insurance, H—humus content), Pmobile = 23.41 mg kg−1 (average insurance), and Kmobile = 178.37 mg kg−1 (good insurance). Pmobile and Kmobile represent phosphorus and potassium assimilable forms, respectively, according to the Egner–Rhiem–Domingo method [57]. The soil samples were taken randomly at a depth of 25 cm (0–25 cm from the ground level), from 50 points on the surface of the experimental field, to estimate the soil fertility level before the placement of the experiment. An agrochemical soil sampler was used as a soil sampling tool.
Given the medium–high level of soil fertility in the experimental field, nitrogen was differentiated into doses between 0–200 kg ha−1, on four PK levels (0, 50, 100, and 150 kg ha−1). Thus, 11 experimental variants resulted (Figure 2), in three randomized repetitions. The size of an experimental plot was 30 m2, being 10 m long and 3 m wide. In the fall, a basic fertilizer was applied with phosphorus, potassium, and one-third of the dose of nitrogen (in the form of granulated complex fertilizer). The nitrogen difference was applied in the spring before the stem elongation phase, in the form of urea. Quantitative macroelement values from fertilizers (NPKF) were used in the regression analysis to obtain models for wheat production prediction based on the applied fertilizers’ method (F).

2.3. Sampling and the Plant Samples’ Analysis

In growth stage 3, stem elongation, code 32–33, BBCH-scale for cereals [58] (in the second decade of April 2012), from each experimental variant, 3 sub-samples of plants (top of plants; 50 plants in each experimental plot) were randomly collected, based on which the average sample for chemical analysis (foliar diagnosis) was formed.
Moisture was determined on the wheat plant samples harvested, by drying in an oven at 70 °C (Heraeus). The dried plant material was used for the analysis of nitrogen, phosphorus, and potassium content total forms. Total nitrogen content (Ntotal) was determined by the Kjeldahl method (Velp Scientific UDK 127 Distillation Unit). Total phosphorus content (Ptotal) was determined calorimetrically with molybdenum blue (Cintra 101 UV-VIS Spectrophotometer, V3793 series). Total potassium content (Ktotal) was determined by flame atomic absorption spectrometry (Varian AA 240, Fast Sequential Atomic Absorption Spectrophotometer) [57]. A portable instrument, SPAD 502Plus (Konica Minolta Sensing Inc., Tokyo, Japan), was used to determine the chlorophyll content of wheat plant leaves, which expressed the chlorophyll content in a numerical SPAD value, in proportional relation to the amount of chlorophyll present in the leaves (measurement area: 2 mm × 3 mm, accuracy within ±1 SPAD unit). The chlorophyll content determination was performed in the field (non-destructive method), at the same time as plant samples’ collection, by repeated readings on 20 different plants, chosen randomly in each variant. The chlorophyll reading was performed on the third leaf (last developed at this stage).
At physiological maturity (July 2012), mechanized harvesting on each plot, for all three repetitions (Hege 125B Small Plot Combine, Stuttgart, Germany), and quantitative determination (laboratory technical balance with ±0.100 kg accuracy) were performed (14% humidity at the time of determination). The values of chlorophyll content (Chl) and macroelement content in wheat plants evidenced by foliar diagnosis (NPKfd) were used in the regression analysis to obtain models for wheat production prediction based on the physiological indices’ method (PI).

2.4. Capturing Digital Images and Calculating Specific Indices

Digital images were captured with a Nikon D80 camera with 10.2 MP DX resolution. Digital images were taken in identical positioning and setting conditions of the device for all variants, simultaneously with SPAD measurements and plant sampling. The camera was mounted at a constant height of 1.3 m (tripod) on a custom-made frame. Images were taken at the nadir position, between 13:00 and 14:00 h, with the following settings: auto-focus, f-stop 5.6, exposure time 1/200 s, exposure bias + 2 steps, ISO 100, focal length 22 mm, mattering mode pattern, manual white balance (clouds), and resolution 300 DPI, shown in Figure 2. Images were analyzed from the original digital capture format with Optika Vision Pro v. 2.7 software (Optika s.r.l., Italy). Each image was uploaded to the program and fully processed with the Measure/Grid/Line options. The whole image processing, and not just a fraction of it, was chosen in order to ensure a natural mediation of the parameters related to the incident solar radiation and wheat canopy reflection. The image analysis was performed both in the Cartesian colors space (RGB, CMYK) and using the cylindrical coordinates specific to the CIE L*a*b*, HSB, and HSL systems, whose calculation was performed through online software [59].
Based on the current RGB values, resulting from the primary image analysis, the normalized values were calculated, in the form r, g, and b, according to [60], shown in Equation (1).
r = R ( R + G + B ) g = G ( R + G + B ) b = B ( R + G + B )
Based on the calculated normalized values (rgb), two synthetic indices were calculated: NDI (Normalized Difference Index), to better highlight the contrast between plant and soil color [61], and INT (Intensity), which allows a better differentiation of a light color from a dark one [62]. The calculation of the two synthetic indices (NDI and INT) was made on the basis of Equations (2) and (3), according to [60]. The two indices were used successfully to track the nitrogen status of rice and to generate formulas for estimating nitrogen requirements by analyzing digital images [60].
NDI = ( r g ) ( r + g + 0.01 )
INT = ( R + G + B ) 3
Moreover, for estimating the nitrogen supply of cereal plants, Karcher and Richardson [43] proposed the use of the DGCI index (Dark Green Color Index), calculated on the basis of HSB indices (H—hue, S—saturation, B—brightness) [44], shown in Equation (4).
DGCI = H 60 60 + 1 S + ( 1 B ) / 3
The parameter values in different color systems, and of the three calculated synthetic indices, were used in the regression analysis to obtain models for wheat production prediction based on an imaging analysis method (IA).

2.5. Mathematical Analysis and Modeling

The experimental data obtained regarding the production (Y, kg ha−1), the contents in macroelements from the leaves, determined by the foliar diagnosis (Nfd, Pfd, Kfd), the chlorophyll content (Chl, SPAD), imaging parameters in different color systems, and calculated indices (NDI, INT, DGCI) were mathematically and statistically processed using the mathematical module from Excel 10 (Microsoft Office) and Past software [63]. Regression analysis was used to obtain the equations, as independent models, which described the estimation of wheat production in relation to the applied fertilizers’ method (F), physiological indices’ method (PI), and parameters considered for the imaging analysis method (IA). For statistical certainty of the results, appropriate statistical parameters such as the regression coefficient (R2), parameter p (95% confidence), RMSEP parameter (root mean square error of prediction), and REP parameter (relative error of prediction) were considered.

3. Results

3.1. Wheat Production Estimation Based on Applied Fertilizers’ Method (F)

In the context of the experimental conditions, the mineral fertilization applied determined the wheat production variation, “Alex” cultivar, between 2625 ± 217.46 kg ha−1 (V1) and 6625 ± 324.04 kg ha−1 (V9). In soil conditions with good agrochemical properties, specific to the experimental field location, only the application of nitrogen fertilizers generated a substantial increase in wheat production, from 2625 ± 217.46 kg ha−1 in the control variant (V1) to 6000 ± 273.86 kg ha−1 in the V2 variant and 6525 ± 131.49 kg ha−1 in the V3 variant, respectively. Under the conditions of a lower level of phosphorus in the soil, a favorable influence on wheat production was registered in the case of phosphorus provided by fertilization. At the same time, the good intake of potassium in the soil caused the potassium in the fertilizers to have a minor influence on wheat production (Table 1).
The wheat production estimation method, based on the macroelements (N, P, K) from the applied fertilizers (F), is given by Equation (5), in statistical safety conditions (R2 = 0.763; p = 0.013).
Y NPK F = 3742.57 + 14.2071 N F + 1.8485 P F + 0 K F
The values of the Equation (5) coefficients highlighted the different weight with which each nutrient applied by fertilization (NF, PF, KF) contributed to the production formation, in the specific experimental conditions. Nitrogen from fertilizers (NF) had the highest contribution (14.2071, NF coefficient value), followed by phosphorus (1.8485, PF coefficient value), while potassium from fertilizers (KF) was shown not to influence wheat production, under the specific experimental conditions. This estimation method and Equation (5) type model (with statistical safety parameters) shows the real behavior of the production in relation to the doses of applied fertilizers and nutrients. The soil, climatic, and technological conditions determined that the nutrient use efficiency from fertilizers is very variable. The efficiency of the nutrients’ use from fertilizers is of interest, with the most frequently studied being the nitrogen use efficiency, in relation to the production, or other agronomic, economic, or ecological elements. In this sense, this approach and model, which expresses the production in relation to the nutrients in applied fertilizers, can be considered and integrated with other studies and objectives in order to optimize agricultural technologies. It can be used to predict wheat production for the coming year, and can also be adjusted in relation to the feedback received.

Model Based on Applied Fertilizers (F) in Agricultural Practice

As a result of the importance in agricultural practice of models based on applied fertilizers, from the perspective of optimizing agricultural inputs and estimating yields, an analysis of the F model behavior was made in relation to wheat production values communicated by other studies.
For this purpose, the F model based on the applied fertilizers, in Equation (5), was used to estimate the production of wheat, Ciprian cultivar, in relation to the applied fertilization (25 experimental variants with N and P), within a study communicated by Agapie et al. [64]. To verify the F model, wheat production data for four years and the average data for the study period (2016–2021) according to [64] were considered for analysis. Wheat production was estimated based on the F model in Equation (5), and the prediction errors were calculated, shown in Table 2.
From the fitting analysis (linear equations) of the values of the predicted production with those of the real production, for the years considered in the comparative analysis, the following variable values of the regression coefficient resulted: R2 = 0.930 in the case of 2016; R2 = 0.574 in the case of 2018; R2 = 0.457 in the case of 2019; R2 = 0.717 in the case of average values for 2016–2021.
The value of the regression coefficient R2 = 0.717 resulted from the fitting analysis between predicted yield based on the F model, Equation (5), and real yield, the average value over six years communicated by Agapie et al. [64], with another wheat cultivar (Ciprian), and cultivation conditions indicate that the model obtained has a realistic construction, stability, and safety (R2 = 0.763 in this study).

3.2. Wheat Production Estimation Based on the Physiological Indices’ Method (PI)

3.2.1. Wheat Production Estimation Based on Leaves’ Nutrient Content (Foliar Diagnosis)

Wheat production can be considered as a synthetic expression of plant metabolism, of the way in which plants convert solar radiation into useful biomass, on the background of a differentiated nutrition, in relation to the doses of applied fertilizers (NPK). Plant metabolism is mainly significantly influenced by the macronutrients level, and this results in foliar diagnosis, in certain wheat crop vegetation’s stages, being considered as an effective method of grains’ production estimation, due to its direct relationship with the state of plant nutrition [65]. Wheat plants’ nutrition status is the basis for the physiological indices and metabolic processes manifestation, with high importance in quantitative and qualitative production formation. Evaluation of the wheat plants’ nutrition status, in terms of leaves’ nutrient content (Nfd, Pfd, Kfd), was made in the growth stage 32–33 BBCH code (growth stage 3, stem elongation), in the specific conditions of this experiment, with the results presented in Table 3. Associated with wheat plants’ nutrition status, as an effect of applied fertilizers, variable values of chlorophyll content (Chl) in the experimental variants were registered, as shown in Table 3.
The wheat production (Table 1) estimation method, based on foliar diagnosis, respectively, based on the leaves’ nutrient content (Nfd, Pfd, Kfd, Table 3), as plants’ physiological response to differentiated nutrition provided by fertilization, was given by Equation (6), in conditions of R2 = 0.883; p < 0.01 (p = 0.0011).
Y NPK fd = 988.31 + 246.8347 N fd + 2983.035 P fd 620.87 K fd

3.2.2. Wheat Production Estimation Based on Chlorophyll Content

As a physiological index, the chlorophyll content is a good indicator for reflecting the general plants’ vegetation status, and especially the plants’ nitrogen supply level, which is the macroelement with a decisive role in the production formation [66,67]. The values of the wheat plants’ chlorophyll content on the experimental variants (Table 3), determined by the non-destructive method (SPAD 502Plus), were used for wheat production estimation. Wheat production, as a dependent variable by the chlorophyll content (Chl), is given by Equation (7), under conditions of R2 = 0.857; p < 0.01.
Y C h l = 8204.21 + 273.1262 C h l

3.3. Wheat Production Estimation Method by Imaging Analysis Method (IA)

In the stem elongation stage (BBCH-scale for cereals, growth stage 3, stem elongation, code 32–33), digital images captured the wheat crop vegetation state in relation to applied fertilizers, as shown in Figure 2. From an analysis of the digital images, the RGB spectral values were obtained. Based on calculations (Equation (1)), the normalized values, in rgb form, were obtained and were converted into complementary values in other color representation systems (HSB, HSL, CIE L*a*b*, CIMIK), as shown in Table 4. Based on the normalized values (rgb) and the specific relations (Equations (2) and (3)), the NDI and INT indices were calculated, and based on the values from the HSB system (Table 4) and Equation (4), the DGCI index was calculated (Table 5).
Using regression analysis, the wheat production estimation equations were obtained, based on different color systems’ parameters (Table 4) and the calculated indices (Table 5). The mathematical expressions of the obtained equations and the values of the statistical parameters (R2, p 95% confidence, RMSEP, REP) that reflect their safety are given in Table 6 and Table 7.
The value series’ matching degree regarding the estimated production and the measured production was evaluated, for an additional verification and confirmation of the accuracy level for the production prediction, based on the methods considered and the models obtained (Supplementary Figure S1).
Moreover, Cluster Analysis (paired group algorithm, Euclidean similarity measure [63]) was used to evaluate the level of similarity of the methods and models used in relation to the estimated production values, compared to real production, for each variant. The dendrogram in Supplementary Figure S2 was the result based on the analysis, under conditions of statistical safety (Coeff. Corr. = 0.967). Several sub-clusters resulted, in which the variants (estimated production in relation to the used model, and real production) were associated based on similarity. In the same cluster with real production (Y-Real), the productions estimated based on RGB color parameters, Y(RGB), rgb normalized Y(rgb), CMIK parameter Y(CMIK), and CIE L*a*b* parameter Y(Lab), were associated. Associated with this sub-cluster, there was a sub-cluster that included production estimated based on HSB color parameters Y(HSB), HSL color parameters Y(HSL), and the DGCI index Y(DGCI). The other production estimation models occupied other positions within the dendrogram, in relation to their level of similarity. Additionally, the values of the similarity and distance indices (SDI) were calculated (Supplementary Table S1), and from the analysis of the obtained values, the positioning in ascending order compared to the real production (Y-Real) of the other production estimation models is graphically presented in Supplementary Figure S3 (the smallest SDI value is preferable). All these were considered to be arguments that support the safety of the methods and models used in wheat production estimation, as well as their classification order regarding the safety of the estimated production, compared to the real recorded production.

4. Discussion

To estimate wheat production, different criteria were considered, such as applied fertilizers (NF, PF, KF), physiological indices (plant nutrition status in the form of Nfd, Pfd, Kfd, and chlorophyll content Chl, SPAD units), color parameters obtained by imaging analysis (RGB; rgb; HSB; HSL; L*a*b*; CMYK), and the calculated indices (NDI, INT, DGCI). This resulted in several methods for estimating wheat production, and within each one, different models were obtained in the form of equations. To evaluate the safety of the results obtained by different methods, and corresponding models in the form of different equations, representative statistical parameters were used: root mean square error of prediction (RMSEP) and relative error of prediction (REP), presented in Table 7.
The methods, tools, and models of plant analysis for assessing the vegetation status of agricultural crops and production estimation, in relation to different influencing factors, have devolved over time depending on the knowledge level and available techniques [68,69,70]. Technological and IT facilities have been developed and diversified, so that they have been implemented with increasingly accessible equipment and devices that facilitate real-time evaluation and estimation of crops and yield, or certain quality parameters, based on physiological indices, or based on plant vegetation status (eco–physiological plants’ properties) [71,72]. Agricultural crops’ yield prediction is of interest and has been studied in relation to climatic and soil conditions, different crops, and agricultural technologies, yields, methods, and techniques of approach, etc. [72]. Prediction methods based on soil and environmental parameters, in relation to agricultural crops, are important due to the direct plants–soil environmental relations, which influence the physiological plants’ processes [73].
From the comparative analysis of the fit level between the predicted productions on each obtained model, and the real production measured Y (M), different fit levels were found. The values of the statistical safety parameters (p, R2) recorded for each fitting analysis highlighted and confirmed the safety level of each model. Thus, the safety of the models evaluated based on RMSEP and REP (Table 7) was also confirmed by parameters p and R2 related to the fitting lines between the predicted production and the real production, measured Y (M).
The best fit was recorded for the model based on rgb parameters (normalized values), in which case R2 = 0.975; p < 0.001 were recorded. The respective model was also confirmed by Cluster Analysis (Supplementary Figure S2), respectively based on SDI values (Supplementary Table S1, Supplementary Figure S3).
Fertilizers represent a category of inputs with a decisive role in defining agricultural productions, their quality, economic yields, differentiated in relation to the crop plant, the category of agricultural products, and the level of analysis [74,75]. Strong (and very strong) correlations were found between fertilizers and wheat production, respectively, and production quality indices, in different experimental conditions, regarding the location, soil types, cultivated wheat genotypes, types of fertilizers, and cultivation technologies [76,77,78]. Based on the strong correlations between biomass, grain production, and wheat quality indices, it has been suggested that biomass can be used as an indicator of cereal response to N in terms of yield [79]. Zhou et al. [80] reported definite results on the prediction of spatial variability of production and quality indices for wheat in relation to fertilizers, in terms of the obtained prediction models’ statistical safety (based on r and RMSE). Models of production prediction based on fertilizers’ rate (or other inputs) have been studied in wheat [81], but also in other crops or interest plants (such as wild oats) [82]. In the context of the present study, wheat production estimation based on the applied fertilizers was possible, in statistical safety conditions, according to R2 = 0.763; p = 0.013. This safety level registered suggested that the use of nutrients from fertilizers was influenced by a number of factors, with reference to soil, environmental conditions, and plant genotype. The regression coefficient value (R2 = 0.717), resulting from the fitting analysis between predicted yield based on the F model, Equation (5), and real yield, average value over six years [64], with another wheat cultivar (Ciprian) and growing conditions, indicates that the model has a realistic construction, stability, and safety (R2 = 0.763 in the case of the F model in this study).
Different fertilizers and fertilization rates were evaluated and quantified in relation to wheat plants’ nutrition status and the distribution of some mineral elements in plants’ organs [83], or in relation to plants’ nitrogen uptake [84,85]. In addition to the analytical methods for determining the nutrient content in wheat plants (e.g., N), the imaging methods, based on reflectance, have been successfully used and present multiple perspectives for precision agriculture, smart agriculture, and agriculture of the future [23]. Foliar diagnosis is primarily a method of assessing and controlling the state of plants’ nutrition, in order to make corrections in the sense of nutrients provided (especially nitrogen) at the level of plant consumption corresponding to a certain level of expected harvest [86,87]. In the present study, yield prediction based on macronutrients’ content determined in wheat leaves by foliar diagnosis (NPKfd) was possible under conditions of R2 = 0.883; p < 0.01. The safety level for yield prediction based on foliar diagnosis (NPKfd) was superior to the applied fertilizers’ method (NPKF), which suggests that the plant’s nutrition status is a safer indicator in estimating production than nutrients applied to the soil by fertilizers.
Chlorophyll a is a physiological index that expresses the plant’s nutrition state (especially with N), as well as the vegetation state in relation to soil organic matter and nitrogen availability [67], or in relation to different vegetation factors such as light/shading of wheat plants [88]. Production estimation based on physiological indices has been a long-time concern, so Reeves et al. [89] predicted wheat grains’ production based on the chlorophyll content determined during the vegetation period, growth stage 5. Liu et al. [90] reported the results on the use of production prediction models for six rice varieties, based on chlorophyll content and foliar indices (LAI) and N indicators (LNA and PNA), respectively. According to authors, the production prediction was possible in statistical safety conditions (p < 0.001; R2 = 0.81 to R2 = 0.94; RRMSE = 0.078 to RRMSE = 0.196), in relation to the obtained models and predicted elements. Liu et al. [91] reported production prediction models based on chlorophyll content in rice, in relation to various doses of fertilizers that induced variation in nutrition and chlorophyll content in plants, and production prediction was possible under high statistical safety conditions (r = 0.88, RMSE (95%) = 0.48 for Model1, and r = 0.91, RMSE (95%) = 0.39 for Model2, respectively). Walsh et al. [92] reported that the variation in spring wheat yield can be explained based on SPAD and NDVI indices (80% and 84%, respectively), and this fact suggested the possibility of wheat production prediction based on the respective indices. Under the conditions of the present study, the estimation of wheat production based on chlorophyll content was possible under conditions of R2 = 0.857; p < 0.01, values that fall within safety intervals communicated by other authors for similar studies.
Imaging-based wheat production potential prediction has been found to be useful for adjusting fertilizer doses (N) during the growing season [36]. Using regression analysis, models were obtained in different color systems (RGB, HSI, La ∗ b*) in order to evaluate the chlorophyll content and the plant’s nutrition status, in statistical safety conditions [93,94]. Liu et al. [95] reported results on the rice yield estimation in relation to the N rate and plant density, and in relation to plant color indices and normalized values (NRI, NGI, and NBI). The authors reported the high statistical safety of the fitting equations obtained for the purpose of predicting production (p < 0.05). Regression models based on color parameters (RGB, rgb), or DGCI–rgb combination, facilitated good prediction of chlorophyll content (Chl) relative to actual chlorophyll content in rice. The artificial neural network model facilitated a better prediction of Chl based on RGB compared to regression models [96]. Ali et al. [97] used determinations based on the leaf chlorophyll meter and GreenSeeker sensor to evaluate nitrogen supply and wheat grain production, and the obtained models were independently validated on other crops, in statistical safety conditions (R2 = 0.61 and R2 = 0.85, respectively). Based on the information in a multicolored fusion space, regression models were obtained for the Chl content prediction in wheat plants in relation to the N doses used, in statistical safety conditions (R2 = 0.794, RMSE = 4.304) [98]. Zhou et al. [80] reported results on the prediction of spatial variability, production, and quality indices for wheat in relation to fertilizers, in terms of prediction models’ statistical safety obtained (based on r and RMSE). In the present study, different levels of statistical safety were obtained when predicting wheat production based on color parameters (different color systems), and the highest level of statistical certainty was recorded in the case of models based on rgb normalized parameters, according to R2 = 0.975; p < 0.01.
Rorie et al. [44] found that there was a close relationship of the Dark Green Color Index (DGCI) calculated from digital images with LNC in maize (R2 = 0.80 to R2 = 0.89), which suggested that color image analysis was a suitable tool for evaluating the state of N supply of corn plants, field-scale. The DGCI index used chlorophyll content prediction in soybean plants [99], in statistical safety conditions (R2 ≥ 0.87, RMSE ≤ 3.1 SPAD units). In the present study conditions, the DGCI index facilitated the wheat crop production prediction under conditions of R2 = 0.925; p < 0.01. Production prediction is of interest for technical and economic reasons, but the prediction accuracy and degree of confidence are equally important and were evaluated in various studies in relation to prediction methods, techniques, and algorithms [100]. With the same input data (e.g., fertilizer doses), regression analysis will lead to other coefficients of the obtained equations, in relation to the production level which is variable in relation to the climate conditions, the cultivated variety, and the crops’ technology applied. The interaction of the factors is also considered.
Therefore, the contribution of this study can be appreciated through the concept and the opportunities it opens up in the construction of wheat production estimation models in relation to different genotypes, environmental conditions (soil, climate), technological conditions, and the rate of fertilization.
The results obtained and communicated in this study are in line with the trend of concerns and research for production prediction, for proper crop management during the vegetation period and for the management of production harvesting, transportation, storage, and capitalization processes in relation to processing, industrialization, or the market.

5. Conclusions

The concept and the experimental module (NPK macroelements, 11 experimental variants) ensured in a controlled way the differentiated supply of wheat plants with nutrients (foliar diagnosis), which was reflected in the chlorophyll content (Chl), in the state of plant development (BBCH stage 31), and in production levels, respectively. The digital images taken captured the eco–physiological properties of the wheat plants (BBCH stage 31), quantified numerically in different color systems, and synthetically expressed in specific indices.
Wheat production prediction models obtained by regression analysis, based on applied fertilizers (F), physiological indices (PI), and imaging analysis (IA) methods, facilitated wheat production estimation under different conditions of accuracy and statistical safety. Some models based on foliar diagnosis (NPKfd) or chlorophyll content (Chl), as representative physiological indices (PI), involve certain costs related to equipment (chlorophyll meter) or costs of laboratory analysis (foliar diagnosis). In the case of models based on color parameters (RGB, rgb, and various convertible color systems), or specific indices (e.g., DGCI), they are obtained based on digital images and facilities provided by accessible cameras, in high-resolution conditions.
Imaging analysis (IA) provided the most reliable prediction (of all the models that obtained the study conditions), through the model based on rgb normalized values (R2 = 0.975; p < 0.01), in the category of models based on color parameters. The prediction model based on the DGCI index (R2 = 0.925; p < 0.01) was highlighted in the case of models based on specific indices. In the category of models based on physiological indices (PI), the model based on foliar diagnosis (NPKfd) was highlighted (R2 = 0.883; p < 0.01). The prediction model based on applied fertilizers (F) showed a lower accuracy and safety compared to the other models (R2 = 0.763; p = 0.013). The lower value of the prediction safety in the case of models based on applied fertilizers can be associated with the variable rate of nutrients used from fertilizers, in relation to conditions of soil, climate, technology, and cultivated genotype. The model based on applied fertilizers, which resulted in this study (F model), was tested on external wheat production data. Fit degree analysis between predicted yield based on the F model, and real yield (six-year average), was confirmed by R2 = 0.717 compared to R2 = 0.763 for the F model in this study.
The models obtained in this study, related to the “Alex” wheat cultivar, can be used for other wheat varieties, but with a certain margin of error given the coefficient values of the obtained equations. The approach concept, methods, and models presented can be opportunities to approach other studies regarding the estimation of grass cereals’ production.

Supplementary Materials

The following supporting information can be downloaded at https://www.mdpi.com/article/10.3390/agronomy13061500/s1, Figure S1: Fittings between measured and estimated production: (a) Y(F)—applied fertilizers; (b) Y(NPK-fd)—foliar diagnoses; (c) Y(Chl)—physiological indices (Chl); (d) Y(RGB)—color parameter RGB system; (e) Y(HSB)—color parameter HSB system; (f) Y(HSL)—color parameter HSL system; (g) Y(Lab)—color parameter CIE L*a*b* system; (h) Y(CMK)—color parameter CMIK system; (i) Y(rgb)—normalized values’ RGB system; (j) Y(NDI)—normalized difference index; (k) Y(INT)—intensity; (l) Y(DGCI)—Dark Green Color Index; Figure S2: Dendrogram of the wheat production estimation models’ association, based on similarity according to the production values estimated on the experimental variants, and real production; Figure S3: Graphic distribution of the SDI values, in relation to the production estimation models and real production (the lower DSI value is preferable); Table S1: Similarity and distance indices’ values to quantify the similarity level between real production and production estimated by different models.

Author Contributions

Conceptualization, F.S.; methodology, F.S.; software, M.V.H.; validation, F.S. and M.V.H.; formal analysis, M.V.H.; investigation, F.S.; resources, M.V.H.; data curation, F.S.; writing—original draft preparation, F.S.; writing—review and editing, M.V.H.; visualization, F.S.; supervision, F.S. and M.V.H. All authors have read and agreed to the published version of the manuscript.

Funding

This research received no external funding.

Data Availability Statement

Not applicable.

Acknowledgments

The authors thank the GEOMATICS Research Laboratory, ULS “King Mihai I” from Timisoara for the facility of the software use for this study. This research paper is supported by the project “Increasing the impact of excellence research on the capacity for innovation and technology transfer within USAMVB Timișoara”, code 6PFE, submitted in the competition Program 1—Development of the national system of research development, Subprogram 1.2—Institutional performance, Institutional development projects—Development projects of excellence in RDI.

Conflicts of Interest

The authors declare no conflict of interest.

References

  1. Lew, T.T.S.; Sarojam, R.; Jang, I.-C.; Park, B.S.; Naqvi, N.I.; Wong, M.H.; Singh, G.P.; Ram, R.J.; Shoseyou, O.; Saito, K.; et al. Species-independent analytical tools for next-generation agriculture. Nat. Plants 2020, 6, 1408–1417. [Google Scholar] [CrossRef] [PubMed]
  2. Shi, Y.; Zhu, Y.; Wang, X.; Sun, X.; Ding, Y.; Cao, W.; Hu, Z. Progress and development on biological information of crop phenotype research applied to real-time variable-rate fertilization. Plant Methods 2020, 16, 11. [Google Scholar] [CrossRef] [PubMed]
  3. Ma, C.; Liu, M.; Ding, F.; Li, C.; Cui, Y.; Chen, W.; Wang, Y. Wheat growth monitoring and yield estimation based on remote sensing data assimilation into the SAFY crop growth model. Sci. Rep. 2022, 12, 5473. [Google Scholar] [CrossRef] [PubMed]
  4. Cai, F.; Lu, W.; Shi, W.; He, S. A mobile device-based imaging spectrometer for environmental monitoring by attaching a lightweight small module to a commercial digital camera. Sci. Rep. 2017, 7, 15602. [Google Scholar] [CrossRef] [PubMed]
  5. Hirai, K.; Osawa, N.; Hori, M.; Horiuchi, T.; Tominaga, S. High-dynamic-range spectral imaging system for omnidirectional scene capture. J. Imaging 2018, 4, 53. [Google Scholar] [CrossRef]
  6. Tang, M. Image segmentation technology and its application in digital image processing. In Proceedings of the 2020 International Conference on Advance in Ambient Computing and Intelligence (ICAACI), Ottawa, ON, Canada, 12–13 September 2020; pp. 158–160. [Google Scholar] [CrossRef]
  7. Al-Ghaili, A.M.; Kasim, H.; Hassan, Z.; Al-Hada, N.M.; Othman, M.; Kasmani, R.M.; Shayea, I. A Review: Image Processing Techniques’ Roles towards Energy-Efficient and Secure IoT. Appl. Sci. 2023, 13, 2098. [Google Scholar] [CrossRef]
  8. Zhou, S.; Chai, X.; Yang, Z.; Wang, H.; Yang, C.; Sun, T. Maize-IAS: A maize image analysis software using deep learning for high-throughput plant phenotyping. Plant Methods 2021, 17, 48. [Google Scholar] [CrossRef]
  9. Rasti, S.; Bleakley, C.J.; Holden, N.M.; Whetton, R.; Langton, D.; O’Hare, G. A survey of high resolution image processing techniques for cereal crop growth monitoring. Inf. Process. Agric. 2022, 9, 300–315. [Google Scholar] [CrossRef]
  10. Röll, G.; Hartung, J.; Graeff-Hönninger, S. Determination of plant nitrogen content in wheat plants via spectral reflectance measurements: Impact of leaf number and leaf position. Remote Sens. 2019, 11, 2794. [Google Scholar] [CrossRef]
  11. Haider, T.; Farid, M.S.; Mahmood, R.; Ilyas, A.; Khan, M.H.; Haider, S.T.-A.; Chaudhry, M.H.; Gul, M. A Computer-vision-based approach for nitrogen content estimation in plant leaves. Agriculture 2021, 11, 766. [Google Scholar] [CrossRef]
  12. Dey, A.K.; Sharma, M.; Meshram, M.R. An analysis of leaf chlorophyll measurement method using chlorophyll meter and image processing technique. Procedia Comput. Sci. 2016, 85, 286–292. [Google Scholar] [CrossRef]
  13. Zhang, H.; Ge, Y.; Xie, X.; Atefi, A.; Wijewardane, N.K.; Thapa, S. High throughput analysis of leaf chlorophyll content in sorghum using RGB, hyperspectral, and fluorescence imaging and sensor fusion. Plant Methods 2022, 18, 60. [Google Scholar] [CrossRef] [PubMed]
  14. Kohzuma, K.; Sonoike, K.; Hikosaka, K. Imaging, screening and remote sensing of photosynthetic activity and stress responses. J. Plant Res. 2021, 134, 649–651. [Google Scholar] [CrossRef] [PubMed]
  15. Moustakas, M.; Calatayud, Á.; Guidi, L. Editorial: Chlorophyll fluorescence imaging analysis in biotic and abiotic stress. Front. Plant Sci. 2021, 12, 658500. [Google Scholar] [CrossRef]
  16. Singh, A.; Jones, S.; Ganapathysubramanian, B.; Sarkar, S.; Mueller, D.; Sandhu, K.; Nagasubramanian, K. Challenges and opportunities in machine-augmented plant stress phenotyping. Trends Plant Sci. 2021, 26, 53–69. [Google Scholar] [CrossRef]
  17. Rico-Chávez, A.K.; Franco, J.A.; Fernandez-Jaramillo, A.A.; Contreras-Medina, L.M.; Guevara-González, R.G.; Hernandez-Escobedo, Q. Machine learning for plant stress modeling: A perspective towards hormesis management. Plants 2022, 11, 970. [Google Scholar] [CrossRef]
  18. Singh, V.; Sharma, N.; Singh, S. A review of imaging techniques for plant disease detection. Artif. Intell. Agric. 2020, 4, 229–242. [Google Scholar] [CrossRef]
  19. Bock, C.; Barbedo, J.; Mahlein, A.K.; Del Ponte, E.M. A special issue on phytopathometry—Visual assessment, remote sensing, and artificial intelligence in the twenty-first century. Trop. Plant Pathol. 2022, 47, 1–4. [Google Scholar] [CrossRef]
  20. Jørgensen, R.N.; Hansen, P.M.; Bro, R. Exploratory study of winter wheat reflectance during vegetative growth using three-mode component analysis. Int. J. Remote Sens. 2006, 27, 919–937. [Google Scholar] [CrossRef]
  21. Elsayed, S.; El-Hendawy, S.; Khadr, M.; Elsherbiny, O.; Al-Suhaibani, N.; Alotaibi, M.; Tahir, M.U.; Darwish, W. Combining thermal and RGB imaging indices with multivariate and data-driven modeling to estimate the growth, water status, and yield of potato under different drip irrigation regimes. Remote Sens. 2021, 13, 1679. [Google Scholar] [CrossRef]
  22. Cottenie, A. Soil and Plant Testing as a Basis of Fertilizer Recommendations; F.A.O. Soils Bulletin: Rome, Italy, 1980; p. 118. ISBN 92-5-100956-2. [Google Scholar]
  23. Schut, A.G.T.; Giller, K.E. Soil-based, field-specific fertilizer recommendations are a pipe-dream. Geoderma 2020, 380, 114680. [Google Scholar] [CrossRef]
  24. AbdelRahman, M.A.E.; Hegab, R.H.; Yossif, T.M.H. Soil fertility assessment for optimal agricultural use using remote sensing and GIS technologies. Appl. Geomat. 2021, 13, 605–618. [Google Scholar] [CrossRef]
  25. Yang, X.; Bao, N.; Li, W.; Liu, S.; Fu, Y.; Mao, Y. Soil nutrient estimation and mapping in farmland based on UAV imaging spectrometry. Sensors 2021, 21, 3919. [Google Scholar] [CrossRef] [PubMed]
  26. Schut, A.G.T.; Traore, P.C.S.; Blaes, X.; de By, R.A. Assessing yield and fertilizer response in heterogeneous smallholder fields with UAVs and satellites. Field Crop. Res. 2018, 221, 98–107. [Google Scholar] [CrossRef]
  27. Yang, M.; Hassan, M.A.; Xu, K.; Zheng, C.; Rasheed, A.; Zhang, Y.; Jin, X.; Xia, X.; Xiao, Y.; He, Z. Assessment of water and nitrogen use efficiencies through UAV-based multispectral phenotyping in winter wheat. Front. Plant Sci. 2020, 11, 927. [Google Scholar] [CrossRef]
  28. Peng, Y.; Zhang, M.; Xu, Z.; Yang, T.; Su, Y.; Zhou, T.; Wang, H.; Wang, Y.; Lin, Y. Estimation of leaf nutrition status in degraded vegetation based on field survey and hyperspectral data. Sci. Rep. 2020, 10, 4361. [Google Scholar] [CrossRef]
  29. Lu, J.; Eitel, J.U.H.; Engels, M.; Zhu, J.; Ma, Y.; Liao, F.; Zheng, H.; Wang, X.; Yao, X.; Cheng, T.; et al. Improving Unmanned Aerial Vehicle (UAV) remote sensing of rice plant potassium accumulation by fusing spectral and textural information. Int. J. Appl. Earth Obs. Geoinf. 2021, 104, 102592. [Google Scholar] [CrossRef]
  30. Ge, H.; Xiang, H.; Ma, F.; Li, Z.; Qiu, Z.; Tan, Z.; Du, C. Estimating plant nitrogen concentration of rice through fusing vegetation indices and color moments derived from UAV-RGB images. Remote Sens. 2021, 13, 1620. [Google Scholar] [CrossRef]
  31. Liu, Y.; Hatou, K.; Aihara, T.; Kurose, S.; Akiyama, T.; Kohno, Y.; Lu, S.; Omasa, K. A robust vegetation index based on different UAV RGB images to estimate SPAD values of naked barley leaves. Remote Sens. 2021, 13, 686. [Google Scholar] [CrossRef]
  32. Jordan, C.F. Derivation of leaf area index from quality of light on the forest floor. Ecology 1969, 50, 663–666. [Google Scholar] [CrossRef]
  33. Tan, Y.; Sun, J.Y.; Zhang, B.; Chen, M.; Liu, Y.; Liu, X.D. Sensitivity of a Ratio Vegetation Index derived from hyperspectral remote sensing to the brown planthopper stress on rice plants. Sensors 2019, 19, 375. [Google Scholar] [CrossRef] [PubMed]
  34. Rouse, J.W.; Haas, R.H.; Schell, J.A.; Deering, D.W. Monitoring vegetation systems in the Great Plains with ERTS. In Third ERTS Symposium; NASA SP-351: Washington, DC, USA, 1973; Volume 1, pp. 309–317. [Google Scholar]
  35. Pasternak, M.; Pawluszek-Filipiak, K. The evaluation of spectral vegetation indexes and redundancy reduction on the accuracy of crop type detection. Appl. Sci. 2022, 12, 5067. [Google Scholar] [CrossRef]
  36. Tucker, C.J. Red and photographic infrared linear combinations for monitoring vegetation. Remote Sens. Environ. 1979, 8, 127–150. [Google Scholar] [CrossRef]
  37. Huete, A.R. A Soil-Adjusted Vegetation Index (SAVI). Remote Sens. Environ. 1988, 25, 295–309. [Google Scholar] [CrossRef]
  38. Baghi, N.G.; Oldeland, J. Do soil-adjusted or standard vegetation indices better predict above ground biomass of semi-arid, saline rangelands in North-East Iran? Int. J. Remote Sens. 2019, 40, 8223–8235. [Google Scholar] [CrossRef]
  39. Gitelson, A.A.; Merzlyak, M.N. Remote sensing of chlorophyll concentration in higher plant leaves. Adv. Space Res. 1998, 22, 689–692. [Google Scholar] [CrossRef]
  40. Candiago, S.; Remondino, F.; De Giglio, M.; Dubbini, M.; Gattelli, M. Evaluating multispectral images and vegetation indices for precision farming applications from UAV images. Remote Sens. 2015, 7, 4026–4047. [Google Scholar] [CrossRef]
  41. Ceccato, P.; Gobron, N.; Flasse, S.; Pinty, B.; Tarantola, S. Designing a spectral index to estimate vegetation water content from remote sensing data: Part 1. Theoretical approach. Remote Sens. Environ. 2002, 81, 188–197. [Google Scholar] [CrossRef]
  42. Gitelson, A.A.; Kaufman, Y.J.; Stark, R.; Rundquist, D. Novel algorithms for remote estimation of vegetation fraction. Remote Sens. Environ. 2002, 80, 76–87. [Google Scholar] [CrossRef]
  43. Karcher, D.E.; Richardson, M.D. Quantifying turfgrass color using digital image analysis. Crop Sci. 2003, 43, 943–951. [Google Scholar] [CrossRef]
  44. Rorie, R.L.; Purcell, L.C.; Karcher, D.E.; King, A.C. The assessment of leaf nitrogen in corn from digital images. Crop Sci. 2011, 51, 2174–2180. [Google Scholar] [CrossRef]
  45. Rorie, R.L.; Purcell, L.C.; Mozaffari, M.; Karcher, D.E.; King, C.A.; Marsh, M.C.; Longer, D.E. Association of “Greenness” in corn with yield and leaf nitrogen concentration. Agron. J. 2011, 103, 529–535. [Google Scholar] [CrossRef]
  46. Jia, L.; Chen, X.; Zhang, F.; Buerkert, A.; Römheld, V. Use of digital camera to assess nitrogen status oe winter wheat in the Northern China Plain. J. Plant Nutr. 2004, 27, 441–450. [Google Scholar] [CrossRef]
  47. Raper, T.B.; Oosterhuis, D.M.; Siddons, U.; Purcell, L.C.; Mozaffari, M. Effectiveness of the dark green color index in determining cotton nitrogen status from multiple camera angles. Int. J. Appl. Sci. Technol. 2012, 2, 71–74. [Google Scholar]
  48. Naz, N.; Malik, A.H.; Khurshid, A.B.; Aziz, F.; Alouffi, B.; Uddin, M.I.; AlGhamdi, A. Efficient processing of image processing applications on CPU/GPU. Math. Probl. Eng. 2020, 2020, 4839876. [Google Scholar] [CrossRef]
  49. Wang, Y.; Liu, H.; Wang, D.; Liu, D. Image processing in fault identification for power equipment based on improved super green algorithm. Comput. Electr. Eng. 2020, 87, 106753. [Google Scholar] [CrossRef]
  50. Lebourgeois, V.; Bégué, A.; Labbé, S.; Mallavan, B.; Prévot, L.; Roux, B. Can commercial digital cameras be used as multispectral sensors? A crop monitoring test. Sensors 2008, 8, 7300–7322. [Google Scholar] [CrossRef] [PubMed]
  51. Vitali, G.; Francia, M.; Golfarelli, M.; Canavari, M. Crop Management with the IoT: An Interdisciplinary Survey. Agronomy 2021, 11, 181. [Google Scholar] [CrossRef]
  52. Khan, A.; Vibhute, A.D.; Mali, S.; Patil, C.H. A systematic review on hyperspectral imaging technology with a machine and deep learning methodology for agricultural applications. Ecol. Inform. 2022, 69, 101678. [Google Scholar] [CrossRef]
  53. Engen, M.; Sandø, E.; Sjølander, B.L.O.; Arenberg, S.; Gupta, R.; Goodwin, M. Farm-scale crop yield prediction from multi-temporal data using deep hybrid neural networks. Agronomy 2021, 11, 2576. [Google Scholar] [CrossRef]
  54. Pham, H.T.; Awange, J.; Kuhn, M.; Nguyen, B.V.; Bui, L.K. Enhancing Crop Yield Prediction Utilizing Machine Learning on Satellite-Based Vegetation Health Indices. Sensors 2022, 22, 719. [Google Scholar] [CrossRef] [PubMed]
  55. Muruganantham, P.; Wibowo, S.; Grandhi, S.; Samrat, N.H.; Islam, N. A systematic literature review on crop yield prediction with deep learning and remote sensing. Remote Sens. 2022, 14, 1990. [Google Scholar] [CrossRef]
  56. ESRI. ArcGIS Desktop: Release 10; Environmental Systems Research Institute: Redlands, CA, USA, 2011. [Google Scholar]
  57. Dumitru, M.; Manea, A.; Lăcătușu, R.; Rizea, N.; Ștefănescu, D.; Tănase, V.; Vrânceanu, N.; Preda, M.; Lăcătuşu, A.; Matei, M.; et al. Metode de Analiză Chimică și Microbiologică; Craiova, S., Ed.; Anticariat Net: Craiova, Romania, 2011; pp. 20–22, 62, 97–98. [Google Scholar]
  58. Meier, U. Growth Stages of Mono-and Dicotyledonous Plants e BBCH Monograph; Federal Biological Research Centre for Agriculture and Forestry: Berlin, Germany, 2001; p. 158. [Google Scholar]
  59. Color Converter. Available online: https://www.workwithcolor.com/color-converter-01.htm (accessed on 11 October 2021).
  60. Lee, K.-J.; Lee, B.-W. Estimation of rice growth and nitrogen nutrition status using color digital camera image analysis. Eur. J. Agron. 2013, 48, 57–65. [Google Scholar] [CrossRef]
  61. Mao, W.; Wang, Y.; Wang, Y. Real-time detection of between-row weeds using machine vision. In 2003 ASAE Annual Meeting; American Society of Agricultural and Biological Engineers: St. Joseph, MI, USA, 2003. [Google Scholar] [CrossRef]
  62. Ahmad, I.S.; Reid, J.F. Evaluation of color representations for maize images. J. Agric. Eng. Res. 1996, 63, 185–195. [Google Scholar] [CrossRef]
  63. Hammer, Ø.; Harper, D.A.T.; Ryan, P.D. PAST: Paleontological statistics software package for education and data analysis. Palaeontol. Electron. 2001, 4, 1–9. [Google Scholar]
  64. Agapie, A.L.; Horablaga, N.M.; Bostan, C.; Popa, L.-D.; Istrate-Schiller, C.-M.; Rechițean, D.; Sala, F. The dynamics of nitrogen valorification in wheat crop under the influence of the used agrofound. Rom. Agric. Res. 2023, 40, 1–13. [Google Scholar]
  65. Qi, X.; Zhao, Y.; Huang, Y.; Wang, Y.; Qin, W.; Fu, W.; Guo, Y.; Ye, Y. A novel approach for nitrogen diagnosis of wheat canopies digital images by mobile phones based on histogram. Sci. Rep. 2021, 11, 13012. [Google Scholar] [CrossRef]
  66. Padilla, F.M.; de Souza, R.; Peña-Fleitas, M.T.; Gallardo, M.; Giménez, C.; Thompson, R.B. Different responses of various chlorophyll meters to increasing nitrogen supply in sweet pepper. Front. Plant Sci. 2018, 9, 1752. [Google Scholar] [CrossRef]
  67. Fiorentini, M.; Zenobi, S.; Giorgini, E.; Basili, D.; Conti, C.; Pro, C.; Monaci, E.; Orsini, R. Nitrogen and chlorophyll status determination in durum wheat as influenced by fertilization and soil management: Preliminary results. PLoS ONE 2019, 14, e0225126. [Google Scholar] [CrossRef]
  68. Lemaire, G.; Jeuffroy, M.H.; Gastal, F. Diagnosis tool for plant and crop N status in vegetative stage theory and practices for crop N management. Eur. J. Agron. 2008, 28, 614–624. [Google Scholar] [CrossRef]
  69. Kitić, G.; Tagarakis, A.; Kselyuszka, N.; Panić, M.; Birgenmajer, S.; Sakulski, D.; Matović, J. A new low-cost portable multispectral optical device for precise plant status assessment. Comput. Electron. Agric. 2019, 162, 300–308. [Google Scholar] [CrossRef]
  70. Tao, H.; Feng, H.; Xu, L.; Miao, M.; Yang, G.; Yang, X.; Fan, L. Estimation of the yield and plant height of winter wheat using UAV-based hyperspectral images. Sensors 2020, 20, 1231. [Google Scholar] [CrossRef] [PubMed]
  71. Meeradevi; Salpekar, H. Design and implementation of mobile application for crop yield prediction using machine learning. In Proceedings of the 2019 Global Conference for Advancement in Technology (GCAT), Bangalore, India, 18–20 October 2019; pp. 1–6. [Google Scholar] [CrossRef]
  72. Van Klompenburg, T.; Kassahun, A.; Catal, C. Crop yield prediction using machine learning: A systematic literature review. Comput. Electron. Agric. 2020, 177, 105709. [Google Scholar] [CrossRef]
  73. Suruliandi, A.; Mariammal, G.; Raja, S.P. Crop prediction based on soil and environmental characteristics using feature selection techniques. Math. Comput. Model. Dyn. Syst. 2021, 27, 117–140. [Google Scholar] [CrossRef]
  74. McArthur, J.W.; McCord, G.C. Fertilizing growth: Agricultural inputs and their effects in economic development. J. Dev. Econ. 2017, 127, 133–152. [Google Scholar] [CrossRef]
  75. Rütting, T.; Aronsson, H.; Delin, S. Efficient use of nitrogen in agriculture. Nutr. Cycl. Agroecosyst 2018, 110, 1–5. [Google Scholar] [CrossRef]
  76. Chen, H.; Deng, A.; Zhang, W.; Li, W.; Qiao, Y.; Yang, T.; Zheng, C.; Cao, C.; Chen, F. Long-term inorganic plus organic fertilization increases yield and yield stability of winter wheat. Crop J. 2018, 6, 589–599. [Google Scholar] [CrossRef]
  77. Pan, W.L.; Kidwell, K.K.; McCracken, V.A.; Bolton, R.P.; Allen, M. Economically optimal wheat yield, protein and nitrogen use component responses to varying N supply and genotype. Front. Plant Sci. 2020, 10, 1790. [Google Scholar] [CrossRef]
  78. Kostić, M.M.; Tagarakis, A.C.; Ljubičić, N.; Blagojević, D.; Radulović, M.; Ivošević, B.; Rakić, D. The effect of N fertilizer application timing on wheat yield on chernozem soil. Agronomy 2021, 11, 1413. [Google Scholar] [CrossRef]
  79. Rahimi Eichi, V.; Okamato, M.; Haefele, S.M.; Jewell, N.; Brien, C.; Garnett, T.; Langridge, P. Understanding the interactions between biomass, grain production and grain protein content in high and low protein wheat genotypes under controlled environments. Agronomy 2019, 9, 706. [Google Scholar] [CrossRef]
  80. Zhou, X.; Kono, Y.; Win, A.; Matsui, T.; Tanaka, T.S.T. Predicting within-field variability in grain yield and protein content of winter wheat using UAV-based multispectral imagery and machine learning approaches. Plant Prod. Sci. 2021, 24, 137–151. [Google Scholar] [CrossRef]
  81. Lv, Z.; Liu, X.; Cao, W.; Zhu, Y. A model-based estimate of regional wheat yield gaps and water use efficiency in main winter wheat production regions of China. Sci. Rep. 2017, 7, 6081. [Google Scholar] [CrossRef] [PubMed]
  82. Wagner, N.C.; Maxwell, B.D.; Taper, M.L.; Rew, L.J. Developing an empirical yield-prediction model based on wheat and wild oat (Avena fatua) density, nitrogen and herbicide rate, and growing-season precipitation. Weed Sci. 2007, 55, 652–664. Available online: https://www.jstor.org/stable/4539631 (accessed on 8 April 2023). [CrossRef]
  83. Sanchez-Bragado, R.; Serret, M.D.; Araus, J.L. The nitrogen contribution of different plant parts to wheat grains: Exploring genotype, water, and nitrogen effects. Front. Plant Sci. 2017, 7, 1986. [Google Scholar] [CrossRef] [PubMed]
  84. Belete, F.; Dechassa, N.; Molla, A.; Tana, T. Effect of nitrogen fertilizer rates on grain yield and nitrogen uptake and use efficiency of bread wheat (Triticum aestivum L.) varieties on the Vertisols of central highlands of Ethiopia. Agric. Food Secur. 2018, 7, 78. [Google Scholar] [CrossRef]
  85. Guo, J.; Jia, Y.; Chen, H.; Zhang, L.; Yang, J.; Zhang, J.; Hu, X.; Ye, X.; Li, Y.; Zhou, Y. Growth, photosynthesis, and nutrient uptake in wheat are affected by differences in nitrogen levels and forms and potassium supply. Sci. Rep. 2019, 9, 1248. [Google Scholar] [CrossRef]
  86. Singh, D.; Singh, K.; Hundal, H.S.; Sekhon, K.S. Diagnosis and recommendation integrated system (DRIS) for evaluating nutrient status of cotton (Gossipium hirsutum). J. Plant Nutr. 2012, 35, 192–202. [Google Scholar] [CrossRef]
  87. Llanderal, A.; García-Caparrós, P.; Lao, M.T.; Segura, M.L. DRIS norms and sufficiency ranges for pepper grown under greenhouses conditions in the Southeast of Spain. Agronomy 2021, 11, 837. [Google Scholar] [CrossRef]
  88. Zhang, H.; Zhao, Q.; Wang, Z.; Wang, L.; Li, X.; Fan, Z.; Zhang, Y.; Li, J.; Gao, X.; Shi, J.; et al. Effects of nitrogen fertilizer on photosynthetic characteristics, biomass, and yield of wheat under different shading conditions. Agronomy 2021, 11, 1989. [Google Scholar] [CrossRef]
  89. Reeves, D.W.; Mask, P.L.; Wood, C.W.; Delaney, D.P. Determination of wheat nitrogen status with a hand-held chlorophyll meter: Influence of management practices. J. Plant Nutr. 1993, 16, 781–796. [Google Scholar] [CrossRef]
  90. Liu, X.; Zhang, K.; Zhang, Z.; Cao, Q.; Lv, Z.; Yuan, Z.; Tian, Y.; Cao, W.; Zhu, Y. Canopy Chlorophyll Density Based Index for Estimating Nitrogen Status and Predicting Grain Yield in Rice. Front. Plant Sci. 2017, 8, 1829. [Google Scholar] [CrossRef] [PubMed]
  91. Liu, C.; Liu, Y.; Lu, Y.; Liao, Y.; Nie, J.; Yuan, X.; Chen, F. Use of a leaf chlorophyll content index to improve the prediction of above-ground biomass and productivity. PeerJ 2019, 6, e6240. [Google Scholar] [CrossRef] [PubMed]
  92. Walsh, O.S.; Torrion, J.A.; Liang, X.; Shafian, S.; Yang, R.; Belmont, K.M.; McClintick-Chess, J.R. Grain yield, quality, and spectral characteristics of wheat grown under varied nitrogen and irrigation. Agrosystems Geosci. Environ. 2020, 3, e20104. [Google Scholar] [CrossRef]
  93. Reyes, J.F.; Correa, C.; Zúñiga, J. Reliability of different color spaces to estimate nitrogen SPAD values in maize. Comput. Electron. Agric. 2017, 143, 14–22. [Google Scholar] [CrossRef]
  94. Agarwal, A.; Gupta, S.D. Assessment of spinach seedling health status and chlorophyll content by multivariate data analysis and multiple linear regression of leaf image features. Comput. Electron. Agric. 2018, 152, 281–289. [Google Scholar] [CrossRef]
  95. Liu, K.; Li, Y.; Han, T.; Yu, X.; Ye, H.; Hu, H.; Hu, Z. Evaluation of grain yield based on digital images of rice canopy. Plant Methods 2019, 15, 28. [Google Scholar] [CrossRef]
  96. Mohan, P.J.; Gupta, S.D. Intelligent image analysis for retrieval of leaf chlorophyll content of rice from digital images of smartphone under natural light. Photosynthetica 2019, 57, 388–398. [Google Scholar] [CrossRef]
  97. Ali, A.M.; Ibrahim, S.M.; Bijay-Singh. Wheat grain yield and nitrogen uptake prediction using at Leaf and GreenSeeker portable optical sensors at jointing growth stage. Inf. Process. Agric. 2020, 7, 375–383. [Google Scholar] [CrossRef]
  98. Song, Y.; Teng, G.; Yuan, Y.; Liu, T.; Sun, Z. Assessment of wheat chlorophyll content by the multiple linear regression of leaf image features. Inf. Process. Agric. 2021, 8, 232–243. [Google Scholar] [CrossRef]
  99. Hassanijalilian, O.; Igathinathane, C.; Doetkott, C.; Bajwa, S.; Nowatzki, J.; Esmaeili, S.A.H. Chlorophyll estimation in soybean leaves infield with smartphone digital imaging and machine learning. Comput. Electron. Agric. 2020, 174, 105433. [Google Scholar] [CrossRef]
  100. Srivastava, A.K.; Safaei, N.; Khaki, S.; Lopez, G.; Zeng, W.; Ewert, F.; Gaiser, T.; Rahimi, J. Winter wheat yield prediction using convolutional neural networks from environmental and phenological data. Sci. Rep. 2022, 12, 3215. [Google Scholar] [CrossRef] [PubMed]
Figure 1. Aspects regarding the location and the experimental research plot: DER, ULS Timisoara, Timis County, Romania, year 2012 [56].
Agronomy 13 01500 g001
Figure 2. Digital images of the autumn wheat crop, “Alex” cultivar, on experimental variants.
Agronomy 13 01500 g002
Table 1. Experimental results on applied fertilizers and wheat production, “Alex” cultivar.
TrialApplied Fertilizers
(kg a.s. ha−1)
Real Yield
Kg ha−1 (Average Values ± Std. Error)
NFPFKF
V10002625 ± 217.46
V2100006000 ± 273.86
V3200006525 ± 131.49
V45050504600 ± 147.19
V510050506150 ± 95.74
V620050506025 ± 332.60
V71001001005575 ± 217.47
V81501001006400 ± 147.19
V92001001006625 ± 324.04
V101501501506200 ± 103.08
V112001501506430 ± 365.14
Note: a.s.—active substance; NF—nitrogen from fertilizer; PF—phosphorus from fertilizer; KF—potassium from fertilizer.
Table 2. Verification of the F model for agricultural practice.
Applied FertilizersPredicted Yield Based on F ModelPrediction Error (PE), as Difference between Predicted Yield Based on F Model and Real Yield Communicated by Agapie et al. (2023) [64]
PNEquation (5)2016201820192020Average
2016–2021
(kg ha−1 Active Substance)(kg ha−1)
003742.57−0.43−576.93348.43−457.43−729.38
0304168.78−302.22−481.72196.22−195.52−697.26
0604595.00−605.00−472.50−10.00−124.00−774.22
0905021.21−741.79−317.59−308.21537.96−463.89
01205447.42−350.583.92−674.421189.67−111.66
4003816.51−253.49−641.99266.4954.51−831.89
40304242.72−207.28−597.78−82.7290.22−707.29
40604668.94−687.06−848.56−180.94206.44−732.73
40905095.15−709.85−513.60−655.15585.40−406.27
401205521.36−274.64422.86−931.361405.36120.54
8003890.45−329.55−903.8082.55−238.55−998.02
80304316.66−183.34−689.64503.34−88.34−854.89
80604742.88−624.12−861.12−57.88−145.62−847.87
80905169.09−726.91−457.16−356.09423.84−590.46
801205595.30−336.7038.80−755.301454.55−75.41
12003964.39−405.61−1251.61618.61−288.11−1110.60
120304390.60−236.40−1035.20469.40−402.15−943.99
120604816.82−581.18−974.68386.18214.32−984.55
120905243.03−647.97−571.97−275.03835.28−515.39
1201205669.24−398.76−46.51−564.241883.244.62
16004038.33−659.67−1361.67276.67276.33−1090.84
160304464.54−235.46−755.46335.46−109.21−836.42
160604890.76−309.24−921.24−55.76395.26−816.79
160905316.97−443.03−683.03−296.97555.22−582.58
1601205743.18−492.82−456.82−1048.181543.1859.26
Table 3. Assessment of nutritional status and chlorophyll content of winter wheat plants, “Alex” cultivar.
TrialAverage Content of Plant MacronutrientsChlorophyll Content
Nfd (%)Pfd (%)Kfd (%)Chl (SPAD Units)
V12.171.665.8440.26
V24.601.904.4452.78
V35.982.183.7351.38
V45.071.774.0048.69
V55.672.074.0550.64
V66.622.164.4152.31
V75.932.164.8251.47
V86.692.205.1352.10
V97.682.315.3152.41
V107.132.215.1154.04
V117.272.445.5155.57
SE±0.47±0.07±0.21±1.20
Note: Nfd—nitrogen content in wheat plants; Pfd—phosphorus content in wheat plants; Kfd—potassium content in wheat plants.
Table 4. Color parameter values in different color systems, based on images’ analysis.
TrialsRGBHSBHSLCIE L*a*b*CMYKRGB Normalized
RGBHSBHSLLabCMYKrgb
V112514757750.610.5875444058−21449035420.3800.4460.173
V28711670980.400.4598253646−202211018550.3190.4250.256
V384114691000.390.45100253645−202212018550.3160.4270.258
V49112352870.580.4887413448−243513028520.3420.4610.197
V58511567980.420.4598263645−202312019550.3190.4300.252
V67410156960.450.4096293140−192211018600.3190.4380.242
V79112163910.480.4791323647−222812023530.3310.4410.228
V88411368990.400.4499253544−202211018560.3160.4260.258
V980108661000.390.42100243442−192011016580.3140.4260.260
V108311359930.480.4493313444−212612021560.3260.4430.231
V1178105671030.360.41103223441−181811015590.3130.4200.267
Table 5. Average values of the calculated specific indices.
TrialsNDIINTDGCI
V1−0.079109.7700.353333
V2−0.14191.0170.594444
V3−0.14789.0000.608889
V4−0.14788.6500.463333
V5−0.14688.8730.587778
V6−0.15576.9770.583333
V7−0.14091.4130.522222
V8−0.14788.3870.603333
V9−0.15084.7270.618889
V10−0.15084.9730.543333
V11−0.14583.4670.648889
Table 6. Equations for wheat production estimating “Alex” cultivar based on color parameters and calculated indices.
Color System and IndicesEquationEquation NumberR2p
(95% Confidence)
RGB Y R G B = 6564.515 93.9023 R + 25.933 G + 69.4359 B (8)0.972<0.01
HSB Y H S B = 2730.85 + 116.205 H + 871.30 S 6409 B (9)0.941<0.01
HSL Y H S L = 630.961 + 106.1994 H 27.108 S 81.785 L (10)0.936<0.01
CIE L*a*b* Y L a b = 6715.791 7.7203 L 186.204 a 172.228 b (11)0.969<0.01
CMYK Y C Y K = 8360.784 + 256.291 C 199.564 Y 25.2077 K (12)0.973<0.01
rgb Y r g b = 54,693.9 + 22,172.6 r + 78,655.12 g + 79,660.37 b (13)0.975<0.01
NDI Y N D I = 1242.23 49657 NDI (14)0.773<0.01
INT Y I N T = 16,315.86 119.027 INT (15)0.665<0.01 (p = 0.002)
DGCI Y D G C I = 1706.35 + 13,369.42 DGCI (16)0.925<0.01
Table 7. Statistical parameters of models used in wheat yield prediction.
No.Methods and Model of Wheat Yield Prediction Based on:Statistical Parameters
RMSEPREP (%)
1Fertilizers (NPKF)568.63689.90
2Foliar diagnosis (NPKfd)382.72306.67
3Chl424.54047.39
4RGB186.33113.25
5HSB272.40064.74
6HSL283.59784.94
7CIE L*a*b*195.76943.41
8CMYK182.86883.19
9rgb177.12673.09
10NDI534.54059.31
11INT649.784511.32
12DGCI306.75235.34
The analysis of these data reveals that the equation based on the normalized values (rgb) facilitated the most reliable prediction of wheat production (R2 = 0.975), and among the calculated indices, the equation based on the DGCI index highly facilitated wheat production prediction (R2 = 0.925).
Disclaimer/Publisher’s Note: The statements, opinions and data contained in all publications are solely those of the individual author(s) and contributor(s) and not of MDPI and/or the editor(s). MDPI and/or the editor(s) disclaim responsibility for any injury to people or property resulting from any ideas, methods, instructions or products referred to in the content.

