Article

Morphological, Molecular and Genomic Identification and Characterisation of Monilinia fructicola in Prunus persica from Portugal

1
University of Coimbra - Center for Functional Ecology Science for People & the Planet, TERRA Associated Laboratory, Department of Life Sciences, Calçada Martim de Freitas, Coimbra 3000-456, Portugal
2
Laboratory for Phytopathology, Instituto Pedro Nunes, R. Pedro Nunes, 3030-199 Coimbra, Portugal
3
CATAA—Centro de Apoio Tecnológico Agro-Alimentar, Zona Industrial de Castelo Branco, Rua A, 6000-459 Castelo Branco, Portugal
*
Author to whom correspondence should be addressed.
Agronomy 2023, 13(6), 1493; https://doi.org/10.3390/agronomy13061493
Submission received: 12 April 2023 / Revised: 10 May 2023 / Accepted: 26 May 2023 / Published: 29 May 2023
(This article belongs to the Special Issue Monilinia on Stone Fruit Species)

Abstract

:
In Portugal, the Cova da Beira region is well-known for the production of Prunus spp. and is considered the main peach production area in the country. In the spring of 2021 and 2022, field surveys in peach and nectarine orchards showed symptoms of decline such as cankers, gummosis, dry branches, abortion of flowers, mummified fruits and the partial or total death of some plants. Brown rot is caused by three species of the genus Monilinia, M. fructigena, M. laxa and M. fructicola, the last is an OEPP/EPPO A2 quarantine organism on peach trees. Brown rot disease had previously been described in the Cova da Beira region, however, the recent high mortality and severity of symptoms raised doubts as to the species involved. Symptomatic plant material was collected from thirteen orchards and used for fungal isolation and molecular detection according to the OEPP/EPPO standard. M. fructicola was confirmed morphologically and molecularly in two orchards, and molecularly (duplex real-time PCR) detected in two others. Whole genome sequencing using Oxford Nanopore MinION was also carried out to confirm the identification. Pathogenicity tests were performed on peach, nectarine and sweet cherry fruit according to Koch’s postulates. Based on all the results obtained, we report the first detection of M. fructicola in P. persica in Portugal.

1. Introduction

Peach (Prunus persica (L.) Batsch) is a deciduous tree cultivated in temperate and subtropical regions [1], belonging to the Rosaceae family, and one of the most important fruit crops in the world [2]. According to the latest available data published by the Food and Agriculture Organization (FAO), the production of peaches and nectarines in Europe reached 3,219,958.62 tonnes, making it the second largest producer in the world, surpassed only by China [1]. In Portugal, the main production area for peaches and nectarines is located in the Cova da Beira region. According to Portuguese statistics, the production of peaches and nectarines (Prunus persica var. nucipersica) reached 34.776 tonnes, of which, 18.706 tonnes were produced in central Portugal [3]. However, this fruit sector is vulnerable to several pre-harvest and post-harvest diseases [4]. Brown rot is one of the most economically important and destructive diseases in stone fruits, especially in peaches [5]. The causal agents are three related pathogens, Monilinia fructigena, M. laxa, and M. fructicola [6], classified by the European and Mediterranean Plant Protection Organization (EPPO) as an A2 pest for peach crops [7].
M. fructicola has been detected in North and South America, Australia, and Japan [8]. In Europe, it was first detected in peach orchards in France [9]. Since 2001, the disease has spread to many European countries and has been found on stone fruits in Hungary, Spain, Slovenia, the Czech Republic, Italy, Serbia, Croatia and Bulgaria [10,11,12,13,14,15,16].
Flowers, twigs, leaves, and fruits are the main plant parts affected by these pathogens. The most common symptom is the rotting of mature fruits, the infected fruits may remain mummified and attached to the tree, which is important for the survival of the pathogen over seasons [7]. Flower necrosis with gummosis is also a symptom, on twigs, symptoms appear as cankers and leaves on affected shoots wilt and remain attached to the branch. Monilinia species are difficult to distinguish, and molecular methods such as conventional polymerase chain reaction (PCR) or real-time PCR are important for accurate identification.
Symptoms such as damaged blossoms, flowers abortion, gummosis, mummified fruits attached to the tree, and the total or partial death of some plants were observed in situ during the field surveys carried out in the spring of 2021 and 2022 in peach and nectarine orchards in Cova da Beira. These symptoms are typical of brown rot, some of which have been reported in Portugal, but these were attributed to the presence of the less destructive species of Monilinia sp. (e.g., M. laxa or M. fructigena) [17]. The severe decline associated with partial or total plant death raises the question of which Monilinia species caused this outbreak. The aim of this work was, therefore, to identify the causal agent responsible for the decline in P. persica.

2. Materials and Methods

2.1. Sample Collection

Symptomatic flowers and branches were collected from 42 trees distributed in 13 orchards in Cova da Beira, stored in sterile plastic bags at 4 °C and processed within 24 h (Table 1). Branches and flowers from each tree were processed independently.

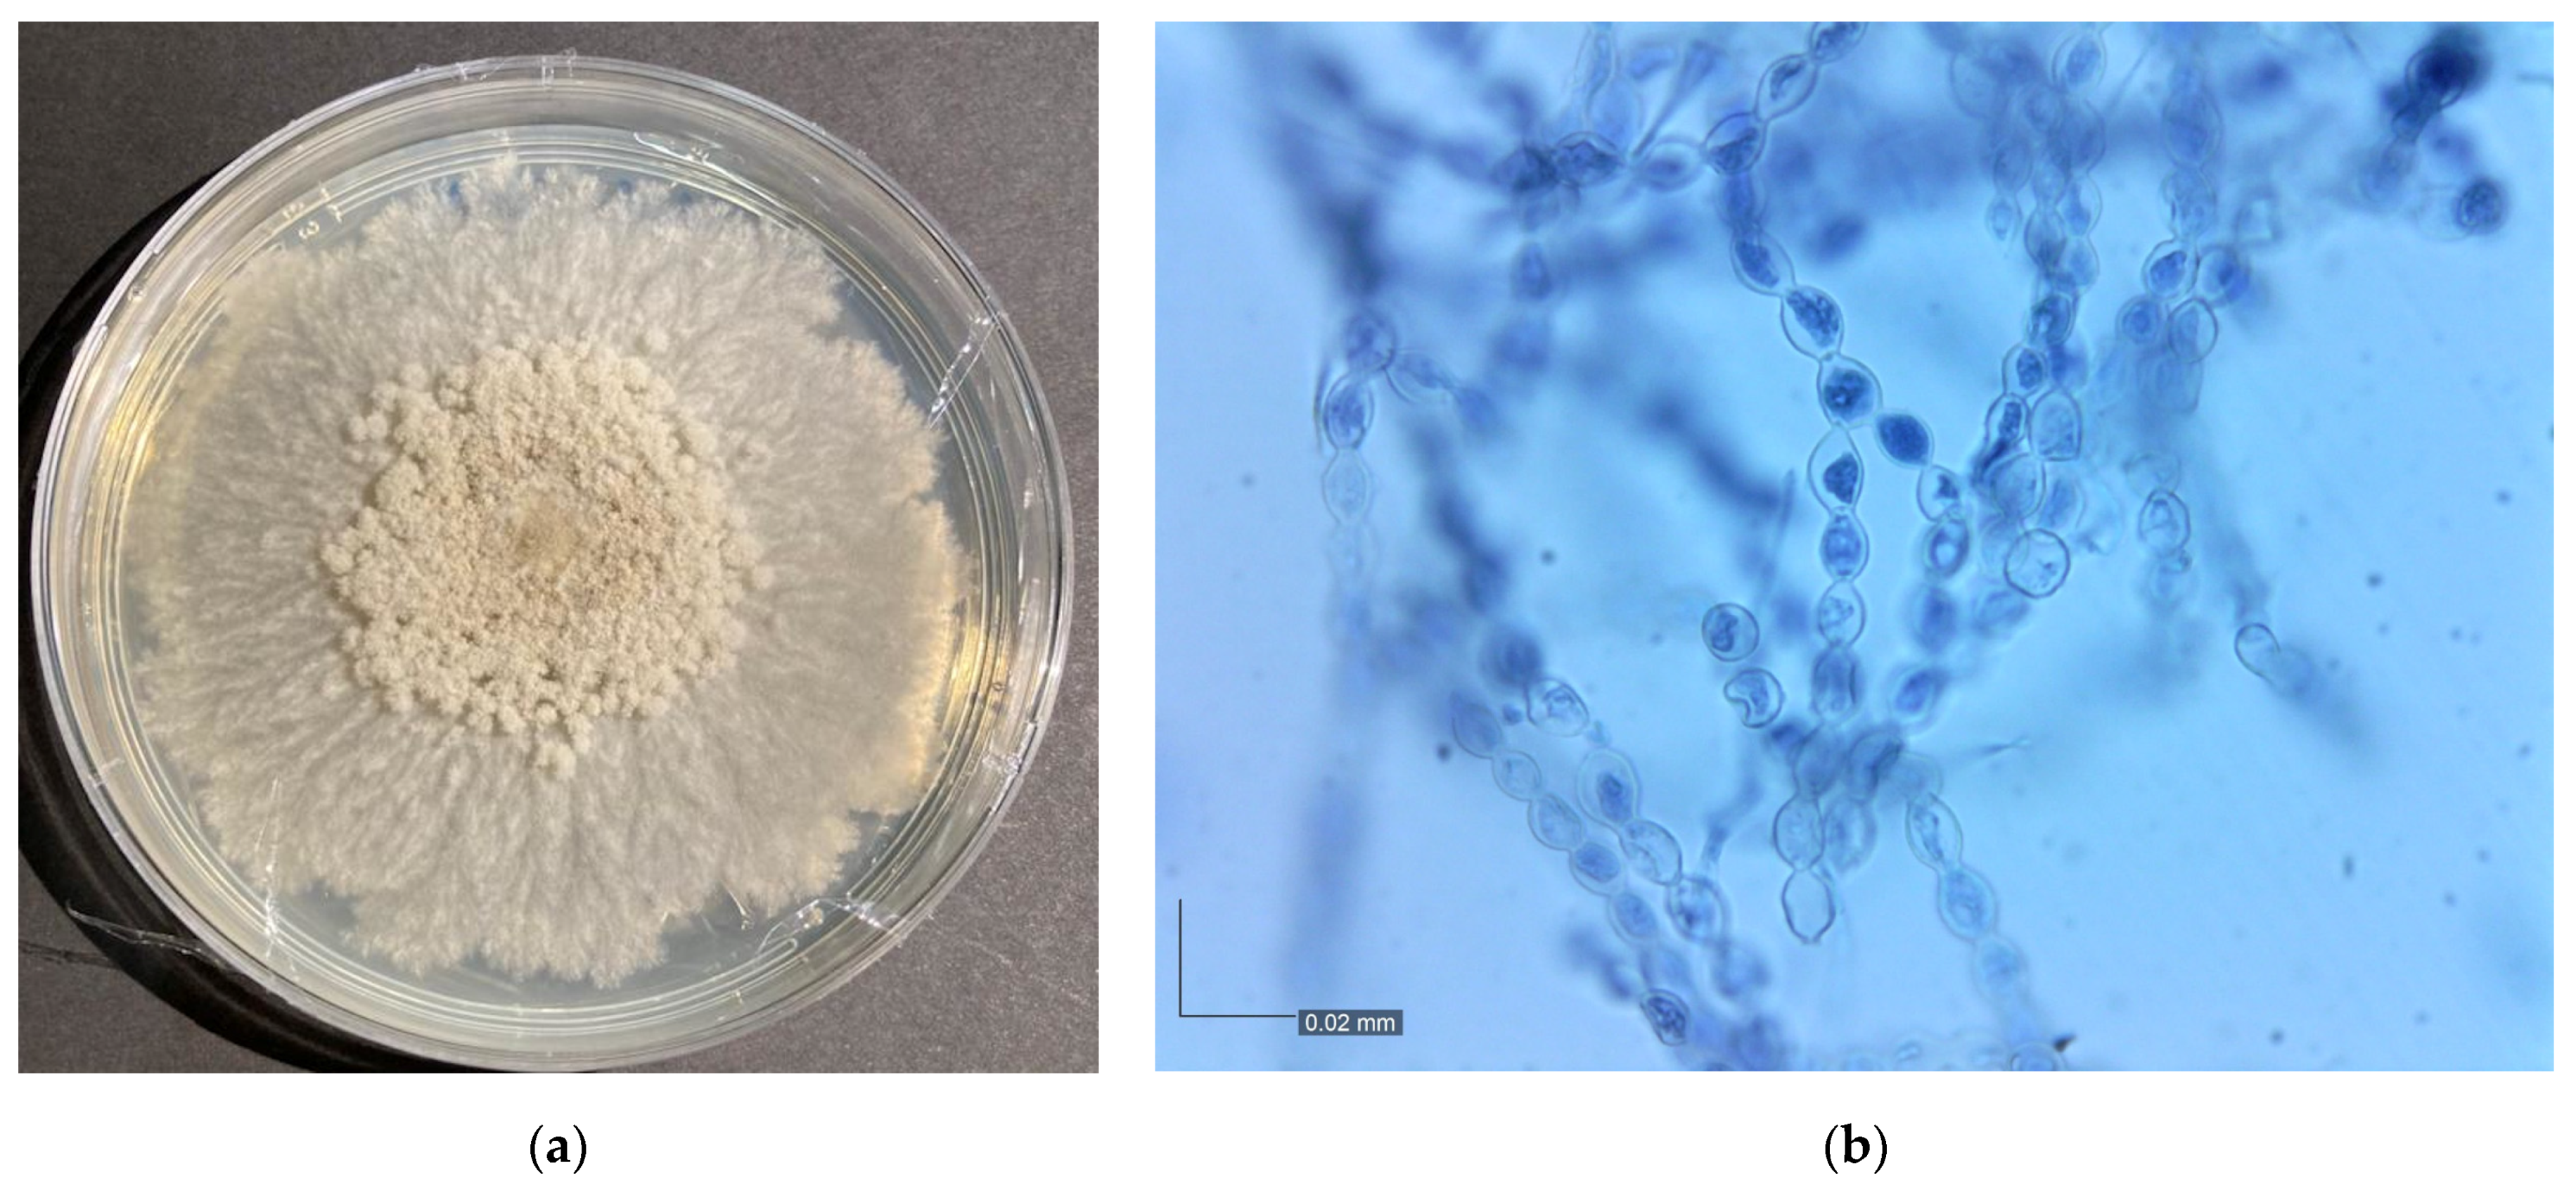
2.2. Isolation of Putative M. fructicola, Morphological Identification

Symptomatic branch segments from 42 trees were sterilized as previously described by Eevers et al. [18] and plated on potato dextrose agar (PDA) media supplemented with streptomycin (0.5 g/L) to prevent bacterial growth, followed by incubation at 22 °C in the dark for 7 days. The presumptive morphological identification of Monilinia sp. was based on the microscopic structure of the lemon-shaped conidial chains, observed after staining with lactophenol cotton blue [7] and further confirmed by molecular assays (Section 2.3).

2.3. DNA Extraction from Single Colony and Molecular Identification by PCR

DNA extraction of four putative Monilinia sp. isolates based on morphological structures was performed after 7 days of mycelial growth using the REDExtract-N-Amp™ Plant PCR kit (Sigma Aldrich, St. Louis, MI, USA). PCR was performed as previously described by White et al. [19] to amplify the internal transcribed spacer (ITS) region of all isolates, using primers ITS1 (5′-TCCGTAGGTGAACCTGCG-3′) and ITS4 (5′-TCCTCCGCTTATTGATATGC-3′). The resulting amplified fragments were purified using the NZYGelpure Kit (NZYTech™, Lisbon, Portugal) and sequenced with the ITS4 (5′-TCCTCCGCTTATTGATATGC-3′) standard sequencing primer at STABVIDA, Caparica, Portugal. For molecular identification, the sequences obtained were processed using Geneious® 10.2.2 software and compared with sequences available in the National Center for Biotechnology Information (NCBI) using BLAST [20]. To further confirm the identity of the isolates, ITS sequences of closely related reference Monilinia species were downloaded from NCBI and studied through phylogenetic methods. The sequences were aligned using the online version of MAFFT v.7 [21] and manually adjusted using UGENE v.1.26.3 [22]. Maximum likelihood analysis was then performed using MEGA11 [23] with the K2+G substitution model and 1000 bootstrap replicates to verify the branches.

2.4. Total DNA Extraction from Branches and Flower Extracts

Symptomatic branch segments and flowers collected from 42 trees (Table I) were placed in a Bioreba bag containing 5 mL phosphate-buffered saline (PBS) and macerated using a homogenizer (Homex 7, Bioreba, Reinach, Switzerland). Total DNA was extracted using the Dneasy Plant Kit (Qiagen, Venlo, The Netherlands) according to the manufacturer’s instructions.

2.5. Molecular Identification by Using Real-Time PCR

A duplex real-time PCR developed by Van Brouwershaven et al. [24] and according to EPPO standards [7], was used to identify Monilinia sp. in all plant extracts (Table 1). This protocol distinguishes M. fructicola from M. fructigena and M. laxa. Positive controls for M. fructicola CECT 21105, M. fructigena CECT 21206, and M. laxa CECT 21100 were obtained from the University of Valencia.

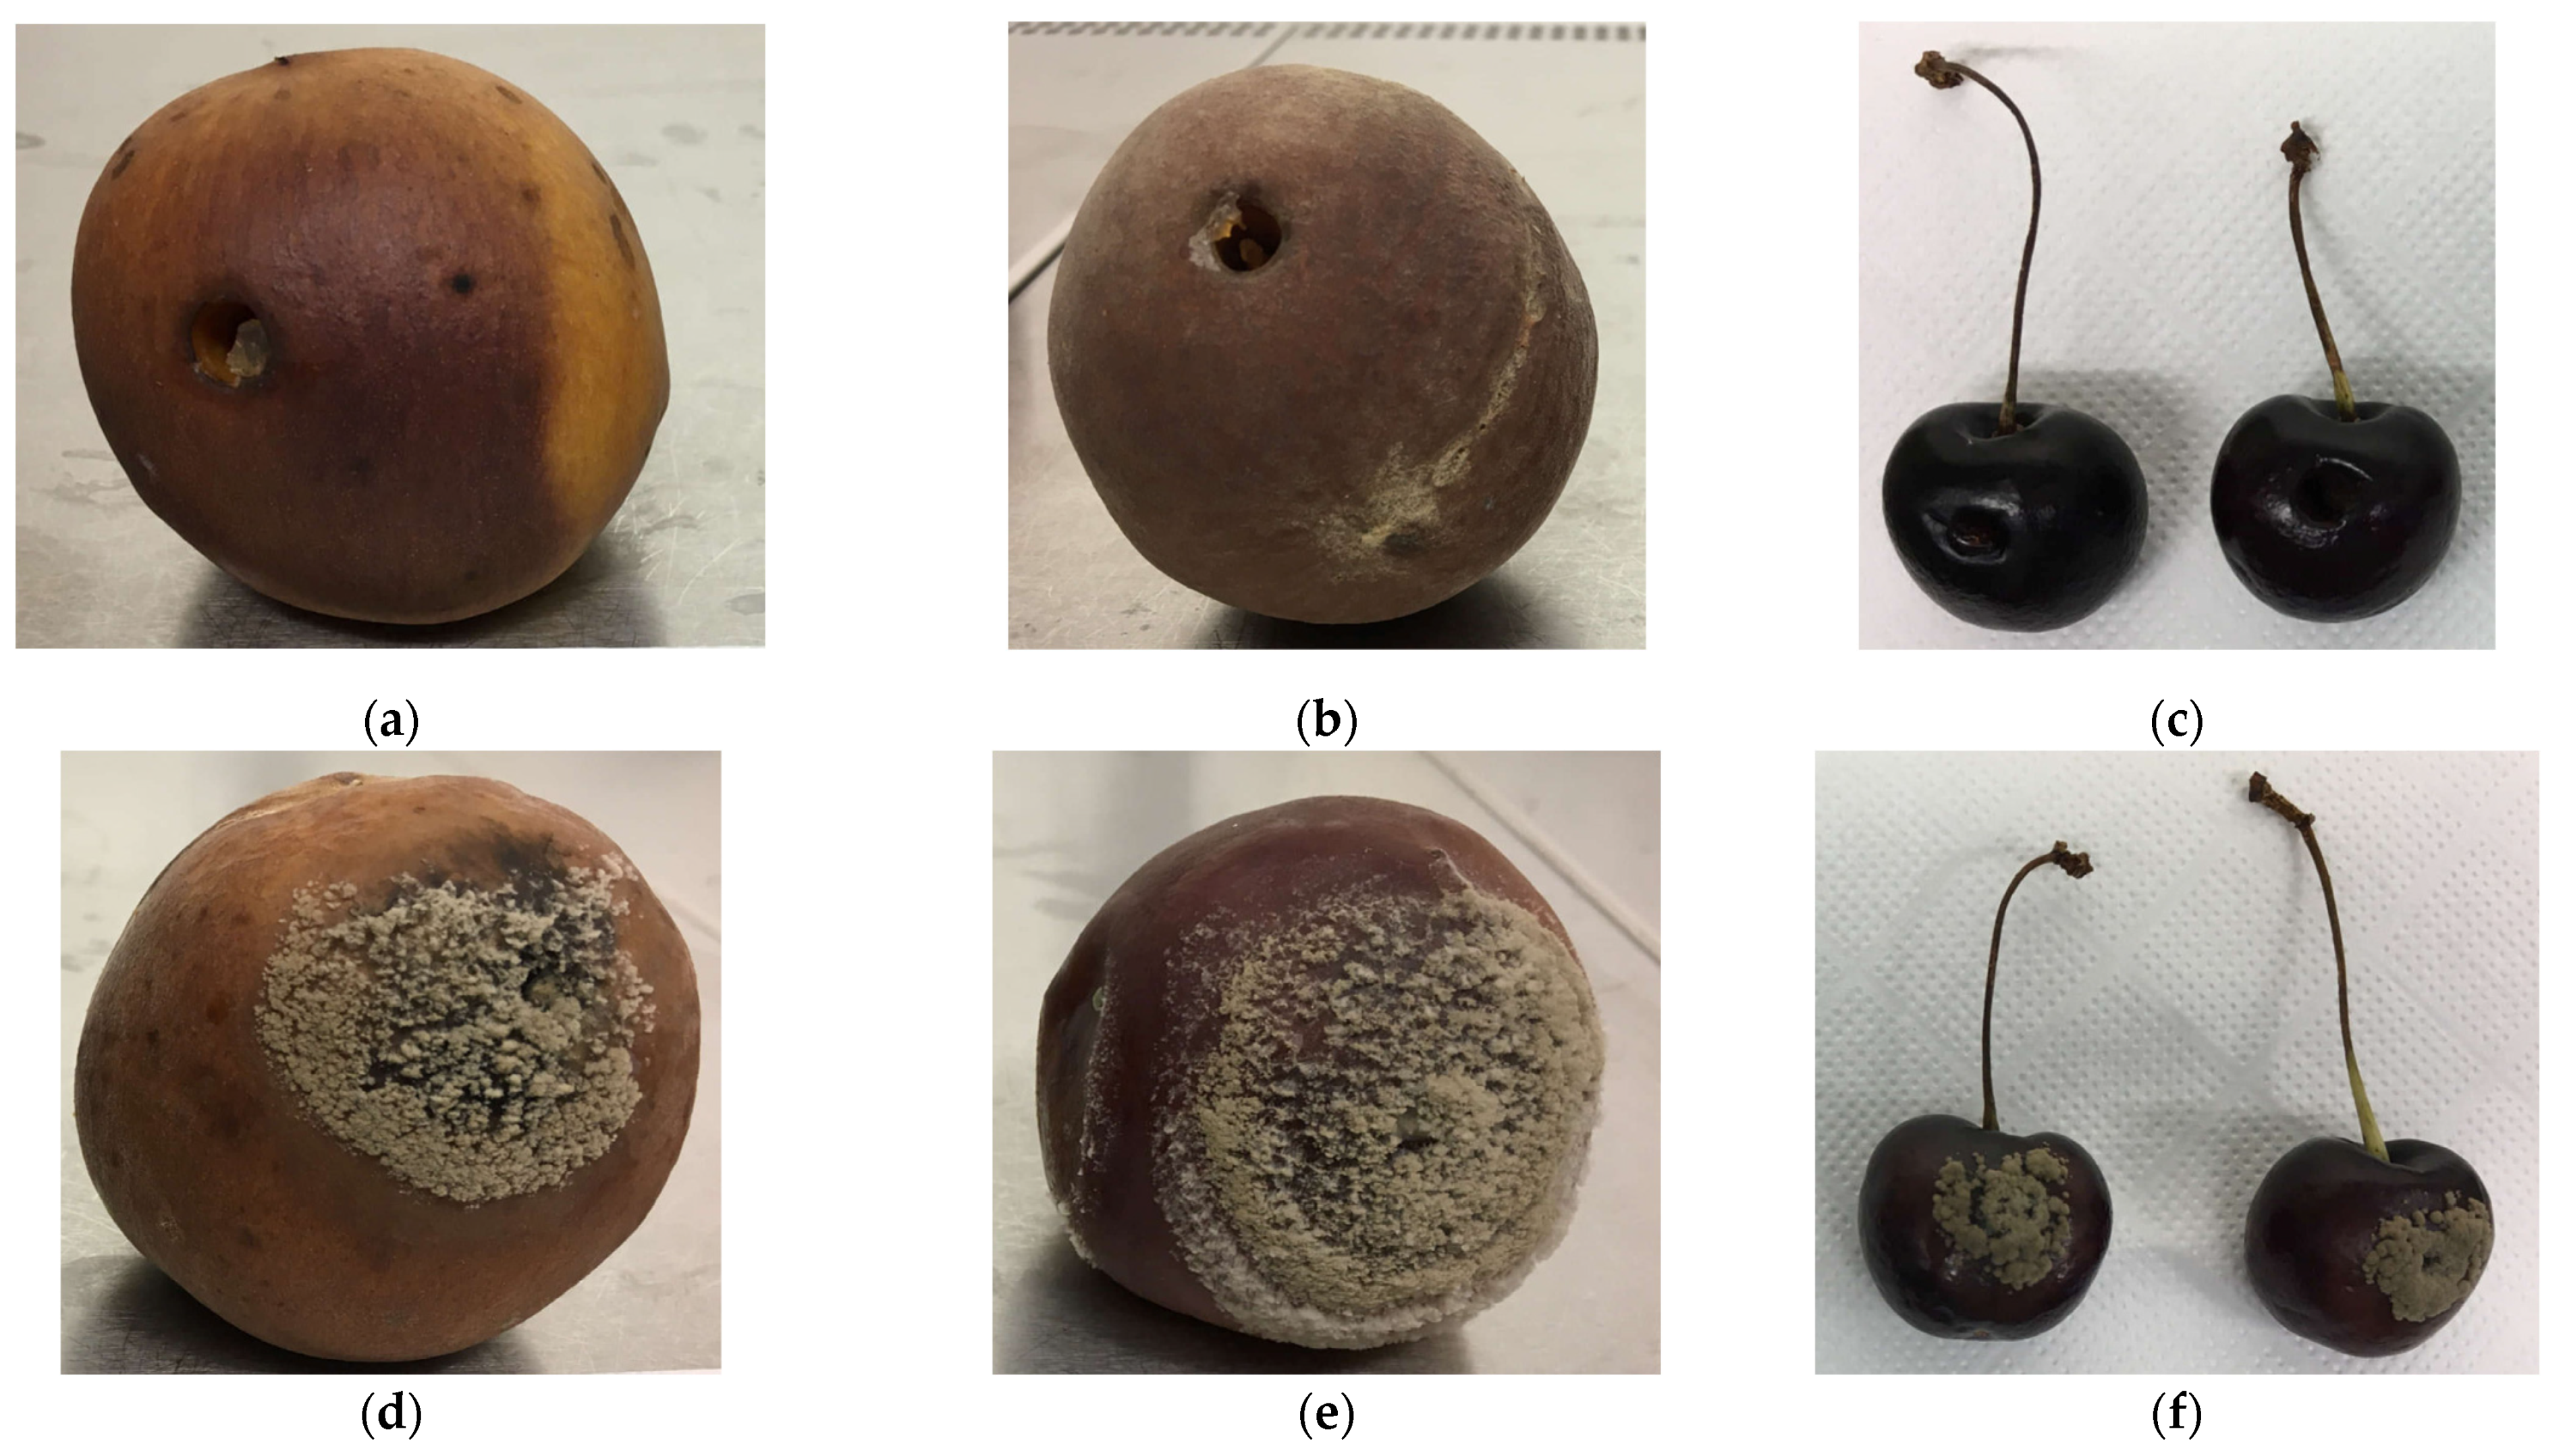
2.6. Pathogenicity Test

Pathogenicity was confirmed by inoculating surface-sterilized 12 peaches, 12 nectarines, and 24 sweet cherries (Prunus avium L.) with mycelial plugs of M. fructicola isolate 160E. Three-millimetre plugs were taken from a 7-day-old culture and placed upside down on the fruits, which had previously been wounded with a three-millimetre cork borer, in three replicates were made for each fruit type. Control fruits for each treatment were inoculated with sterile plugs of PDA. Fruits were kept in a humid chamber at 22ºC for 7 days throughout the experiment. The pathogen was re-isolated from the inoculated fruits, grown on PDA and molecularly identified by real-time PCR (Section 2.5), as previously described.

2.7. Genome Sequencing, Assembly, Annotation, and Functional Analysis

Genomic DNA from isolate 160E was purified according to the protocol of the MasterPure™ Complete DNA & RNA Purification Kit (LUCIGEN, Biosearch Technologies, Hoddesdon, UK). DNA quality and concentration were assessed using a NanoDrop 2000C spectrophotometer (Thermo Fisher Scientific, Waltham, MA, USA) and a Qubit 2.0 fluorometer (Life Technologies, Carlsbad, CA, USA). MinION whole genome sequencing was performed by preparing a genomic library using the ligation sequencing kit (SQK-LSK109, Oxford Nanopore Technologies (ONT), Oxford, UK), according to the manufacturer’s protocol. The library was then loaded onto a flow cell (R9.4.1, FLO-MIN106), and sequenced for 15 h and 41 min. MinKnow software (version 21.11.7) was then used to operate the MinION Mk1C (ONT) and basecalling was performed using Guppy (v. 5.1.13).
The quality of the initial reads was assessed using Nanoplot V.1.41.0 [25]. Genome assembly and annotation were conducted using the web-based Galaxy platform [26]. All obtained Nanopore raw reads were assembled using the Flye (v.2.9) [27] assembler, with the options—nano-raw, —scaffold and three internal rounds of self-polishing. Assembled sequences <1.000 bp in size were removed from the dataset (i.e., a single contig of 645 bp). The final assembly was evaluated using Quast (v.5.2.0) [28] and gfastats (v.1.2.1) to obtain the overall assembly metrics. Complementary, the genome completeness was estimated with the Benchmarking Universal Single-Copy Orthologs (BUSCO) (v.5.3.2) [29] using the ortholog dataset set for fungi (OrthoDB v.10) [30]. Genomic rRNA genes were detected using Barrnap (v.0.9) [31] and tRNA genes were identified using ARAGORN (v.1.2.36) [32]. Genomic repetitive elements were predicted and soft-masked using RepeatModeler (v.2.0.3) [33] and RepeatMasker (v.4.1.2-p1) [34]. Coding gene predictions were performed with AUGUSTUS (v.3.4.0) [35], with the species = Botrytis cinerea selected for training. The coding genes detected in the assembly were functionally annotated using DIAMOND (v.2.0.15) [36] against the UniProtKB Swiss-Prot database (UniProt Consortium., 2017) + Blast2Go (v.1.2.14) [37,38]; the EggNOG Mapper [39] and InterProScan [40,41] with all applications and default settings selected. The obtained annotation results were uploaded and compiled with the OmicsBox software (v.2.0), the Interpro protein domains, families and sites were obtained, the Gene Ontology (GOs) terms were merged, and the GOSlim tool and the enzyme coding mapping tools were applied. In parallel, the predicted protein-coding genes were mapped to the Kyoto Encyclopedia of Genes and Genomes (KEGG) using KofamKOALA [42] and reconstructed with the KEGG Mapper Reconstruction web server (https://www.genome.jp/kegg/tool/map_pathway.html, last accessed on 4 April 2023).
Analysis of putative secreted protein was conducted using SignalP (v.6.0) [43]. The obtained predicted proteins with signal peptides were then further evaluated to recognize putative membrane proteins (secretome) using DeepTMHMM (v.1.0.13) [44]. In parallel, EffectorP (v.3.0) was also applied to identify predicted fungal effectors [45]. Moreover, DIAMOND (v.2.0.15) [36] was used to compare the predicted proteins with the pathogen–host interaction database (PHI-database v.4.10) [46]. In parallel, carbohydrate-active enzymes (CAZymes/“CAZome”) were identified using the dbcan2 web-server [47]. Lastly, biosynthetic gene clusters (BGCs) were screened using the fungal version of antiSMASH web-server (v.6.0) [48], with the options: detection strictness set to strict and all extra features selected.

3. Results and Discussion

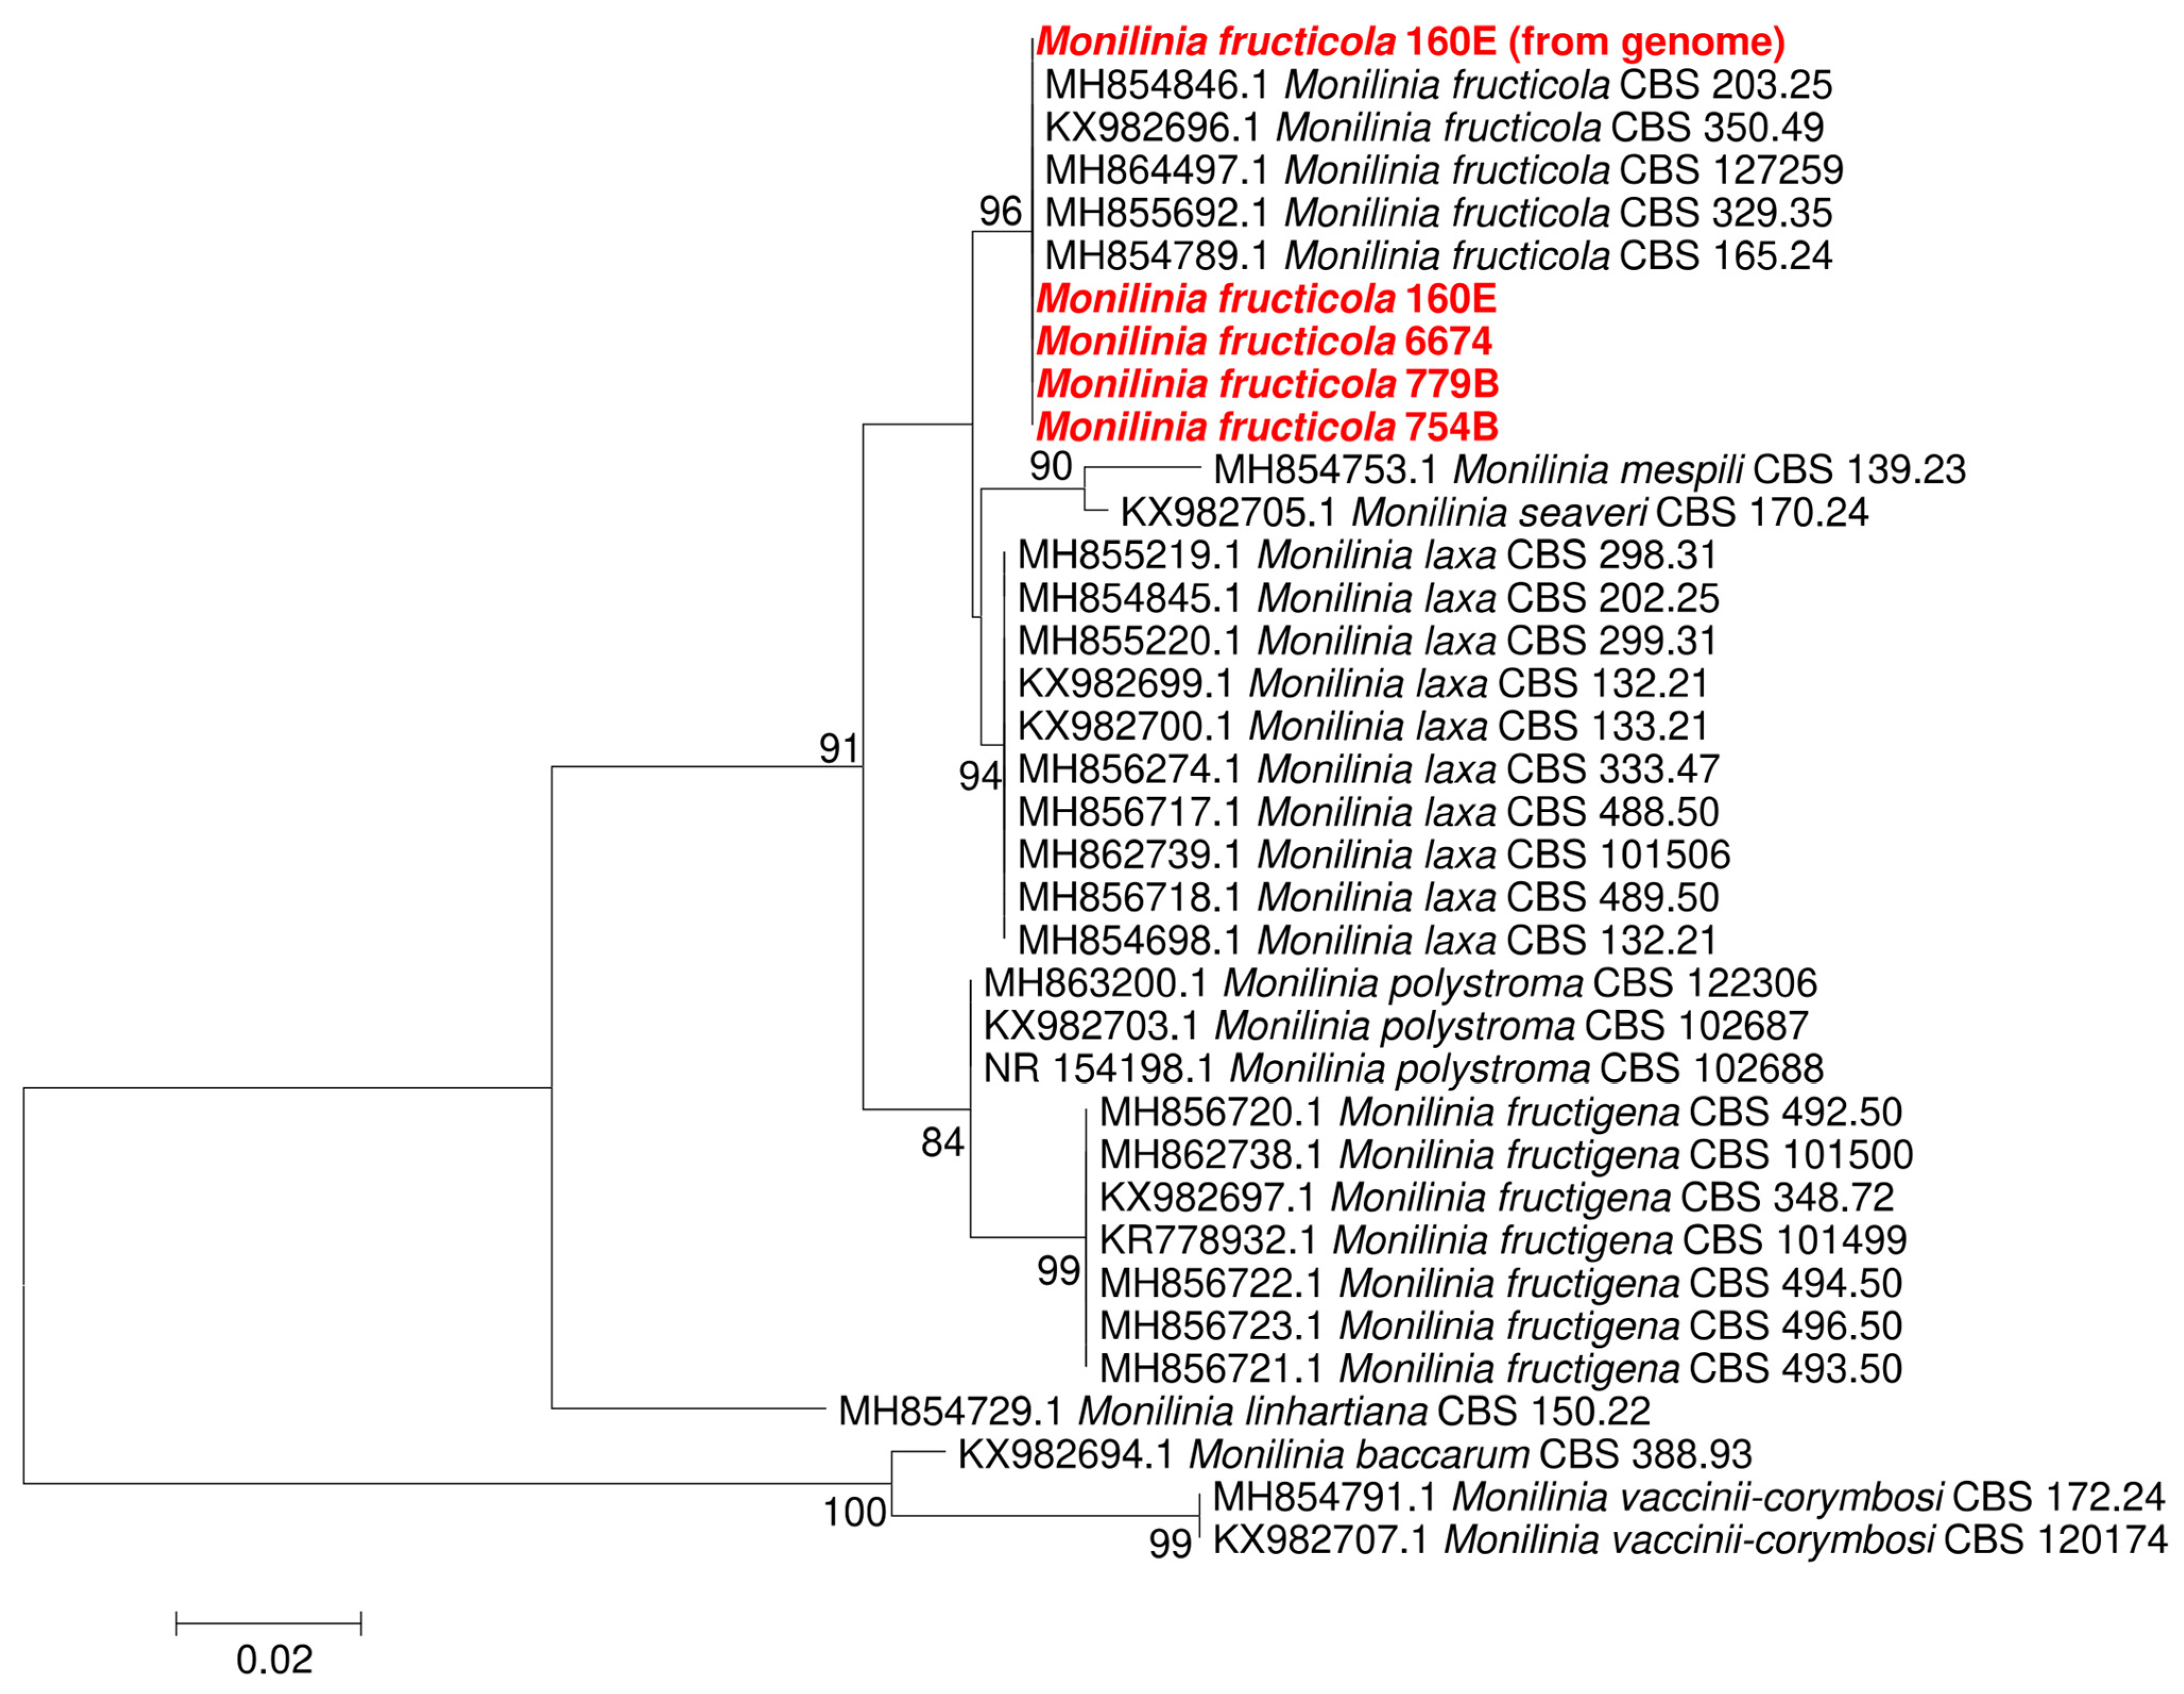
3.1. Monilinia Fructicola Isolation and Identification

During the field campaigns, flower necrosis was the most commonly observed symptom, appearing as an exudation that remained attached to the plant, although branches were also severely affected.
Pure cultures of M. fructicola were obtained from four isolates (6774, 779B, 754B and 160E) collected from branches of orchards B and F (Figure 1a, Table 2). The identification was confirmed by conventional PCR. In detail, Basic Local Alignment Search Tool (BLAST) searches of the ITS sequence in GenBank showed the highest similarity (99%) to the sequences of M. fructicola isolates from the Netherlands (MH864497.1) and Serbia (MT804333.1). The phylogenetic analysis performed with the reference sequences also confirmed this identification (Figure 2). The method developed by Van Brouwershaven et al. [17] was applied to the isolates and confirmed the previous results.
M. fructicola isolates were grey, the sporulation produced concentric rings, and the macroconidia were hyaline and ovoid [49]. The characteristic morphological structures described in the literature were observed, namely ellipsoid and lemon-shaped conidia connected by chains (Figure 1b).
Species of Monilinia are very difficult to distinguish based on morphological characteristics and growth parameters alone, therefore molecular characteristics play an important role in accurate identification [10,50]. The method developed by Van Brouwershaven et al. [17] was additionally applied to total DNA plant extracts (Table 1) and allowed the additional detection of M. fructicola in 9 samples from orchards A, B, E and F (Table 2).

3.2. Pathogenicity Tests

The principles of Koch’s postulates were applied to confirm that the typical brown rot symptoms observed in the field were caused by isolate 160E identified as M. fructicola. The control treatment showed no symptoms of M. fructicola infection (Figure 3a–c), whereas fruits inoculated with the isolate 160E showed initial symptoms after two days and the typical brown rot symptoms appeared after seven days (Figure 3d–f). The pathogen was re-isolated from the inoculated fruits and cultured on PDA media and was morphologically and molecularly confirmed as M. fructicola.

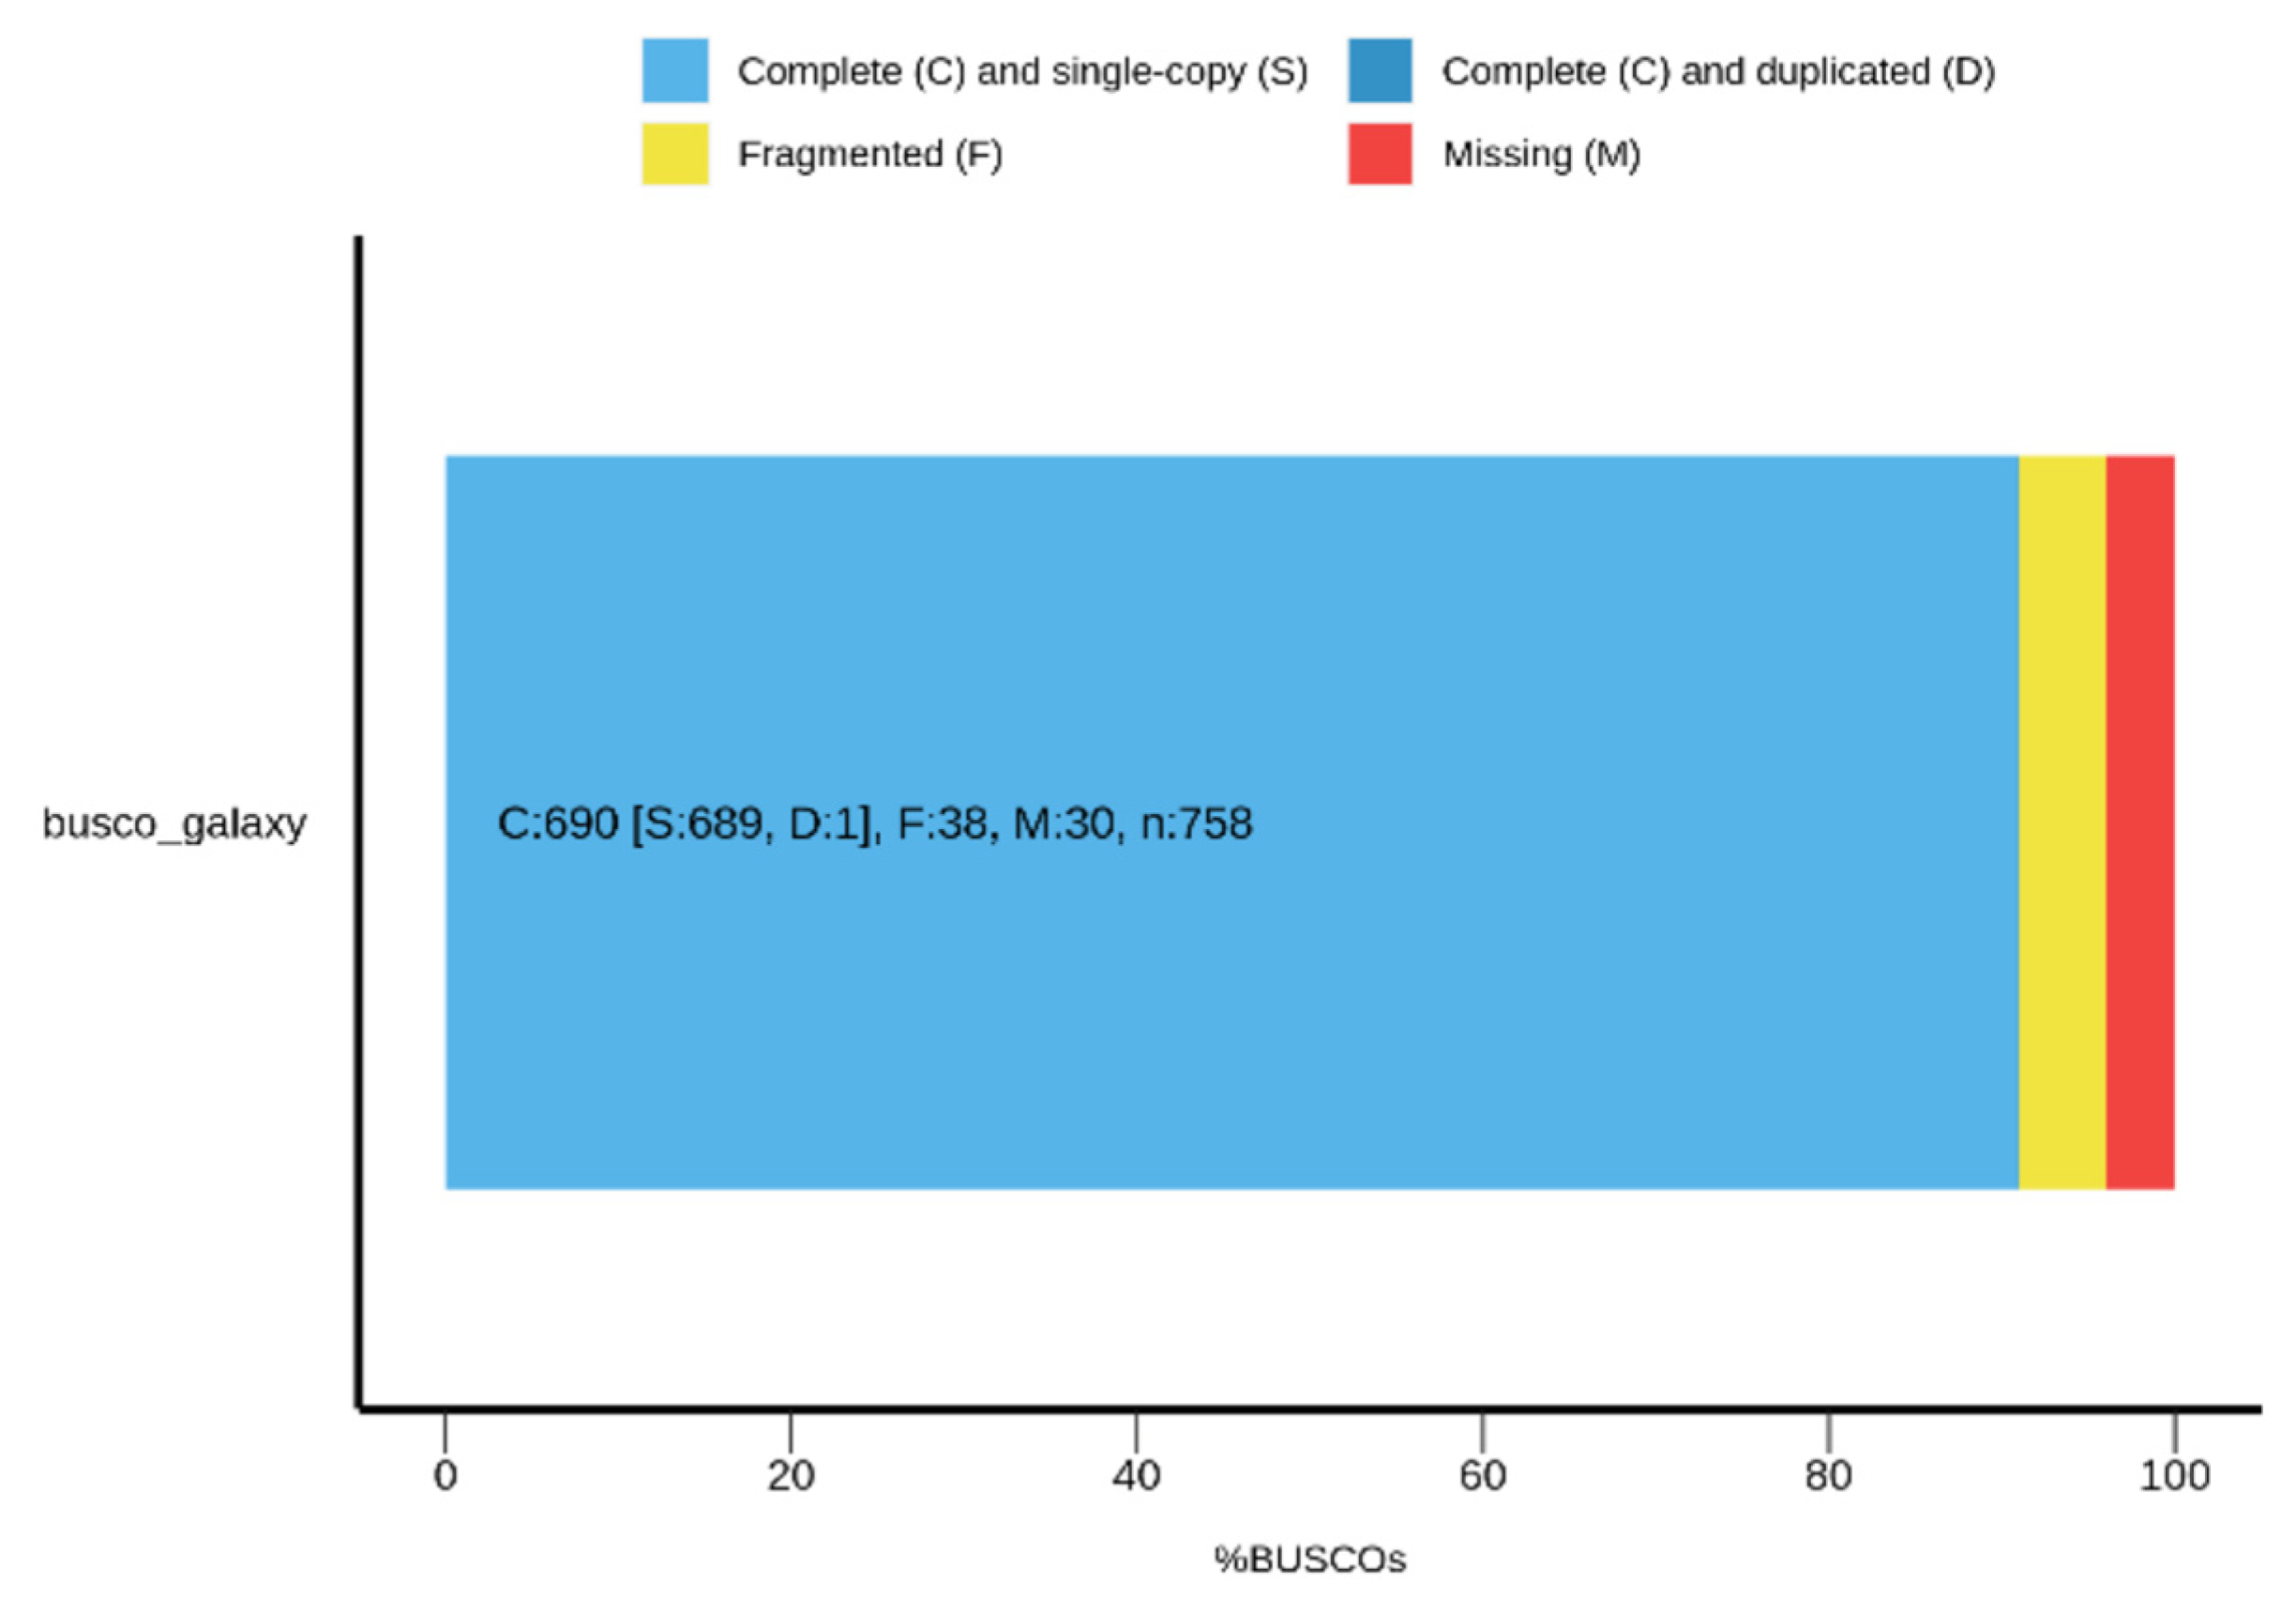
3.3. Genome Assembly

The whole genome of M. fructicola isolate 160E was sequenced using the Oxford Nanopore Technology (ONT) platform, consisting of 44,541,355 bp, assembled into 22 contigs/scaffolds (109× average coverage with circularization achieved for two contigs/scaffolds (Table 3) with a GC content of 40.54%). Manual BLAST analysis against the National Center for Biotechnology Information (NCBI) genome database indicates that contig_31 corresponds to the M. fructicola mitochondrial genome, while contig_35 corresponds to M. fructicola genomic material (possibly indicating the presence of extrachromosomal DNA (ecDNA), pending further studies). Overall, when comparing these results with the currently available literature, this assembly is consistent with the genomes of the species studied by De Miccolis Angelini et al. [51] (with 20 contigs).
The Benchmarking Universal Single-Copy Orthologs (BUSCO) completeness was estimated to be 91% for fungi (n = 758), with 690 complete BUSCOs, 689 complete and single-copy BUSCOs, one complete and duplicated BUSCO, 38 fragmented BUSCOs and 30 missing BUSCOs (Figure 4). As such, these results are consistent with the values found for M. fructicola completeness, which typically range from 88% to 98.7% [51,52].
ONT is one of the most rapidly developing Next Generation Sequencing (NGS) technologies to date, with its own set of advantages and disadvantages. The Achilles heel of this technology is its sequencing error rate, which is still higher than other NGS technologies. However, ONT has made significant progress in addressing this issue, resulting in the latest quality score being set at Q20+. Several approaches can be taken to overcome the error barrier. Firstly, increasing coverage, and in this work, we have achieved a coverage of 109X. Secondly, native sequencing to eliminate polymerase amplification errors, which was also performed in this study (Table 4). Finally, the assembly of long reads can minimize assembly errors. In addition to these advances, fungal identification was carried out using several techniques: RT-PCR, ITS gene Sanger sequencing and genome sequencing. All were successful in identifying M. fruticola. Furthermore, the comparison of the ITS sequences obtained by Sanger sequencing and ONT-based genome sequencing showed 100% similarity (Figure 2).

3.4. Genome Annotation and Functional Characterization

In total, AUGUSTUS predicted the presence of 9603 genes, with 121 tRNAs and tmRNAs; and 12 rRNAs (4 18S rRNAs, 4 28S rRNAs and 4 5.8S rRNAs). This result highlights a somewhat slightly lower number of predicted genes when compared for instance with the results obtained by De Miccolis Angelini et al. [51] (13,749) and Vilanova et al. [52] (10,086). On the other hand, from the initial 44,541,355 bp, RepeatMasker detected and masked 5,621,921 bp (12.62% of the assembly) (Table S1), a value higher than the one observed by De Miccolis Angelini et al. [51] (4.13% of the full genome size). Overall, the vast majority of these had a classification of unclassified (6.29%), followed by retroelements (1.389%) and DNA transposons (0.58%) (Table S1).
From the whole genome annotation (Table S2), the functional analysis considering GOs, revealed that the top five most representative domains for (1) biological processes were: cellular process, metabolic process, organic substance metabolic process, primary metabolic process and nitrogen compound metabolic process (Table S3); (2) cellular components were: cellular anatomical entity, organelle, intracellular anatomical structure, intracellular organelle and membrane-bounded organelle (Table S4); and (3) molecular function were: catalytic activity, binding, hydrolase activity, transferase activity and organic cyclic compound binding (Table S5) (as similarly verified by De Miccolis Angelini et al. [51]). On the other hand, of the 9603 genes, InterProScan predicted information about proteins’ function from 9181 with IPS, revealing that the top five most representative (1) families were: (IPR027417) P-loop containing nucleoside triphosphate hydrolase, (IPR036291) NAD(P)-binding domain superfamily, (IPR036259) MFS transporter superfamily, (IPR029058) Alpha/Beta hydrolase fold and (IPR011701) Major facilitator superfamily (Table S6); (2) domains were: ((IPR020846) major facilitator superfamily domain, (IPR000719) Protein kinase domain, (IPR001138) Zn(2)-C6 fungal-type DNA-binding domain, (IPR003593) AAA+ ATPase domain and (IPR007219) Transcription factor domain, fungi (Table S7); and (3) sites were: (IPR008271) Serine/threonine-protein kinase, active site, (IPR005829) Sugar transporter, conserved site, (IPR017441) Protein kinase, ATP binding site, (IPR019775) WD40 repeat, conserved site and (IPR017972) Cytochrome P450, conserved site (Table S8). Overall, these results point to the presence of an important representation of processes related to gene, cellular signalling and transcription regulation, as well as, cellular processes and cell cycle control, as evidenced for instance by the high number of IPR005829, IPR017441 and IPR019775 detections. On the other hand, also highly relevant are the abundances of major facilitator transporters (MFS), since they are particularly relevant to mediate resistance to toxic compounds and can be viewed as genomic evidence of tolerance (e.g., [53]).
The Omicsbox enzyme coding map tool detected seven main enzyme classes (Figure 5). Of these, the overall most represented were hydrolases, transferases and oxidoreductases (Table S9–S16; Figure MS1). The high abundance of hydrolases and oxiredutases is relevant considering that they are required for lignin and cellulose degradation [54]. In parallel, the results obtained with the Eggnog mapper revealed that the most relevant Clusters of Orthologous Genes (COGs) category groups were: S (unknown function) (n = 2073), O (Post-translational modification, protein turnover, chaperone functions) (n = 486), G (Carbohydrate metabolism and transport) (n = 471), E (Amino Acid metabolism and transport) (n = 377) and U (Intracellular trafficking and secretion) (n = 372) among others (Table S17).
SignalP detected 754 predicted proteins containing signal peptides, a similar number found in other genomes of this species [51,52,55]. When considering the overall results obtained, DeepTMHMM predicted 487 Globular (Globs), 152 Signal Peptides (SPs), 103 alpha-helix Transmembrane (TMs) and 12 SP+TMs (Table S18). From these, in terms of region types, 313 were classified as TMhelix (transmembrane helices), 164 were classified as signal (Signal peptide), 285 were labelled as inside (Cytoplasmic) and 782 were labelled as outside (Extracellular). In addition, EffectorP categorizes effectors into apoplastic (apoplast or fungal cell wall) [56,57] and cytoplasmic effectors (transported into the plant cell, sometimes to plant compartments). Overall, EffectorP detected 474 non-effectors, 181 apoplastic effectors, 75 cytoplasmatic effectors, 18 cytoplasmatic/apoplastic effectors and 6 apoplastic/cytoplasmatic effectors in the SignalP dataset (Table S19). Considering that proteins with a signal peptide, no transmembrane structure and effector candidates can be considered secreted (secretome), their number accounted for a total of 152 proteins, from these being 103 non-effectors, 36 apoplastic effectors, 9 cytoplasmatic effectors, 3 cytoplasmatic/apoplastic effectors and 1 apoplastic/cytoplasmatic effector (Table S20). On the other hand, the results obtained through the comparison with the pathogen–host interaction database revealed that 228 proteins had a significant match, with the most prevalent result being Endo-1 4-beta xylanase [GH10 family Magnaporthe oryzae reduced virulence] (6 counts) and also highlighting the phytosanitary problems of this species.
The dbCAN2 tool identified 692 carbohydrate-active enzymes (CAZome) (Table S20). Cazymes are particularly important in plant pathogenic fungi since they allow tissue breakdown, nutrient acquisition, establish infection and/or interfere with the host plant’s defences [52,55,58]. In general, the frequency of the enzyme families detected in this study was largely dominated by GH (glycoside hydrolases GH28, GH3 and GH18), AA (auxiliary activities AA3_2 and AA8_e0) and GT (glycosyltransferases GT2) (Table S21). Very few carbohydrate esterases (CE) and PL (polysaccharide lyases) were detected in the CAZome. These results are of extreme relevance considering that, for instance, the high number of GH28 is known to be expanded in necrotrophs [58], contributing to plant disease.
The fungal antiSMASH tool predicted ten putative BGCs, namely six T1PKS clusters, two NRPs clusters and two terpenes, being in accordance with what is found in other genomes of this species [52]. All of the predicted BGCs had somewhat low similarities with the MiBiG database [59,60] except for a T1PKS cluster, with 100% similarity with 1,3,6,8-tetrahydroxynaphthalene, a critical precursor to the DHN (1,8-Dihydroxynaphthalene) melanin biosynthesis. While commonly, M. fructicola contains two orthologous clusters contributing to the synthesis of melanin, in this study only one could be detected, a result that can affect virulence. Moreover, the detection of genes related to the synthesis of botcinic acid could also be detected, a phytotoxic polyketide, is also relevant, even with a lower similarity than expected (33%) (e.g., [55]). Nonetheless, through the BGC analysis, it is also possible to verify that the species can synthesize other additional yet putative unknown compounds, which will require further studies in the future.

4. Conclusions

Over the last two years, peach orchards in the Cova da Beira region have experienced a progressive decline in plants, with symptoms characterized by flower abortion with the production of exudates, cankers on the branches and, in some cases, death. This situation has resulted in significant losses for the growers of the orchards affected. In this scenario, procedures were established to identify the causal agent responsible for the observed decline, and M. fructicola was detected for the first time in Portugal in P. persica.
This regulated organism was detected and confirmed in nine of the forty-six samples analyzed (flowers and branches), corresponding to four of the thirteen orchards sampled, all located in the northern region of Cova da Beira. These results suggest that the distribution of the disease is still limited in the region studied, being restricted to geographically close orchards, all located north of Serra da Gardunha. However, it was possible to observe the spread of the symptoms associated with the disease within the orchards over the two years of the study, as well as an increase in the severity of these symptoms on infected plants over time.
Stone fruits such as sweet cherry, peach and nectarine are economically important for the Portuguese fruit sector. The presence of M. fructicola described in this work will certainly affect the national production of peach and nectarine in the coming years since Cova da Beira is the main production area. However, this evidence will contribute decisively to the awareness of phytosanitary authorities and producers of the presence of a regulated and harmful organism, allowing the implementation of specific phytosanitary management measures aimed at limiting the spread of the disease within the orchard and between orchards, thus reducing its impact on the productivity of the sector.

Supplementary Materials

The following supporting information can be downloaded at: https://www.mdpi.com/article/10.3390/agronomy13061493/s1, Multimédia S1: Graphycal display of the main enzyme classes on the obtained assembly; Table S1: RepeatMasker repeat statistics on the obtained assembly; Table S2: Overall genome annotation; Table S3: Gene Ontology terms for Biological Processes; Table S4: Gene Ontology terms for Cellular components; Table S5: Gene Ontology terms for Molecular function; Table S6: InterProScan Families detected; Table S7: InterProScan Domains detected; Table S8: InterProScan Sites detected; Table S9: EC classes detected; Table S10: EC oxidoreductases sub-classes detected; Table S11: EC transferases sub-classes detected; Table S12: EC hydrolases sub-classes detected; Table S13: EC lyases sub-classes detected; Table S14: EC isomerases sub-classes detected; Table S15: EC ligases sub-classes detected; Table S16: EC translocases sub-classes detected; Table S17: EggNog mapper COG categories detected; Table S18: deepTMHMM and EffectorP summary results; Table Table S19: DIAMOND results obtained with the Pathogen-host interactions database; Table S20: CAZome results; Table S21: BGCs detected.

Author Contributions

Conceptualization and methodology: E.B., A.A. and J.C.; Validation: E.B. and J.C.; Formal analysis: E.B., S.R. and E.G.; Genome sequencing: A.C., I.B. and C.E.S.; Genome assembly, annotation and functional characterization: J.T.; Writing—Original Draft Preparation, E.B, J.T. and J.C.; Writing—Review & Editing, all authors; Supervision and Funding Acquisition: J.C. All authors have read and agreed to the published version of the manuscript.

Funding

This research was funded by project CULTIVAR (CENTRO- 01-0145-FEDER-000020), co-financed by the Regional Operational Programme Centro 2020, Portugal 2020, and European Union, and supported by the R&D Unit Centre for Functional Ecology—Science for People and the Planet (CFE) UIDB/04004/2020 and Associated Laboratory TERRA LA/P/0092/2020 financed by FCT/MCTES through national funds (PIDDAC). EB is the recipient of the fellowship UI/BD/150981/2021 from the FCT/MCTES.

Data Availability Statement

The Whole Genome Shotgun project has been deposited at DDBJ/ENA/GenBank under the accession JARJBF000000000. The version described in this paper is version JARJBF010000000. Accession number partial ITS region of Monilinia fructicola strain 754B: OQ938271; Monilinia fructicola strain 160E: OQ938272; Monilinia fructicola strain 779B: OQ938273; Monilinia fructicola strain 6674: OQ938274.

Conflicts of Interest

The authors declare no competing interest.

References

  1. Food and Agricultural Organization of the United Nations. 2020. Available online: https://www.fao.org/faostat/en/#data/QCL (accessed on 5 January 2023).
  2. Das, B. Prunus diversity- early and present development: A review. Int. J. Biodivers. Conserv. 2011, 3, 721–734. [Google Scholar] [CrossRef]
  3. Instituto Nacional de Estatistica. Estatisticas Agricolas 2020. Available online: https://www.ine.pt/xportal/xmain?xpid=INE&xpgid=ine_publicacoes&PUBLICACOESpub_boui=437147278&PUBLICACOEStema=55505&PUBLICACOESmodo=2 (accessed on 5 January 2023).
  4. Sisquella, M.; Viñas, I.; Picouet, P.; Torres, R.; Usall, J. Effect of host and Monilinia spp. variables on the efficacy of radio frequency treatment on peaches. Postharvest Biol. Technol. 2014, 87, 6–12. [Google Scholar] [CrossRef]
  5. Obi, V.I.; Barriuso, J.J.; Gogorcena, Y. Peach brown rot: Still in search of an ideal management option. J. Agric. Sci. 2018, 8, 125. [Google Scholar] [CrossRef]
  6. Martini, C.; Mari, M. Monilinia fructicola, Monilinia laxa (Monilinia Rot, Brown Rot). In Postharvest Decay: Control Strategies; Academic Press: Cambridge, MA, USA, 2014. [Google Scholar] [CrossRef]
  7. EPPO Standards. Diagnostics. PM 7/18 (3) Monilinia fructicola. EPPO Bull. 2020, 50, 5–18. [Google Scholar] [CrossRef]
  8. EPPO/CABI. Monilinia fructicola. In Quarantine Pests for Europe, 2nd ed.; Smith, I.M., McNamara, D.G., Scott, P.R., Holderness, M., Eds.; CAB International: Wallingford, UK, 1997; pp. 530–535. [Google Scholar]
  9. Lichou, J.; Mandrin, J.F.; Breniaux, D.; Mercier, V.; Giauque, P.; Desbrus, D.; Blanc, P.; Belluau, E. Une nouvelle moniliose: Monilia fructicola s’attaque aux arbres fruitiers à noyaux. Phytoma 2002, 547, 22–25. [Google Scholar]
  10. De Cal, A.; Melgarejo, P. Effects of long-wave UV light on Monilinia growth and identification of species. Plant Dis. 1999, 83, 62–65. [Google Scholar] [CrossRef] [PubMed]
  11. Duchoslavová, J.; Širučková, I.; Zapletalová, E.; Navrátil, M.; Šafářová, D. First Report of Brown Rot Caused by Monilinia fructicola on Various Stone and Pome Fruits in the Czech Republic. Plant Dis. 2007, 91, 907. [Google Scholar] [CrossRef]
  12. Munda, A.; Viršček Marn, M. First Report of Brown Rot Caused by Monilinia fructicola Affecting Peach Orchards in Slovenia. Plant Dis. 2010, 94, 1166. [Google Scholar] [CrossRef]
  13. Pellegrino, C.; Gullino, M.L.; Garibaldi, A.; Spadaro, D. First report of brown rot of stone fruit caused by Monilinia fructicola in Italy. Plant Dis. 2009, 93, 668. [Google Scholar] [CrossRef]
  14. Hrustić, J.; Mihajlović, M.; Tanović, B.; Delibašić, G.; Stanković, I.; Krstić, B.; Bulajić, A. First Report of Brown Rot Caused by Monilinia fructicola on Nectarine in Serbia. Plant Dis. 2013, 97, 147. [Google Scholar] [CrossRef]
  15. Ivić, D.; Fazinić, T.; Cole, J.; Novak, A. Monilinia species identified on peach and nectarine in Croatia, with the first record of Monilinia fructicola. EPPO Bull. 2014, 44, 70–72. [Google Scholar] [CrossRef]
  16. Bobev, S.B.; Angelov, L.T.; Van Poucke, K.; Maes, M. First Report of Brown Rot on Peach, Nectarine, Cherry, and Plum Fruits Caused by Monilinia fructicola in Bulgaria. Plant Dis. 2020, 104, 1561. [Google Scholar] [CrossRef]
  17. Ramos, N.; Soares, C. Ficha de Divulgação nº06/2013 (Moniliose). Direção Regional de Agricultura Do Algarve, 1-2. 2013. Available online: https://www.drapalgarve.gov.pt/images/pdf/Fitossanidade/avisos_agricolas/PRUN_FD_EAA_06Monilose.pdf (accessed on 5 May 2023).
  18. Eevers, N.; Gielen, M.; Sánchez-López, A.; Jaspers, S.; White, J.C.; Vangronsveld, J.; Weyens, N. Optimization of isolation and cultivation of bacterial endophytes through addition of plant extract to nutrient media. Microb. Biotechnol. 2015, 8, 707–715. [Google Scholar] [CrossRef]
  19. White, T.J.; Bruns, T.; Lee, S.; Taylor, J. Amplification and direct sequencing of fungal ribosomal rna genes for phylogenetics. In PCR Protocols; Academic Press: Cambridge, MA, USA, 1990. [Google Scholar] [CrossRef]
  20. Altschul, S.F.; Gish, W.; Miller, W.; Myers, E.W.; Lipman, D.J. Basic local alignment search tool. J. Mol. Biol. 1990, 215, 403–410. [Google Scholar] [CrossRef] [PubMed]
  21. Katoh, K.; Standley, D.M. MAFFT multiple sequence alignment software version 7: Improvements in performance and usability. Mol. Biol. Evol. 2013, 30, 772–780. [Google Scholar] [CrossRef]
  22. Okonechnikov, K.; Golosova, O.; Fursov, M. UGENE team Unipro UGENE: A unified bioinformatics toolkit. Bioinformatics 2012, 28, 1166–1167. [Google Scholar] [CrossRef]
  23. Tamura, K.; Stecher, G.; Kumar, S. MEGA11: Molecular Evolutionary Genetics Analysis Version 11. Mol. Biol. Evol. 2021, 38, 3022–3027. [Google Scholar] [CrossRef]
  24. Van Brouwershaven, I.R.; Bruil, M.L.; Van Leeuwen, G.C.M.; Kox, L.F.F. A real-time (TaqMan) PCR assay to differentiate Monilinia fructicola from other brown rot fungi of fruit crops. Plant Pathol. 2010, 59, 548–555. [Google Scholar] [CrossRef]
  25. De Coster, W.; D’Hert, S.; Schultz, D.T.; Cruts, M.; Van Broeckhoven, C. NanoPack: Visualizing and processing long-read sequencing data. Bioinformatics 2018, 34, 2666–2669. [Google Scholar] [CrossRef]
  26. Jalili, V.; Afgan, E.; Gu, Q.; Clements, D.; Blankenberg, D.; Goecks, J.; Taylor, J.; Nekrutenko, A. The Galaxy platform for accessible, reproducible and collaborative biomedical analyses: 2020 update. Nucleic Acids Res. 2020, 48, W395–W402. [Google Scholar] [CrossRef]
  27. Kolmogorov, M.; Yuan, J.; Lin, Y.; Pevzner, P.A. Assembly of long, error-prone reads using repeat graphs. Nat. Biotechnol. 2019, 37, 540–546. [Google Scholar] [CrossRef]
  28. Gurevich, A.; Saveliev, V.; Vyahhi, N.; Tesler, G. QUAST: Quality assessment tool for genome assemblies. Bioinformatics 2013, 29, 1072–1075. [Google Scholar] [CrossRef]
  29. Simão, F.A.; Waterhouse, R.M.; Ioannidis, P.; Kriventseva, E.V.; Zdobnov, E.M. BUSCO: Assessing genome assembly and annotation completeness with single-copy orthologs. Bioinformatics 2015, 31, 3210–3212. [Google Scholar] [CrossRef]
  30. Kriventseva, E.V.; Kuznetsov, D.; Tegenfeldt, F.; Manni, M.; Dias, R.; Simão, F.A.; Zdobnov, E.M. OrthoDB v10: Sampling the diversity of animal, plant, fungal, protist, bacterial and viral genomes for evolutionary and functional annotations of orthologs. Nucleic Acids Res. 2019, 47, D807–D811. [Google Scholar] [CrossRef]
  31. Seemann, T. Barrnap 0.7: Rapid ribosomal RNA prediction. 2013. Available online: https://github.com/tseemann/barrnap (accessed on 3 March 2023).
  32. Laslett, D.; Canback, B. ARAGORN, a program to detect tRNA genes and tmRNA genes in nucleotide sequences. Nucleic Acids Res. 2004, 32, 11–16. [Google Scholar] [CrossRef] [PubMed]
  33. Flynn, J.M.; Hubley, R.; Goubert, C.; Rosen, J.; Clark, A.G.; Feschotte, C.; Smit, A.F. RepeatModeler2 for automated genomic discovery of transposable element families. Proc. Natl. Acad. Sci. USA 2010, 117, 9451–9457. [Google Scholar] [CrossRef] [PubMed]
  34. Smit, A.; Hubley, R.; Green, P. RepeatMasker Open-4.0. (2013–2015). Available online: http://www.repeatmasker.org (accessed on 3 March 2023).
  35. Stanke, M.; Morgenstern, B. AUGUSTUS: A web server for gene prediction in eukaryotes that allows user-defined constraints. Nucleic Acids Res. 2005, 33, W465–W467. [Google Scholar] [CrossRef] [PubMed]
  36. Buchfink, B.; Xie, C.; Huson, D.H. Fast and sensitive protein alignment using DIAMOND. Nat. Methods 2015, 12, 59–60. [Google Scholar] [CrossRef]
  37. Conesa, A.; Götz, S.; García-Gómez, J.M.; Terol, J.; Talón, M.; Robles, M. Blast2GO: A universal tool for annotation, visualization and analysis in functional genomics research. Bioinformatics 2005, 21, 3674–3676. [Google Scholar] [CrossRef]
  38. Götz, S.; García-Gómez, J.M.; Terol, J.; Williams, T.D.; Nagaraj, S.H.; Nueda, M.J.; Robles, M.; Talón, M.; Dopazo, J.; Conesa, A. High-throughput functional annotation and data mining with the Blast2GO suite. Nucleic Acids Res. 2008, 36, 3420–3435. [Google Scholar] [CrossRef]
  39. Cantalapiedra, C.P.; Hernández-Plaza, A.; Letunic, I.; Bork, P.; Huerta-Cepas, J. EggNOG-mapper v2: Functional Annotation, Orthology Assignments, and Domain Prediction at the Metagenomic Scale. Mol. Biol. Evol. 2021, 38, 5825–5829. [Google Scholar] [CrossRef] [PubMed]
  40. Jones, P.; Binns, D.; Chang, H.-Y.; Fraser, M.; Li, W.; McAnulla, C.; McWilliam, H.; Maslen, J.; Mitchell, A.; Nuka, G.; et al. InterProScan 5: Genome-scale protein function classification. Bioinformatics 2014, 30, 1236–1240. [Google Scholar] [CrossRef] [PubMed]
  41. Blum, M.; Chang, H.Y.; Chuguransky, S.; Grego, T.; Kandasaamy, S.; Mitchell, A.; Nuka, G.; Paysan-Lafosse, T.; Qureshi, M.; Raj, S.; et al. The InterPro protein families and domains database: 20 years on. Nucleic Acids Res. 2021, 49, D344–D354. [Google Scholar] [CrossRef]
  42. Aramaki, T.; Blanc-Mathieu, R.; Endo, H.; Ohkubo, K.; Kanehisa, M.; Goto, S.; Ogata, H. KofamKOALA: KEGG Ortholog assignment based on profile HMM and adaptive score threshold. Bioinformatics 2020, 36, 2251–2252. [Google Scholar] [CrossRef]
  43. Teufel, F.; Almagro Armenteros, J.J.; Johansen, A.R.; Gíslason, M.H.; Pihl, S.I.; Tsirigos, K.D.; Winther, O.; Brunak, S.; von Heijne, G.; Nielsen, H. SignalP 6.0 Predicts All Five Types of Signal Peptides Using Protein Language Models. Nat. Biotechnol. 2022, 40, 1023–1025. [Google Scholar] [CrossRef] [PubMed]
  44. Hallgren, J.; Tsirigos, K.D.; Pedersen, M.D.; Armenteros, J.J.A.; Marcatili, P.; Nielsen, H.; Krogh, A.; Winther, O. DeepTMHMM Predicts Alpha and Beta Transmembrane Proteins Using Deep Neural Networks. BioRxiv 2022. [Google Scholar] [CrossRef]
  45. Sperschneider, J.; Dodds, P.N. EffectorP 3.0: Prediction of Apoplastic and Cytoplasmic Effectors in Fungi and Oomycetes. MPMI 2022, 35, 146–156. [Google Scholar] [CrossRef]
  46. Urban, M.; Cuzick, A.; Seager, J.; Wood, V.; Rutherford, K.; Venkatesh, S.Y.; De Silva, N.; Martinez, M.C.; Pedro, H.; Yates, A.D.; et al. PHI-Base: The Pathogen–Host Interactions Database. Nucleic Acids Res. 2020, 48, D613–D620. [Google Scholar] [CrossRef]
  47. Zhang, H.; Yohe, T.; Huang, L.; Entwistle, S.; Wu, P.; Yang, Z.; Busk, P.K.; Xu, Y.; Yin, Y. DbCAN2: A Meta Server for Automated Carbohydrate-Active Enzyme Annotation. Nucleic Acids Res. 2018, 46, W95–W101. [Google Scholar] [CrossRef]
  48. Blin, K.; Shaw, S.; Kloosterman, A.M.; Charlop-Powers, Z.; van Wezel, G.P.; Medema, M.H.; Weber, T. AntiSMASH 6.0: Improving Cluster Detection and Comparison Capabilities. Nucleic Acids Res. 2021, 49, W29–W35. [Google Scholar] [CrossRef]
  49. Sagasta, M.E. Monilinia disease. EPPO Bull. 1997, 7, 105–116. [Google Scholar] [CrossRef]
  50. Van Leeuwen, G.C.M.; Van Kesteren, H.A. Delineation of the three brown rot fungi of fruit crops (Monilinia spp.) on the basis of quantitative characteristics. Can. J. Bot. 1998, 76, 2042–2050. [Google Scholar] [CrossRef]
  51. De Miccolis Angelini, R.M.; Romanazzi, G.; Pollastro, S.; Rotolo, C.; Faretra, F.; Landi, L. New High-Quality Draft Genome of the Brown Rot Fungal Pathogen Monilinia fructicola. Genome Biol. Evol. 2019, 11, 2850–2855. [Google Scholar] [CrossRef]
  52. Vilanova, L.; Valero-Jiménez, C.A.; van Kan, J.A.L. Deciphering the Monilinia fructicola Genome to Discover Effector Genes Possibly Involved in Virulence. Genes 2021, 12, 568. [Google Scholar] [CrossRef] [PubMed]
  53. Teixeira, M.M.; Moreno, L.F.; Stielow, B.J.; Muszewska, A.; Hainaut, M.; Gonzaga, L.; Abouelleil, A.; Patané, J.S.L.; Priest, M.; Souza, R.; et al. Exploring the Genomic Diversity of Black Yeasts and Relatives (Chaetothyriales, Ascomycota). Stud. Mycol. 2017, 86, 1–28. [Google Scholar] [CrossRef] [PubMed]
  54. Baldrian, P.; Valášková, V. Degradation of Cellulose by Basidiomycetous Fungi. FEMS Microbiol. Rev. 2008, 32, 501–521. [Google Scholar] [CrossRef] [PubMed]
  55. De Miccolis Angelini, R.M.; Landi, L.; Raguseo, C.; Pollastro, S.; Faretra, F.; Romanazzi, G. Tracking of Diversity and Evolution in the Brown Rot Fungi Monilinia Fructicola, Monilinia Fructigena, and Monilinia Laxa. Front. Microbiol. 2022, 13, 680. [Google Scholar] [CrossRef]
  56. De Wit, P.J.G.M. Apoplastic fungal effectors in historic perspective; a personal view. New Phytol. 2016, 212, 805–813. [Google Scholar] [CrossRef]
  57. Tanaka, S.; Kahmann, R. Cell wall-associated effectors of plant-colonizing fungi. Mycologia 2021, 113, 247–260. [Google Scholar] [CrossRef]
  58. Marcet-Houben, M.; Villarino, M.; Vilanova, L.; De Cal, A.; van Kan, J.A.L.; Usall, J.; Gabaldón, T.; Torres, R. Comparative Genomics Used to Predict Virulence Factors and Metabolic Genes among Monilinia Species. J. Fungi 2021, 7, 464. [Google Scholar] [CrossRef]
  59. Medema, M.H.; Kottmann, R.; Yilmaz, P.; Cummings, M.; Biggins, J.B.; Blin, K.; de Bruijn, I.; Chooi, Y.H.; Claesen, J.; Coates, R.C.; et al. Minimum Information about a Biosynthetic Gene cluster. Nat. Chem. Biol. 2015, 11, 625–631. [Google Scholar] [CrossRef] [PubMed]
  60. Kautsar, S.A.; Blin, K.; Shaw, S.; Navarro-Muñoz, J.C.; Terlouw, B.R.; van der Hooft, J.J.J.; van Santen, J.A.; Tracanna, V.; Suarez Duran, H.G.; Pascal Andreu, V.; et al. MIBiG 2.0: A repository for biosynthetic gene clusters of known function. Nucleic Acids Res. 2020, 48, D454–D458. [Google Scholar] [CrossRef] [PubMed]
Figure 1. (a) Isolated colony of Monilinia fructicola isolate 160E growing on PDA media after seven days of inoculation; (b) Microscopic morphology of Monilinia fructicola isolate 160E, composed of ellipsoid conidia attached in branched chains, stained with lactophenol cotton blue (×40 microscope, bars represent 0.020 mm).
Agronomy 13 01493 g001
Figure 2. Maximum likelihood tree obtained using the partial ITS sequence alignment obtained with closely related Monilinia species reference sequences. The sequences obtained in this study are presented in red and bold. The scale bar indicates the expected number of substitutions per site and the bootstrap support values (>75% based on 1000 replicates) are also shown.
Agronomy 13 01493 g002
Figure 3. Koch’s postulates were applied to nectarine, peach, and sweet cherry, (ac) inoculated with PDA media, and (df) inoculated with Monilinia fructicola isolate 160E. Photos taken seven days after inoculation.
Agronomy 13 01493 g003
Figure 4. Genome completeness as evaluated with BUSCO.
Agronomy 13 01493 g004
Figure 5. Abundance of the main enzyme classes detected using the Omicsbox enzyme coding map tool.
Agronomy 13 01493 g005
Table 1. Characterization of sampled plant material and methods used to detect Monilinia fructicola (X).
RegionOrchardSampled TreePlant MaterialMorphologyPCR (ITS)RT-PCR
NorthA1flowers x
branch x
2branch x
3 x
4 x
5 x
6 x
7 x
8 x
9 x
10 x
11 x
12 x
B1flowers x
branch x
2branchxxx
3 x
4 x
5xxx
6 x
7 x
8xxx
C1branch x
2 x
D1branch x
E1branch x
2 x
F1branchxxx
G1branch x
H1branch x
2 x
I1branch x
2 x
3 x
J1branch x
2 x
3 x
4 x
K1branch x
SouthM1flowers x
branch x
2branch x
3branch x
N1flowers x
branch x
2branch x
Table 2. Monilinia fructicola detection according to plant material and detection method (X).
RegionOrchardSampled TreePlant MaterialMorphologyPCR (ITS)RT- PCR
NorthA6branch x
B1flowers x
branch x
2branchxxx
4branch x
5branchxxx
7branch x
8branchxxx
E1branch x
F2branchxxx
Table 3. Overall Flye assembly info obtained of Monilinia fructicola isolate 160E.
#Seq_NameLengthCov.Circ.Repeat
contig_264,277,93788NN
contig_243,718,28289NN
contig_283,587,34988NN
contig_83,247,61188NN
contig_22,689,95391NN
contig_302,601,70389NN
contig_72,592,40591NN
contig_92,581,11289NN
contig_212,547,89190NN
contig_142,388,94290NN
contig_112,329,96790NN
contig_292,262,38088NN
contig_132,234,92991NN
contig_252,104,28392NN
contig_201,976,94493NN
contig_51,931,52692NN
contig_17355,259130NN
contig_15352,833106NN
contig_27325,972129NN
contig_4262,987122NN
contig_31155,4632004YY
contig_3515,6271304YY
Table 4. Overall genome assembly metrics of Monilinia fructicola isolate 160E.
InfoValue
Total scaffold length44,541,355
Largest scaffold4,277,937
Scaffold N502,592,405
Scaffold L507
Initial number of reads1,003,591 reads
mean read_length4742.1
mean qual12.5
Reads >Q8100%
Reads >Q1090.0%
#N’s per 100 kbp0
#N’s0
Disclaimer/Publisher’s Note: The statements, opinions and data contained in all publications are solely those of the individual author(s) and contributor(s) and not of MDPI and/or the editor(s). MDPI and/or the editor(s) disclaim responsibility for any injury to people or property resulting from any ideas, methods, instructions or products referred to in the content.

