Article

WT-YOLOM: An Improved Target Detection Model Based on YOLOv4 for Endogenous Impurity in Walnuts

1
College of Mathematics and Computer Science, Zhejiang A & F University, Hangzhou 311300, China
2
Key Laboratory of Forestry Intelligent Monitoring and Information Technology of Zhejiang Province, Hangzhou 311300, China
3
Key Laboratory of State Forestry and Grassland Administration on Forestry Sensing Technology and Intelligent Equipment, Hangzhou 311300, China
4
College of Food and Health, Zhejiang A & F University, Hangzhou 311300, China
*
Authors to whom correspondence should be addressed.
Agronomy 2023, 13(6), 1462; https://doi.org/10.3390/agronomy13061462
Submission received: 26 April 2023 / Revised: 18 May 2023 / Accepted: 19 May 2023 / Published: 25 May 2023
(This article belongs to the Section Precision and Digital Agriculture)

Abstract

:
Since impurities produced during walnut processing can cause serious harm to human health, strict quality control must be carried out during production. However, most detection equipment still uses photoelectric detection technology to automatically sort heterochromatic particles, which is unsuitable for detecting endogenous foreign bodies with similar colors. Therefore, this paper proposes an improved YOLOv4 deep learning object detection algorithm, WT-YOLOM, for detecting endogenous impurities in walnuts—namely, oily kernels, black spot kernels, withered kernels, and ground nutshells. In the backbone of the model, a lightweight MobileNet module was used as the encoder for the extraction of features. The spatial pyramid pooling (SPP) structure was improved to spatial pyramid pooling—fast (SPPF), and the model size was further reduced. Loss function was replaced in this model with a more comprehensive SIoU loss. In addition, efficient channel attention (ECA) mechanisms were applied after the backbone feature map to improve the model’s recognition accuracy. This paper compares the recognition speed and accuracy of the WT-YOLOM algorithm with the Faster R-CNN, EfficientDet, CenterNet, and YOLOv4 algorithms. The results showed that the average precision of this model for different kinds of endogenous impurities in walnuts reached 94.4%. Compared with the original model, the size was reduced by 88.6%, and the recognition speed reached 60.1 FPS, which was an increase of 29.0%. The metrics of the WT-YOLOM model were significantly better than those of comparative models and can significantly improve the detection efficiency of endogenous foreign bodies in walnuts.

1. Introduction

Food quality and safety issues have attracted widespread attention in recent years. Sub-standard food poses the risk of causing illness, including immediate injury, an increased risk of chronic diseases, and so on [1,2]. As the primary factor in food safety, food foreign bodies account for two-thirds of all incident reports in fruits, vegetables, nuts, nut products, candies, bakery products, and other products [3]. To improve the situation, it is necessary to implement the automatic detection of exogenous and endogenous foreign bodies. Exogenous bodies include paper scraps, crushed particles, metals, insects, etc., which are introduced into the production line [4], while endogenous bodies are the unnecessary parts produced by the product itself during processing, such as peels and inedible kernels [5]. Belonging to the family Juglandaceae, walnuts, which mainly grow in the Tianmu Mountain area at the boundary of Zhejiang and Anhui in China, is an essential nut product. In addition to the traditional shelled fruit, the market share of retail food made with walnut kernels is also growing. A significant focus of research into the automation of walnut processing concerns the question of how to quickly and accurately detect and reject impurities.
In the past, the selection of agricultural products as food ingredients was undertaken by manual labor, such as with on-site inspection, sorting, and picking. However, relying on human vision for food screening is highly subjective and inefficient. With the development of the industrial revolution, some relatively mature impurity detection methods were proposed, such as the magnetic separation method, based on the materials’ different magnetic conductance, and the winnowing method, which takes advantage of the various aerodynamic characteristics of walnut shells and kernels [6]. In addition, there have been some successful cases of using traditional machine vision technologies for food inspection. Mollazade et al. [7] used four different data-mining-based techniques, including artificial neural networks (ANNs), support vector machines (SVMs), decision trees (DTs), and Bayesian networks (BNs), to classify raisins. However, traditional image techniques require the manual selection of optimal feature parameters to describe the different qualities of raisins and the choice of corresponding image recognition matching methods to complete the classification of raisins based on finite feature parameters. According to the scene surveyed, to screen the kernels, walnut factories mainly adopt an electro-optical color sorter, which takes advantage of traditional computer vision technology, and a winnowing device based on the winnowing method. The latter can achieve a high removal rate for the ground nutshells, while the former has a low recognition rate for endogenous foreign bodies in walnuts, such as black spot kernels, oily kernels, and withered kernels. These inseparable impurities have similar properties to normal kernels, and enterprises still need to invest significant manpower costs for manual screening.
Deep learning has recently become the mainstream technique in food foreign body detection research. Convolutional neural networks have gradually replaced the traditional manual feature extraction method due to their powerful high-dimensional feature extraction capability. Xie et al. [8] used Fast R-CNN models with three different backbone network models (Alexnet, VGG16 and VGG19) to detect residual bones in Atlantic salmon. The F1-score of the Faster-RCNN with the VGG16 model reached 0.87 and the AP reached 0.78. This algorithm has high detection accuracy and speeds. However, the three models are still prone to misdetection in practical industrial applications. The different qualities and lighting conditions of images and photos may cause difficulties in target detection. Thus, researchers believe that high-quality labeled samples are needed in industrial assembly lines. Chen et al. [9] proposed a visual detection system based on a DeepLabV3+ model to separate and segment impurities from wheat harvesting materials. The test results showed that as the backbone model, ResNet-50 exhibited the best performance in recognition and segmentation. Wang and Xiao [10] used three deep convolutional neural networks (DCNNs) to detect potato surface defects, with the RFCN ResNet101 model achieving an accuracy of 95.6% and performing better overall in terms of detection speed and accuracy. However, only two types of defective potatoes were included in the dataset of this study, and other defects were not considered. On the other hand, hyperspectral imaging (HSI) and multispectral imaging (MSI) technologies have made great strides in food detection. Saeidan et al. [11] investigated the feasibility of using hyperspectral imaging technology to detect and discriminate between four categories of foreign materials (wood, plastic, stone, and plant organs) that are relevant to the cocoa processing industry. The results showed that SVM could reach over 89.10% accuracy when classifying cocoa beans and foreign materials. Li et al. [12] studied the use of a multispectral imaging system to detect foreign matter in pickled and dried mustard, with a classification accuracy of 98.07% and an average prediction time of 0.04 s. In industrial applications, the maintenance and costs of special inspection equipment have become the main factors restricting its development.
Some scholars have conducted in-depth studies of exogenous impurities and the shells of walnuts. Rong et al. [13] proposed a two-stage convolutional networks to achieve the image segmentation and detection of impurities in walnuts images in real time. The proposed method could correctly segment 99.4% of the object regions in the test images and correctly classified 96.5% of the foreign objects in the validation images; it correctly detected 100.0% of the test images. In a separate study, walnut shell-breaking matter is processed using machine vision to accurately sort kernels, shells, and unseparated bodies with an overall recognition accuracy of 96% [14]. Overall, exogenous foreign bodies and ground nutshells are easily identifiable, since their superficial characteristics differ significantly from those of walnut kernels. At present, there are relatively few studies on defective walnut kernels. However, due to their potential to cause significant harm to human health, especially black-spotted kernels, research in this area is worth strengthening.
In summary, it is necessary to explore a simple and efficient method to detect endogenous impurities in walnuts. The traditional manual method can achieve very high accuracy even though it relies on human eyes to identify walnut materials, so we believe that it is feasible to identify cracked walnut materials with ordinary RGB images only. Deep learning technology has shown significant advantages in image processing. Modern target detection technology can automatically complete feature extraction and classification according to image contents and labels, which simulates human thinking to analyze images. At present, the typical target detection algorithms are the two-stage model represented by Faster R-CNN [15] and the single-stage model represented by YOLO [16]. Researchers should explore the balance between recognition speed and accuracy in industrial applications.
This research aims to analyze the performance of different target detection methods in detecting and classifying endogenous impurities in walnuts. The implementation of these models in edge devices can help factories to detect and intervene in real time, thus improving product quality and reducing economic losses. The main contributions of this study are as follows:
(1)
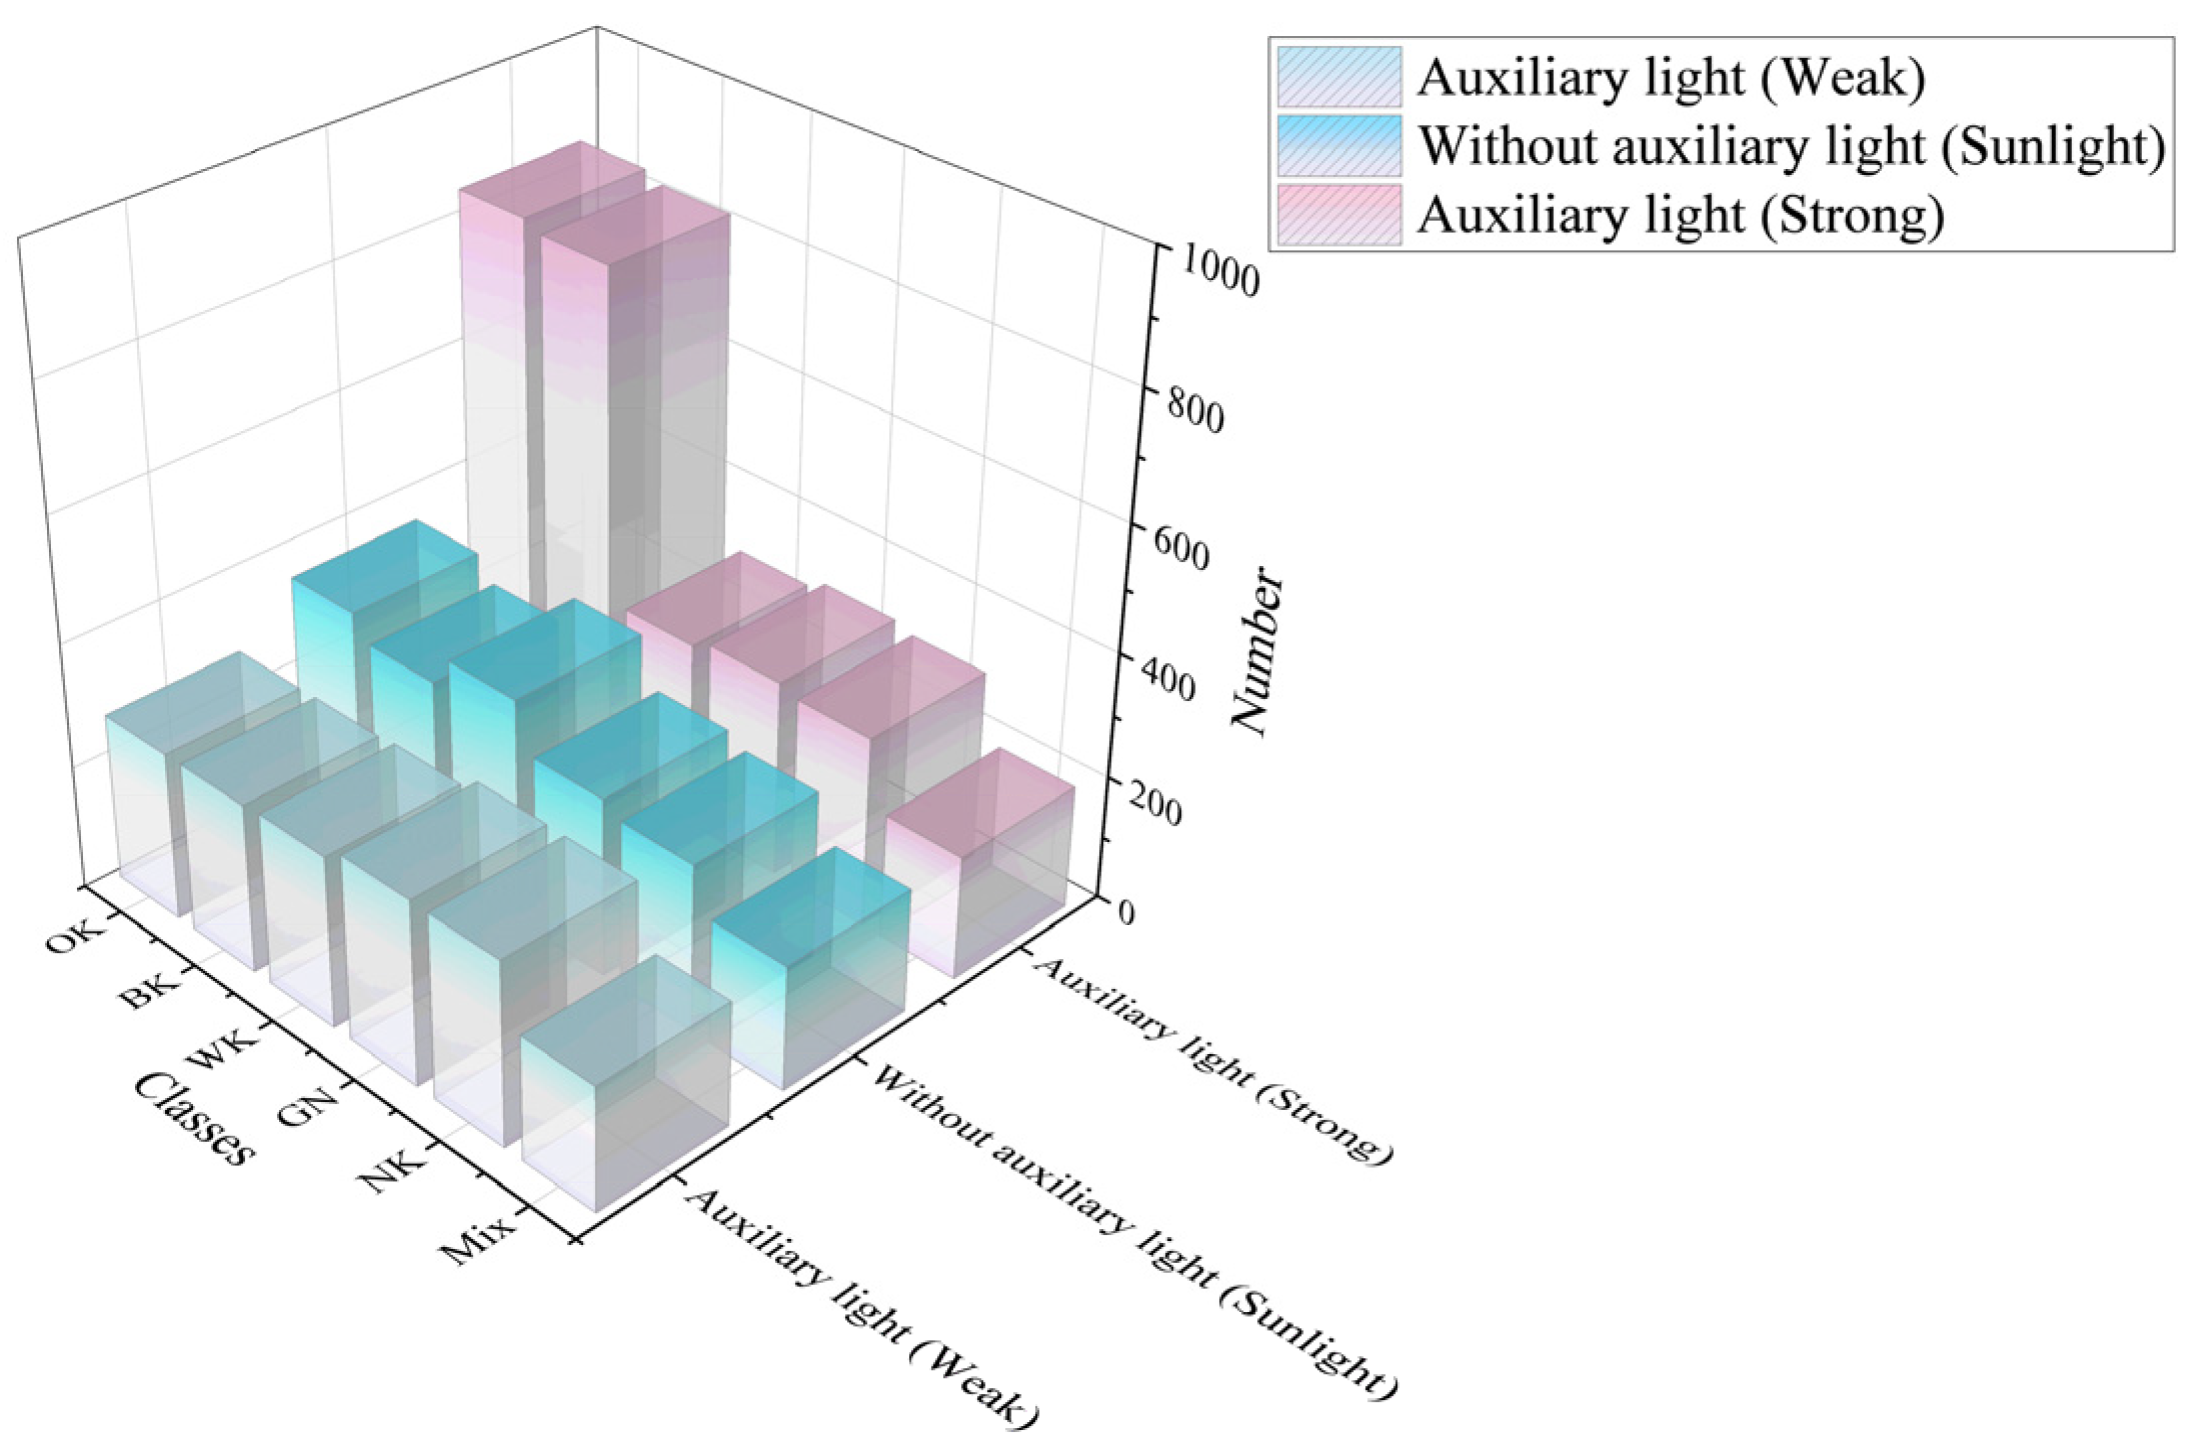
A dataset of walnut shell-breaking materials was constructed under different lighting conditions and angles. It contains five types of images: black spot kernels (BKs), withered kernels (WKs), oily kernels (OKs), ground nutshells (GNs), and normal kernels (NKs). It provides rich scene data to promote research into technology for the automatic processing of walnuts.
(2)
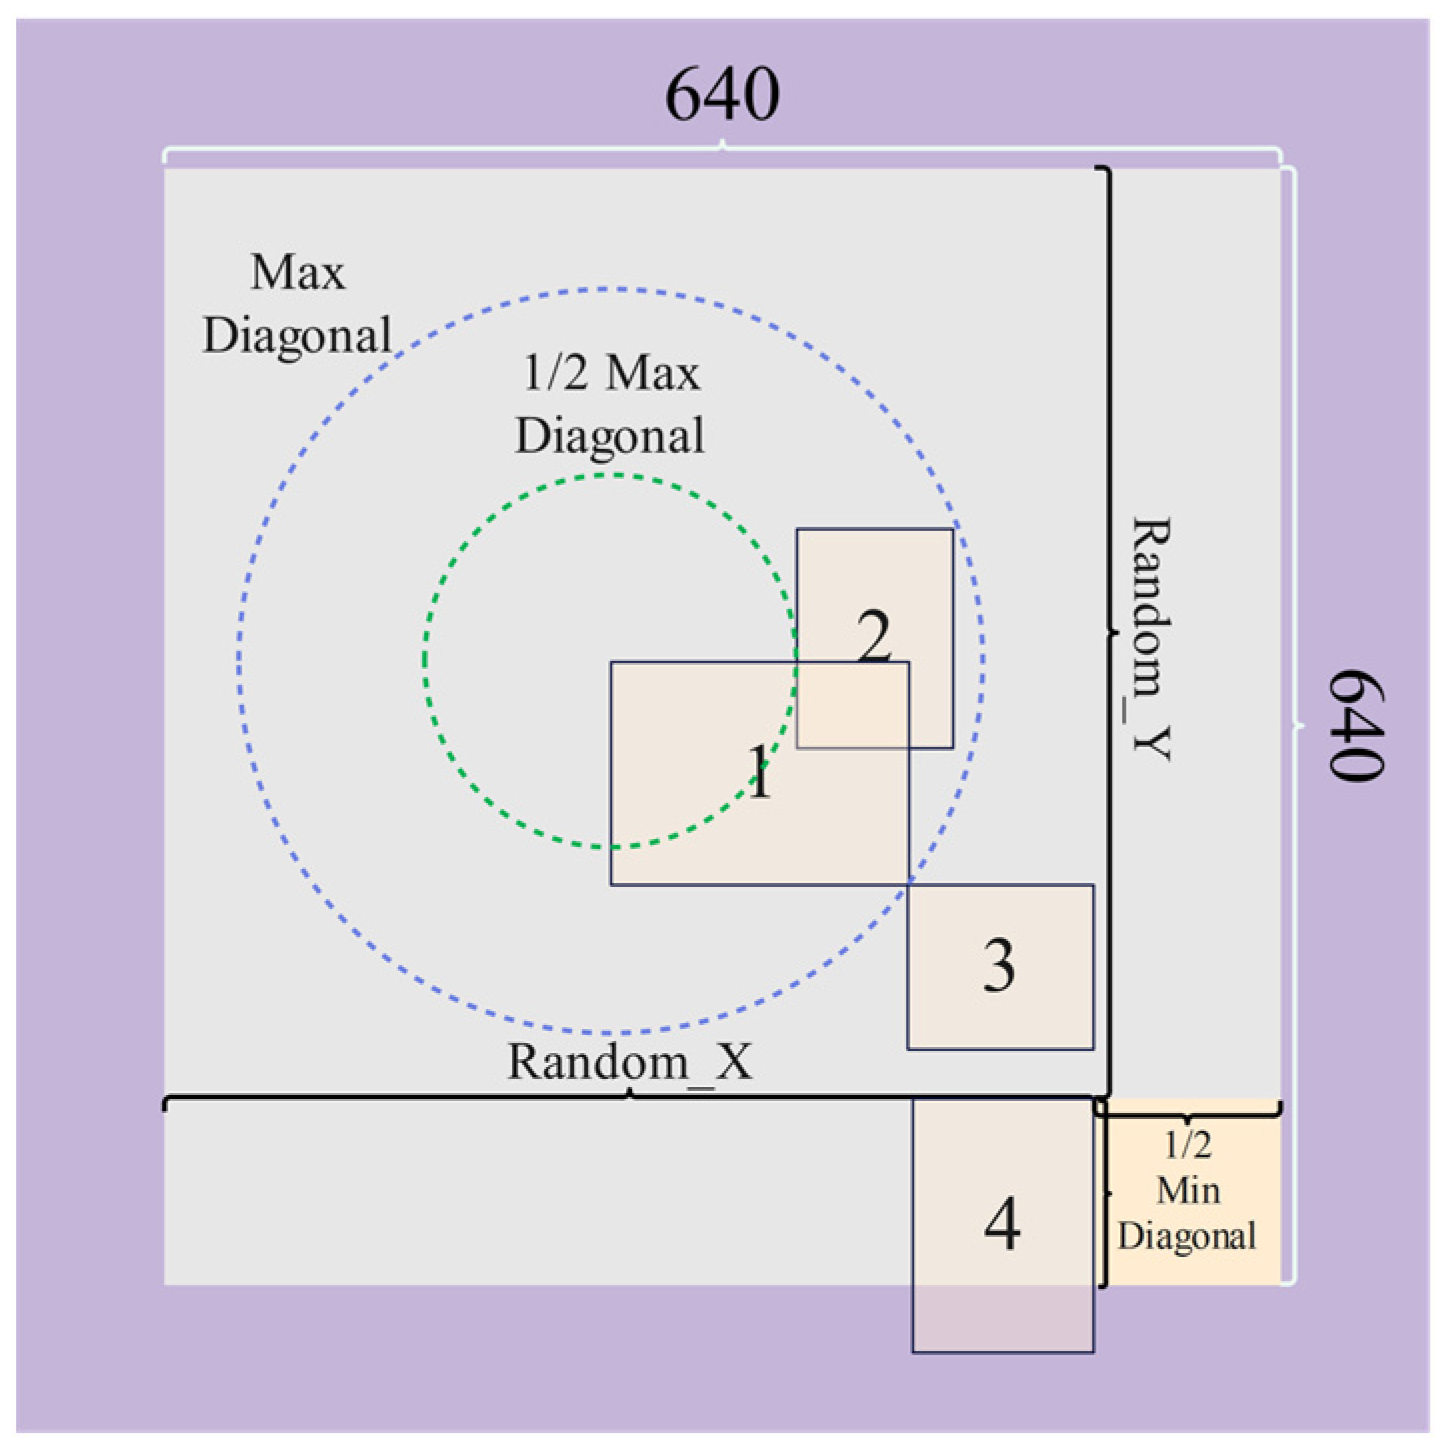
An offline data enhancement method was proposed to enrich the diversity of the datasets and reduce the workload of data collection.
(3)
A lightweight target detection method, WT-YOLOM, was proposed to detect endogenous foreign bodies. It achieves a balance between precision and speed.
The rest of this article is organized as follows. Section 2 details the collection and processing of the image data. Section 3 explains the main ideas of the WT-YOLOM method. In Section 4, we analyze the results of the experiment, and Section 5 contains the summary.

2. Experimental Data and Processing Methods

2.1. Image Acquisition and Annotation

The object of this research is Linan’s walnut, a specialty of Hangzhou, Zhejiang Province, China, which has been cultivated for consumption for more than 500 years, since the Ming Dynasty [17]. In this study, image data were collected in September 2022, the harvesting season of the local walnut. The selected walnuts were obtained randomly. A Canon EOS RP camera was used to capture images of walnut shell-breaking materials placed on a white background panel at multiple angles, 25–30 cm from the target. We designed semi-structured scenarios to enhance the variety of the datasets and ensure the trained models’ robustness. In addition to sunlight, the computer vision platform provides additional light sources for shooting, including two different auxiliary light sources (weak and strong light). After data cleaning, a total of 6203 images of multi-scene and multi-scale walnut shell-breaking materials were obtained with an image resolution of 4160 × 4160. This dataset was uniformly adjusted to 640 × 640 pixels for input into the model for training, and it was named the raw walnut datasets (RWD). Figure 1 shows the quantity of images, including the five categories of walnut shell-breaking materials photographed at different light intensities. “LabelImg”, the image annotation tool, was used for manual annotations in the original image data. For some endogenous impurities in walnuts, there are small black spots on the kernels instead of the whole kernel showing a black color, and all targets of this type were labeled as black spot kernels instead of withered kernels or oily kernels in our research. Figure 2 shows the images of the walnut shell-breaking materials and the corresponding labels.

2.2. Data Preprocessing

There should be multiple objects in one image in a multi-target detection task. However, there is little discrepancy between walnut shell-breaking materials, especially walnut kernels. If there are multiple targets in one image, it is difficult to distinguish the categories of shell-breaking materials in low quality photos using human vision alone due to the influence of external factors, such as illumination and aperture. For example, there is a high degree of similarity between the BKs and OKs under weak auxiliary light and sunlight in the picture in Figure 2; this may generate a significant number of incorrect labels during the labeling process. These noise disturbances will have some negative influence on the training of the model.
In this paper, we propose that, in target detection tasks for similar scenes, a single target can be captured and labeled with its own category, and then the original image and annotation file can be processed by the computer to generate an image with multiple targets. Such an intervention not only reduces the workload of dataset production but also enriches the diversity of the datasets. We designed an explosive enhancement dataset (EED) data-processing method to expand the original single target dataset to include ten different targets in one picture, generating a total of 1800 virtual mixture images. In order to prevent data leakage during model training, these virtual mixture images are only based on single target images of the training set. These virtual images were named the processed walnut datasets (PWD).
The data-processing process of the EED pattern is as follows:
① Select any ten images from the single target dataset, and paste the images onto a gray background of 640 × 640 pixels as a temporary image. ② Crop the bounding box (BBox) area in the temporary image. ③ In this step, 10 paste coordinate points are randomly generated on a 640 × 640 background image, and the spacing of these ten points is greater than 1/2 of the diagonal length of the largest BBox. In this way, each target can be isolated from the other, and there is a certain probability that the two targets will partially overlap, which is similar to the effect of data enhancement by CutMix [18]. ④ Paste each of the ten bounding box areas into the ten coordinate points and generate a new annotation file. ⑤ Save the image and the annotation file.
As shown in Figure 3, label 1 represents the largest BBox; label 2 represents the situation where there is partial overlap; and label 3 represents the situation where there is no overlap. If we want all targets to be free of overlap, we can let the distance be larger than the diagonal length of all the candidate bounding boxes, i.e., the diagonal length of the label 1 BBox. For the processing of the boundary part, we choose 1/2 of the diagonal length of the smallest BBox in each iteration as the constraints so as not to generate paste coordinate points too close to the background image boundary, so that most of the scope of a target will overflow the background image range. In Figure 3, label 4 represents the coordinates generated in the y-direction to reach the constraints, and it can be seen that the pasted BBox stays mainly within the 640 × 640 image range. Some of the processed data are shown in Figure 4.

3. Methodologies

3.1. The Algorithmic Principle of YOLOv4

The YOLO (you only look once) target detection model, which has the advantage of fast recognition, has been introduced in several series versions. This type of algorithm has been widely applied in studies of agriculture and forestry, such as animal behavior analysis [19], fruit detection [20], and plant disease detection [21]. The detection of endogenous impurities in walnuts belongs to the field of agricultural product quality control, and there are few studies on the application of target detection technology in this field. Bochkovskiy et al. [22] proposed an end-to-end detection algorithm, YOLOv4, which consists of three main parts: a backbone for extracting image features, a head for predicting target categories and target bounding boxes, and a neck added in between for fusing information from different feature layers [23]. In this study, the selected YOLOv4 model has a small size, which is in line with our expectation of real-time detection targets.
The YOLOv4 model improves the Resblock-body structure in YOLOv3 [24], and the cross-stage partial connections (CSP) [25] approach is applied to the backbone network. It should be noted that the YOLOv4 algorithm adds an improved spatial pyramid pooling module between the backbone network and the neck to enhance the receptive field, and it uses the path aggregation network (PANet) [22] as the neck to fuse the feature layer. It is suitable for the detection of targets of different sizes. For the loss function, some researchers proposed IoU loss, which considers the coverage of the predicted BBox area and the ground truth BBox area [22]. YOLOv4 uses CIoU loss [26] to consider the Euclidean distance between the predicted BBox and ground truth BBox, the overlap rate, and the aspect ratio factor, which can achieve faster convergence and better regression results. CIoU is defined as follows:
R CIoU = l 2 m 2 + s 2 1 IoU + s
s = 4 π 2 ( arctan w g t h g t arctan w h ) 2
where l is the Euclidean distance between the center points of the predicted BBox and the ground truth BBox, m is the diagonal length of the smallest enclosing box covering the predicted BBox and ground truth BBox, and s measures the consistency of the aspect ratio between the two bounding boxes; w, h represent the width and height of the predicted BBox, respectively, wgt, hgt represent the width and height of the ground truth BBox, respectively; and IoU is the ratio of the area overlap and the area of union. Then, the loss function is defined as follows:
L CIoU = 1 IoU + R CIoU

3.2. Improvement Based on YOLOv4

In the task of automatically identifying endogenous impurities in walnuts, the selection of a lightweight backbone network helps to improve the recognition speed of the model. Therefore, the WT-YOLOM model is applied to the detection of walnut shell-breaking materials in this study. The structure of the YOLOv4 model is adjusted in the backbone and neck parts of the network. The YOLOv4 model was optimized using deep separable convolution, reducing the number of parameters and its computational consumption. We removed the original SPP module and its three convolution operations before and after, while adding three additional attention modules between the backbone and neck. Compared with the original structure, the SPPF module is used to enhance the receptive field of the feature layer and further reduce the size of the model. The network structure of the proposed WT-YOLOM walnut impurity detection model is shown in Figure 5.

3.2.1. Removal and Detection of Endogenous Walnut Impurities Based on K-Means

The size of the image target in the public dataset is more abundant, and the size of the targets is relatively apparent. In contrast, the target dimension in the self-built dataset is almost universal. The size of the target in the image is negatively correlated with the shooting distance with a constant focal length. In this study, the endogenous walnut impurities and normal kernels are primarily medium and small. The difference in the sizes of individual walnut shell-breaking materials is not apparent, unlike the initial predetermined bounding box size. Therefore, it is necessary to use the K-means algorithm [27] to regain the anchor box size for the BOGWN dataset. K-means clustering is used to obtain the anchor box size: the 1-IoU value between the predetermined and the ground truth bounding boxes is continuously calculated to achieve the clustering result. The updated anchor box sizes are shown in Table 1.

3.2.2. MobileNetV3 as the Backbone Network

YOLOv4′s original backbone network, CSPDarknet53, has strong feature extraction capabilities, but the model’s vast size and complicated structure also lead to unnecessary inference times. Selecting a more efficient feature extraction network in the task of detecting, can significantly improve the detection speed. MobileNetV3 [28], proposed by Google, is a lightweight neural network model for mobile devices. It adequately combines the advantages of depthwise separable convolution of MobileNetV1 [29] and the linear bottleneck and inverted residual structure of MobileNetV2 [30], and introduces a lightweight attention model for adjusting channel weights. MobileNetV3′s activation function, H-swish, is more suitable for the computational power of mobile devices. The mathematical equation for h-swish is defined as follows:
H swish x = x ReLU 6 x + 3 6
Compared with traditional convolution, depthwise separable convolution has considerable advantages in terms of the number of parameters, leading to faster model inference or the deeper stacking of the network layers. Supposing that the input feature layer size is R × R, input channel = M, output channel = N, kernel size = K, stride = 1, and appropriate padding, a comparison of the number of parameters and the amount of computational between depthwise separable convolution and traditional convolution is illustrated in Table 2.
In our work, the backbone network CSPDarkNet53 is replaced by MobileNetV3, and the image input size is 416 × 416. After a series of feature extraction processes, the sizes of the three selected output layers are 52 × 52, 26 × 26, and 13 × 13.

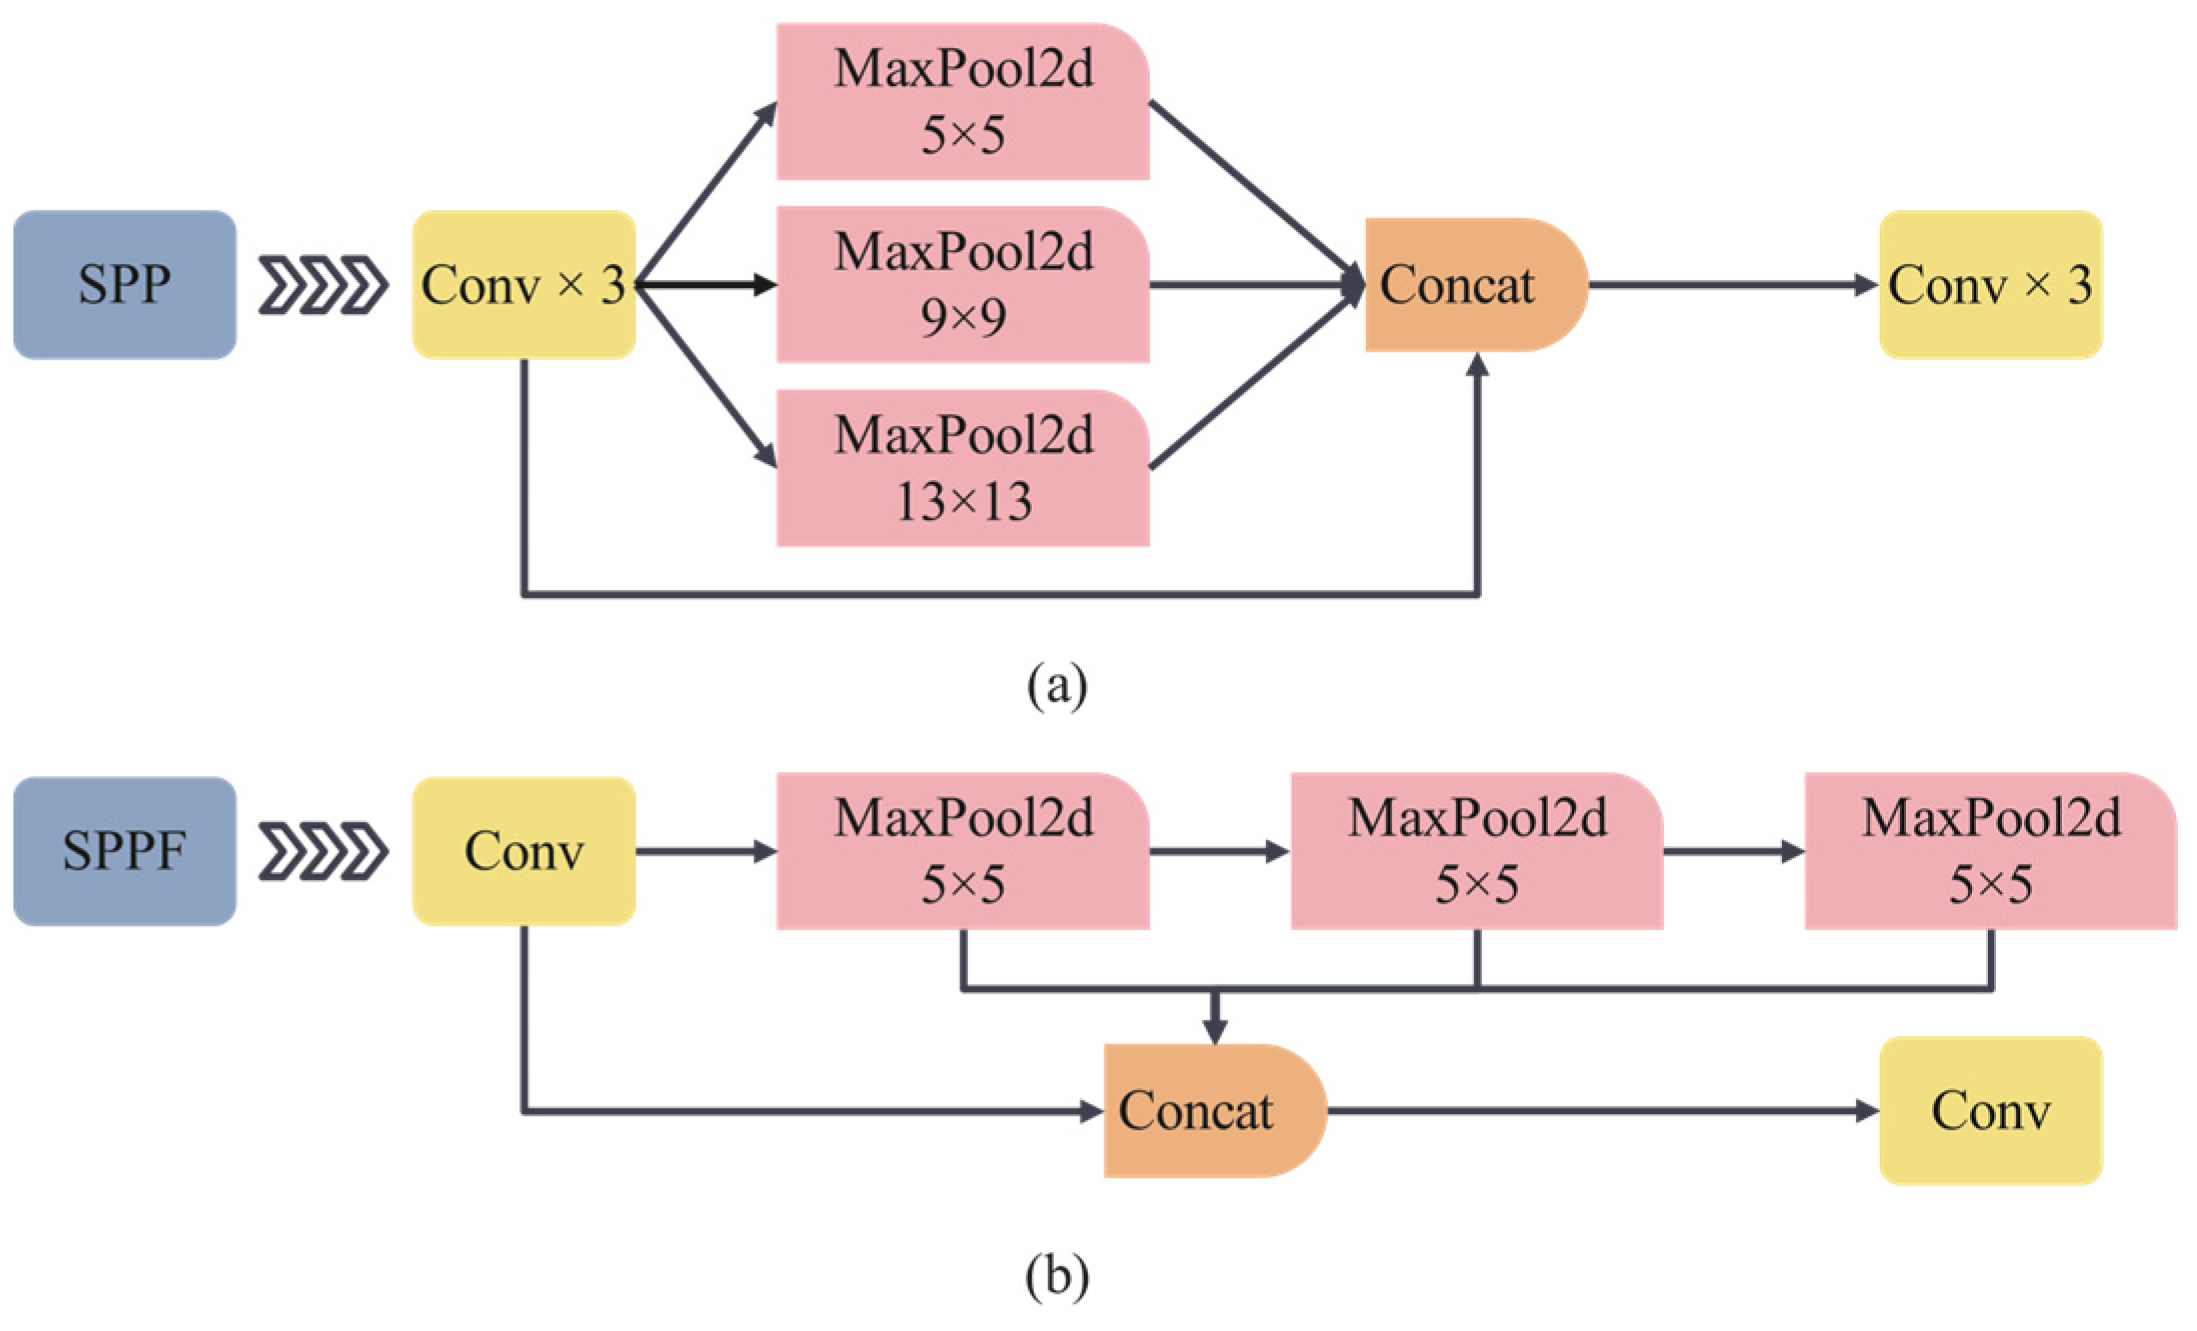
3.2.3. Importing the Spatial Pyramid Pooling—Fast Model and Improving the Neck Structure

The SPP module in YOLOv4 borrows the concept of SPP [31]. First, Conv is a basic convolution unit, which sequentially performs convolution, regularization, and activation operations on the input [32]. It is stacked three times to extract features from the input feature map as the input layer. Then, three maxpooling kernels of different scales are parallelized. Finally, three pooling branches are concatenated with the input layer, and three Convs are performed as an output. The SPPF [33] is an optimization of the SPP structure, and its goal is to speed up the inference of the module. After SPPF performs one Conv on the input feature map, unlike the side-by-side structure of SPP, SPPF uses three maxpooling kernels with parameter 5 in a series for pooling. The structure reduces the number of model parameters to some extent. Figure 6 shows the SPP module and the improved SPPF structure.
Considering that the highest feature layer of MobileNetV3 has only 160 output channels, we modified the SPPF model’s hidden layer. The original number of channels was reduced to half the input channels; now, it was modified to expand to twice the number of input channels. Finally, the number of output channels at the end of this structure is 512 after Conv operation. We did not make significant adjustments to the neck of the model. Some of the traditional convolutions in PANet are replaced by depthwise separable convolutions, and details are shown in Figure 5.

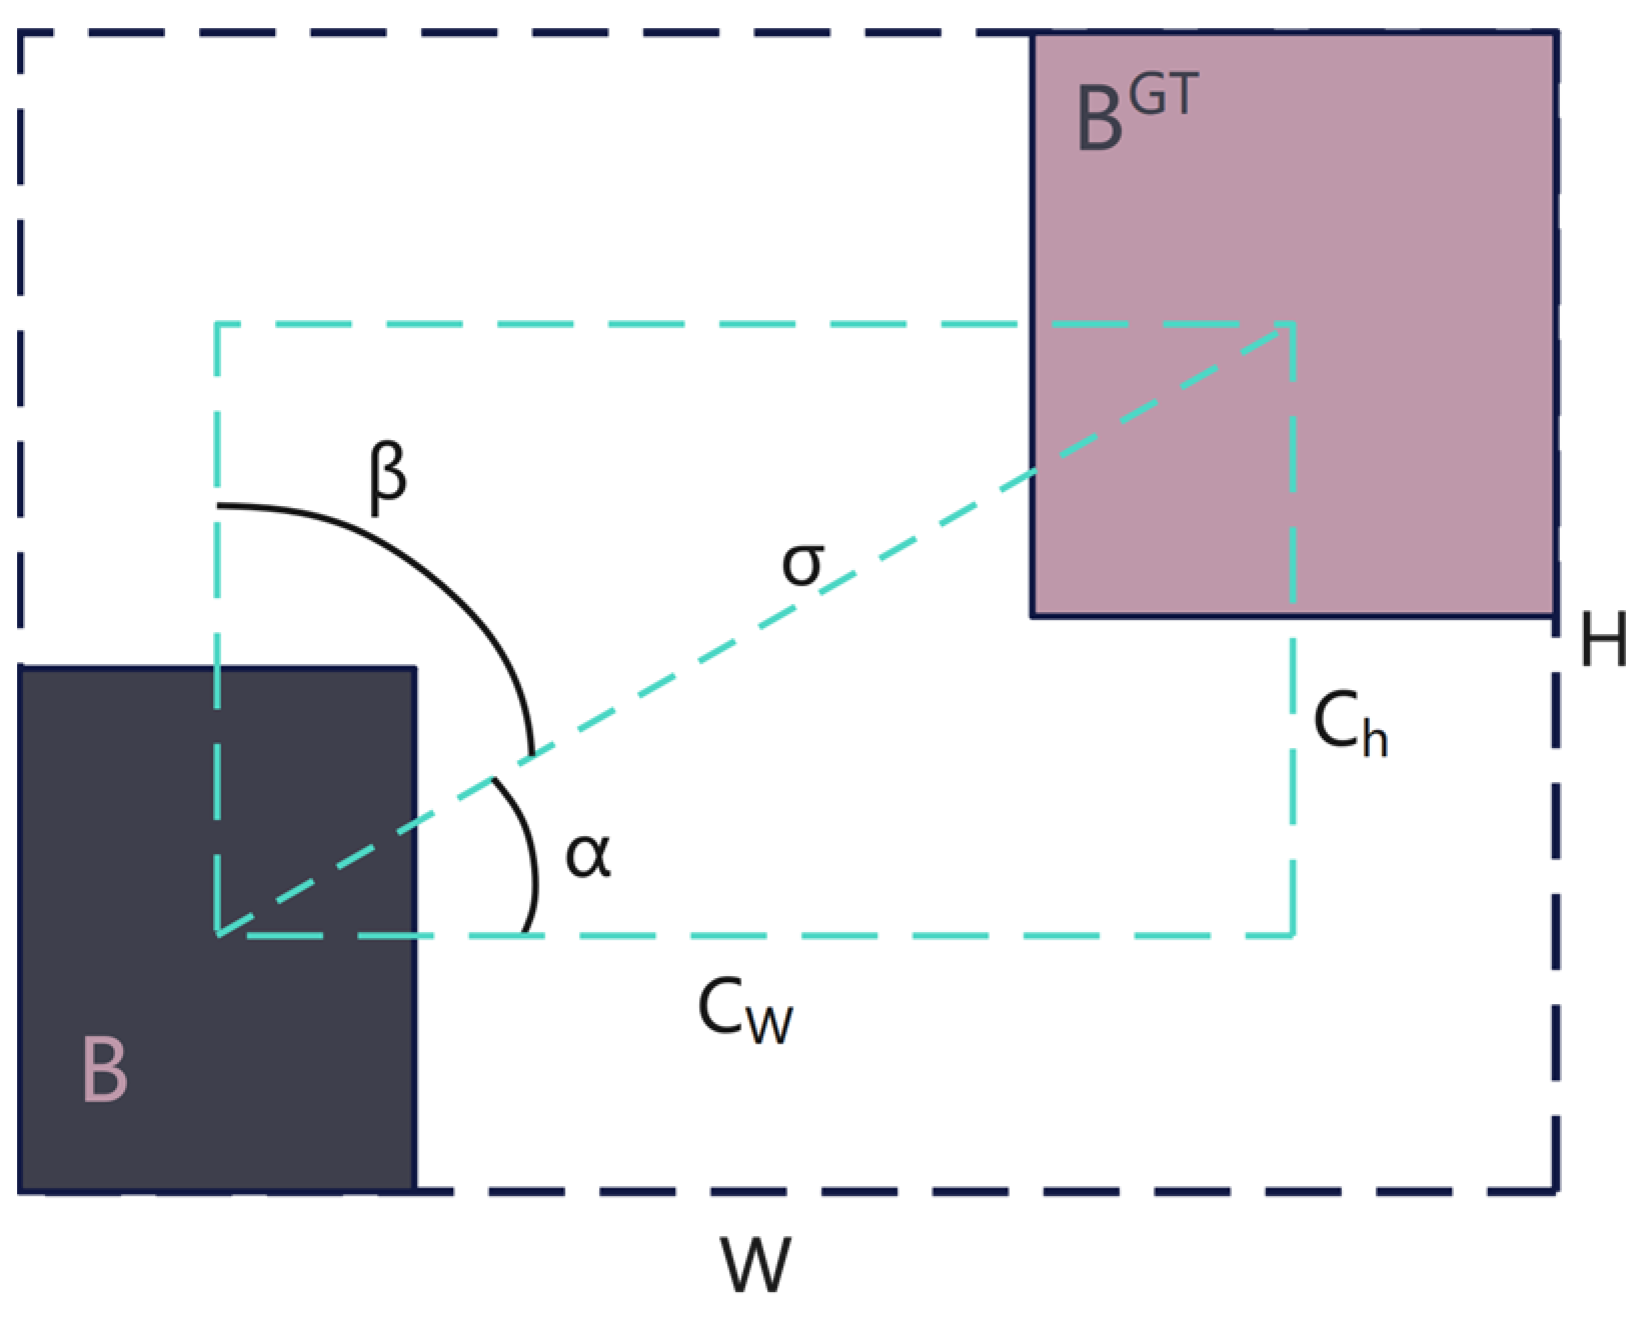
3.2.4. Loss Analysis and Improvement

In the task of image classification, the quality of the model is measured by calculating the ratio of the correct number of samples to the total number of samples. Meanwhile, in the target detection tasks, it is necessary to determine not only the target class but also the target’s position in the image, so the concept of bounding box position regression was introduced. IoU can be used to compare the degree of overlap between the predicted BBox and the ground truth BBox and to further consider whether the predicted BBox position needs to be adjusted. However, when there is no overlap between two bounding boxes, the IoU is 0 and cannot perform gradient backpropagation, thus causing the model to be unable to continue training. Therefore, IoU is only used as a part of the loss function, while the complete loss function consists of three parts: location loss, confidence loss, and category loss [34]. The CIoU loss is the loss function in YOLOv4, which considers the center distance and the aspect ratio of the ground truth BBox and the predicted BBox [35] but ignores the angle factor between the two boxes. Although CIoU calculates faster and has lower costs than SIoU, in this study, impurity detection accuracy is a more important indicator than the model’s training speed. A lower impurity content in walnut products helps to reduce the risk of enterprise losses and the costs of manual screening. The improved WT-YOLOM location loss for the above problem adopts SIoU loss. SIoU [36] increases the angle as the influence factor of two boxes, making the model achieve faster convergence where the SIoU loss function consists of four cost functions: the angle cost, distance cost, shape cost, and IoU cost. Figure 7 shows the scheme for calculating SIoU loss.
The loss function component was introduced and defined as follows:
Λ = 1 2 × sin 2 arcsin x π 4
x = c h σ = sin α
σ = ( b c x g t b c x ) 2 + ( b c y g t b c y ) 2
c h = max ( b c y g t , b c y ) min ( b c y g t , b c y )
where b c x g t ,   b c y g t are the center coordinates of the ground truth BBox, and b c x ,   b c y are the center coordinates of the predicted BBox. σ is the distance of the center point between the ground truth box and the prediction box. This process of convergence will first try to minimize α if α π 4 ; otherwise, it will minimize β = π 2 α .
The angle cost is used for the distance cost calculation of two bounding boxes, and the distance cost is defined as follows:
Δ = t = x , y 1 e γ ρ t = 2 e γ ρ x e γ ρ y
ρ x = ( b c x g t b c x W ) 2 , ρ y = ( b c y g t b c y H ) 2 , γ = 2 Λ
where W and H are the width and height of the smallest enclosing box covering the predicted BBox and ground truth BBox, respectively.
The shape cost is defined as follows:
Ω = t = w , h ( 1 e ω t ) θ = ( 1 e ω w ) θ + ( 1 e ω h ) θ
ω w = w w g t max ( w , w g t ) , ω h = h h g t max ( h , h g t )
where w, h, wgt, hgt represent the width and height of the predicted BBox and ground truth BBox, respectively. θ controls how much attention should be paid to the cost of the shape, while the value of θ is 4 in this paper.
Finally, the loss function is defined as follows:
L = 1 IoU + Δ + Ω 2
IoU = B B G T B B G T

3.2.5. Analysis of Feature Fusion and Improvement of the Attention Mechanism

After the above improvements were made, the model achieved excellent detection results for the walnut endogenous impurities datasets. The MobileNetV3 of the model is used as the backbone network, and the squeeze-and-excitation network (SE) module is fully integrated. Because the information extracted from the backbone network contains both valid feature information and invalid redundant features, the feature layer needs to conduct further processing before inputting PANet. The feature fusion process cannot effectively reduce the impact of redundant information on the model’s detection ability, while the attention mechanism can assign greater weight to important features and reduce the weight of redundant information, thereby reducing the impact of redundant features [37,38].
Attention mechanisms can, generally speaking, be divided into channel-wise attention, pointwise attention, and a combination of the two. The SE attention mechanism acquires the importance of each channel of the feature map through automatic learning. The importance index assigns a weight value to each channel so the neural network can focus on channels of interest. Efficient channel attention (ECA) [39] is a variant of channel-wise attention. It considers that the mapping information of all channels is unnecessary; therefore, 1DCNN is used to replace the fully connected layers (FC). This design benefits from the ability of the convolution operation to effectively extract information across channels. The specific implementation of ECA is shown in Figure 8. The convolutional block attention module (CBAM) [40] emphasizes the importance of both spatial and channel dimensions. Additionally, it proves that the simultaneous application of global average pooling and global max pooling is a more powerful means of extracting features. Coordinate attention (CA) [41] takes into account not only the spatial information and importance of channels, but also long-range dependencies.
In this study, three different attention mechanisms are used to replace the SE model in MobileNetV3. In order to solve the problem of information redundancy in deep network transmission, it is necessary to further focus the model on the areas of interest before inputting the three feature layers into the PANet network. Therefore, additional attention modules are added after the three output feature layers of the backbone network. They are used to enhance the extraction of key information from the feature layers at different depths, enabling PANet to better achieve feature fusion.

4. Experimental Design and Analysis of Results

4.1. Experimental Environment and Parameter Setting

In this study, all of the algorithms discussed are run on the same device, and the hardware and software configurations in the experiments are shown in Table 3. To provide different auxiliary light environments, computer vision motion platforms are applied; Canon EOS RP is used as the sensor with a focal length of 105 mm. The model’s hyperparameter configuration includes: an Adam optimizer, a step learning rate decreasing strategy, an initial learning rate that is set to 1 × 10⁻³ and gradually reduced to 1 × 10⁻⁵ during iteration, 100 epochs all together, and the batch size is 16.

4.2. Experimental Datasets

In the RWD, 80% are training sets, 10% are validation sets, and 10% are test sets. Then, the PWD are added to the training sets. In this way, we obtain the final walnut shell-breaking materials image dataset, named BOGWN. All algorithms were evaluated on the collected BOGWN, which includes five kinds of common walnut shell-breaking materials.

4.3. Evaluation Metrics

To verify the performance of the models in detecting endogenous impurities in walnuts, metrics including the mean average precision (mAP@0.5 and mAP@0.5: 0.95), parameters, model size, floating point operations (FLOPs), frames per second (FPS), precision, recall rate, and F1-score were used for evaluation. The mAP and FPS represent the evaluation index for walnut shell-breaking material detection accuracy and the real-time processing speed of the model, respectively; the higher the value, the better the detection. The precision, recall rate, and mAP are calculated as follows:
P = T P T P + F P
R = T P T P + F N
A P = 0 1 P R d R
mAP = 1 n i = 1 n A P i
where TP, FP, and FN are the numbers of true positive cases, false positive cases, and false negative cases, respectively [42]; n represents the types of walnut shell-breaking materials, and n = 5 in this study.

4.4. Results and Analysis

4.4.1. Benchmark Model Performance Comparison

Our key aim is to study the balance between the lightweight improvement of the model and the higher detection accuracy of the model, and to determine the optimal model. We proposed an improved YOLOv4 model by replacing the CSPDarknet53 backbone with MobileNetV3. The improved model was tested against classical target detection models, including the original model YOLOv4, EfficientDet-D0 [43], Faster R-CNN [44], and CenterNet [45]. On the validation sets, the loss values of the five models converge and the model can be considered successfully trained. The model weights with the lowest loss values were used for the test sets.
Considering all indicators, the YOLOv4-MobileNetV3 model outperforms the other four models, as CenterNet shows poor accuracy, the Faster R-CNN and YOLOv4 models are too large to be deployed on Edge device, and the detection speed of EfficientDet-D0 is quite slow at only 27.9 FPS. Compared with YOLOv4, the improved YOLOv4-MobileNetV3 exhibits a certain degree of decline in mAP, but the size of the model is reduced to 17% of the original size. In addition, the detection speed of the model reaches 57.0 FPS. Compared with the other models, it has obvious advantages in terms of its lightweight nature, complexity and speed, and real-time detection effect, and it is more suitable for mobile terminal deployment. The experimental results are shown in Table 4.
Table 5 shows the evaluation results of the YOLOv4-MobileNetV3 compared with the other common models in terms of the F1-score, recall rate, and precision for the five categories. The CenterNet model performed poorly in all metrics. Although it is a lightweight model, the three metrics of EfficientDet-D0 are significantly lower than those of YOLOv4, Faster R-CNN, and YOLOv4-MobileNetV3. In most metrics, YOLOv4 outperformed Faster R-CNN, showing advantages in different types of detection results. For the YOLOv4-MobileNetV3 model, the recognition accuracy is reduced due to the replacement of the backbone network, so further improvements should be considered. Therefore, the YOLOv4-MobileNetV3 model with a small number of parameters was chosen as the baseline model for the follow-up study.

4.4.2. Ablation Study

In order to explore the effectiveness of the SPPF module, SIoU loss, and K-means clustering algorithm for improving the model’s performance, ablation experiments are conducted on the BOGWN dataset. Three amendments are gradually applied to the YOLOv4-MobileNetV3, and the experimental hyperparameter settings and training environment are the same as above. Figure 9 shows the loss curves of the model training process on the validation sets. The figure shows that all model loss curves converge after 60 epochs, and the model training can be considered finished.
The results shown in Table 6 clearly show that applying either SPPF, SIoU, or K-means alone causes an inevitable increase in mAP@0.5. In contrast, the simultaneous application of SPPF and SIoU further improves mAP, indicating that the two components should have some complementarity. Comparing Model ⑧ with Model ⑤, although SPPF exerts a negative impact on the recognition accuracy of the model, the application of the module further reduces the size by 22% compared to the baseline model, and the recognition speed exhibits a specific improvement. In comparison, the decline in the recognition accuracy can be ignored. In the ablation experiment, all the models using K-means clustering showed a significant improvement in recognition accuracy. Finally, the WT-YOLO model (⑧) reached 94.1% mAP@0.5 on the BOGWN dataset.

4.4.3. Comparison of the Added Attention Models’ Performance

In Table 7, we further analyze the effect of four different attention mechanisms on Model ⑧ above. Judging from the numbers in Table 7, the ECA method can achieve better performance. The CBAM and CA models necessitate additional calculations and reduce the inference speed of the models; therefore, they are not applicable to this study. The WT-YOLO model with an added ECA mechanism is used as the final algorithm, and it is referred to as WT-YOLOM.

4.4.4. Visualization and Discussion

Figure 10 shows the detection results of our model and the common models. Comparing each model, we find that the overall detection effect of CenterNet is poor, with significant numbers of detection errors. On the other hand, YOLOv4, Faster R-CNN, and EfficientDet-D0 present only some detection errors, while the WT-YOLOM model’s overall performance is better, accurately identifying all the targets in the images. In addition to improving the accuracy rate by advancing the model, we believe that the detailed recognition of small black-spotted kernels, withered kernels, and oily kernels may also depend on the image’s sharpness. In practice, pictures with less light noise and sufficient auxiliary light sources enable the model to accurately identify walnut kernels.
The results shown in Figure 11 prove comprehensively that the proposed method has the best speed-accuracy trade-off. Our model can be conceptualized as a pentagonal warrior.

5. Conclusions

The common models all showed different degrees of misdetection when used to identify endogenous impurities in walnuts, while our proposed model, WT-YOLOM, correctly solves this problem. In this model, the original backbone network is replaced with the MobileNetV3 model; this is followed by depthwise separable convolution popularizing at the neck layer, thus achieving the purpose of reducing the model size. The addition of the ECA module between the backbone network and the neck network, together with the replacement of the attention module in the backbone, further reduces model’s size and improves its recognition accuracy. In addition, the SPPF structure is employed to enrich the output layer features in the backbone. Additionally, SIoU loss and the K-means algorithm were explored as means of improving the precision of the model. The improved WT-YOLOM model is more robust, with a smaller size and lower computational complexity, and it achieves higher detection efficiency without reducing the recognition rate.
On the other hand, for single target objects in the original dataset, we designed an EED data enhancement method to expand the target objects in the dataset. This approach reduces the effort required for data acquisition, and the negative effects of large amounts of incorrect data labeling on model training are reduced. Under different lighting conditions, the results show that the proposed algorithm can effectively extract features and detect endogenous impurities in walnuts with high accuracy and speeds, with a mAP@0.5 of 94.4% and an FPS of 60.1. The model size is only 27.8 MB.
The fast and accurate detection of walnut impurities can reduce the economic losses caused by food safety incidents, improve the quality of processed foods, and promote the sustainable development of the walnut industry. In future, the dataset will be expanded with a wider range of lighting conditions and backgrounds, and an existing algorithm will be applied to edge equipment to achieve a range of technological improvements for quality control in the walnut processing and production chain.

Author Contributions

Conceptualization, D.W., D.D. and J.Z.; Data curation, D.D.; Formal analysis, D.W. and J.Z.; Funding acquisition, D.D. and X.Z.; Investigation, D.W., D.D., L.L. and H.K.; Methodology, D.W., L.L. and H.K.; Project administration, D.D.; Resources, D.D.; Software, D.W. and L.L.; Supervision, D.D., J.Z. and X.Z.; Validation, D.W.; Writing—original draft, D.W.; Writing—review and editing, D.W. and D.D. All authors have read and agreed to the published version of the manuscript.

Funding

This research was supported by the National Natural Science Foundation of China (Grant No. 42001354), Zhejiang University Student Science and Technology Innovation Activity Plan (New Seedling talent Plan subsidy project; Detection of Impurity in Walnuts Based on Deep Learning).

Institutional Review Board Statement

Not applicable.

Informed Consent Statement

Not applicable.

Data Availability Statement

Not applicable.

Conflicts of Interest

The authors declare no conflict of interest.

References

  1. Chan, M. Food safety must accompany food and nutrition security. Lancet 2014, 384, 1910–1911. [Google Scholar] [CrossRef] [PubMed]
  2. Unnevehr, L. Food safety in developing countries: Moving beyond exports. Glob. Food Secur.-Agric. Policy Econ. Environ. 2015, 4, 24–29. [Google Scholar] [CrossRef]
  3. Djekic, I.; Jankovic, D.; Rajkovic, A. Analysis of foreign bodies present in European food using data from Rapid Alert System for Food and Feed (RASFF). Food Control 2017, 79, 143–149. [Google Scholar] [CrossRef]
  4. Yin, J.F.; Hameed, S.; Xie, L.J.; Ying, Y.B. Non-destructive detection of foreign contaminants in toast bread with near infrared spectroscopy and computer vision techniques. J. Food Meas. Charact. 2021, 15, 189–198. [Google Scholar] [CrossRef]
  5. Wang, Q.; Hameed, S.; Xie, L.J.; Ying, Y.B. Non-destructive quality control detection of endogenous contaminations in walnuts using terahertz spectroscopic imaging. J. Food Meas. Charact. 2020, 14, 2453–2460. [Google Scholar] [CrossRef]
  6. Liu, M.Z.; Li, C.H.; Cao, C.M.; Wang, L.Q.; Li, X.P.; Che, J.; Yang, H.M.; Zhang, X.W.; Zhao, H.Y.; He, G.Z.; et al. Walnut Fruit Processing Equipment: Academic Insights and Perspectives. Food Eng. Rev. 2021, 13, 822–857. [Google Scholar] [CrossRef]
  7. Mollazade, K.; Omid, M.; Arefi, A. Comparing data mining classifiers for grading raisins based on visual features. Comput. Electron. Agric. 2012, 84, 124–131. [Google Scholar] [CrossRef]
  8. Xie, T.H.; Li, X.X.; Zhang, X.S.; Hu, J.Y.; Fang, Y. Detection of Atlantic salmon bone residues using machine vision technology. Food Control 2021, 123, 107787. [Google Scholar] [CrossRef]
  9. Chen, M.; Jin, C.Q.; Ni, Y.L.; Xu, J.S.; Yang, T.X. Online Detection System for Wheat Machine Harvesting Impurity Rate Based on DeepLabV3+. Sensors 2022, 22, 7627. [Google Scholar] [CrossRef]
  10. Wang, C.L.; Xiao, Z.F. Potato Surface Defect Detection Based on Deep Transfer Learning. Agriculture 2021, 11, 863. [Google Scholar] [CrossRef]
  11. Saeidan, A.; Khojastehpour, M.; Golzarian, M.R.; Mooenfard, M.; Khan, H.A. Detection of foreign materials in cocoa beans by hyperspectral imaging technology. Food Control 2021, 129, 108242. [Google Scholar] [CrossRef]
  12. Li, M.Z.; Huang, M.; Zhu, Q.B.; Zhang, M.; Guo, Y.; Qin, J.W. Pickled and dried mustard foreign matter detection using multispectral imaging system based on single shot method. J. Food Eng. 2020, 285, 110106. [Google Scholar] [CrossRef]
  13. Rong, D.; Wang, H.Y.; Xie, L.J.; Ying, Y.B.; Zhang, Y.S. Impurity detection of juglans using deep learning and machine vision. Comput. Electron. Agric. 2020, 178, 105764. [Google Scholar] [CrossRef]
  14. Wu, Z.M.; Luo, K.; Cao, C.M.; Liu, G.Z.; Wang, E.R.; Li, W.B. Fast location and classification of small targets using region segmentation and a convolutional neural network. Comput. Electron. Agric. 2020, 169, 105207. [Google Scholar] [CrossRef]
  15. Li, Z.B.; Li, Y.; Yang, Y.B.; Guo, R.H.; Yang, J.Q.; Yue, J.; Wang, Y.Z. A high-precision detection method of hydroponic lettuce seedlings status based on improved Faster RCNN. Comput. Electron. Agric. 2021, 182, 106054. [Google Scholar] [CrossRef]
  16. Wang, Q.F.; Cheng, M.; Huang, S.; Cai, Z.J.; Zhang, J.L.; Yuan, H.B. A deep learning approach incorporating YOLO v5 and attention mechanisms for field real-time detection of the invasive weed Solanum rostratum Dunal seedlings. Comput. Electron. Agric. 2022, 199, 107194. [Google Scholar] [CrossRef]
  17. Huang, Y.J.; Xiao, L.H.; Zhang, Z.R.; Zhang, R.; Wang, Z.J.; Huang, C.Y.; Huang, R.; Luan, Y.M.; Fan, T.Q.; Wang, J.H.; et al. The genomes of pecan and Chinese hickory provide insights into Carya evolution and nut nutrition. Gigascience 2019, 8, giz036. [Google Scholar] [CrossRef]
  18. Kim, T.; Kim, H.; Byun, H. Localization-Aware Adaptive Pairwise Margin Loss for Fine-Grained Image Recognition. IEEE Access 2021, 9, 8786–8796. [Google Scholar] [CrossRef]
  19. Huang, L.; Xu, L.J.; Wang, Y.C.; Peng, Y.Q.; Zou, Z.Y.; Huang, P. Efficient Detection Method of Pig-Posture Behavior Based on Multiple Attention Mechanism. Comput. Intell. Neurosci. 2022, 2022, 1759542. [Google Scholar] [CrossRef]
  20. Lawal, M.O. Tomato detection based on modified YOLOv3 framework. Sci. Rep. 2021, 11, 1447. [Google Scholar] [CrossRef]
  21. Xu, Y.L.; Chen, Q.Y.; Kong, S.L.; Xing, L.; Wang, Q.; Cong, X.; Zhou, Y. Real-time object detection method of melon leaf diseases under complex background in greenhouse. J. Real-Time Image Process. 2022, 19, 985–995. [Google Scholar] [CrossRef]
  22. Bochkovskiy, A.; Wang, C.-Y.; Liao, H.-Y.M.J. Yolov4: Optimal speed and accuracy of object detection. arXiv 2020, arXiv:2004.10934. [Google Scholar]
  23. Gai, R.L.; Chen, N.; Yuan, H. A detection algorithm for cherry fruits based on the improved YOLO-v4 model. Neural Comput. Appl. 2021, 35, 13895–13906. [Google Scholar] [CrossRef]
  24. Wu, W.S.; Lu, Z.M. A Real-Time Cup-Detection Method Based on YOLOv3 for Inventory Management. Sensors 2022, 22, 6956. [Google Scholar] [CrossRef]
  25. Wang, C.-Y.; Liao, H.-Y.M.; Wu, Y.-H.; Chen, P.-Y.; Hsieh, J.-W.; Yeh, I.-H. CSPNet: A new backbone that can enhance learning capability of CNN. In Proceedings of the IEEE/CVF Conference on Computer Vision and Pattern Recognition Workshops, Washington, DC, USA, 14–19 June 2020; pp. 390–391. [Google Scholar]
  26. Zheng, Z.H.; Wang, P.; Ren, D.W.; Liu, W.; Ye, R.G.; Hu, Q.H.; Zuo, W.M. Enhancing Geometric Factors in Model Learning and Inference for Object Detection and Instance Segmentation. IEEE Trans. Cybern. 2022, 52, 8574–8586. [Google Scholar] [CrossRef]
  27. Su, F.; Zhao, Y.P.; Wang, G.H.; Liu, P.Z.; Yan, Y.F.; Zu, L.L. Tomato Maturity Classification Based on SE-YOLOv3-MobileNetV1 Network under Nature Greenhouse Environment. Agronomy 2022, 12, 1638. [Google Scholar] [CrossRef]
  28. Howard, A.; Sandler, M.; Chu, G.; Chen, L.-C.; Chen, B.; Tan, M.; Wang, W.; Zhu, Y.; Pang, R.; Vasudevan, V. Searching for mobilenetv3. In Proceedings of the IEEE/CVF International Conference on Computer Vision, Seoul, Republic of Korea, 27 October–2 November 2019; pp. 1314–1324. [Google Scholar]
  29. Howard, A.G.; Zhu, M.; Chen, B.; Kalenichenko, D.; Wang, W.; Weyand, T.; Andreetto, M.; Adam, H.J. Mobilenets: Efficient convolutional neural networks for mobile vision applications. arXiv 2017, arXiv:1704.04861. [Google Scholar]
  30. Howard, A.; Zhmoginov, A.; Chen, L.-C.; Sandler, M.; Zhu, M. Inverted residuals and linear bottlenecks: Mobile networks for classification, detection and segmentation. arXiv 2018, arXiv:1801.04381. [Google Scholar]
  31. He, K.M.; Zhang, X.Y.; Ren, S.Q.; Sun, J. Spatial Pyramid Pooling in Deep Convolutional Networks for Visual Recognition. IEEE Trans. Pattern Anal. Mach. Intell. 2015, 37, 1904–1916. [Google Scholar] [CrossRef]
  32. Dai, G.W.; Hu, L.; Fan, J.C.; Yan, S.; Li, R.J. A Deep Learning-Based Object Detection Scheme by Improving YOLOv5 for Sprouted Potatoes Datasets. IEEE Access 2022, 10, 85416–85428. [Google Scholar] [CrossRef]
  33. Qiu, M.L.; Huang, L.; Tang, B.H. ASFF-YOLOv5: Multielement Detection Method for Road Traffic in UAV Images Based on Multiscale Feature Fusion. Remote Sens. 2022, 14, 3498. [Google Scholar] [CrossRef]
  34. Du, S.J.; Zhang, B.F.; Zhang, P. Scale-Sensitive IOU Loss: An Improved Regression Loss Function in Remote Sensing Object Detection. IEEE Access 2021, 9, 141258–141272. [Google Scholar] [CrossRef]
  35. Li, Y.J.; Li, S.S.; Du, H.H.; Chen, L.J.; Zhang, D.M.; Li, Y. YOLO-ACN: Focusing on Small Target and Occluded Object Detection. IEEE Access 2020, 8, 227288–227303. [Google Scholar] [CrossRef]
  36. Gevorgyan, Z.J. SIoU Loss: More Powerful Learning for Bounding Box Regression. arXiv 2022, arXiv:2205.12740. [Google Scholar]
  37. Han, G.J.; Li, T.; Li, Q.; Zhao, F.; Zhang, M.; Wang, R.J.; Yuan, Q.W.; Liu, K.P.; Qin, L. Improved Algorithm for Insulator and Its Defect Detection Based on YOLOX. Sensors 2022, 22, 6186. [Google Scholar] [CrossRef] [PubMed]
  38. Guo, M.H.; Xu, T.X.; Liu, J.J.; Liu, Z.N.; Jiang, P.T.; Mu, T.J.; Zhang, S.H.; Martin, R.R.; Cheng, M.M.; Hu, S.M. Attention mechanisms in computer vision: A survey. Comput. Vis. Media 2022, 8, 331–368. [Google Scholar] [CrossRef]
  39. Kim, M.; Jeong, J.; Kim, S. ECAP-YOLO: Efficient Channel Attention Pyramid YOLO for Small Object Detection in Aerial Image. Remote Sens. 2021, 13, 4851. [Google Scholar] [CrossRef]
  40. Yang, B.H.; Gao, Z.W.; Gao, Y.; Zhu, Y. Rapid Detection and Counting of Wheat Ears in the Field Using YOLOv4 with Attention Module. Agronomy 2021, 11, 1202. [Google Scholar] [CrossRef]
  41. Chen, Z.Y.; Su, R.; Wang, Y.L.; Chen, G.F.; Wang, Z.Q.; Yin, P.J.; Wang, J.X. Automatic Estimation of Apple Orchard Blooming Levels Using the Improved YOLOv5. Agronomy 2022, 12, 2483. [Google Scholar] [CrossRef]
  42. Fu, L.H.; Yang, Z.; Wu, F.Y.; Zou, X.J.; Lin, J.Q.; Cao, Y.J.; Duan, J.L. YOLO-Banana: A Lightweight Neural Network for Rapid Detection of Banana Bunches and Stalks in the Natural Environment. Agronomy 2022, 12, 391. [Google Scholar] [CrossRef]
  43. Tan, M.; Pang, R.; Le, Q.V. Efficientdet: Scalable and efficient object detection. In Proceedings of the IEEE/CVF Conference on Computer Vision and Pattern Recognition, Seattle, WA, USA, 13–19 June 2020; pp. 10781–10790. [Google Scholar]
  44. Ren, S.Q.; He, K.M.; Girshick, R.; Sun, J. Faster R-CNN: Towards Real-Time Object Detection with Region Proposal Networks. IEEE Trans. Pattern Anal. Mach. Intell. 2017, 39, 1137–1149. [Google Scholar] [CrossRef] [PubMed]
  45. Cui, Z.Y.; Wang, X.Y.; Liu, N.Y.; Cao, Z.J.; Yang, J.Y. Ship Detection in Large-Scale SAR Images Via Spatial Shuffle-Group Enhance Attention. IEEE Trans. Geosci. Remote Sens. 2021, 59, 379–391. [Google Scholar] [CrossRef]
Figure 1. Dataset distribution under different conditions. Oily kernel (OK), black spot kernel (BK), withered kernel (WK), ground nutshell (GN), normal kernel (NK), and mixture (Mix).
Agronomy 13 01462 g001
Figure 2. Original image of the endogenous impurities in walnuts and normal walnut kernels. Oily kernel (OK), black spot kernel (BK), withered kernel (WK), ground nutshell (GN), normal kernel (NK), and mixture (Mix).
Agronomy 13 01462 g002
Figure 3. EED abstract schematic. The digital label represents the bounding boxes.
Agronomy 13 01462 g003
Figure 4. Images after offline data processing.
Agronomy 13 01462 g004
Figure 5. WT-YOLOM model. Convolution (Conv), batch normalization (BN), depthwise separable convolution (DCBA), spatial pyramid pooling—fast (SPPF).
Agronomy 13 01462 g005
Figure 6. Comparative analysis of SPP (a) and SPPF (b).
Agronomy 13 01462 g006
Figure 7. Scheme for the calculation of SIoU loss. BGT is the ground truth BBox. B is the prediction BBox.
Agronomy 13 01462 g007
Figure 8. ECA model. C denotes the number of channels. GAP denotes the global average pooling. σ is a sigmoid function ⊗ denotes element-by-element multiplication.
Agronomy 13 01462 g008
Figure 9. Loss values for the different improvement methods.
Agronomy 13 01462 g009
Figure 10. Comparison of detection effects. Red bounding boxes represent the predictions of black spot kernels. Green bounding boxes represent the predictions of ground nutshells. Blue bounding boxes represent the predictions of oily kernels. Yellow bounding boxes represent the predictions of normal kernels. Cyan bounding boxes represent the predictions of withered kernels.
Agronomy 13 01462 g010
Figure 11. Comparison of WT-YOLOM with common basic algorithms.
Agronomy 13 01462 g011
Table 1. Anchors for different scale size targets.
Small Size (PX)Medium Size (PX)Large Size (PX)
50, 47, 49, 75, 74, 5061, 63, 70, 75, 86, 6461, 92, 81, 83, 94, 97
Table 2. Comparison of two convolution methods.
ItemParametersCalculation Amount
Depthwise separable convolutionK × K × 1 × M + N × 1 × 1 × MR × R × K × K × 1 × M + R × R × N × 1 × 1 × M
Traditional convolutionN × K × K × MR × R × N × K × K × M
Ratio 1 N + 1 K 2
Table 3. Hardware and software environment.
ItemConfigure
Operating systemWindows10 × 64
CPUR9-5950X
GPURTX 3090 (24 G)
Deep learning framePyTorch 1.7.1
Programming languagePython 3.9
Integrated development environmentPycharm 2023.1.1
Table 4. Detection results on BOGWN.
ModelmAP@0.5 (%)mAP@0.5:0.95 (%)ParametersSize (MB)FLOPs (G)FPS
YOLOv492.482.263,959,22624460.046.6
Faster R-CNN93.472.2136,770,964522369.826.0
EfficientDet-D090.080.73,830,342144.827.9
CenterNet71.865.832,665,43212570.275.2
YOLOv4-MobileNetV388.977.611,325,194437.257.0
Table 5. Detection results for the five categories on BOGWN.
ModelF1-ScoreRecall (%)Precision (%)
YOLOv4Black spot kernels0.8887.188.5
Ground nutshell0.9898.497.4
Normal kernels0.9799.593.8
Oily kernels0.9090.589.1
Withered kernels0.8278.386.0
Faster R-CNNBlack spot kernels0.8888.287.2
Ground nutshell0.9697.493.9
Normal kernels0.9398.587.5
Oily kernels0.8889.387.3
Withered kernels0.7985.474.0
EfficientDet-D0Black spot kernels0.8476.394.0
Ground nutshell0.9497.490.6
Normal kernels0.9397.589.0
Oily kernels0.8379.587.8
Withered kernels0.6049.776.5
CenterNetBlack spot kernels0.6551.190.5
Ground nutshell0.8485.282.1
Normal kernels0.8986.991.5
Oily kernels0.6756.184.0
Withered kernels0.1810.272.7
YOLOv4
-MobileNetV3
Black spot kernels0.8686.686.1
Ground nutshell0.9797.495.8
Normal kernels0.9699.592.5
Oily kernels0.8787.087.3
Withered kernels0.7268.874.5
Table 6. Ablation experiments on the proposed algorithm. Model here refers to the YOLOv4 model. ‘√’ represents an improvement loaded in the model.
ModelMobileNet v3SIoUK-meansSPPFSize (MB)mAP@0.5 (%)mAP@0.5:
0.95 (%)
43.288.977.6
43.291.580.4
43.293.482.7
33.591.781.0
43.294.283.3
33.593.182.4
33.593.381.8
33.594.182.5
Table 7. Comparison of different attention models’ performance.
Baseline ModelAttention ModelmAP@0.5 (%)mAP@0.5: 0.95 (%)ParametersSize (MB)FLOPs (G)FPS
WT-YOLOECA94.482.87,274,07927.86.360.1
CBAM93.782.08,800,36033.66.349.2
SE94.082.98,807,96233.66.357.3
CA93.182.47,577,31328.96.350.0
Disclaimer/Publisher’s Note: The statements, opinions and data contained in all publications are solely those of the individual author(s) and contributor(s) and not of MDPI and/or the editor(s). MDPI and/or the editor(s) disclaim responsibility for any injury to people or property resulting from any ideas, methods, instructions or products referred to in the content.

