Article

Long-Term Organic Manure Substitution Increases Yield and Phosphorus Use Efficiency in a Double-Rice System by Altering Soil Phosphorus Uptake and Apparent Balance

1
National Engineering Laboratory for Improving Quality of Arable Land, Institute of Agricultural Resources and Regional Planning (IARRP), Chinese Academy of Agricultural Sciences (CAAS), Beijing 100081, China
2
Soil and Fertilizer & Resources and Environmental Institute, Jiangxi Academy of Agricultural Sciences, Nanchang 330200, China
3
Department of Soil Science and Agricultural Engineering, Faculty of Agriculture, Usmanu Danfodiyo University, Sokoto 2346, Nigeria
*
Author to whom correspondence should be addressed.
These authors contributed equally to this work.
Agronomy 2023, 13(6), 1440; https://doi.org/10.3390/agronomy13061440
Submission received: 3 May 2023 / Revised: 21 May 2023 / Accepted: 22 May 2023 / Published: 23 May 2023
(This article belongs to the Section Soil and Plant Nutrition)

Abstract

:
The excessive use of chemical phosphorus (P) fertilizer can lower grain yield and P use efficiency (PUE) by aggravating soil acidity. Substituting organic manure for chemical fertilizer can alleviate the problem, although the long-term effect of organic manure incorporation is unknown. We conceptualized that substituting organic manure for chemical fertilizer may result in higher crop yields and PUE. Therefore, the impact of long-term fertilizer treatments: (i) CK (control), (ii) PK (phosphorus and potassium fertilizer), (iii) NP (nitrogen and P fertilizer), (iv) NK fertilizer, (v) NPK fertilizer, and (vi) NPKM (30% NPK fertilizer plus 70% manure) on rice yield, PUE, P uptake, and apparent balance (APB) was investigated. The results showed that rice yield under different fertilizer treatments ranged from 6.2 to 11.8 t ha−1 (1984–1995), 7.9 to 12.7 t ha−1 (1996–2007), and 6.6 to 12.8 t ha−1 (2008–2018). The rice yield under NPKM was greatly improved compared to other treatments, except with that of NPK (1984–1995). Soil organic carbon (SOC), available P and phosphorus activation coefficient (PAC) under NPKM were significantly higher than other treatments during 1984–2018. Soil pH (1984–2018) was greatly higher under CK and NPKM than under other treatments. Soil total P under PK, NP, NPK, and NPKM was significantly higher than under CK and NK (1984–2018). Compared to other treatments, P uptake was significantly higher under NPKM, except with that of NPK (1984–1995 and 2008–2018). The average PUE (1984–2018) was 10.7, 20.2, 36.1, and 44.2 kg kg−1 under PK, NP, NPK, and NPKM, respectively. The APB under NPKM was significantly lower as compared to PK, NP, and NPK treatments. Therefore, we conclude that in addition to improving soil organic carbon, cations inputs from organic manure can be a factor for the increase in soil pH, making organic manure substitution for chemical fertilizer a more efficient strategy for increasing PUE and crop yield.

1. Introduction

The double-rice system is a cropping method that played a major part in the food security of southern China and China as a whole [1]. On the other hand, the sustainability of the system is threatened by the decline in the growth rate of rice yield [2,3] due to scarcity of water [4], phosphorus (P) deficiency [5], high consumption of chemical fertilizer [3,6], and climate change [7]. High chemical P fertilizer consumption was aggravated by the P deficiency due to its fixation to the oxides of aluminum (Al) and iron (Fe) [8] and by the complex nature of the chemistry of soil phosphorus that varied with the kind of soil, rate and type of fertilization [9], land use category, and management [10]. Different sources of P affect soil P availability and crop yield differently and can moderate P deficiency [11,12]. For example, Lu et al. [13] observed that the contribution of synthetic fertilizer on soil P contents differed from that of organic manure. Mineral fertilizer provides easily accessible P for plant uptake, but overuse can reduce phosphorus usage efficiency (PUE) and increase the accumulation of surplus soil P [14]. Soil phosphorus is quite sensitive to pH [15]. Lower PUE is a major issue in acidic Chinese farmland soil [1], affecting crop yield. Phosphorus availability for plants diminishes in acidic soil due to P fixation with acidic cations such as Al and Fe [8], which affects plant P uptake [16]. On the contrary, substituting chemical fertilizer with manure can improve soil P recovery and soil P contents [17,18] by reducing the absorption of soil P to oxides of Al and Fe [19]. Manure addition can boost microbial activity [20] and increase soil nutrient availability [21] by increasing soil pH due to manure alkalinity [22]. For that reason, assessing and managing P under different long-term fertilizations is necessary to ensure sustainable rice yield and improve P use efficiency.
Long-term field experiments could provide important data on the effects of various management strategies on the sustainability of farmlands under different fertilization regimes [23,24]. As a result of chemical P fertilization, for instance, crop P uptake is usually in the range of 10–25%, and the residual 90–75% is transformed to stable forms not easily accessible to plants [25], thereby leading to steady saturation of the soil P buildup and adsorption capability [26], reducing PUE [3,27] and increasing the danger of eutrophication [28]. This scenario makes long-term P management for optimum crop yield and environmental protection difficult, especially in acidic soils [28,29]. However, previous studies indicated that substituting chemical fertilizers with organic manure could increase PUE via altering the pH of soil [20,30,31], modifying soil properties, optimizing soil P status and minimizing P losses [23,32]. Furthermore, organic manure addition was found to increase crop yield by enhancing the soil available P pool [23]. According to El Sheikha [22], increased crop yield under the replacement of inorganic fertilizer by organic manure could be attributed to an increase in soil nutrient reserve, implying that the mechanism of increasing crop yield and PUE under organic manure addition is not the same. As a result, more research on the responses of rice yield, P uptake, and PUE to the long-term substitution of inorganic fertilizer with organic manure in subtropical acidic red soils is needed.
Fertilizer management approaches were aimed at improving crop yield and feeding the ever-growing population. The cereal production capacity of China in 2017 increased by 462% relative to 1961 figures in an effort to feed approximately 22% of the global populace [33]. However, this progress could be retarded owing to the decline in PUE of the major cereal crops [3,21] and increased soil P accumulation [26] due to long-term excessive P fertilization [1,3]. Various fertilization methods alter soil P content [34] and regulate surplus P accumulation differently [35]. Eight distinct long-term field experiments in China demonstrated a potential risk of surplus P fertilizer accumulation after replacing chemical P fertilizer with the organic amendment [36]. Also, relative to chemical fertilizer application, a comparable or even higher risk of P loss was observed in organic manure-amended treatments [12]. On the contrary, manure application was reported to have improved P uptake and PUE by increasing SOC and minimizing P leaching to the ground waters [20]. Our hypothesis suggests that substituting organic manure for chemical fertilizer may result in higher crop yields and PUE than chemical fertilization alone. As a result, the objectives of this study were to (i) assess the effects of different fertilization regimes on rice grain yield, P uptake, APB, and PUE, and (ii) assess quantitatively the factors influencing crop yield, P intake, APB, and PUE in an acidic soil under a double-rice cropping system.

2. Materials and Methods

2.1. Experimental Site

The study began in 1984 and was carried out at Nanchang Long-term Monitoring Experimental Station, Jiangxi Academy of Agricultural Sciences, China. The farm is located at latitude 28°57′ N and longitude 115°94′ E, with an elevation of 25 m. Long-term monitoring data was used from 1984 to 2018. Nanchang has a subtropical climate with a mean temperature of 17.5 °C, a mean precipitation of 1600 mm, a potential evaporation of 1800 mm, and a frost-free period of 280 days. In this region, the double-rice cropping system constituted the major agricultural land use type. The soils were formed from the Quaternary red clay materials and were classified as Ferralic Cambisols [37]. At the start of the study, the following topsoil parameters (0–20 cm) were measured: (i) soil pH (6.5); (ii) soil organic carbon (SOC; 14.88 g C kg−1); (iii) total nitrogen (TN; 1.36 g N kg−1); (iv) available nitrogen (AN; 81.6 mg N kg−1); (v) total phosphorus (TP; 0.49 g P kg−1); and (vi) available phosphorus (AP; 20.8 mg P kg−1).

2.2. Experimental Design and Rice Management

This study consisted of six different fertilizer treatments: (i) CK (control), (ii) PK (synthetic phosphorus and potassium fertilizer), (iii) NP (synthetic nitrogen and P fertilizer), (iv) synthetic NK fertilizer, (v) synthetic NPK fertilizer, and (vi) NPKM (30% synthetic NPK fertilizer plus 70% organic manure). In this study, NK treatment was considered a treatment without P addition, whereas PK, NP, NPK, and NPKM treatments were considered treatments with P addition. The various treatments were spread out in a randomized complete block design. Each treatment was replicated three times, making a total of 18 plots. The plots had an area of 33.3 m2 each and were separated using a cement ridge (0.45 m deep × 0.5 m wide). Milk vetch (early rice) at the rate of 2250 kg h−1 was used as the organic fertilizer with average nitrogen (3.03 g kg−1), phosphorus (0.8 g kg−1), and potassium (2.3 g kg−1). Every year on November 10th, green manure is sown, and on April 10th of the following year, the green manure is incorporated into the soil. Pig manure (late rice) at the rate of 2250 kg ha−1 was used as the organic fertilizer with average nitrogen (4.5 g kg−1), phosphorus (1.9 g kg−1), and potassium (6.0 g kg−1). In contrast to milk vetch, which is returned to the field directly, pig manure is incorporated into the field after it has decomposed. The chemical fertilizers applied as sources of N, P, and K, respectively, were: (i) urea (46% N), (ii) calcium superphosphate (12% P2O5), and (iii) potassium chloride (60% K2O). Table 1 shows the amount of both inorganic and organic fertilizer inputs used in each treatment.
All organic fertilizers were applied as a base fertilizer at once before rice transplantation. The chemical fertilizers were applied as follows: (i) 100% of P fertilizer and 50% of urea as basal doses at transplanting stage; (ii) 50% of K fertilizer and 25% of urea as first top dressing doses at the tillering stage; and the remaining 50% of K fertilizer and 25% of urea as second top dressing doses at the young panicle stage. The soil was cultivated every year to early rice (early April to mid-July), late rice (late July to mid-October), and milk vetch (late October to mid-March of the successive year). In the course of this long-term experiment, dominant local rice cultivars were sown. Irrigation, weeding, disease and pest practices were also performed when necessary during the study. After harvesting, rice and straw biomass were removed from the plots, and stubbles were left in the fields. The grain and straw biomass collected were air-dried, and then the quantity of grain and straw biomass yields was determined.

2.3. Crop Sampling and Analysis

Following the late rice harvest, three rice crop samples were drawn at random from each plot. Prior to tests, these crop samples were oven dried for 30 min at 105 °C and then dried again at 70 °C to a consistent mass. Furthermore, dried rice grain and straw biomass samples were crushed and sieved through a 0.15-mm mesh. The plant P content was determined using standard techniques [38].

2.4. Soil Sampling and Analysis

Each year surface (0–20 cm) soil samples were taken once after the late rice harvest. Randomly, five soil cores were taken using an auger per plot and then assembled together into various composite samples. Each composite soil sample was kept in aseptic bags, labeled, and then transported to the laboratory. The samples were air-dried, crushed, and sieved with a 2 mm mesh in the laboratory. Initially, each composite soil sample was divided into (i) fresh soil samples that were stored at 4 °C and used to assay humic acids and acid phosphatase activity (AcP) and (ii) air-dry samples that were used to determine the chemical properties of the soil. Humic acids were assayed using the method described by agricultural chemical analysis [39]. The AcP activity was determined on fresh and moist soil samples using p-nitrophenyl phosphate as substrate in an adapted worldwide buffer. Later, substrate and buffer solutions (pH 6.5) were added to 1 g of soil and then allowed to stand at 37 °C for 1 h [40]. After filtration, the color intensity of the filtered solution was measured using a spectrophotometer at 400 nm. Soil pH was measured in a glass electrode meter using a soil suspension in distilled water (soil/water = 1:2.5, w/v). The oxidation method was used to determine the soil’s organic carbon content [41,42]. Standard protocols were used to determine the soil TN, AN, TP, and AP contents [38,42,43,44]. Briefly, the soil extractable phosphorus concentration (available P) was extracted in a horizontal shaker using a 0.5 M sodium bicarbonate (NaHCO3) solution (soil/solution ratio = 1:20, w/v) adjusted with sodium hydroxide (NaOH) solution to pH 8.5. The extraction time was 16 h, and the extraction temperature was fixed at 25 °C. For total soil phosphorus, however, soil samples were digested using a perchloric-sulphuric acid (HClO4-H2SO4) solution and then measured following the molybdenum blue colorimetric method.

2.5. Calculation

The phosphorus activation coefficient (PAC) was established as the ratio of AP to TP in soil. High PAC (%) and PAC less than 2% indicate the ease and difficulty of converting soil TP to AP, respectively [13,34], and were computed as follows:
PAC = AP 1000 × TP × 100
where AP represents available P in mg kg−1, and TP represents total P in g kg−1.
The following formula was used to calculate the phosphorus uptake by grain and straw biomass yields:
P   uptake   = Crop   P   Content   ×   Yield
where yield represents the summation of grain yield and straw biomass yield.
The APB (kg−1 ha−1 yr−1) is the difference between P input and P output. Positive APB indicates P buildup, while negative APB indicates P deficit [45]. It was expressed in the following equation as described by Ouyang et al. [46]:
APB =   P   input       P   output
where Poutput is the yearly P uptake (kg ha−1), and Pinput is the annual P input (kg ha−1).
Based on P input and rice P uptake (1984–2018), agronomic P use efficiency (kg kg−1) was calculated [47]:
PUE   = YF     YO / F
where PUE stands for phosphorus use efficiency, YF represents the yearly rice grain yield (kg ha−1) under the fertilizer treatments, YO represents the annual rice grain yield (kg ha−1) under the control treatment, and F represents the annual P input (kg ha−1).
The partial factor productivity of soil P (PFPP; kg kg−1) and the internal efficiency of soil P (IEP; kg kg−1) were calculated as shown below:
Partial   factor   productivity   of   soil   P   =   Y / F
Internal   efficiency   of   soil   P   =   Y / UP
where Y is the rice grain yield, and F is the amount of fertilizer P applied. UP denotes the amount of P taken up by rice in additional P treatments.
Phosphorus recovery efficiency (REP) was estimated [48] based on rice yield and P uptake in the treatment without P addition:
Recovery   efficiency   of   soil   P =   UP     UO / FP   × 100  
where UP denotes P uptake in treatments with P addition, UO denotes P uptake in treatments without P addition, and FP denotes the amount of P supplied.
The coefficient of variation (CV, %) was calculated as described [49] in the following equation:
CV   = σ / Ymean × 100
where Ymean is the average grain yield in a given treatment (t ha−1), and σ is the standard deviation.
The sustainable yield index (SYI) was determined as described [50] in the following equation:
SYI   =   Ymean     σ / Ymax
where Ymax is the maximum rice grain yield in a given treatment (t ha−1).

2.6. Statistical Analysis

The data in this study was divided into three successive periods (1984–1995, 1996–2007, and 2008–2018) to allow for a systematic assessment of the variations within the data over a 35-year period. Using SPSS software (version 20), the analysis of variance (ANOVA) was utilized to compare the variances between the variables. Tukey’s HSD test was then used to categorize the significant (p < 0.05) means. Shapiro–Wilk’s normality test (p < 0.05) was performed first; however, ANOVA on ranks was performed on the data that failed the normality test. SigmaPlot (version 12.5) software was used to create all graphs. Linear regression was used to find the linear relationship between the various indicators. Canoco (version 5.0) software was used to perform the redundancy (RDA plot) analysis. AMOS-IBM software (version 25) was used for structural equation modeling (SEM).

3. Results

3.1. Changes in Soil Properties and Grain Yield of Rice

Different fertilizer treatments had a significant (p < 0.05) influence on the pH of soil pH SOC content (Table 2). During 1984–1995, soil pH fluctuated from 6.17 to 6.56 in P-added treatments, with a maximum soil pH observed in NPKM treatment. Soil pH ranged from 6.01 to 6.50 in the control and NK treatments, with the NK treatment having the lowest (1984–1995). Soil pH was lower with PK, NP, NK, and NPK treatments during all study periods as compared to control and NPKM treatments. Compared with the initial pH value, soil pH under NPKM increased by 0.06, 0.15, and 0.21 during 1984–1995, 1996–2007, and 2008–2018, respectively, but was relatively stable under control treatment. Over time, the lowest soil pH was observed when PK, NP, NK, and NPK treatments were used in comparison to control and NPKM treatments. Compared to initial values, the SOC content significantly (p < 0.05) increased under NP, NPK, and NPKM treatments but decreased in PK, NK and control during 1984–2018. Over the years (1984–2018), the highest SOC among treatments with P addition was under NPKM, followed by NPK, while PK had the lowest SOC. Compared to the initial value, SOC under NPKM during 1984–1995, 1996–2007, and 2008–2018 increased by 11.3, 21.2, and 27.9%, respectively. In comparison to the control treatment, the SOC content increased by 7.9, 19.7, 11.8, 22.9, and 41.1% under PK, NP, NK, NPK, and NPKM treatments, respectively.
Various long-term fertilizer treatments had a significant (p < 0.05) impact on soil TP, AP, and PAC (Table 2). During 1984–2018, there was a significant increase in soil TP, AP, and PAC under PK, NP, NPK, and NPKM treatments compared with initial values. During the same period, however, soil TP, AP, and PAC significantly (p < 0.05) decreased under NK and control. Among the various fertilizer treatments, the NPKM treatment had the highest soil TP, AP, and PAC, while the control had the lowest. Over the years, compared to the initial value, soil TP under PK, NP, NPK, and NPKM treatments increased by 55.1, 66.0, 261.2, and 493.9%, respectively, and dropped by 11.6 and 23.8% in the control and NK treatments, respectively. During 1984–2018, soil AP under PK, NP, NPK, and NPKM treatments increased by 108.3, 114.3, 101.3, and 218.7%, respectively, but declined by 43.2 and 41.1% in the control and NK treatments, respectively. The PAC increased by 33.4, 119.7, 275.9, and 385.4% under PK, NP, NPK, and NPKM treatments, respectively, and dropped by 52.3 and 22.7% under control and NK, respectively, during 1984–2018.
The varied treatments had a significant (p < 0.05) effect on rice grain yield, SYI, and CV (Table 3). NPKM obtained the highest rice yield (12.4 t ha−1) between 1984 and 2018, followed by NPK, NK, NP, PK, and control treatments, which produced rice yields of 11.4, 10.2, 9.4, 8.2, and 6.9 t ha−1, respectively. Over the years, rice yield had shown a discernable increase under NPK and NPKM treatments and vice versa in the PK and NP treatments. Rice yield declined by 5.13 and 10.11%, respectively, under NK during 1996–2007 and 2008–2018, compared to 1984–1995. Compared to the control, rice yield under PK, NP, NK, NPK, and NPKM treatments increased by 18.8, 36.2, 47.8, 65.2, and 79.7%, respectively. For the three experimental periods, the highest SYI value was observed under NPKM treatment, followed by NPK treatment, and the lowest was under control (Table 3). Compared with control, SYI value under NPK and NPKM treatments increased by 17, 34, and 27% and by 25, 50, and 46% during 1984–1995, 1996–2007, and 2008–2018, respectively. Contrarily, the highest and lowest CV values were obtained under control and NPKM treatments over the same periods. Compared with control, CV value under NPK and NPKM treatments decreased by 57, 42, and 40% and by 63, 62%, and 59% during 1984–1995, 1996–2007, and 2008–2018, respectively.

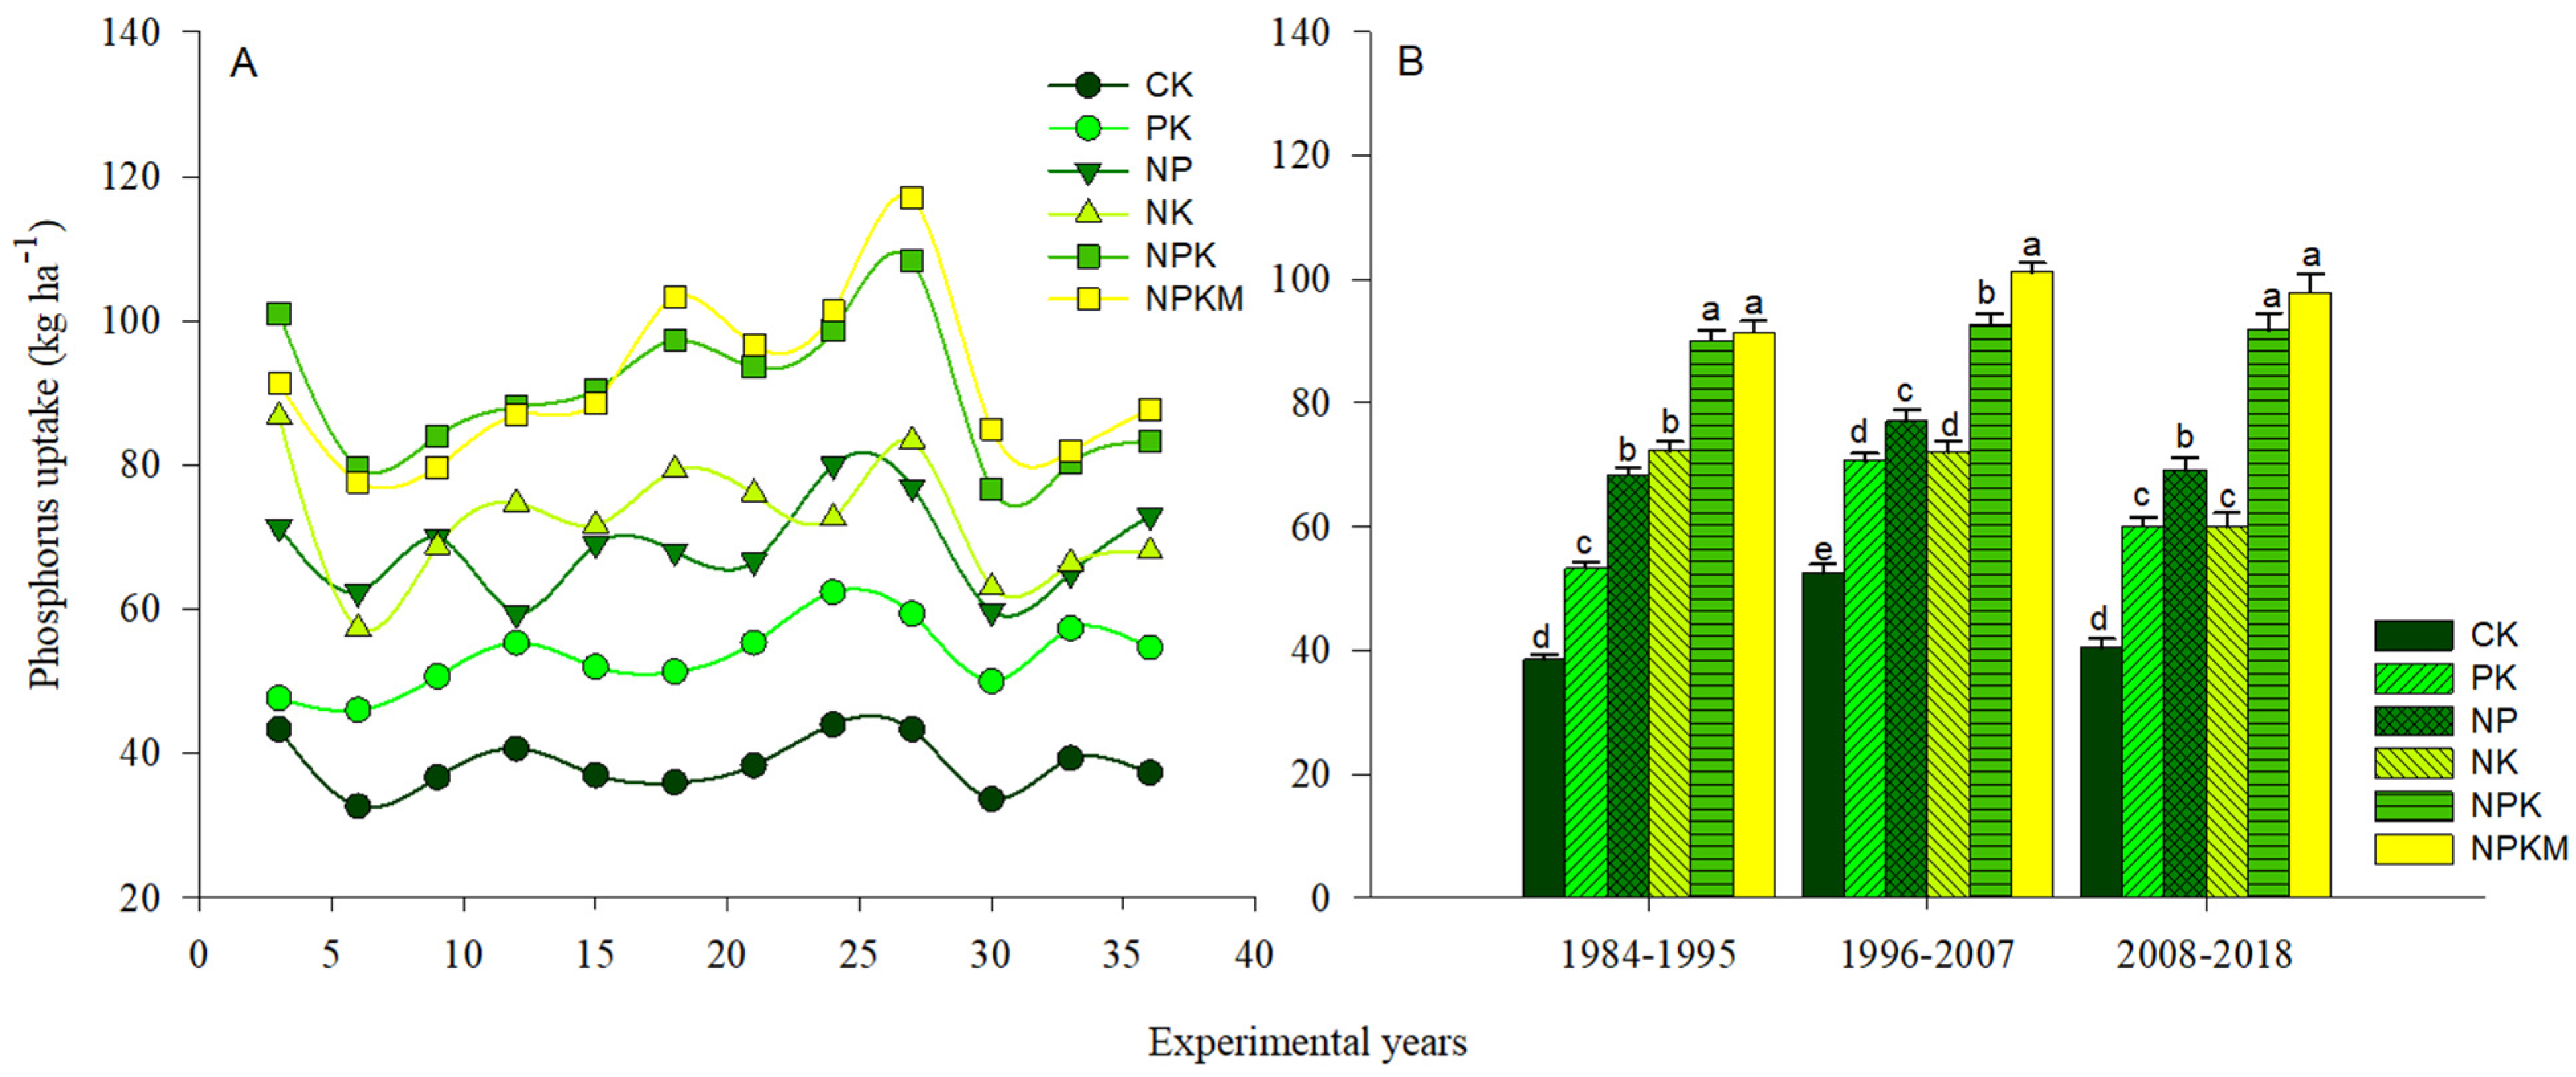
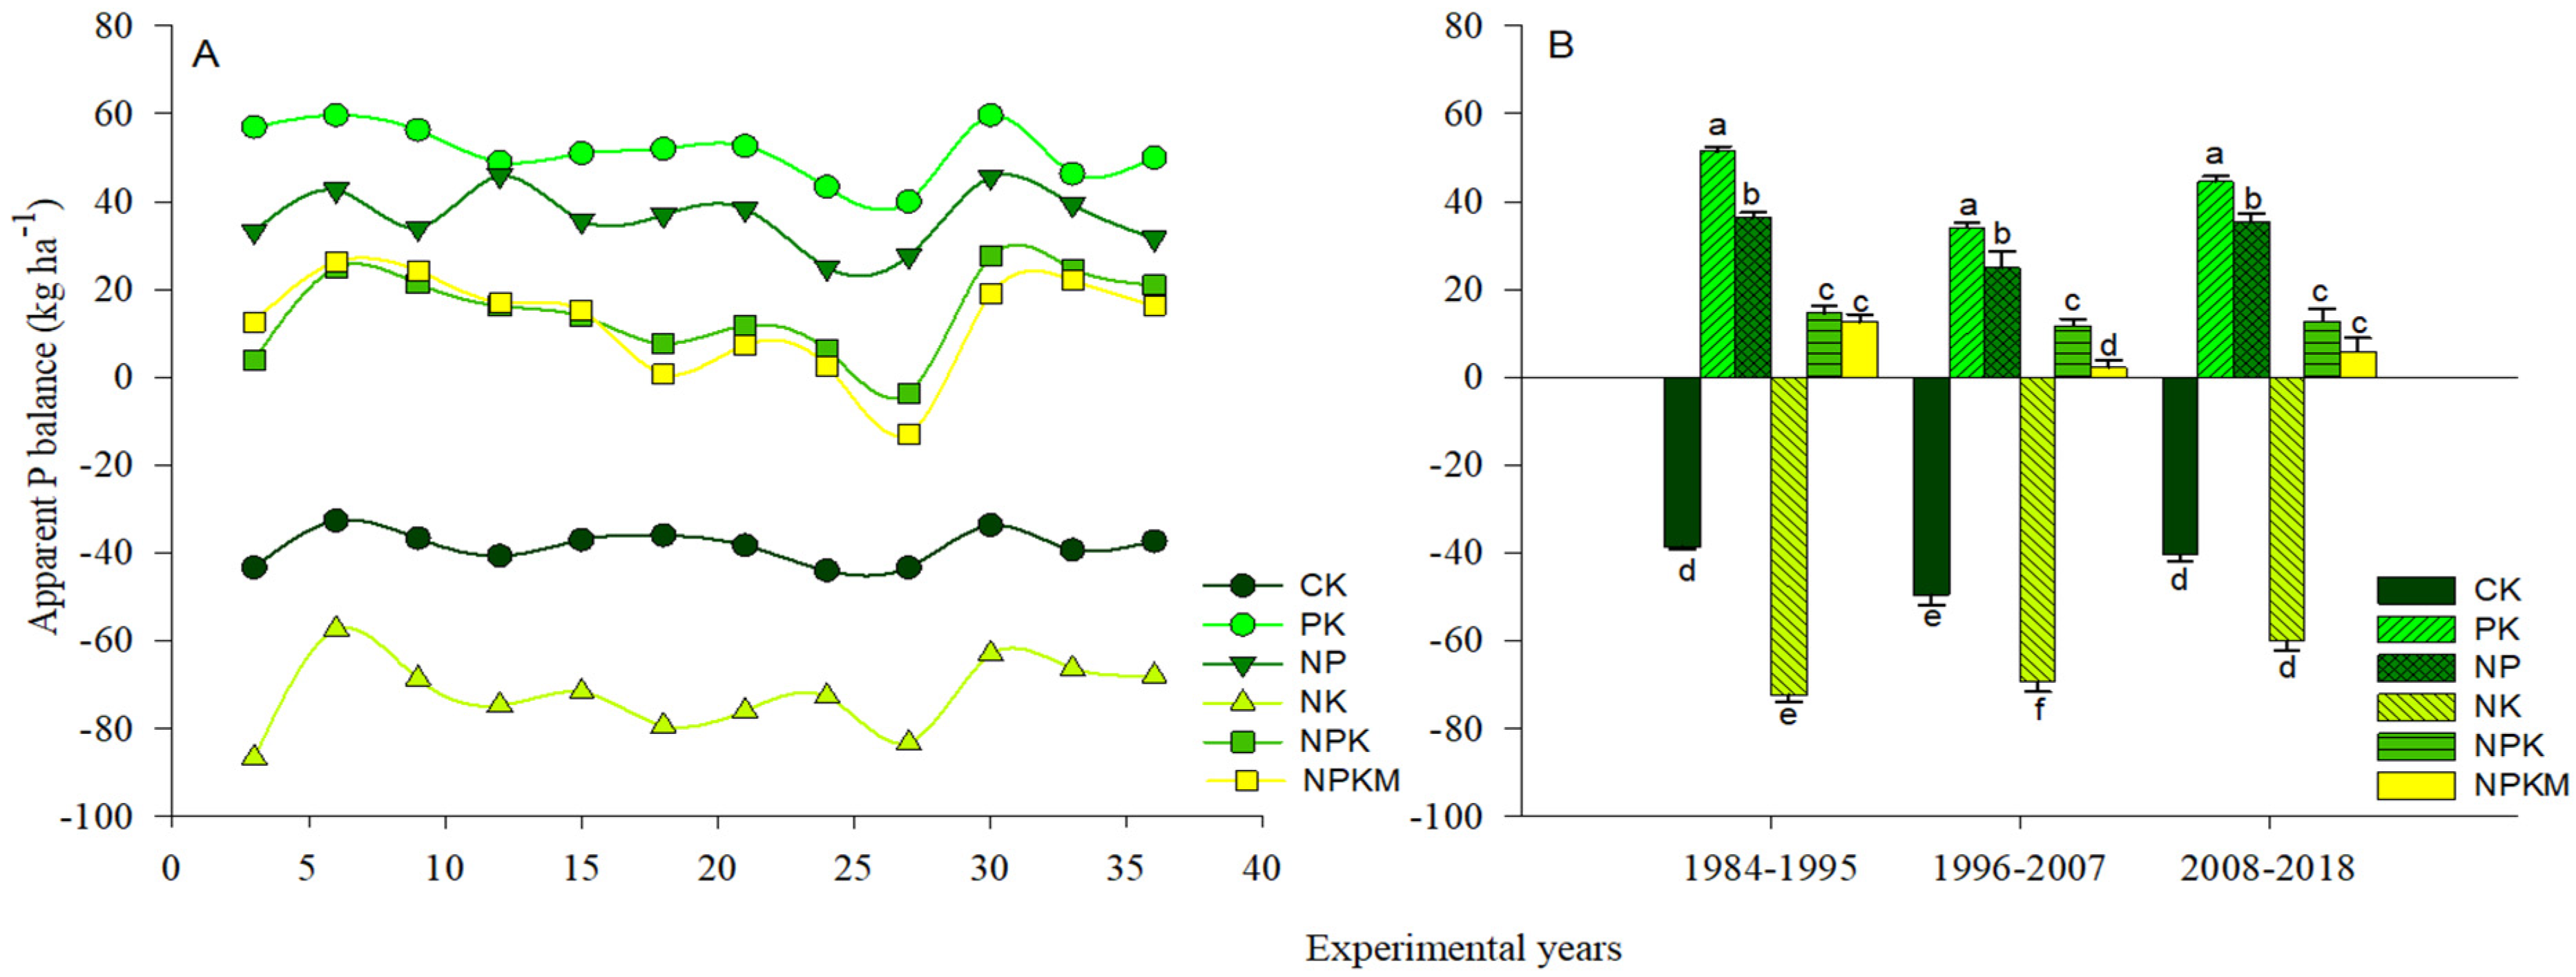
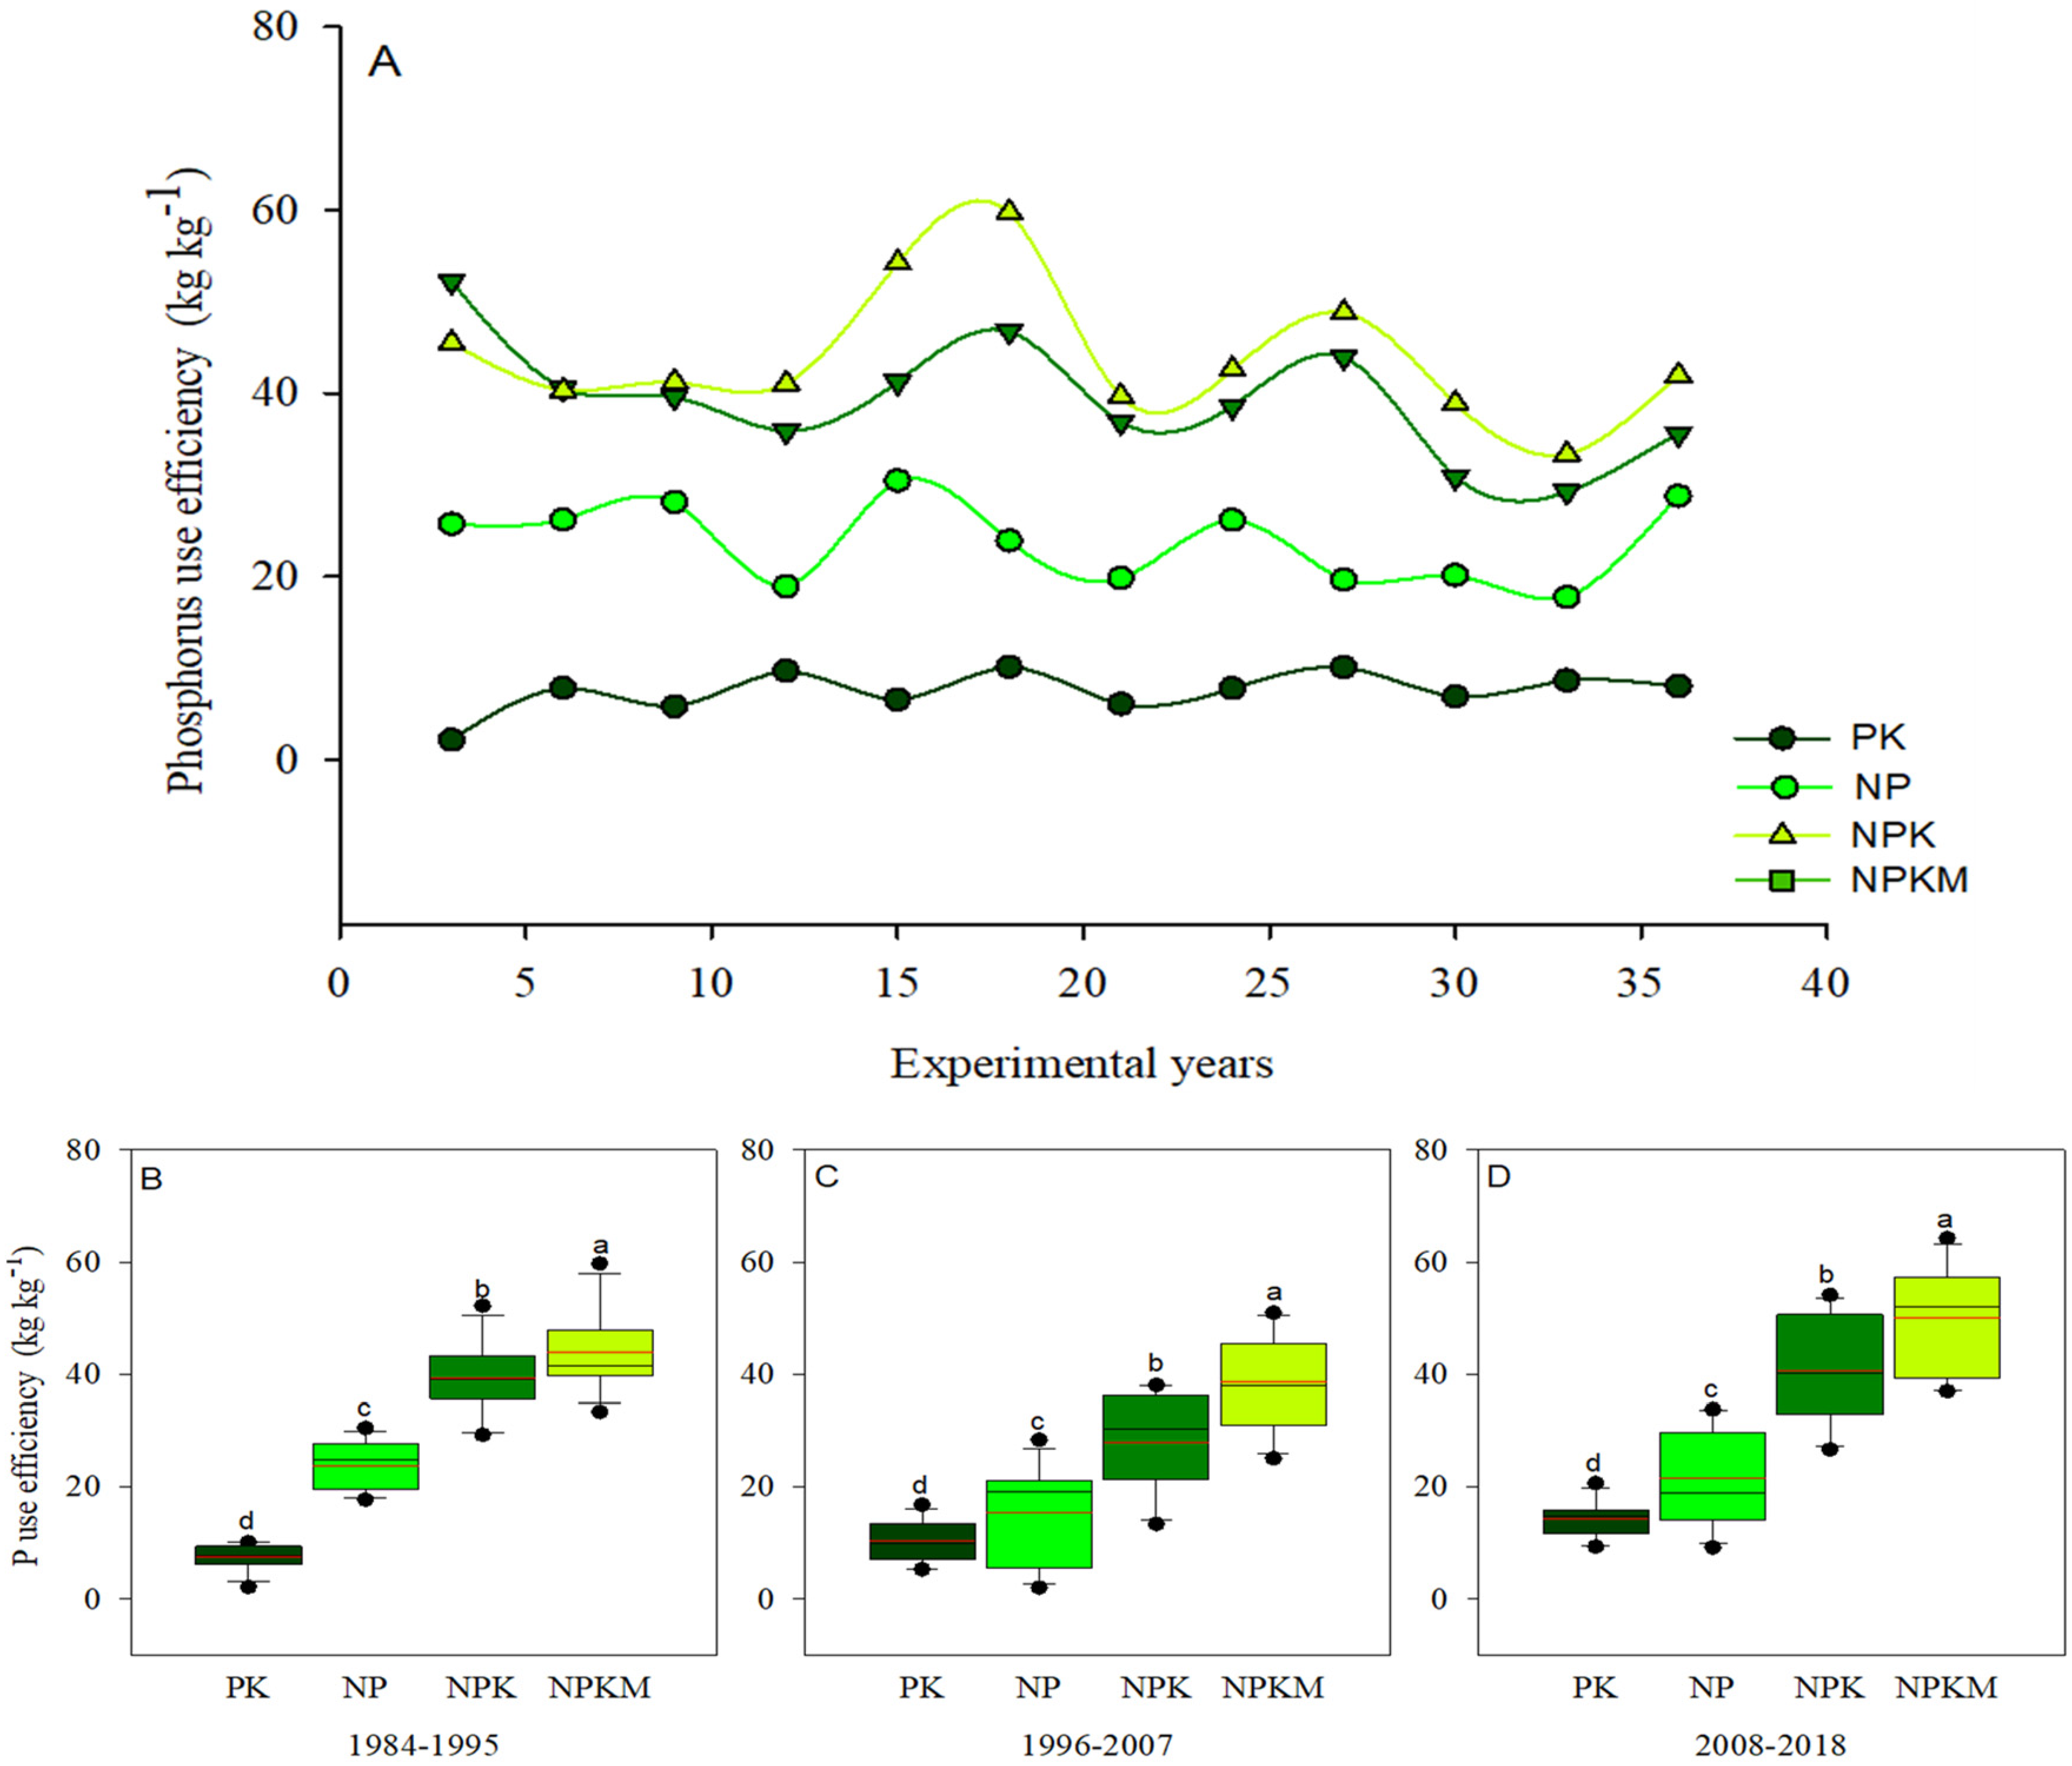
3.2. Changes in P Uptake, Apparent P Balance and P Use Efficiency

Long-term phosphorus inputs enhanced P uptake significantly (p < 0.05) in the PK, NP, NPK, and NPKM treatments compared to the control and NK treatments (Figure 1A). The NPKM treatment had the highest P uptake among the P fertilizer treatments, followed by NPK and NP, and the PK treatment had the lowest P uptake (Figure 1B). The APB was significantly (p < 0.05) impacted by the various long-term fertilizer treatments (Figure 2A). Soil APB ranged from −72.3 to 51.4 kg ha−1 from 1984 to 2018 and was negative in both the control and NK treatments (Figure 2B). During the same period, however, soil APB under NK treatment was significantly lower as compared to the control.
Long-term P inputs had a significant (p < 0.05) effect on the P use efficiency (Figure 3A–D). During 1984–2018, the average PUE was 10.6, 20.2, 35.9, and 44.1 kg kg−1 under PK, NP, NPK, and NPKM treatments, respectively. The PUE under NPKM treatment was significantly (p < 0.05) higher relative to other P-added treatments. The PUE under NPKM treatment increased by 316, 118, and 23% compared to PK, NP and NPK treatments, respectively. Compared to other study periods, the PFPp was considerably higher during 2008–2018, and the PFPp value varied between 38 to 174 kg kg−1 under P-added treatments (Table 4). The PFPp under different P addition treatments was in the order: NPKM > NPK > NP > PK, with the highest value under NPKM treatment. The REp varied between 10 and 54% and followed a similar trend with PFPp, except that there was no significant (p > 0.05) difference between NPK and NPKM treatments during 1984–1995 (Table 4). The lowest and highest REp during 2008–2018 and 1984–1995 were under PK and NPKM treatments, respectively. The REp under P-added treatments was in the order: NPKM > NPK > NP > PK during 1984–2018. The IEp varied between 114 to 205 kg kg−1, with the lowest and highest values under NPKM and PK treatments during 1984–2018. Over the years, the IEp under NPK and NP treatments was statistically at par. During the same period, the IEp among the different IEp treatments was in the order: NPKM > NPK = NP > PK.

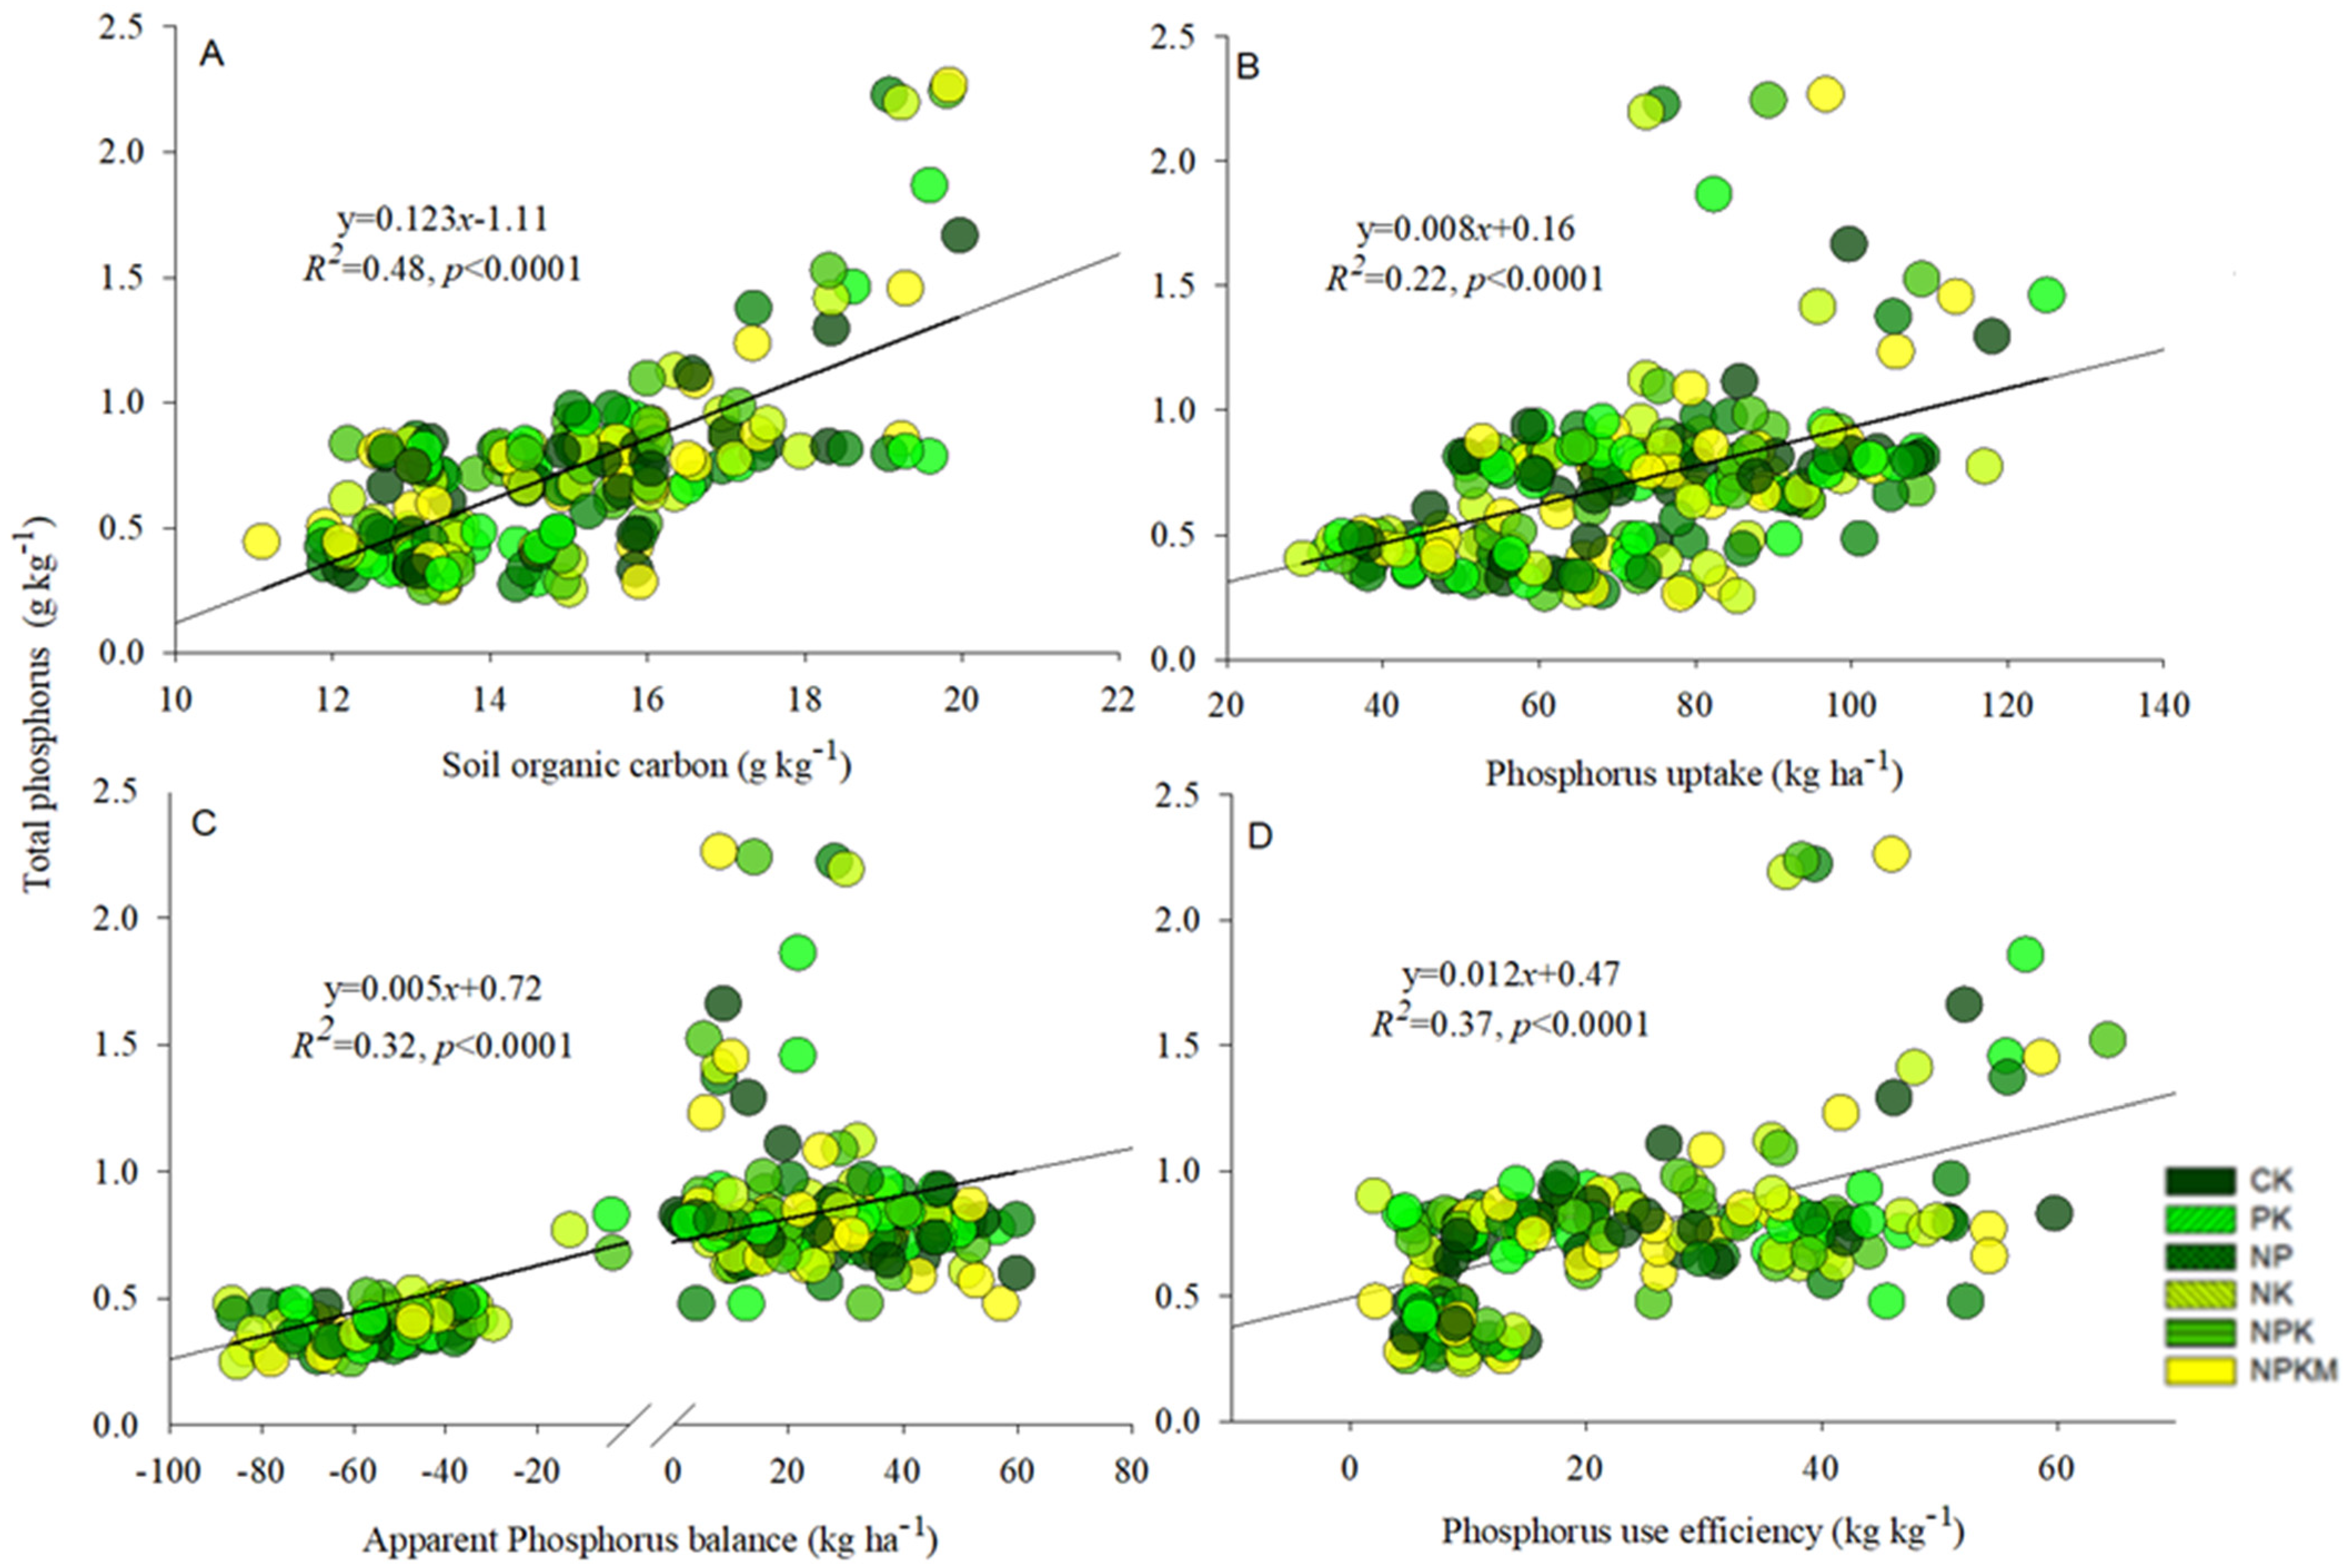
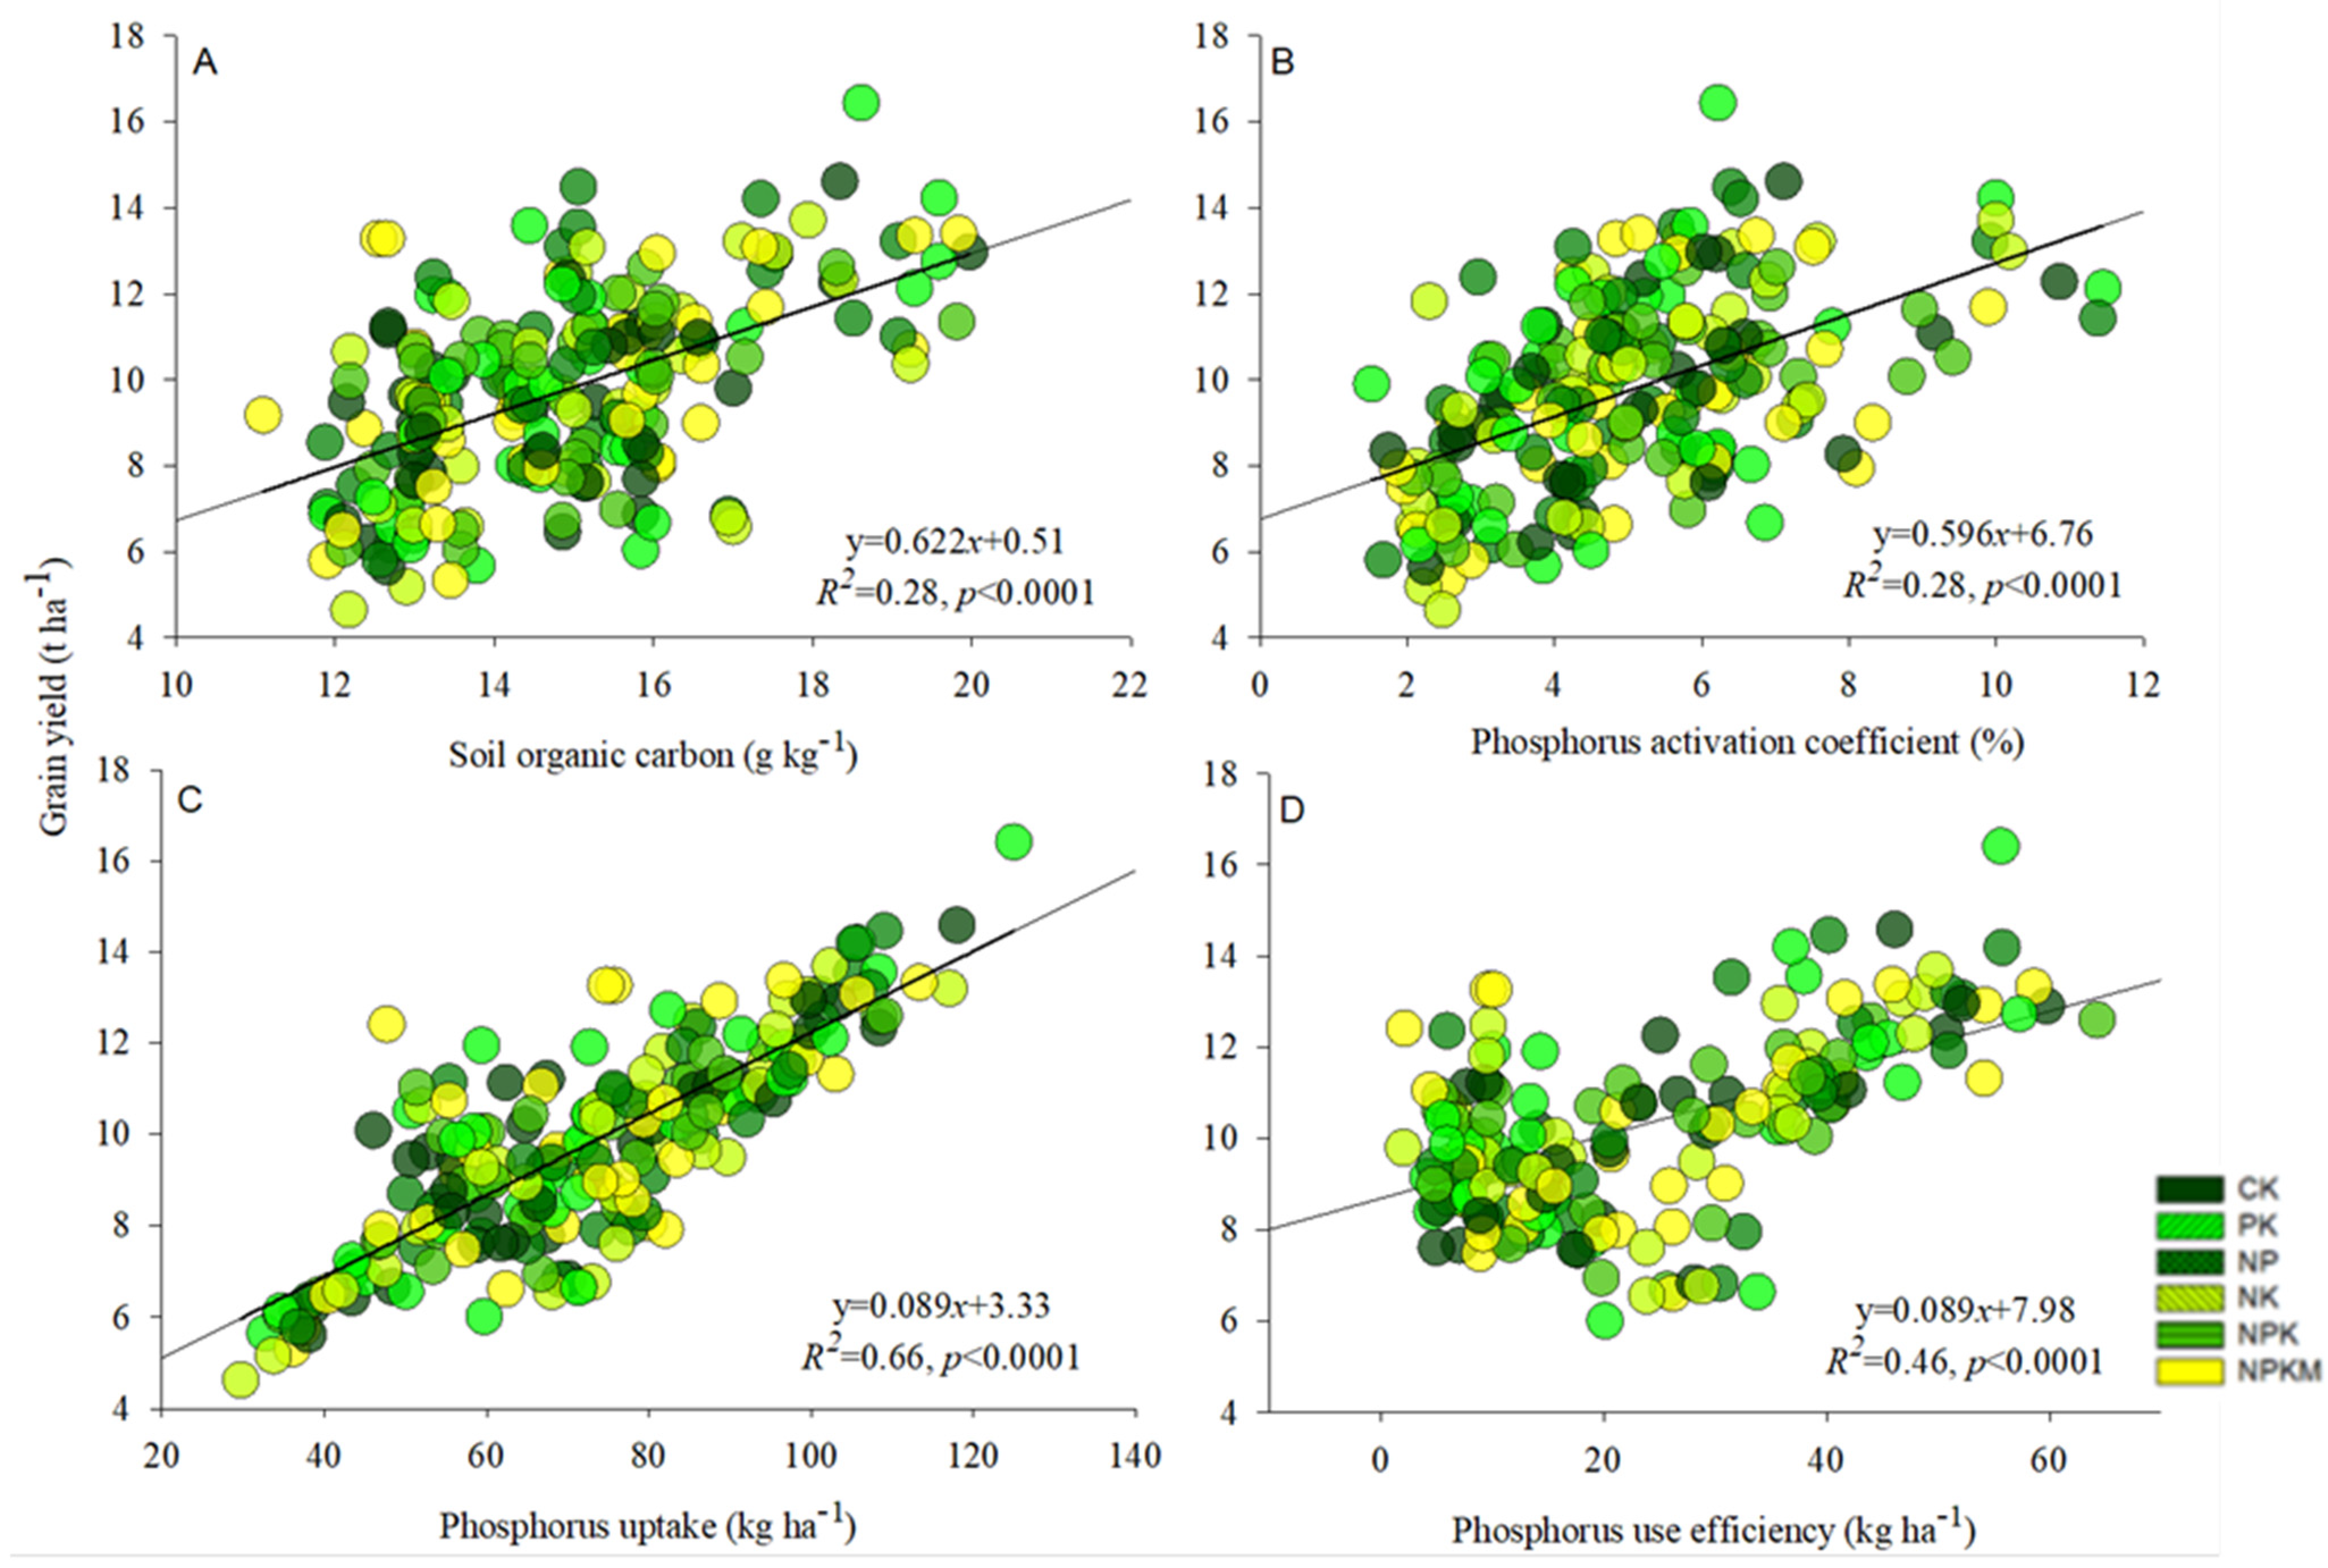
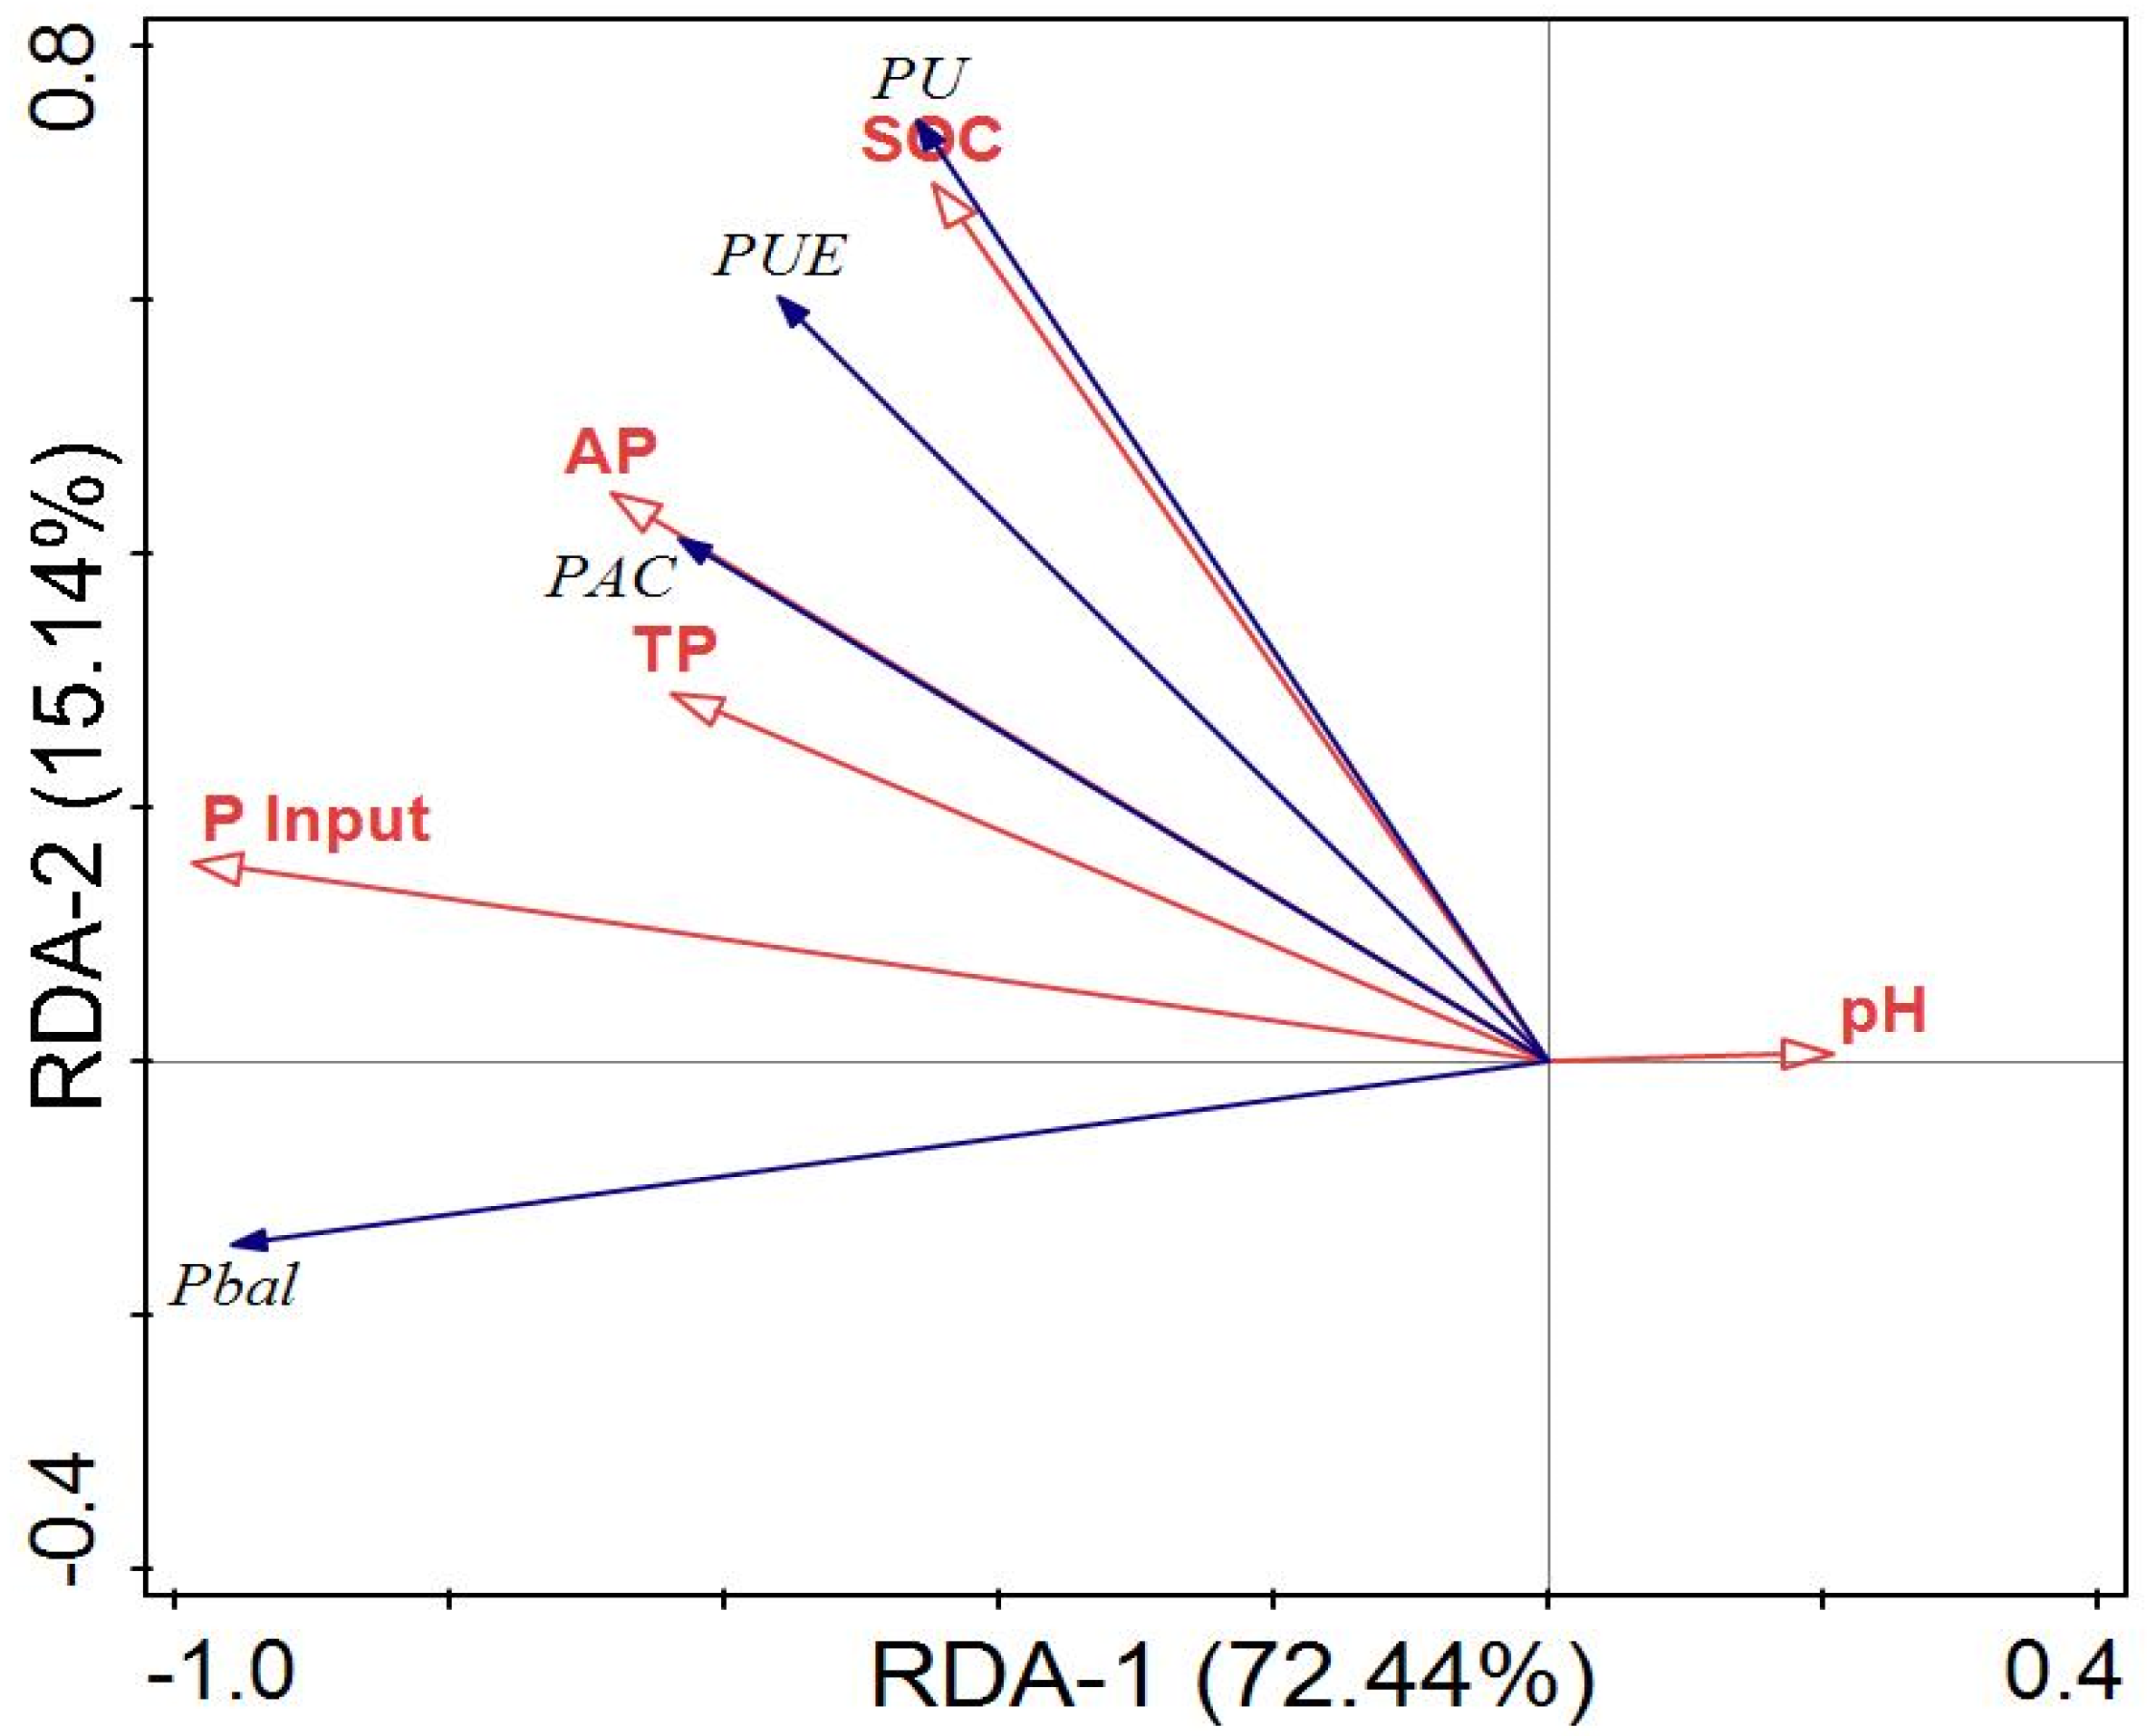
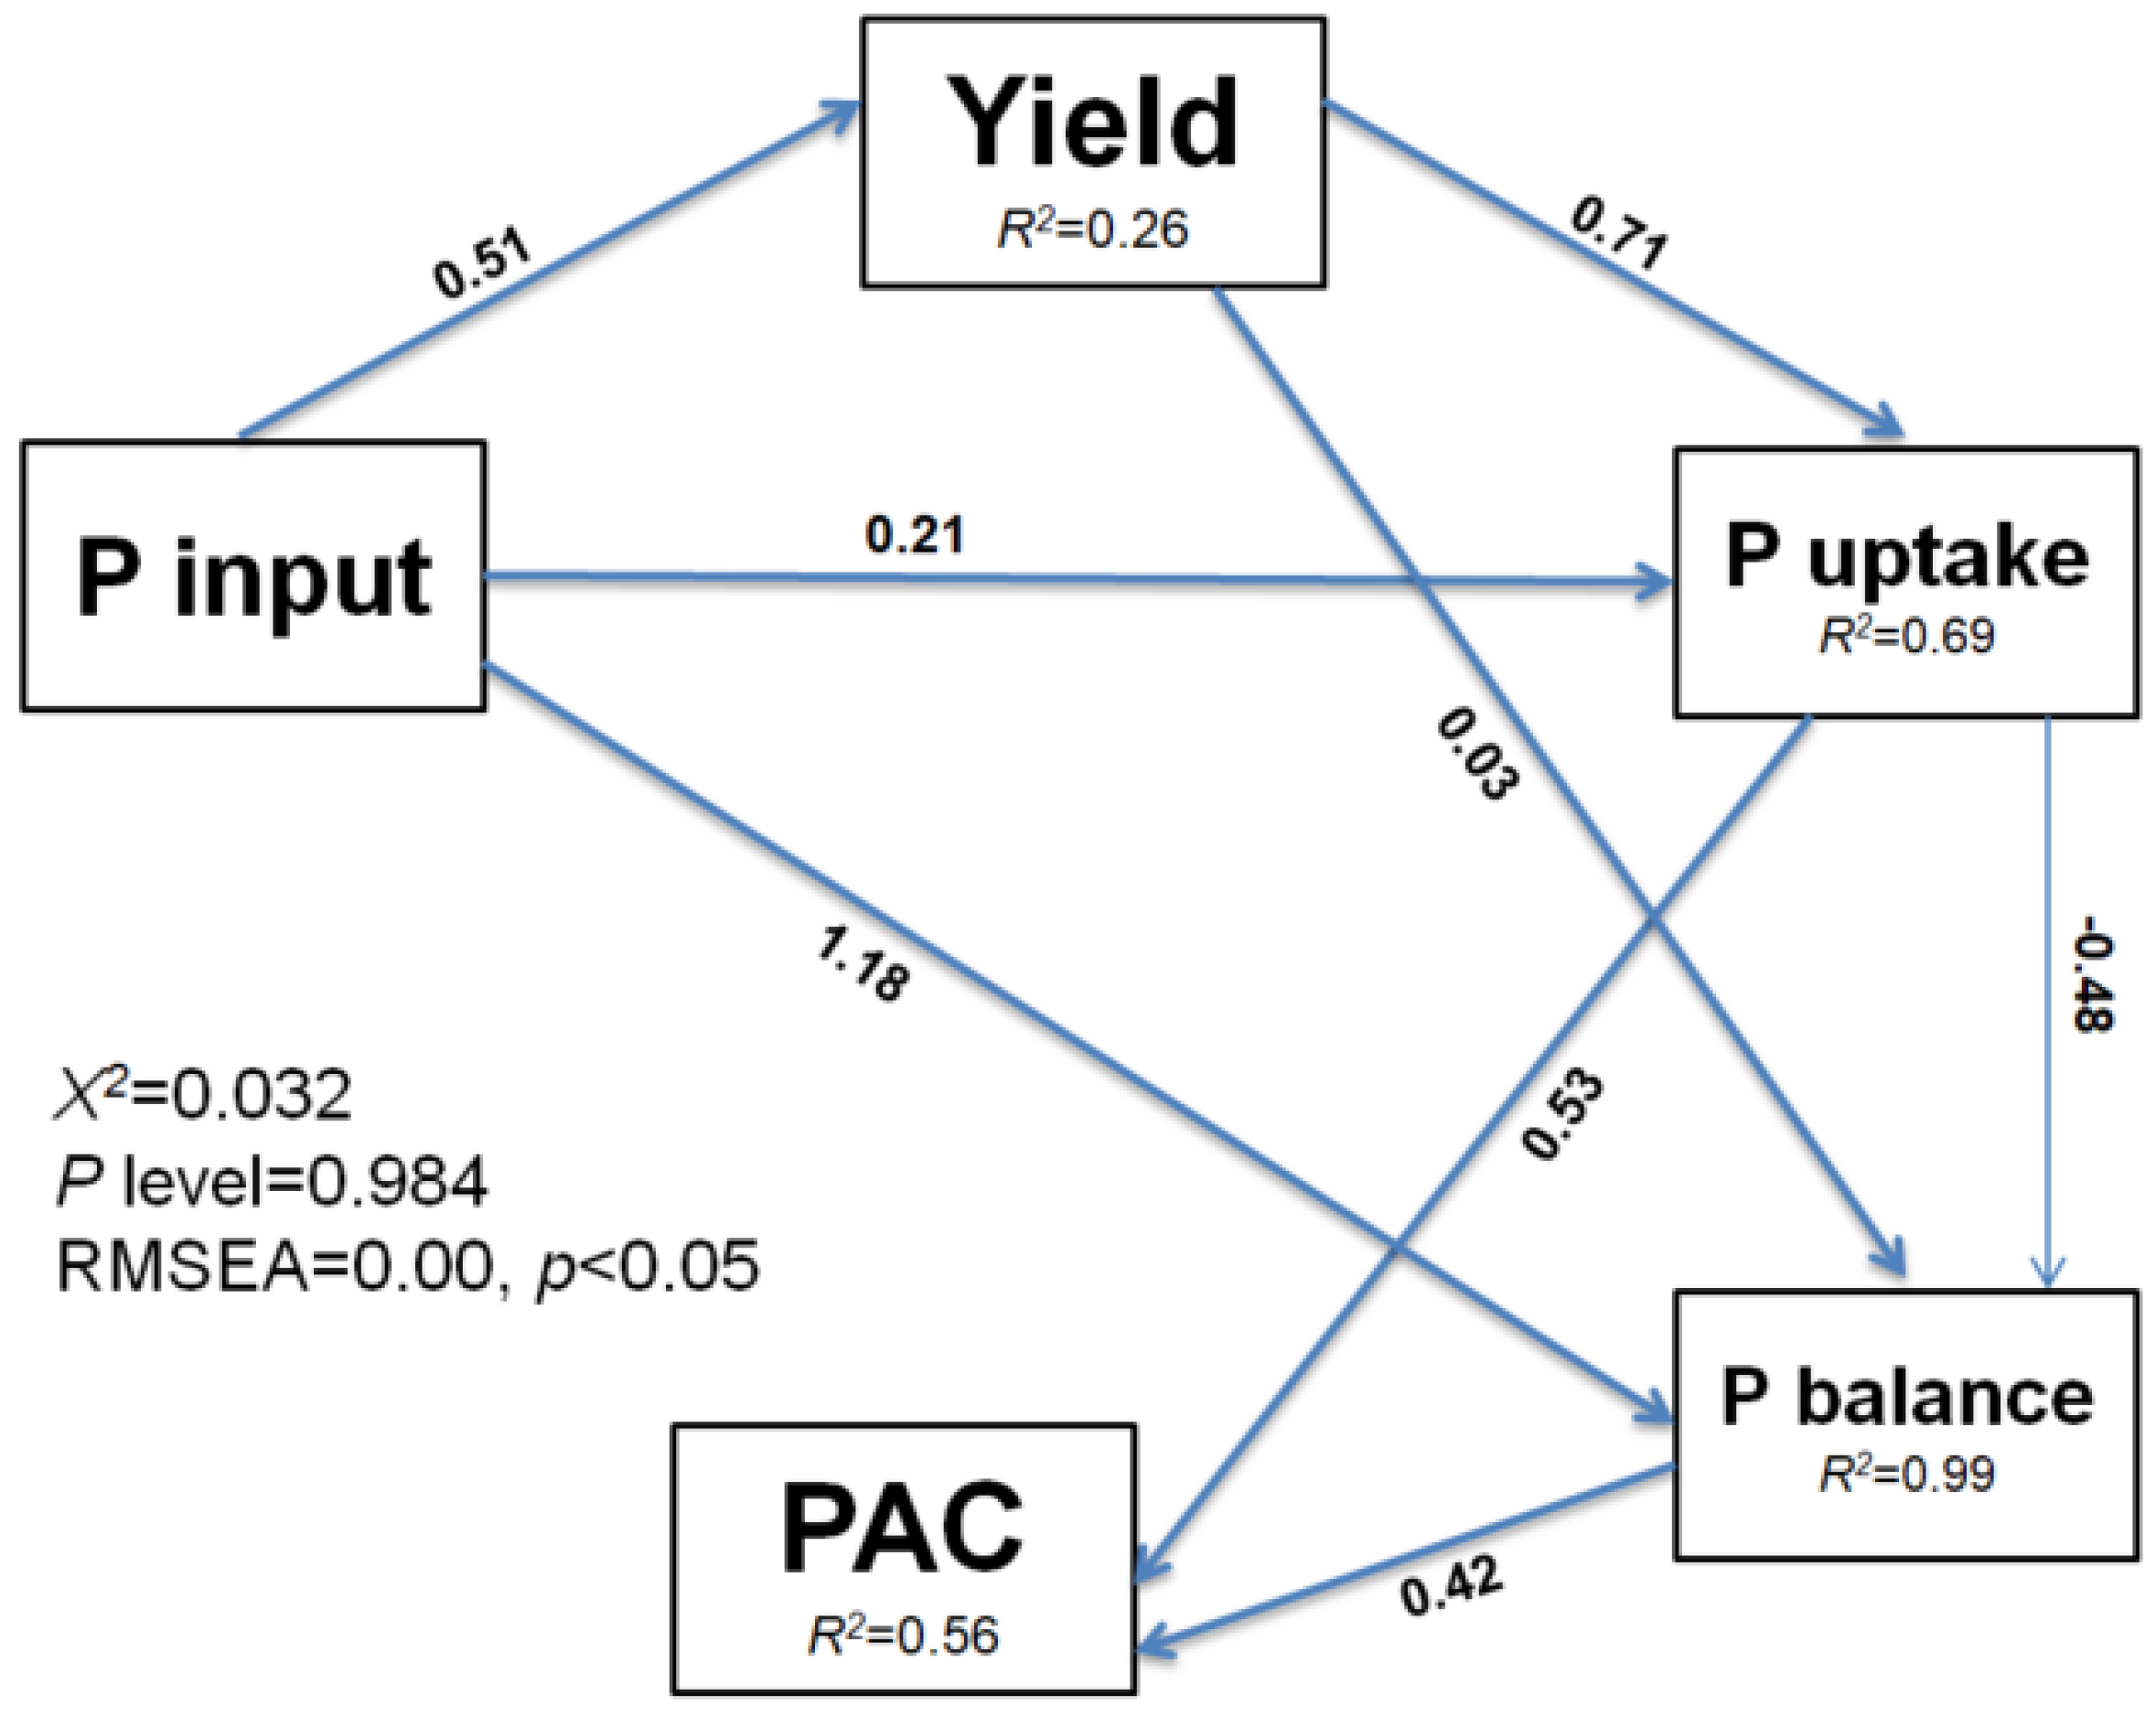
3.3. Relationships among Soil Properties, Rice Yield, and Phosphorus Use Efficiency

Soil total P had a significant (p < 0.0001) and positive relationship with soil organic carbon (R2 = 0.48), phosphorus uptake (R2 = 0.22), apparent phosphorus balance (R2 = 0.32), and phosphorus use efficiency (R2 = 0.37) (Figure 4A–D). The relationship among the rice yield with soil organic carbon content (R2 = 0.28), phosphorus activation coefficient (R2 = 0.28), phosphorus uptake (R2 = 0.66) and phosphorus use efficiency (R2 = 0.46) was significantly (p < 0.0001) positive (Figure 5A–D).
The RDA plot indicates the correlation between soil properties, P input, and P dynamics (Figure 6). Here, soil properties (soil pH, SOC, TP, AP) and P input were taken to be the response variables, whereas PAC, P uptake, APB and PUE were considered to be the explanatory variables. About 72% and 15% of the overall deviations were explained by RDA-1 and RDA-2 ordination axes, respectively. The PAC, P uptake, APB and PUE had significant (p < 0.05) relation with SOC, TP, AP, and P input. Based on the SEM, rice yield, P uptake and APB were directly affected by P inputs (Figure 7). Similarly, P input directly affected P uptake, and P uptake indirectly affected APB and PAC. The rice yield indirectly affected PAC by directly affecting P uptake and APB. The total variance in P uptake (99%) and APB (56%) were explained by SEM analysis. The Linear relationship between humic acid with soil total P, available P, and P activation coefficient was depicted (Figure 8A–C). Similarly, the relationship between acid phosphatase with soil total P, available P, and phosphorus activation coefficient was also indicated (Figure 8D–F).

4. Discussion

4.1. Effect of Different Fertilizations on Soil pH, SOC and Yield of Rice

There was a decrease in the pH of the soil under treatments with chemical P addition, whereas substituting chemical fertilizer with manure increased the pH of the soil (Table 2). Earlier studies revealed that mineral fertilization could promote the acidification of soil [51], whereas co-application of chemical fertilizer with manure can decrease soil acidification via increasing soil pH [52]. Mineral fertilizer can increase soil acidity through the release of protons in the process of nitrification [53]. A different potential mechanism is the net hydrogen (H+) ions released by plants and the release of net excess carboxylic (HCO3) ions and hydroxyl (OH) ions when anions uptake surpassed cations uptake [54]. An increase in the concentration of available calcium (Ca) and magnesium (Mg), Al3+ activity, and H+ concentration can lead decline in P uptake [55]. According to Qaswar et al. [52], mineral N fertilizer can lower the pH of soil by decreasing the concentration of Ca2+, Mg2+ etc., and by fluctuating and shifting soil buffer to Al3+ buffering stage.
The highest soil pH was under NPKM in our results could be due to improved SOC following the disintegration of soil organic matter (SOM). The RDA analysis indicated a substantial and negative association between SOC and soil pH (Figure 6), suggesting that coupled with SOC improvement, the inputs of cations from organic manure could partly be responsible for soil pH increase under NPKM treatment corroborating Qaswar et al. [52]. Manure application was found to increase the pH of soil by improving the supply of base-forming cations (Ca2+, Mg2+ and K+ ions), which compete with acid-forming cations, and via isomorphous substitution, replace base-forming cations from the binding sites [56]. Over the years and regardless of with or without P addition, the highest SOC was under NPKM treatment (Table 2), agreeing with previous findings [57,58]. High C input due to manure addition and turnover of crop residues could possibly explain higher SOC under manure amended treatment. Previous report indicated that C inputs depend on the crop residues (roots and stubbles) return [52]. In our results, the highest yield of rice over the study periods was achieved under NPKM treatment (Table 3), which could partly explain the highest residue return under NPKM, thus the increase in SOC content. High input of organic matter and slow mineralization rate of SOM coupled with the anoxic characteristic of paddy soils could lead to C accumulation [59].
Furthermore, increased SOC and crop yield under NPKM could be ascribed to improvement in the quality of soil, particularly SOC content, soil microbial biomass carbon and carbon-acquiring enzymes [60]. In our result, NPK treatment had relatively similar AP content compared to PK and NP treatments but a higher yield of rice and lower apparent P balance. This indicated a possibility of P mining from other non-available P pools due to balanced fertilization and/or a supply of the available P pool from plant residue returns under NPK. Compared to manure-amended treatment, nearly 62% of P was recuperated under chemical NPK fertilizer by crop uptake in a 35-year study, indicating that a balanced chemical fertilization with P addition can guarantee a higher supply of P for uptake by the roots compared to PK and NP treatments [61]. This explanation can be further strengthened by our results on SYI and CV (Table 3). The sustainable yield index is a measure of crop yield sustainability, whereas a CV is a measure of crop yield stability [58]. It follows that the higher and lower the SYI and CV values, respectively, the more sustainable and stable the crop yield and vice versa. The highest SYI and lowest CV values under NPKM followed by NPK observed in this study are consistent with earlier findings [58]. The increased SYI and reduced CV under NPKM relative to NPK could be due to a reduction in the anthropogenic, biological, and environmental factors on crop yield [57] and reduced risk of crop failure when NPK was applied in combination with organic manure [62].

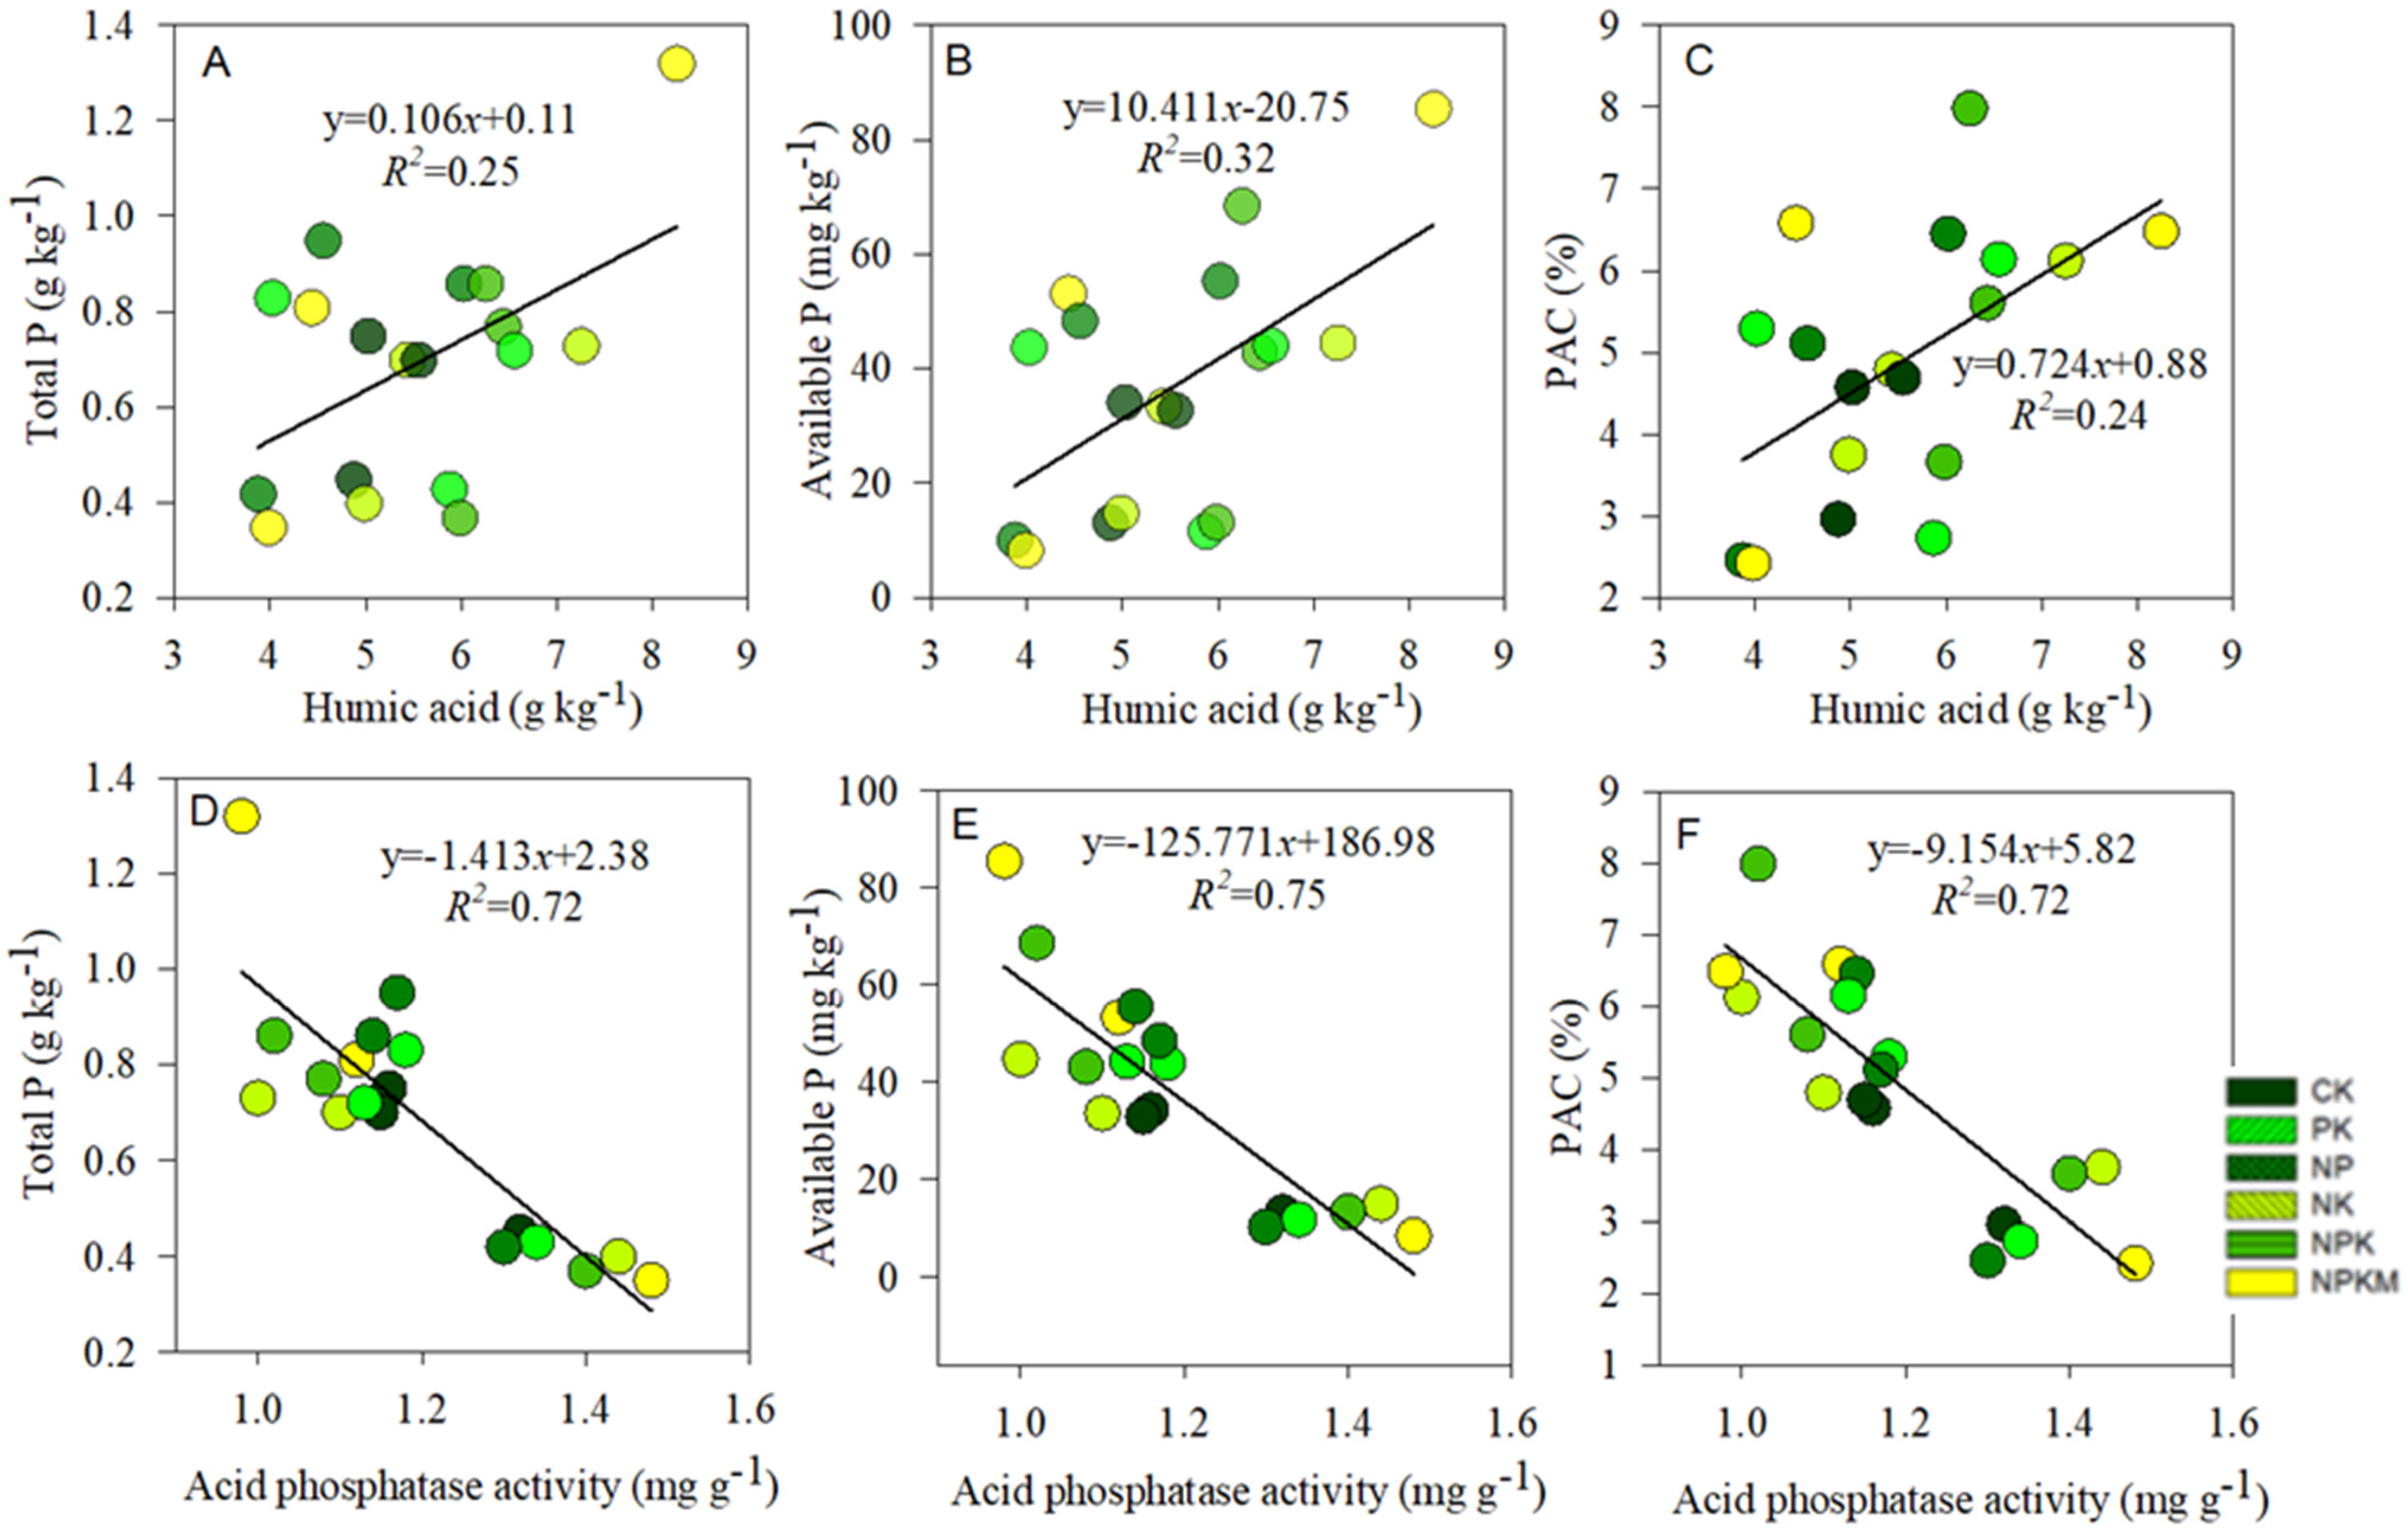
4.2. Effect of Fertilizations on Soil P Availability

The soil TP and AP contents were significantly affected by the different fertilizations, possibly due to differences in P input and changes in the pH of soil and SOC content (Table 2). This result is consistent with earlier studies that ascribed changes in soil P to P input, moisture content, particle size distribution, soil pH, SOC, soil microbial activity, and land use management [35]. The low TP and AP under treatments without P addition are anticipated owing to the lack of P addition and mining of intrinsic soil P for plant uptake. Continuous application of P input can improve soil P reserves. However, these soil P pools could be exhausted due to continuous cultivation without P exogenous P input [63]. Song et al. [64] attributed the reduction in soil labile organic P content to a lack of P inputs. The RDA plot result indicated a negative correlation between soil pH with TP and AP contents (Figure 6), which explains lower TP and AP contents under PK, NP and NPK as a result of increased soil acidity [15,58], fixation of soil P to oxides of Al and Fe [8], increased soluble P pool (H2PO4 and HPO42−) and changes in SOM [13].
Phosphorus deficiency due to long-term cultivation without fertilizer input (CK) and sole application of NK fertilizer could greatly influence P-cycling and reduce available P for plant uptake due to the acidic nature of the soils (Table 2). Reasonable mineral P fertilization can increase soil AP, but this could be limited by soil acidification due to long-term N addition, noting that soil P is subtle to soil acidification [15]. This could possibly explain the lower soil AP under chemical fertilizer alone treatments (especially the NK treatment). Substituting chemical fertilizer with manure considerably increased soil P contents (Table 2), probably due to improved soil pH and enhanced soil quality following the addition of organic matter [60]. A significant increase in soil TP, AP and their stocks were reported under the long-term substitution of chemical fertilizer by organic manure and after the application of farmyard manure for 22 years [24]. The synergic effects of combining chemical fertilizer use with manure can be explained as follows: (i) manure incorporation could serve as physical protection, and (ii) manure addition could prompt mobilization of the inherent soil P [20]. The highest TP and AP contents under NPKM during the periods 1996–2007 and 2008–2018, as compared to other P-added treatments, might be linked to an increase in soil pH following manure addition. Manure as a source of Ca and Mg [54] and as a C-source for soil microbes [63] could help increase soil pH [52,63], mineralized soil organic P content [60], and serve as a source of organic acids to complex and chelate Al and Fe oxides and desorb P [8].
In our results, acid phosphatase activity decreased with an increase in soil TP, AP content, and PAC (Figure 8D–F), suggesting P deficiency under control and NK treatments, hence recording higher AcP. The PAC values were in the order: control (2.72%) < without P (3.26%) < with P (5.82%). It implies that coupled with high soil P contents, treatments with P addition could easily convert TP to AP, thereby increasing PAC as compared to NK and control. Wu et al. [34] reported PAC values lower than 2% in treatments without P addition. In our study, however, PAC ranged from 2 to 3%, probably owing to the differences in the study period and dare need to supply P for plant uptake. The higher PAC under NPKM as compared to other P-added treatments during 1984–2018 could be due to differences in soil pH, SOC, and P input. The effect of SOM content on PAC is via the decay of humified OM and secretion of humic acids, which could impact the adsorption and availability of soil P [65]. Humic acids contain carboxyl (-COOH), hydroxyl (-OH), and phenolic hydroxyl (-C6H5OH) groups that act as hotspots of P adsorption on SOM [65]. We found that TP, AP contents, and PAC values were increased with an increase in humic acid concentrations (Figure 8A–C). Contrary to Wu et al. [34], PAC was significantly influenced by both soil properties and P inputs, possibly due to dissimilarities in soil type, cropping system, location, and duration of the study.
The long-term use of sole chemical P fertilizer and/or in combination with organic manure certainly increases soil TP and AP contents, especially with an increase in fertilization years [66,67]. As a result, the relatively higher concentrations of TP and AP under P-added treatments were justified. Similarly, the higher APB under PK and NP treatments in our study agrees with prior findings [63,66,67]. Accumulation of soil P in the surface layer is principally governed by difficulty in soil P movement owing to the slow diffusion rate of soil P (about 10−12–10−15 m2 s−1), fixation of soil P to minerals and SOM [68]. Earlier studies indicated that Olsen-P and total inorganic-P increased by 3.24 to 7.27 mg kg−1 yr−1 and 21.6 to 39.6 mg kg−1 yr−1, respectively, following a 100 kg ha−1 yr−1 P surplus in the soil. It shows that increases in the concentrations of soil P contents are largely influenced by soil P balance [63,69] and continuous high P fertilization [67]. In our present results, the observed relatively higher TP and AP contents and lower APB (1984–2018) under NPK and NPKM treatments as compared to PK and NP treatments corroborates Garba et al. [63] and could be ascribed to differences in P loss [34] among the treatments. Consistent with Liu et al. [12], manure incorporation could result in a similar or even greater risk of soil P loss as compared to chemical fertilization alone. Excessive P application was reported to increase soil P reserve and alters the quantity of soil AP concentration [70], thereby leading to steady saturation of the soil P buildup and adsorption capability [67] and increasing the danger of eutrophication [71].

4.3. Effect of Fertilizations on P Uptake, Apparent P Balance and P Use Efficiency

Long-term P input significantly influenced P uptake by changing the concentration of soil P contents agreeing with prior studies [30,63]. Manure addition significantly increased soil P contents and P uptake by changing soil properties (Figure 1 and Figure 6). The application of compost was found to enhance soil AP directly by triggering stable soil P mineralization [23]. The P uptake, PUE and rice yield under NPKM and NPK were significantly increased as compared with PK, NP, NK, and control. It shows that balanced fertilization, both as NPK or NPKM, could moderate P accumulation via increasing rice yield, P uptake and PUE. During 1996–2007, the highest P uptake and PUE under NPKM relative to NPK could probably be due to an increase in soil pH and crop yield following manure addition that could have favored crop residue turnover and improved SOC [63]. Previously, low PUE and crop yield under NPK relative to NPKM were ascribed to low SOM, deficiency of macronutrients, and increased soil acidification [58]. Already, manure application was found to increase the pH of soil by improving the supply of Ca2+, Mg2+ and K+ [56].
Phosphorus uptake, PUE, and crop yield can be impacted negatively by the low fertility of the soil, loss of nutrients, low availability of nutrients, and accumulation of soil nutrients [16,20,63]. In this study, NPKM could have alleviated the adverse effects, thereby improving PUE via increasing P uptake and yield of rice [63]. According to Qaswar et al. [16], combining chemical fertilizers with wheat straw can increase PUE by improving P availability and changing soil AcP activity. It shows that higher P uptake and PUE under NPKM in our study could be due to improved P availability and enhanced soil microbial activities [60]. According to Negassa and Leinweber [28], substituting mineral fertilizer with organic manure increased crop yield by enhancing soil quality and other soil properties. In our study, variation in soil APB under different fertilizer treatments could be ascribed to changes in P uptake, PUE (Figure 1 and Figure 3) and changes in soil properties (Table 2). Previous studies attributed changes in PUE and APB under different green manure treatments to variations in soil pH and SOC [35].
The capacity to recover P from applied phosphorus fertilizer resources is referred to as PUE. Phosphorus use efficiency is very crucial for nutrient cycling [30]. The PFPp, Rep, and IEp were significantly higher under NPKM compared to PK, NP and NPK over the years (Table 4). The PUE in a wheat-maize cropping system in China under organic manure application was considerably increased, reaching about 62 percent [30], which was slightly superior to the average 46 percent reported in Europe under a similar P fertilization rate [35]. The higher PFPp values under NPKM could be ascribed to higher crop yields and more efficient utilization of P fertilizer [24]. Similarly, NPK recorded significantly higher PFPp compared to PK and NP over the years (Table 4), implying that balanced chemical NPK fertilization could utilize P resources more efficiently than the imbalanced chemical PK and NP fertilizers. Also, the PFPp was significantly higher when K is missing than when N is missing, suggesting that crop P uptake and PUE could be limited more by N than K. In our study, the actual yield of crop per kilogram crop P uptake (IEp) was higher under the substitution of chemical fertilizer with manure as compared to chemical fertilization alone, corroborating the earlier finding [24].
Over the years, APB in the NK and control treatments was negative (Figure 2), suggesting P deficiency due to the reduction and mining of intrinsic soil P reserves to support plant growth. The APB was positive in the P addition treatments in the order: PK > NP > NPK > NPKM, showing a higher tendency of P buildup under PK and NP treatments than under NPK and NPKM treatments. The higher APB under NPK treatment as compared to NPKM treatment during 1996–2007 (Figure 2) could be ascribed to a concomitant decrease in P uptake and PUE under NPK during the same period [63]. As the P input under P-added treatments was the same, the lower APB under NPKM in our results could be due to high P uptake, PUE and crop yield [63], agreeing with the study by Ahmed et al. [20] who attributed lower APB and higher P uptake under NPKM to improved soil nutrients concentration. Excessive P application and imbalance P rates under substituting chemical fertilizer with manure can lead to surplus P buildup [1,16,20]. Das et al. [72] reported a net P loss (9 kg ha−1 year−1) under control treatment due to P uptake and a net P gain (23–47 kg ha−1 year−1) under P-added treatments either as sole chemical fertilization or chemical fertilizer plus organic manure under long-term wheat-rice rotation.

5. Conclusions

The results of this study showed that in typical subtropical Ferralic Cambisols, the quantity of phosphorus fertilization had surpassed the crop growth requirements, leading to a drastic buildup of soil phosphorus. This is far more alarming under chemical phosphorus fertilizer application. The concentrations of total and available phosphorus in the phosphorus-added treatments were significantly higher than in the control and treatment without phosphorus addition. Substituting 70% of chemical fertilizer use with manure led to higher phosphorus use efficiency and relatively lower apparent phosphorus balance by increasing rice yield and crop phosphorus uptake. The apparent phosphorus balance was higher under chemical fertilization alone than under combined chemical and organic fertilization. This suggests that chemical fertilization alone could be associated with more phosphorus loss to the environment. It is recommended that chemical fertilization alone should be done cautiously. The strength of the relationship between total phosphorus and soil organic carbon suggests that the mineralization of soil organic carbon could change the path of phosphorus cycling through a chemical linkage, where phosphorus could be available for crop uptake. This outcome infers that continuous incorporation of organic manure could increase the risks of surplus phosphorus buildup and loss to the environment. We recommended that manure incorporation into paddy soils should be done cautiously to avert excessive accumulations and loss to the groundwater. Our results suggested that, in addition to the enhancement of soil organic carbon, the inputs of cations from organic manure could partly be responsible for the increase in soil pH, thereby making organic manure substitution for chemical fertilizer a more efficient strategy for increasing PUE and crop yield. Therefore, the mechanistic role of macronutrients to improve phosphorus availability and reduce surplus phosphorus accumulation without penalty on crop yield under different fertilization with manure as the sole application or to replace chemical fertilizers merits future study.

Author Contributions

Conceptualization, N.G.H. and Y.L.; methodology, N.G.H., Y.L., Z.L., H.H., X.L. and J.J.; software, N.G.H., Y.L. and T.H.; validation, N.G.H., Y.L., S.Z. and H.Z.; formal analysis, N.G.H. and Y.L.; investigation, N.G.H., Y.L. and J.H.; resources, N.G.H., Y.L., S.Z., S.S.N. and H.Z.; data curation, N.G.H., Y.L., Z.L., H.H., X.L. and J.J.; writing—original draft preparation, N.G.H. and Y.L.; writing—review and editing, N.G.H., Y.L., S.Z., J.H., T.H., M.N.K., N.A.D., S.S.N. and H.Z.; visualization, N.G.H., Y.L., S.Z. and H.Z.; supervision, S.Z. and H.Z.; project administration, N.G.H., Y.L., S.Z. and H.Z.; funding acquisition, Y.L. and H.Z. All authors have read and agreed to the published version of the manuscript.

Funding

This study was supported by the National Natural Science Foundation of China (41671301); the National Key Research and Development Program of China (2016YFD0300901); and the Central Public-interest Scientific Institution Basal Research Fund (GY2022-13-5; G2022-02-2; G2022-02-3 and G2022-02-10).

Conflicts of Interest

The authors declare no conflict of interest.

References

  1. Zhang, H.; Wang, B.; Xu, M.; Fan, T. Crop yield and soil responses to long-term fertilization on a red soil in Southern China. Pedosphere 2009, 19, 199–207. [Google Scholar] [CrossRef]
  2. Food and Agricultural Organization. FAOSTAT Database; Food and Agricultural Organization: Rome, Italy, 2008. [Google Scholar]
  3. Yan, X.; Yang, W.; Chen, X.; Wang, M.; Wang, W.; Ye, D.; Wu, L. Soil phosphorus pools, bioavailability and environmental risk in response to the phosphorus supply in the red soil of southern China. Int. J. Environ. Res. Public Health 2020, 17, 7384. [Google Scholar] [CrossRef] [PubMed]
  4. Van Nguyen, N.; Ferrero, A. Meeting the challenges of global rice production. Paddy Water Environ. 2006, 4, 1–9. [Google Scholar] [CrossRef]
  5. Lan, Z.M.; Lin, X.J.; Wang, F.; Zhang, H.; Chen, C.R. Phosphorus availability and rice grain yield in a paddy soil in response to long-term fertilization. Biol. Fertil. Soils 2012, 48, 579–588. [Google Scholar] [CrossRef]
  6. National Bureau of Statistics of China. China Statistical Yearbook; China Statistics Press: Beijing, China, 2010. (In Chinese) [Google Scholar]
  7. Peng, S.; Huang, J.; Sheehy, J.E.; Laza, R.C.; Visperas, R.M.; Zhong, X.; Centeno, G.S.; Khush, G.S.; Cassman, K.G. Rice yields decline with higher night temperature from global warming. Proc. Natl. Acad. Sci. USA 2004, 101, 9971–9975. [Google Scholar] [CrossRef] [PubMed]
  8. Dubinsky, E.A.; Silver, W.L.; Firestone, M.K. Tropical forest soil microbial communities couple iron and carbon biogeochemistry. Ecology 2010, 91, 2604–2612. [Google Scholar] [CrossRef]
  9. Dumas, M.; Frossard, E.; Scholz, R.W. Modeling biogeochemical processes of phosphorus for global food supply. Chemosphere 2011, 84, 798–805. [Google Scholar] [CrossRef]
  10. Hayatu, N.G.; Sharu, M.B. Properties and classification of some barren soils of Kalambaina ridge after 25 years of conversion from forest to arable cropland in Kuru-Kuru village, Kware, Sokoto. FUDMA J. Sci. 2020, 4, 430–438. [Google Scholar]
  11. Horta, C.; Roboredo, M.; Carneiro, J.P.; Canatário, A.; Torrent, J.; Sharpley, A. Organic amendments as a source of phosphorus: Agronomic and environmental impact of different animal manures applied to an acid soil. Arch. Agron. Soil Sci. 2018, 64, 257–271. [Google Scholar] [CrossRef]
  12. Liu, Y.; Shi, G.; Mao, L.; Cheng, G.; Jiang, S.; Ma, X.; An, L.; Du, G.; Johnson, N.C.; Feng, H. Direct and indirect influences of 8 year of nitrogen and phosphorus fertilization on Glomeromycota in an Alpine Meadow ecosystem. New Phytol. 2012, 194, 523–535. [Google Scholar] [CrossRef]
  13. Lu, X.; Mahdi, A.K.; Han, X.; Chen, X.; Yan, J.; Biswas, A. Long-term application of fertilizer and manures affect P fractions in Mollisol. Sci. Rep. 2020, 10, 14793. [Google Scholar] [CrossRef] [PubMed]
  14. Ayaga, G.; Todd, A.; Brookes, P.C. Enhanced biological cycling of phosphorus increases its availability to crops in low-input sub-Saharan farming systems. Soil Biol. Biochem. 2006, 38, 81–90. [Google Scholar] [CrossRef]
  15. Moir, J.; Jordan, P.; Moot, D.; Lucas, R. Phosphorus response and optimum pH ranges of twelve pasture legumes grown in an acid upland New Zealand soil under glasshouse conditions. J. Soil Sci. Plant Nutr. 2016, 16, 438–460. [Google Scholar] [CrossRef]
  16. Qaswar, M.; Huang, J.; Ahmed, W.; Li, D.; Liu, S.; Zhang, L.; Cai, A.; Liu, L.; Xu, Y.; Gao, J.; et al. Yield sustainability, soil organic carbon sequestration and nutrients balance under long-term combined application of manure and inorganic fertilizers in acidic paddy soil. Soil Tillage Res. 2020, 198, 104569. [Google Scholar] [CrossRef]
  17. Waldrip, H.M.; He, Z.; Erich, M.S. Effects of poultry manure amendment on phosphorus uptake by ryegrass, soil phosphorus fractions and phosphatase activity. Biol. Fertil. Soils 2011, 47, 407–418. [Google Scholar] [CrossRef]
  18. Omara, P.; Macnack, N.; Aula, L.; Raun, B. Effect of long-term beef manure application on soil test phosphorus, organic carbon, and winter wheat yield. J. Plant Nutr. 2017, 40, 1143–1151. [Google Scholar] [CrossRef]
  19. Mohanty, S.; Kumar, N.; Rajan, A.R. Availability and uptake of phosphorus from organic manures in groundnut (Arachis hypogea L.)–corn (Zea mays L.) sequence using radio tracer technique. Geoderma 2006, 133, 225–230. [Google Scholar] [CrossRef]
  20. Ahmed, W.; Huang, J.; Liu, K.; Qaswar, M.; Khan, M.N.; Chen, J.; Sun, G.; Huang, Q.; Liu, Y.; Liu, G.; et al. Changes in phosphorus fractions associated with soil chemical properties under long-term organic and inorganic fertilization in paddy soils of southern China. PLoS ONE 2019, 14, e0216881. [Google Scholar] [CrossRef] [PubMed]
  21. Shen, J.; Cui, Z.; Miao, Y.; Mi, G.; Zhang, H.; Fan, M.; Zhang, C.; Jiang, R.; Zhang, W.; Li, H.; et al. Transforming agriculture in China: From solely high yield to both high yield and high resource use efficiency. Glob. Food Sec. 2013, 2, 1–8. [Google Scholar] [CrossRef]
  22. El Sheikha, A.F. Mixing manure with chemical fertilizers, why? And what is after? Nutr. Food Technol. 2016, 2, 1–5. [Google Scholar] [CrossRef]
  23. Xin, X.L.; Qin, S.W.; Zhang, J.B.; Zhu, A.N.; Zhang, C.Z. Dynamics of phosphorus in Fluvo-aquic soil under long-term fertilization. J. Plant Nutr. Fertil. 2015, 21, 1514–1521. (In Chinese) [Google Scholar]
  24. Mitran, T.; Mani, P.K. Effect of organic amendments on rice yield trend, phosphorus use efficiency, uptake, and apparent balance in soil under long-term rice-wheat rotation. J. Plant Nutr. 2017, 40, 1312–1322. [Google Scholar] [CrossRef]
  25. Anthonio, C.K.; Huang, J.; Chen, J.; Khan, M.N.; Du, J.; Garba, H.N.; Li, D.; Liu, G.; Liu, S.; Liu, L.; et al. Impact of long-term fertilization on phosphorus fractions and manganese oxide with their interactions in paddy soil aggregates. J. Environ. Manag. 2023, 333, 117440. [Google Scholar] [CrossRef] [PubMed]
  26. Horta, C.; Carneiro, J.P. Phosphorus losses to surface runoff waters after application of digestate to a soil over fertilised with phosphorus. Water Air Soil Pollut. 2021, 232, 439. [Google Scholar] [CrossRef]
  27. Pizzeghello, D.; Berti, A.; Nardi, S.; Morari, F. Phosphorus forms and P-sorption properties in three alkaline soils after long-term mineral and manure applications in north-eastern Italy. Agric. Ecosyst. Environ. 2011, 141, 58–66. [Google Scholar] [CrossRef]
  28. Negassa, W.; Leinweber, P. How does the Hedley sequential phosphorus fractionation reflect impacts of land use and management on soil phosphorus: A review. J. Plant Nutr. Soil Sci. 2009, 172, 305–325. [Google Scholar] [CrossRef]
  29. Wang, F.; Sims, J.T.; Ma, L.; Ma, W.; Dou, Z.; Zhang, F. The phosphorus footprint of China’s food chain: Implications for food security, natural resource management, and environmental quality. J. Environ. Qual. 2011, 40, 1081–1089. [Google Scholar] [CrossRef]
  30. Xin, X.; Qin, S.; Zhang, J.; Zhu, A.; Yang, W.; Zhang, X. Yield, phosphorus use efficiency and balance response to substituting long-term chemical fertilizer use with organic manure in a wheat-maize system. Field Crops Res. 2017, 208, 27–33. [Google Scholar] [CrossRef]
  31. Huang, J.; Zhou, L.; Liu, S.; Han, T.; Hayatu, N.G.; Li, D.; Zhang, S.; Wang, B.; Zhang, H. Vertical distribution of phosphorus fractions and the environmental critical phosphorus level in acidic red soil under long-term fertilizer and lime application in southern China. J. Plant Nutr. Soil Sci. 2021, 184, 585–595. [Google Scholar] [CrossRef]
  32. Nair, V.D. Soil phosphorus saturation ratio for risk assessment in land use systems. Front. Environ. Sci. 2014, 10, 2–6. [Google Scholar] [CrossRef]
  33. Smith, L.E.D.; Siciliano, G. A comprehensive review of constraints to improved management of fertilizers in China and mitigation of diffuse water pollution from agriculture. Agric. Ecosyst. Environ. 2015, 209, 15–25. [Google Scholar] [CrossRef]
  34. Wu, Q.; Zhang, S.; Zhu, P.; Huang, S.; Wang, B.; Zhao, L.; Xu, M. Characterizing differences in the phosphorus activation coefficient of three typical cropland soils and the influencing factors under long-term fertilization. PLoS ONE 2017, 12, e0176437. [Google Scholar] [CrossRef] [PubMed]
  35. Blake, L.; Mercik, S.; Koerschens, M.; Moskal, S.; Poulton, P.R.; Goulding, K.W.T.; Weigel, A.; Powlson, D.S. Phosphorus content in soil, uptake by plants and balance in three European long-term field experiments. Nutr. Cycl. Agroecosyst. 2000, 56, 263–275. [Google Scholar] [CrossRef]
  36. Zhao, B.Q.; Li, X.Y.; Li, X.P.; Shi, X.J.; Huang, S.M.; Wang, B.R.; Zhu, P.; Yang, X.Y.; Liu, H.; Chen, Y.; et al. Long-term fertilizer experiment network in China: Crop yields and soil nutrient trends. Agron. J. 2010, 102, 216–230. [Google Scholar] [CrossRef]
  37. Food and Agriculture Organization of the United Nations (FAO). World Reference Base for Soil Resources 2014: International Soil Classification Systems for Naming Soils and Creating Legends for Soil Maps (Updated 2015); World Soil Resources Reports No. 106; FAO: Rome, Italy, 2015. [Google Scholar]
  38. Murphy, J.A.; Riley, J.P. A modified single solution method for the determination of phosphate in natural waters. Anal. Chim. Acta 2002, 27, 31–36. [Google Scholar] [CrossRef]
  39. Faithfull, N.T. Methods in Agricultural Chemical Analysis: A Practical Handbook; CABI Publishing: Wallingford, UK, 2002; pp. 57–104. [Google Scholar]
  40. DeForest, J.L. The influence of time, storage temperature, and substrate age on potential soil enzyme activity in acidic forest soils using MUB-linked substrates and L-DOPA. Soil Biol. Biochem. 2009, 41, 1180–1186. [Google Scholar] [CrossRef]
  41. Sparks, D.; Page, A.; Helmke, P.; Loeppert, R. Methods of Soil Analysis. Part 3. Chemical Methods; Soil Science Society of America: Madison, WI, USA, 1996. [Google Scholar]
  42. Lu, R.K. Analytical Methods for Soil and Agricultural Chemistry; China Agricultural Science and Technology Press: Beijing, China, 1999. (In Chinese) [Google Scholar]
  43. Qaswar, M.; Ahmed, W.; Huang, J.; Fan, H.; Shi, X.; Jiang, X.; Liu, K.; Xu, Y.; He, Z.; Asghar, W.; et al. Soil carbon (C), nitrogen (N) and phosphorus (P) stoichiometry drives phosphorus lability in paddy soil under long-term fertilization: A fractionation and path analysis study. PLoS ONE 2019, 14, e0218195. [Google Scholar] [CrossRef] [PubMed]
  44. Tiessen, H.; Moir, J. Characterization of Available P by Sequential Extraction. In Soil Sampling and Methods of Analysis; Carter, M.R., Gregorich, E.G., Eds.; CRC Press: Boca Raton, FL, USA, 2008; pp. 293–306. [Google Scholar]
  45. The Organization for Economic Cooperation and Development (OECD). OECD Multilingual Summaries OECD Compendium of Agri-Environmental Indicators; OECD: Paris, France, 2021; ISBN 978-92-64-186217. [Google Scholar]
  46. Ouyang, W.; Li, Z.; Liu, J.; Guo, J.; Fang, F.; Xiao, Y.; Lu, L. Inventory of apparent nitrogen and phosphorus balance and risk of potential pollution in typical sloping cropland of purple soil in China- A case study in the Three Gorges Reservoir region. J. Ecol. Eng. 2017, 106, 620–628. [Google Scholar] [CrossRef]
  47. Pavinato, P.S.; Rodrigues, M.; Solthangheisi, A.; Sartor, L.R.; John, P.; Withers, A. Effects of cover crops and phosphorus sources on maize yield, phosphorus uptake, and phosphorus use efficiency. Agron. J. 2017, 109, 1039–1047. [Google Scholar] [CrossRef]
  48. Duan, Y.; Xu, M.; He, X.; Li, S.; Sun, X. Long-term pig manure application reduces the requirement of chemical phosphorus and potassium in two rice–wheat sites in subtropical China. Soil Use Manag. 2011, 27, 427–436. [Google Scholar] [CrossRef]
  49. Smith, R.G.; Menalled, F.D.; Robertson, G.P. Temporal yield variability under conventional and alternative management systems. Agron. J. 2007, 69, 1629–1634. [Google Scholar] [CrossRef]
  50. Singh, P.R.; Rao, D.S.K.; Bhaskarrao, U.M.; Ready, M.N. Sustainability Index under Different Management: Annual Report; CRIDA Report; CRIDA: Hyderabad, India, 1990; 106p. [Google Scholar]
  51. Schroder, J.L.; Zhang, H.; Girma, K.; Raun, W.R.; Penn, C.J.; Payton, M.E. Soil acidification from long-term use of nitrogen fertilizers on winter wheat. Soil Sci. Soc. Am. J. 2011, 75, 957–964. [Google Scholar] [CrossRef]
  52. Qaswar, M.; Dongchu, L.; Huang, J.; Tianfu, H.; Ahmed, W.; Muhammad, A.; Zhang, L.; Du, J.; Khan, Z.H.; Sami, U.; et al. Interaction of liming and long-term fertilization increased crop yield and phosphorus use efficiency (PUE) through mediating exchangeable cations in acidic soil under wheat–maize cropping system. Sci. Rep. 2020, 10, 19828. [Google Scholar] [CrossRef] [PubMed]
  53. Bouwman, A.F.; van Vuuren, D.P.; Derwent, R.G.; Posch, M. A global analysis of acidification and eutrophication of terrestrial ecosystems. Water Air Soil Pollut. 2002, 141, 349–382. [Google Scholar] [CrossRef]
  54. Tang, C.; Conyers, M.K.; Nuruzzaman, M.; Poile, G.J.; De, L.L. Biological amelioration of subsoil acidity through managing nitrate uptake by wheat crops. Plant Soil 2011, 338, 383–397. [Google Scholar] [CrossRef]
  55. Foy, C.D. Physiological effects of hydrogen, aluminum, and manganese toxicities in acid soil. Soil Acidity Liming 2015, 12, 57–97. [Google Scholar] [CrossRef]
  56. Han, T.; Cai, A.; Liu, K.; Huang, J.; Wang, B.; Li, D.; Qaswar, M.; Feng, G.; Zhang, H. The links between potassium availability and soil exchangeable calcium, magnesium, and aluminum are mediated by lime in acidic soil. J. Soils Sediments 2019, 19, 1382–1392. [Google Scholar] [CrossRef]
  57. Chen, H.; Deng, A.; Zhang, W.; Li, W.; Qiao, Y.; Yang, T.; Zheng, C.; Cao, C.; Chen, F. Long-term inorganic plus organic fertilization increases yield and yield stability of winter wheat. Crop J. 2018, 6, 589–599. [Google Scholar] [CrossRef]
  58. Han, X.; Hu, C.; Chen, Y.; Qiao, Y.; Liu, D.; Fan, J.; Li, S. Crop yield stability and sustainability in a rice-wheat cropping system based on 34-year field experiment. Eur. J. Agron. 2020, 113, 125965. [Google Scholar] [CrossRef]
  59. Dawe, D.; Dobermann, A.; Ladha, J.K.; Yadav, R.L.; Bao, L.; Gupta, R.K.; Lal, P.; Panaullah, G.; Sariam, O.; Singh, Y.; et al. Do organic amendments improve yield trends and profitability in intensive rice systems? Field Crops Res. 2003, 83, 191–213. [Google Scholar] [CrossRef]
  60. Akhtar, K.; Wang, W.; Ren, G.; Khan, A.; Feng, Y.; Yang, G. Changes in soil enzymes, soil properties, and maize crop productivity under wheat straw mulching in Guanzhong, China. Soil Tillage Res. 2018, 182, 94–102. [Google Scholar] [CrossRef]
  61. Lu, Y.; Gao, Y.; Nie, J.; Liao, Y.; Zhu, Q. Substituting chemical P fertilizer with organic manure: Effects on double-rice yield, phosphorus use effeciency and balance in subtropical China. Sci. Rep. 2021, 11, 8629. [Google Scholar] [CrossRef] [PubMed]
  62. Macholdt, J.; Piepho, H.; Honermeier, B. Mineral NPK and manure fertilisation affecting the yield stability of winter wheat: Results from a long-term field experiment. Eur. J. Agron. 2019, 102, 14–22. [Google Scholar] [CrossRef]
  63. Garba, H.N.; Liu, Y.; Zhang, S.; Liu, K.; Huang, J.; Lv, Z.; Hou, H.; Lan, X.; Ji, J.; Han, T.; et al. Long-Term Effect of Fertilizations on Yield Sustainability, Soil Organic Carbon Sequestration and Apparent Phosphorus Balance in Acidic Paddy Soil. J. Soil Sci. Plant Nutr. 2022, 22, 4282–4298. [Google Scholar] [CrossRef]
  64. Song, C.; Han, X.Z.; Tang, C. Changes in phosphorus fractions, sorption and release in Udic Mollisols under different ecosystems. Biol. Fertil. Soils 2007, 44, 37–47. [Google Scholar] [CrossRef]
  65. Lin, J.; Zhang, Z.; Zhan, Y. Effect of humic acid preloading on phosphate adsorption onto zirconium-modified zeolite. Environ. Sci. Pollut. Res. 2017, 24, 12195–12211. [Google Scholar] [CrossRef] [PubMed]
  66. Li, Z.G.; Zhang, R.H.; Liu, C.; Zhang, R.Q.; Chen, F.; Liu, Y. Phosphorus spatial distribution and pollution risk assessment in agricultural soil around the Danjiangkou reservoir, China. Sci. Total Environ. 2020, 699, 134417. [Google Scholar] [CrossRef] [PubMed]
  67. Chen, X.; Yan, X.; Wang, M.; Cai, Y.; Weng, X.; Su, D.; Guo, J.; Wang, W.; Hou, Y.; Ye, D.; et al. Long-term excessive phosphorus fertilization alters soil phosphorus fractions in the acidic soil of pomelo orchards. Soil Tillage Res. 2022, 215, 105214. [Google Scholar] [CrossRef]
  68. Astiko, W.; Ernawati, N.M.L.; Silawibawa, I.P. Nutrient concentration of nitrogen and phosphorus on intercropping of several varieties maize and soybean in dryland North Lombok, Indonesia. IOP Conf. Ser. Earth Environ. Sci. 2021, 824, 012001. [Google Scholar] [CrossRef]
  69. Huang, S.H.; Xu, H.B.; Shang, D.; Liu, J.Z.; Tang, Q.J.; Liu, R.X. Phosphorus fractions and release factors in surface sediments of a Tailwater River in Xinmi City, a case study. Sustainability 2021, 13, 5417. [Google Scholar] [CrossRef]
  70. Zhang, W.; Wang, Q.; Wu, Q.; Zhang, S.; Zhu, P.; Peng, C.; Huang, S.; Wang, B.; Zhang, H. The response of soil Olsen-P to the P budgets of three typical cropland soil types under long-term fertilization. PLoS ONE 2020, 15, e0230178. [Google Scholar] [CrossRef] [PubMed]
  71. Li, B.Z.; Gunian, A.N.; Zhran, M.; Davey, L.J.; Paul, W.H.; Hu, Y.J.; Tida, G.; Wu, J.S. Fate of low-molecular-weight organic phosphorus compounds in the P-rich and P-poor paddy soils. J. Integr. Agric. 2021, 20, 2526–2534. [Google Scholar] [CrossRef]
  72. Das, A.; Sharma, R.P.; Chattopadhyaya, N.; Rakshit, R. Yield trends and nutrient budgeting under a long-term (28 years) nutrient management in rice–wheat cropping system under subtropical climatic condition. Plant Soil Environ. 2014, 60, 351–357. [Google Scholar] [CrossRef]
Figure 1. Variations in the distribution of P uptake (A,B) in response to various treatments. CK (control); PK (synthetic phosphorus and potassium fertilizer); NP (synthetic nitrogen and P fertilizer); NK fertilizer, synthetic NPK fertilizer and NPKM (30% synthetic NPK fertilizer plus 70% organic manure). Tukey’s HSD test shows that means separated by various lowercase letters differ considerably (p < 0.05). The bars represent the standard error (n = 3).
Agronomy 13 01440 g001
Figure 2. Variation in the distribution of apparent phosphorus (P) balances (A,B) in response to various treatments. CK (control); PK (synthetic phosphorus and potassium fertilizer); NP (synthetic nitrogen and P fertilizer); NK fertilizer, synthetic NPK fertilizer and NPKM (30% synthetic NPK fertilizer plus 70% organic manure). Tukey’s HSD test shows that means separated by various lowercase letters differ considerably (p < 0.05). The bars represent the standard error (n = 3).
Agronomy 13 01440 g002
Figure 3. Variation in the distribution of phosphorus (P) use efficiency (AD) under long-term fertilization. PK (synthetic phosphorus and potassium fertilizer); NP (synthetic nitrogen and P fertilizer); synthetic NPK fertilizer and NPKM (30% synthetic NPK fertilizer plus 70% organic manure). Tukey’s HSD test shows that means separated by various lowercase letters differ considerably (p < 0.05). The bars represent the standard error (n = 3). In the boxes, the black and red lines reflect the mean and median values, respectively. The upper and lower whiskers’ black dots (BD) represent the 95th and 5th percentile values, respectively.
Agronomy 13 01440 g003
Figure 4. Linear association between total P and soil organic carbon (A), total P and P uptake (B), total P and apparent P balance (C), and total P and P use efficiency (D) in acidic paddy soil after long-term fertilization.
Agronomy 13 01440 g004
Figure 5. Linear relationship between grain yield and soil organic carbon (A), grain yield and phosphorus activation coefficient (B), grain yield and phosphorus uptake (C), and grain yield and phosphorus use efficiency (D) in acidic paddy soil after long-term fertilization.
Agronomy 13 01440 g005
Figure 6. RDA plot demonstrating the link between soil characteristics and phosphorus dynamics. P input, annual phosphorus input; SOC, soil organic carbon; TP, total phosphorus input; AP, available phosphorus input; PAC, P activation coefficient; PU, phosphorus uptake; P bal, phosphorus balance; PUE, phosphorus utilization efficiency. The red lines represent the response variables, while the blue lines represent the explanatory variables.
Agronomy 13 01440 g006
Figure 7. The direct and indirect impacts of P input on crop yield and PAC are depicted using a structural equation model (SEM). The explained variance is represented by the numbers next to the endogenous variables. The standardized path coefficients are represented by the numbers next to the arrows. A solid blue line path implies a significant positive influence; a light blue line path suggests a significant negative effect. P stands for phosphorus; PAC stands for phosphorus activation coefficient; X2, Chi-square, and P level stands for probability level (%).
Agronomy 13 01440 g007
Figure 8. Humic acid shows a linear relationship with (A) total P, (B) available P, and (C) phosphorus activation coefficient (PAC); acid phosphatase shows a linear relationship with (D) total P, (E) available P, and (F) P activation coefficient.
Agronomy 13 01440 g008
Table 1. Annual application rates of net nutrients in the different treatments (kg ha−1) under the rice–rice cropping system (1984–2018).
TreatmentEarly Rice (kg ha−1)Late Rice (kg ha−1)
NitrogenPhosphorusPotassiumNitrogenPhosphorusPotassium
CK000000
PK060150060150
NP150600180600
NK15001501800150
NPK1506015018060150
NPKM46 + 10433 + 2771 + 7954 + 12610 + 504 + 146
The first and second values within the columns represent the amount of N, P, and K supplied as inorganic and organic fertilizers, respectively. Milk vetch and pig dung were the organic manures used during the early and late rice seasons, respectively. CK (control); PK (synthetic phosphorus and potassium fertilizer); NP (synthetic nitrogen and P fertilizer); NK fertilizer, synthetic NPK fertilizer and NPKM (30% synthetic NPK fertilizer plus 70% organic manure).
Table 2. Soil pH, soil organic carbon (SOC), total phosphorus (TP), available phosphorus (AP) and phosphorus activation coefficient (PAC) under different long-term fertilizations in double-rice cropping systems (1984–2018).
YearTreatmentSoil pHSOC (g kg−1)TP (g kg−1)AP (mg kg−1)PAC (%)
Initial 6.514.90.4920.84.24
1984–1995CK6.5 ± 0.53 a13.1 ± 0.85 c0.45 ± 0.05 b13.3 ± 3.16 c2.96 ± 0.71 d
PK6.2 ± 0.24 c13.7 ± 1.11 c0.70 ± 0.11 a33.6 ± 6.34 b4.79 ± 0.76 b
NP6.2 ± 0.33 c15.4 ± 1.17 b0.75 ± 0.15 a34.3 ± 6.36 b4.57 ± 0.51 b
NK6.0 ± 0.38 d14.5 ± 1.22 bc0.40 ± 0.08 b15.0 ± 2.51 c3.75 ± 0.63 c
NPK6.4 ± 0.46 b15.6 ± 0.56 b0.70 ± 0.09 a32.9 ± 5.24 b4.69 ± 0.69 b
NPKM6.6 ± 0.38 a16.6 ± 1.18 a0.73 ± 0.12 a44.7 ± 12.81 a6.12 ± 1.64 a
1996–2007CK6.5 ± 0.20 a12.4 ± 0.63 cd0.43 ± 0.07 c11.8 ± 1.81 c2.73 ± 0.58 f
PK5.5 ± 0.11 b13.2 ± 0.51 c0.77 ± 0.05 ab43.1 ± 5.21 b5.60 ± 0.60 c
NP5.4 ± 0.16 c15.1 ± 1.06 b0.83 ± 0.10 a43.9 ± 8.77 b5.29 ± 0.80 d
NK5.5 ± 0.21 c13.9 ± 1.11 c0.37 ± 0.09 c13.4 ± 1.19 c3.66 ± 1.42 e
NPK5.6 ± 0.18 b15.5 ± 0.69 b0.72 ± 0.06 b44.2 ± 4.38 b6.14 ± 0.43 b
NPKM6.7 ± 0.19 a18.0 ± 1.02 a0.86 ± 0.14 a68.6 ± 3.51 a7.98 ± 1.34 a
2008–2018CK6.5 ± 0.54 a12.6 ± 0.38 c0.42 ± 0.05 c10.3 ± 1.27 d2.46 ± 0.39 c
PK5.4 ± 0.53 b14.1 ± 1.07 bc0.81 ± 0.03 bc53.3 ± 5.79 b6.58 ± 0.71 a
NP5.3 ± 0.50 b15.0 ± 0.91 b0.86 ± 0.07 b55.5 ± 5.16 b6.45 ± 0.54 a
NK5.3 ± 0.54 c14.1 ± 0.73 bc0.35 ± 0.04 c8.5 ± 1.30 d2.42 ± 0.94 c
NPK5.2 ± 0.51 c15.6 ± 0.79 b0.95 ± 0.14 b48.5 ± 4.42 bc5.11 ± 0.70 b
NPKM6.7 ± 0.54 a19.0 ± 0.81 a1.32 ± 0.14 a85.5 ± 7.34 a6.48 ± 0.84 a
The values are mean standard errors (n = 3). According to Turkey’s HSD test, treatments denoted by various letters differ significantly (p < 0.05) from one another.
Table 3. Grain yield, sustainable yield index (SYI) and coefficient of variation (CV) under different long-term fertilizations in double-rice cropping system (1984–2018).
YearTreatmentGrain Yield (t ha−1)Yield Sustainability
σYmaxSYICV (%)
1984–1995CK5.98 ± 0.61 e1.027.160.69 e17.01 a
PK7.13 ± 0.68 d0.688.310.78 c9.50 c
NP9.27 ± 0.74 c0.8610.700.79 c9.23 c
NK10.62 ± 0.98 c1.1212.450.76 d10.51 b
NPK11.07 ± 1.08 b0.8012.620.81 b7.24 d
NPKM12.17 ± 1.02 a0.7613.240.86 a6.28 e
1996–2007CK8.04 ± 1.02 d1.4511.770.56 e18.01 a
PK9.23 ± 0.94 c1.1812.060.67 c12.74 c
NP9.76 ± 1.54 c1.5412.520.66 c15.81 b
NK10.08 ± 1.52 c1.5113.300.64 d14.95 b
NPK11.38 ± 1.28 b1.1813.600.75 b10.38 d
NPKM13.23 ± 1.22 a0.8914.660.84 a6.72 e
2008–2018CK6.6 ± 1.25 e1.259.500.56 e18.99 a
PK8.4 ± 1.03 d1.0310.750.68 c12.36 c
NP9.2 ± 1.31 c1.3111.850.67 c14.23 b
NK9.7 ± 1.39 c1.3913.300.62 d14.38 b
NPK11.6 ± 1.32 b1.3214.500.71 b11.33 d
NPKM12.8 ± 1.65 a1.1316.450.82 a7.71 e
Treatment*--**
Yearns--nsns
Treatment × Yearns--nsns
The values are mean standard errors (n = 3). According to Turkey’s HSD test, treatments denoted by various letters differ significantly (p < 0.05) from one another. σ: standard deviation; Ymax: the maximum grain yield. *: significantly different at p ≤ 0.05; ns: non-significant.
Table 4. Partial factor productivity (PFPp), recovery efficiency (REp) and internal efficiency (IEp) of phosphorus under different long-term fertilizations (1984–2018) in double-rice cropping system (1984–2018).
TreatmentPFPp (kg kg−1)REp (%)IEp (kg kg−1)
1984–19951996–20072008–20181984–19951996–20072008–20181984–19951996–20072008–2018
PK38 ± 0.23 d74 ± 1.13 d114 ± 1.43 d10 ± 0.01 c12 ± 0.01 d21 ± 0.03 d114 ± 1.11 b152 ± 1.13 c190 ± 1.01 c
NP48 ± 0.32 c92 ± 1.23 c130 ± 1.47 c22 ± 0.02 b26 ± 0.03 c32 ± 0.04 c117 ± 1.25 b156 ± 1.32 b196 ± 1.32 b
NPK59 ± 0.44 b114 ± 1.33 b144 ± 1.56 b31 ± 0.04 b38 ± 0.04 b43 ± 0.06 b117 ± 1.25 b158 ± 1.32 b195 ± 1.31 b
NPKM64 ± 0.48 a124 ± 1.36 a174 ± 1.62 a39 ± 0.04 a47 ± 0.06 a54 ± 0.08 a123 ± 1.29 a164 ± 1.38 a205 ± 1.42 a
The values are mean standard errors (n = 3). According to Turkey’s HSD test, treatments denoted by various letters differ significantly (p < 0.05) from one another.
Disclaimer/Publisher’s Note: The statements, opinions and data contained in all publications are solely those of the individual author(s) and contributor(s) and not of MDPI and/or the editor(s). MDPI and/or the editor(s) disclaim responsibility for any injury to people or property resulting from any ideas, methods, instructions or products referred to in the content.

