Article

Metabolic, Nutritional and Morphophysiological Behavior of Eucalypt Genotypes Differing in Dieback Resistance in Field When Submitted to PEG-Induced Water Deficit

by
Débora Durso Caetano-Madeira
1,2,
Rebeca Patricia Omena-Garcia
1,
Tamiris Lopes Elerati
1,
Camila Batista da Silva Lopes
1,
Thais Roseli Corrêa
1,3,
Genaína Aparecida de Souza
1,
Leonardo Araujo Oliveira
1,
Cosme Damião Cruz
2,
Leonardo Lopes Bhering
2,
Adriano Nunes-Nesi
1,
Weverton Gomes da Costa
4 and
Edgard Augusto de Toledo Picoli
1,*
1
Departamento de Biologia Vegetal, University Federal de Viçosa, Viçosa CEP 36 570 900, MG, Brazil
2
Departamento de Biologia Geral, University Federal de Viçosa, Viçosa CEP 36 570 900, MG, Brazil
3
Departamento de Fitotecnia e Fitossanidade, University Estadual do Maranhão, São Luis CEP 65055-310, MA, Brazil
4
Departamento de Estatística, University Federal de Viçosa, Viçosa CEP 36 570 900, MG, Brazil
*
Author to whom correspondence should be addressed.
Agronomy 2023, 13(5), 1261; https://doi.org/10.3390/agronomy13051261
Submission received: 9 March 2023 / Revised: 21 April 2023 / Accepted: 25 April 2023 / Published: 28 April 2023
(This article belongs to the Special Issue Photosynthetic Adaptability of Crops under Environmental Change)

Abstract

:
Dieback is a physiological disorder that has caused losses on eucalyptus plantations. Thinking that water stress is one of the triggers for the physiological disorder and aiming at the early identification of tolerant genotypes, we evaluated plantlets of four commercial clones with divergent behavior in field conditions. The plantlets were grown in a greenhouse where the drought conditions were provided by the application of polyethylene glycol 6000 solutions at 100 and 300 g L−1. After water deficit treatments, the morphological, physiological, nutritional and metabolic analyses were performed. SuzT maintained the carbon fixation and the instantaneous water use efficiency, even under water deficit, while sustaining growth. This resulted in higher leaf area and total dry mass in SuzT. Despite higher photosynthetic rate, SuzS exhibited reduced dry biomass accumulation, implying less efficient carbon use. SuzT revealed a higher level of calcium that supports cell structure and homeostasis and indicates higher capacity to manage specific resources and survival under water deficit. SuzT suffered reduction in some free amino acids; however, there was no significant variation for total amino acid content. The principal component and cluster analyses indicated that SuzMT and SuzTP genotypes behave similarly to SuzT under water deficit, while SuzS clustered in isolation. Our results support that there are common trends in water deficit responses for contrasting eucalypt genotypes. The existence of other strategies coping with water deficit resistance is not discarded and should be further evaluated.

1. Introduction

Eucalypt dieback is a plant disorder that has been studied since its first reports in the mid-20th century in Australia [1]. The eucalypt physiological disorder appears from the 10th to the 24th month after transplanting [2,3]. It is characterized by the appearance of brownish lesions at the base of branches and petioles which may evolve into minichancres, leading to death of the apical part of the branches and compromising the growth of the plant. In the most extreme situations, there may be foliar abscission and even plant death [2,3]. Although the symptoms are well characterized, the eucalyptus dieback is not fully understood, being considered a physiological disorder of complex etiology that can be induced by biotic and abiotic factors [1].
Water deficit is considered one of the most important and possible causes of eucalypt dieback [4,5,6,7,8,9] since it affects the plant metabolism [10] and physiological performance [9,11,12,13]. In addition, water deficit can influence the nutritional content, boron absorption, nitrogen and carbon metabolism and osmotic adjustment [14,15,16]. Water deficit in its turn is reported and evaluated from seedling to more than 20-year-old plants, which is a wide window of time to trigger any stress response [17]. Water deficit causes a series of physiological stresses that can trigger the appearance of dieback [1,18]; further, there are reports that link eucalypt dieback to some essential minerals such as boron [15] and manganese [3].
Dieback has become a challenge with the expansion of eucalypt plantations in the Brazilian savanna regions since long periods of drought are common in these regions [19]. Although demanding detailed evaluation, empirical observations have indicated that water deficit tolerant eucalypt genotypes do not exhibit dieback. Accordingly, the study of the effects of water deficit in eucalypt genotypes can help to understand more about dieback and allow the selection of genotypes tolerant to this disorder.
When submitted to water deficit, drought-tolerant eucalypt genotypes display several adjustments that allow plants to withstand the stressful condition [9,20,21]. The main morphophysiological changes observed in eucalypt are in stomatal conductance, water use efficiency, shoot and root development and leaf area [21,22,23]. Reduction in growth, stomatal conductance, leaf area and leaf water potential were observed in genotypes of Eucalyptus globulus susceptible to water deficit [21,24,25]. Interestingly, tolerant genotypes, of the same species, maintained growth, leaf area expansion, increased abscisic acid (ABA) contents and accumulation of proteins involved in the process of tolerance to abiotic stress [21,26].
Remarkable changes in the levels of leaf metabolites were observed in plants from different species of eucalypt challenged with drought stress condition [27,28]. The osmotic adjustment via accumulation of solutes in the cytosol is one of the main mechanisms to maintain the positive cell turgor in plants [27]. Reductions in osmotic potential have been associated with a large class of compounds such as amino acids, cyclic and acyclic polyols and carbohydrates [12,27,29]. The amino acid proline, commonly associated with responses to water stress in many species, is poorly concentrated in eucalypt. It is never responsible for more than a few percent of the osmotic potential and does not necessarily increase under drought [30,31,32]. In eucalypt, the compounds that are reported to be consistently associated with osmotic adjustment are mono- and di-saccharides [27,29,31,32]. Sugar acids, acyclic sugar alcohols derived from galactose, glucose, fructose and proteins involved in abiotic stress tolerance processes can also accumulate in eucalypt plant tissues submitted to water deficit stress [26,27,29].
Water deficit affects eucalypt in several ways triggering a series of changes in response to stress. However, the phenotypic behavior of commercial eucalypt genotypes that contributes to the different levels of dieback resistance demands further analysis. Thus, this work aimed to characterize collectively an initial approach of the morphological, physiological, nutritional and metabolic responses of seedlings of commercial eucalypt genotypes, with different levels of tolerance to dieback when submitted to osmotic stress.

2. Materials and Methods

2.1. Plant Material

The experiments were performed with clones of three commercial genotypes (SuzT, SuzMT and SuzS) and one genotype in the test phase (SuzTP). These genotypes are hybrids of E. grandis × E. urophylla, kindly provided by Suzano S/A. The genotypes were identified as: SuzT—tolerant to dieback; SuzMT—moderately tolerant to dieback; SuzS—susceptible to dieback; and SuzTP—in testing phase. The information of the resilience of the eucalyptus genotypes to dieback was based on the empirical data of the forest company’s commercial plantation and was supplied by Suzano S/A. The four genotypes used here are commercial or semi-commercial clones and identified as mentioned above. The commercial identification of the clones by Suzano was suppressed in accordance with a confidentiality contract.
The empirical estimates were made in observations of 10 climatic zones, according to information from Suzano S/A, which cover areas of plantations that vary from inland and coastal regions and biomes from the Amazon and Brazilian savannah. Six of these climatic zones exhibit annual rainfall ranging from 1000 to 2000 mm with two defined dry and rainy seasons that last about 6 months each.
The seedlings, at 110 days old, were supplied by Suzano S/A. The seedlings were produced by cuttings, and their management was carried out according to standard nursery protocols. Seedling production and transportation were performed in 100 mL conic and hollow (55 mm larger diameter) plastic tubes (tubettes). The experiment was carried out at the facilities of Clonar—Resistência a Doenças Florestais, Cajuri—Minas Gerais (latitude: 20° 47′ 26″ S and longitude: 42° 47′ 48″ W). Four-month-old plantlets of each genotype were transplanted into 2 L plastic bags containing charred rice husk commercial substrate (Santa Carolina, Santa Cruz do Sul, RS, Brazil) and fertilizer. Initial fertilization was carried out with 150 g osmocolt Plus 15-9-12 (3M) and 150 g single superphosphate per 8 kg of rice rusk. Supplementary fertilization was carried out applying 15 mL of a solution of 15 g.L−1 mono ammonium phosphate, one time a month, and the same volume of a 6 g.L−1 solution of fertilizer composed of nitrogen, phosphorus and potassium in concentrations 10/5/30 (m/m/m) every 15 days. Plantlets were acclimated during 30 days in a greenhouse at an average temperature of 25 °C with natural lighting and daily irrigation.
The environmental conditions during the experiment maintained an average temperature of 25 °C and relative humidity of 70%. The experiment was conducted in a greenhouse with a transparent plastic cover natural sunlight supply. Artificial light was not provided. The greenhouse had a lateral protection and boundaries with a nylon canvas (approximately 2 mm mesh) that was grounded to the floor base with a masonry wall of 15 cm height. The experiment was conducted from October 2012, the seedling reception, to February 2013, the end of the sample collection.

2.2. Experimental Design

After the acclimatization period of 30 days, experimental treatments, control (without water deficit) and water deficit treatment simulation with the use of polyethylene glycol 6000 (PEG) were applied. PEG was diluted at 100 g.L−1 and 300 g.L−1 PEG concentrations. Stock solutions were prepared regularly and made available for the experiment conduction.
The plantlets of the four genotypes were submitted to three treatments: Control—plantlets managed according to the nursery standard procedures, the same used in the acclimatization period (seedlings were maintained in plastic bags containing 2 L of carbonized rice, fertilizer, and daily irrigation [9,33]); PEG 100—plantlets managed according to the nursery standard procedures, with application of 100 mL of 100 g.L−1 PEG solution every 2 days; and PEG 300—plantlets managed according to the nursery standard procedures, with application of 100 mL of 300 g.L−1 PEG solution every 2 days.
The treatments, control and water deficit stress, were applied for 60 days. After this period, data were collected. The experiment was conducted in a randomized block design in a 4 × 3 factorial scheme consisting of four genotypes and three treatments with five blocks/replicates. Each experimental unit was composed of three plants.

2.3. Estimation of the Expected Osmotic Potential of the Substrate Solution

The osmotic potential of solution of the substrate (charred rice husk commercial substrate, Santa Carolina, Brazil) of each pot where the plants were grown was estimated at the end of the experiment to verify the water deficit applied to the plants. This approach was adapted to standardize and provide an estimate value of the osmotic potential in the substrate plants were conducted, in each treatment, during the experiment. The substrate was oven dried at 60 °C for 3–4 days. A 10 g sample was withdrawn from the dried substrate and transferred to funnel with filter paper and a volume of 15 mL of distilled water was added. The filtrate was collected and used to measure the osmotic potential of the solution in a cryo-osmometer. For each repetition for the combinations of treatment and genotype, the osmotic potential of the substrate solution was evaluated. The freezing point of the solution sample in degrees Horvet (°H) was converted into MegaPascal (MPa) according to the previous methods obtained gathering information from previous reports [34,35,36,37]. For details, please observe Supplementary Method in the Electronic Supplementary Materials.

2.4. Morphological Variables

The morphological data of all plants were collected. The evaluated variables were stem diameter, measured at 5 cm above the ground with a digital caliper; total number of branches; number of nodes, counted from the third node after the apical bud; leaf area measured with Image-Pro Plus program from 10 leaves fully expanded of the middle of the plants; and plant height, measured with a tape measure. The variables of total dry matter subdivided in leaves, stems and roots were evaluated (LDM—leaf dry matter; SDM—stem dry matter; RDM—root dry matter; TDM—total dry matter). The proportions of leaves, stems and roots in relation to total dry matter (leaf/TDM; stem/TDM, root/TDM) were also evaluated.

2.5. Physiological Parameters

Gas exchange measurements were carried out in one plant from each experimental unit, from 9:00 to 11:30 am The variables carbon assimilation rate (A), stomatal conductance (gs), transpiration rate (E), instantaneous water use efficiency (WUE) (defined as A/E at leaf level), intrinsic water use efficiency (WUEi) (defined as A/gs at leaf level) and internal and external CO2 concentration ratio (Ci/Ca) were measured with the aid of the IRGA system (LCpro-SD, ADC Biocientific Ltd., Hoddesdon, Herts, UK). The evaluation was carried out under constant irradiation of 1000 µmol photons m−2 s−1, temperature of 25 ± 1.6 °C and 390 ± 5.3 ppm of CO2 using the expanded leaves of the middle third of the plant.

2.6. Nutritional Variables

For nutritional analyses, twenty fully expanded and healthy leaves were collected from the middle third of each plant. The leaves were sent to the Forest Soil Laboratory, Department of Soil Science of the Federal University of Viçosa (UFV), where nutrient analyses were performed according to the standard laboratory procedure. Leaves were dried at 60 °C for 3 days and submitted to nitric-perchloric digestion as described by Sarruge and Haag [38]. The determination of phosphorus (P) levels was performed by colorimetry using the ascorbic acid method [39]; that of potassium (K) was made by flame photometry; that of calcium (Ca), magnesium (Mg), iron (Fe), copper (Cu), zinc (Zn) and manganese (Mn) were performed by atomic absorption spectrophotometry; sulfur (S) levels were determined by turbidimetry [40]; and those of nitrogen (N) by the method of Kjeldahl.

2.7. Biochemical Analyses

Leaf samples were collected of one plant from each experimental unit. Leaf samples were harvested after 6 h of illumination, in the middle of the light period, immediately frozen in liquid nitrogen and stored at −80 °C freezer until processing. The samples were ground in liquid nitrogen and aliquots of approximately 25 mg of fresh weight (FW) of each sample were used for the biochemical analyses.
The extraction procedure followed as previously described, except for the addition of Ribitol [41]. The samples were submitted to hot methanolic extraction by addition of 700 μL of methanol 100% and subsequent incubation by 15 min at 70 °C under agitation of 750 rpm. After that, the samples were centrifuged at 14,000 rpm by 10 min at 4 °C. The supernatant was separated from the pellet which pellet was washed 3 times with methanol 100% and stored at −20 °C to determine the starch and soluble protein content. In the supernatant were added 375 μL of chloroform, 750 μL of ultrapure water, it was centrifuged at 14,000 rpm by 10 min at 4 °C and the upper phase was collected and stored at −20 °C to determine the sugar and total amino acid content.
Total amino acids levels were determined according to Cross et al. [42]. Total soluble proteins were assessed with the Bio-Rad Bradford reagent [43] (BioRad Laboratories, Hercules, CA, USA) according to the manufacturer’s instructions. The levels of glucose, fructose, sucrose, and starch were determined exactly as previously described [44].

2.8. Metabolites Profile Determination

Leaf samples were collected, stored and homogenized in the same way as for biochemical analyses described above. The methanolic extraction and derivatization steps were carried out as previously described [41] and the metabolites were quantified by gas chromatography/time-of-flight mass spectrometry (GC-TOF-MS) according to the established protocol [41]. The mass spectra and chromatograms were analyzed using the Chroma TOF 1.0 (Leco, http://www.leco.com/) (accessed on 13 August 2015) and Target Search software [45]. The metabolites identification was manually advised using the spectral mass index collection and Golm Metabolome database retention [46] and, following the recommended report format [47].

2.9. Statistical Analysis and Experimental Design

After the acclimatization period, experimental treatments were applied. The plantlets of the four genotypes were submitted to three treatments: Control—plantlets managed according to the nursery standard procedures [9]; PEG 100—plantlets managed according to the nursery standard procedures, with application of 100 mL of 100 g.L−1 polyethylene glycol 6000 (PEG) solution every 2 days; PEG 300—plantlets managed according to the nursery standard procedures, with application of 100 mL of 300 g.L−1 PEG solution every 2 days.
The data were subjected to univariate and multivariate analyses, variance homogeneity tests, normal distribution, analysis of variance and Tukey test using the GENES program [48]. The graphics were assembled using SigmaPlot 11.0 software. The heatmap graphics were assembled with the metabolic profile data using Multiple Experiment Viewer Software (MeV) version 4.5 and principal component analysis (PCA) with the morphological, physiological and nutritional variables and grouping based on Pearson correlation coefficients were assembled using Minitab 17 software.

3. Results

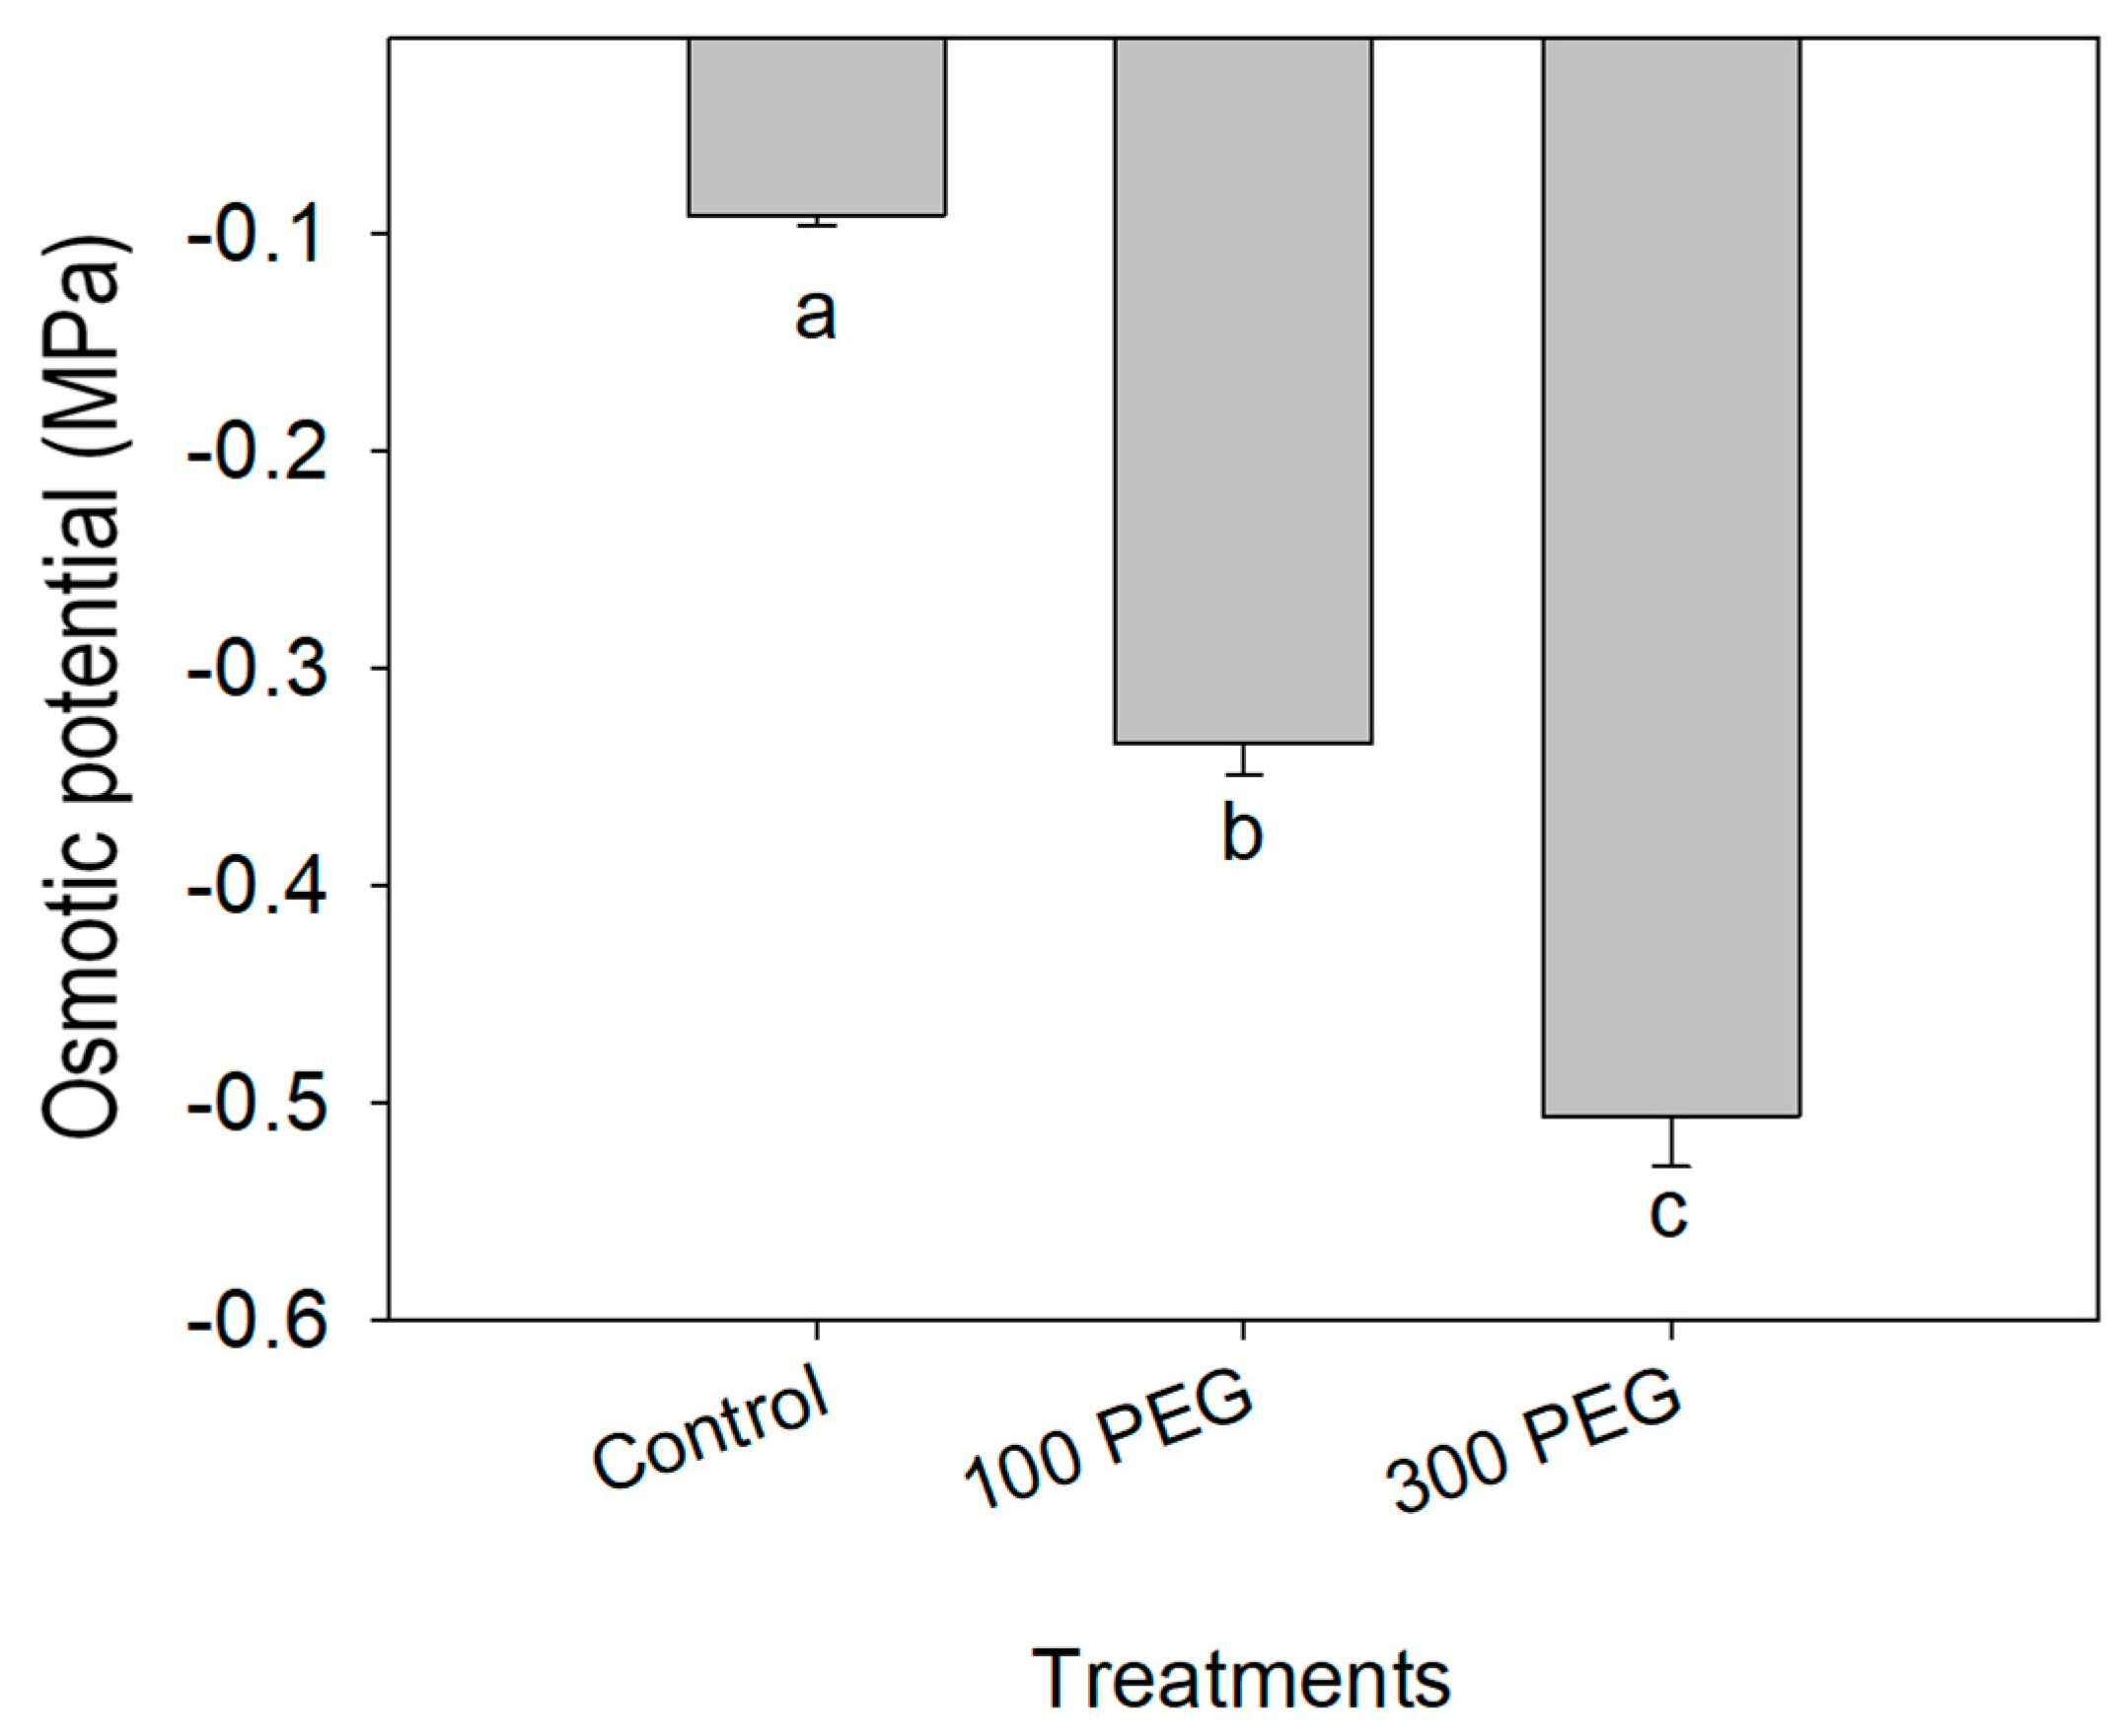
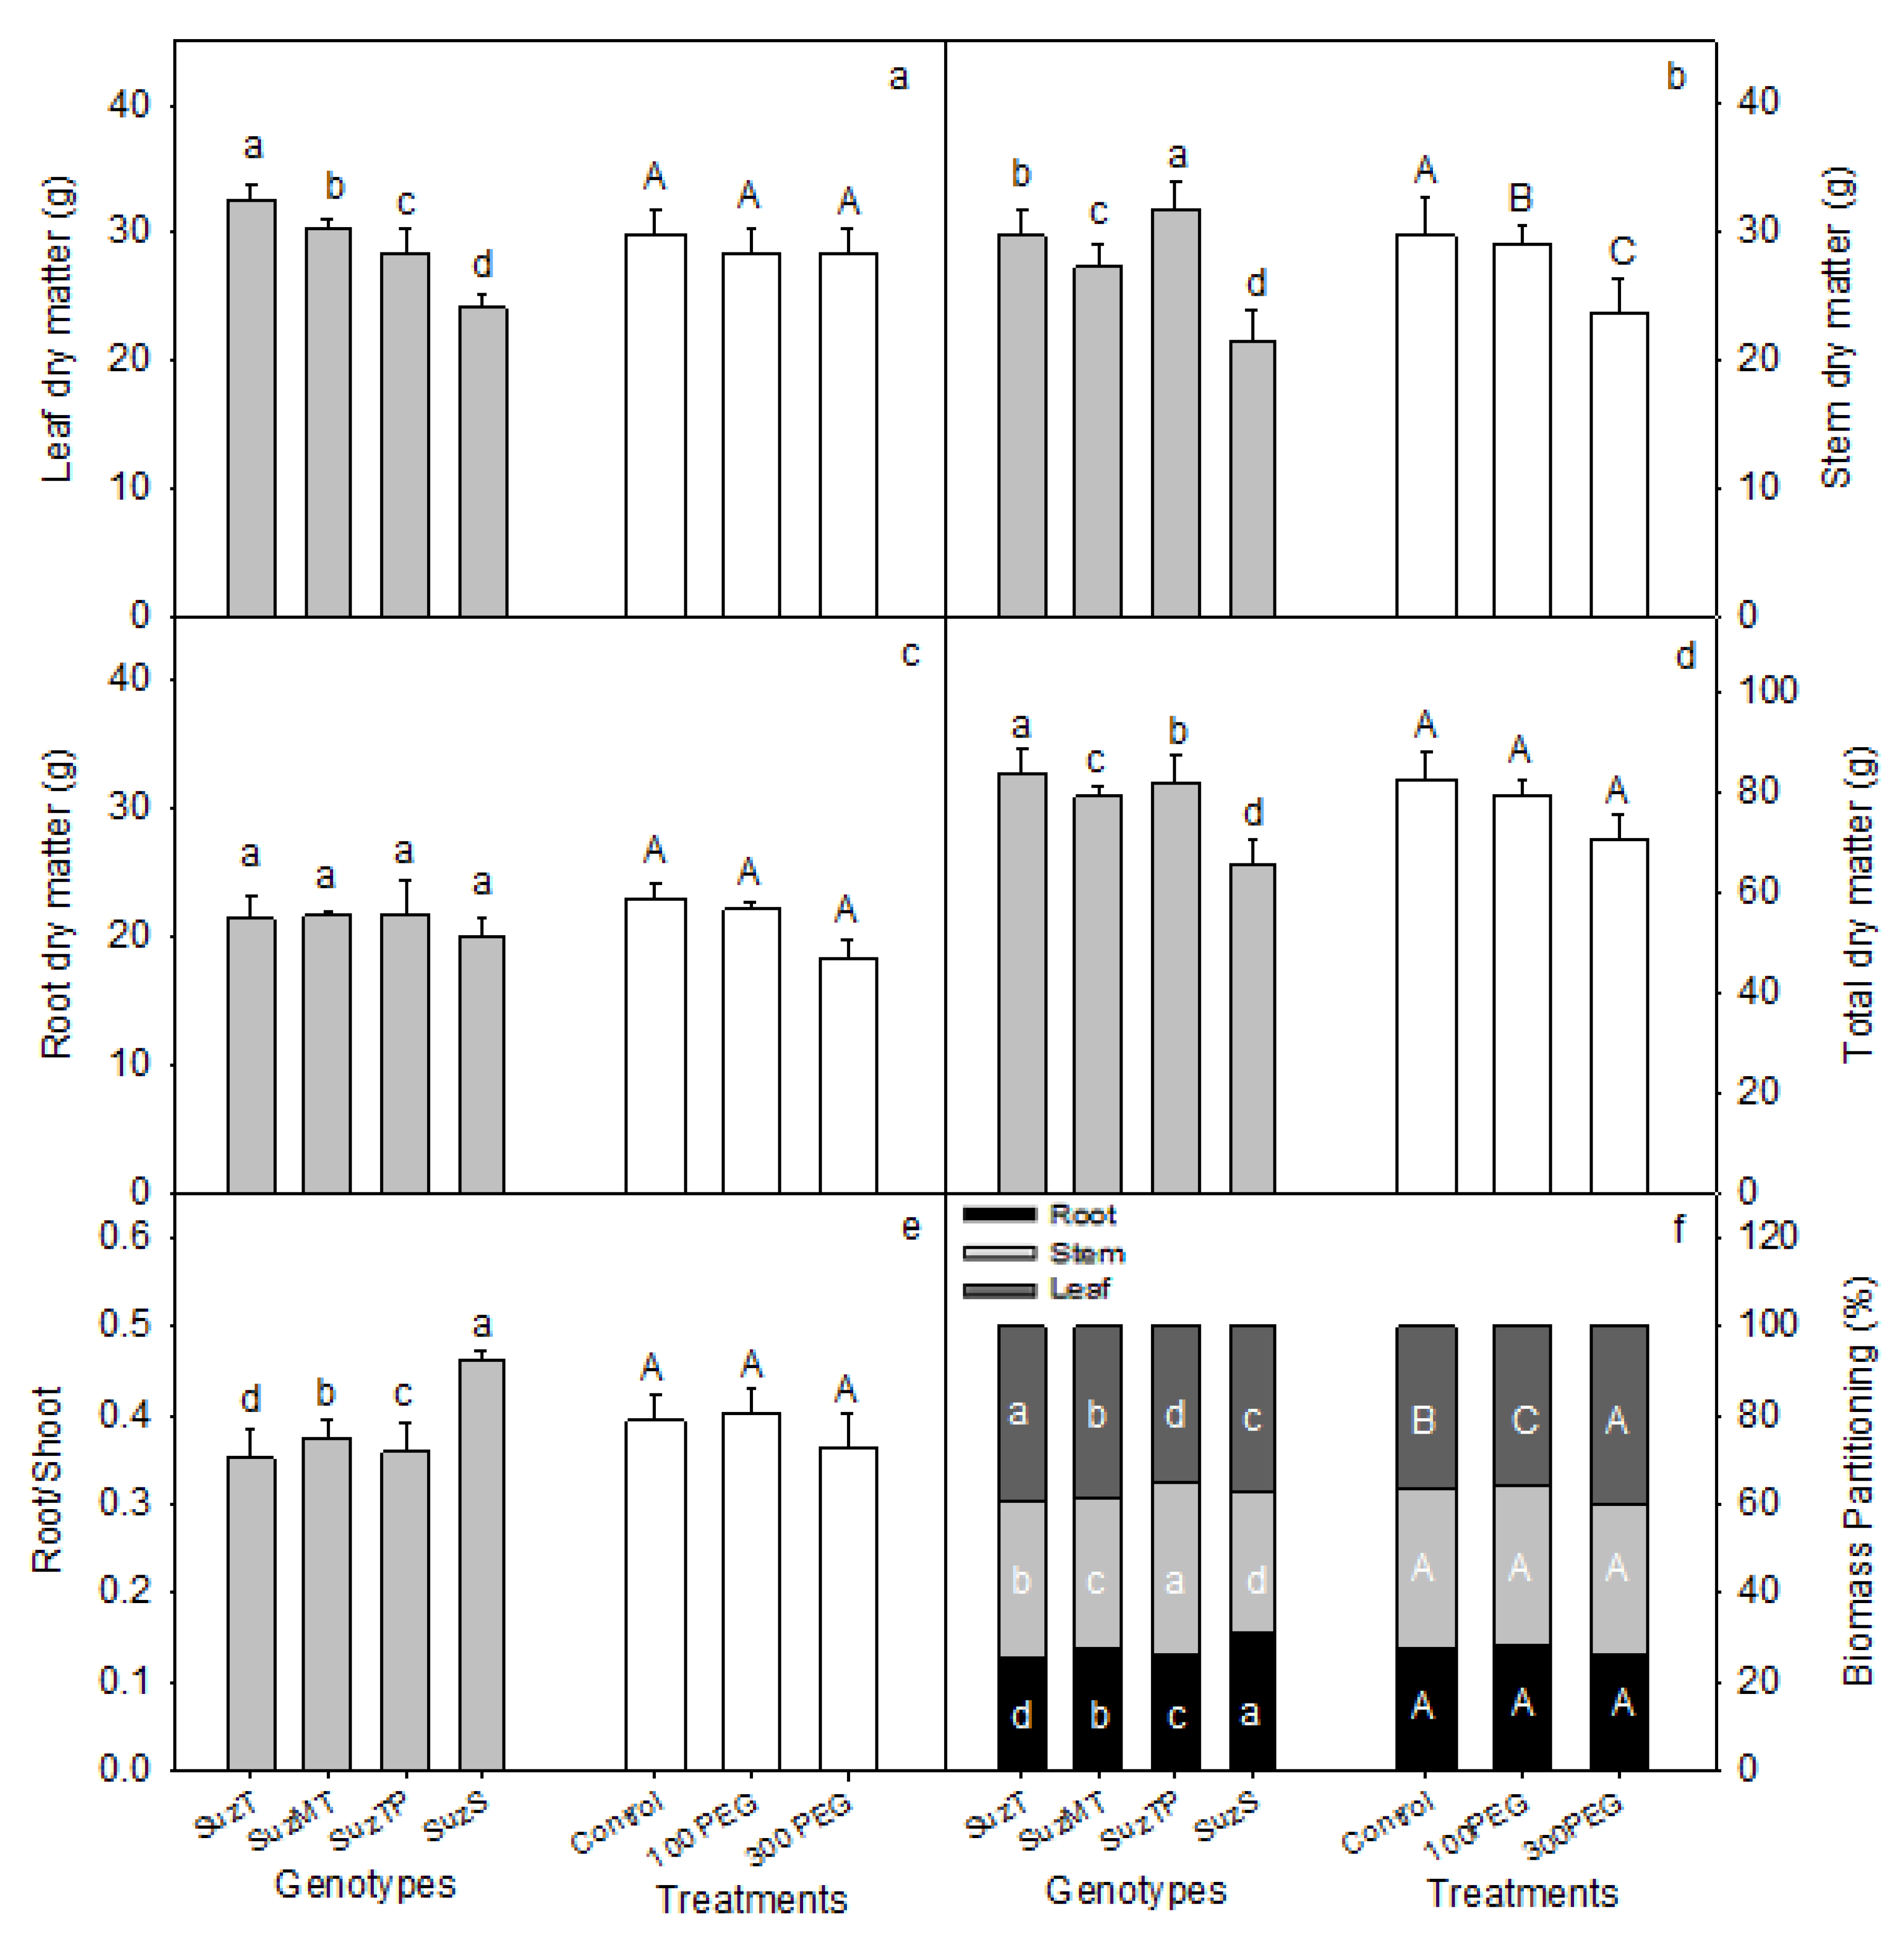
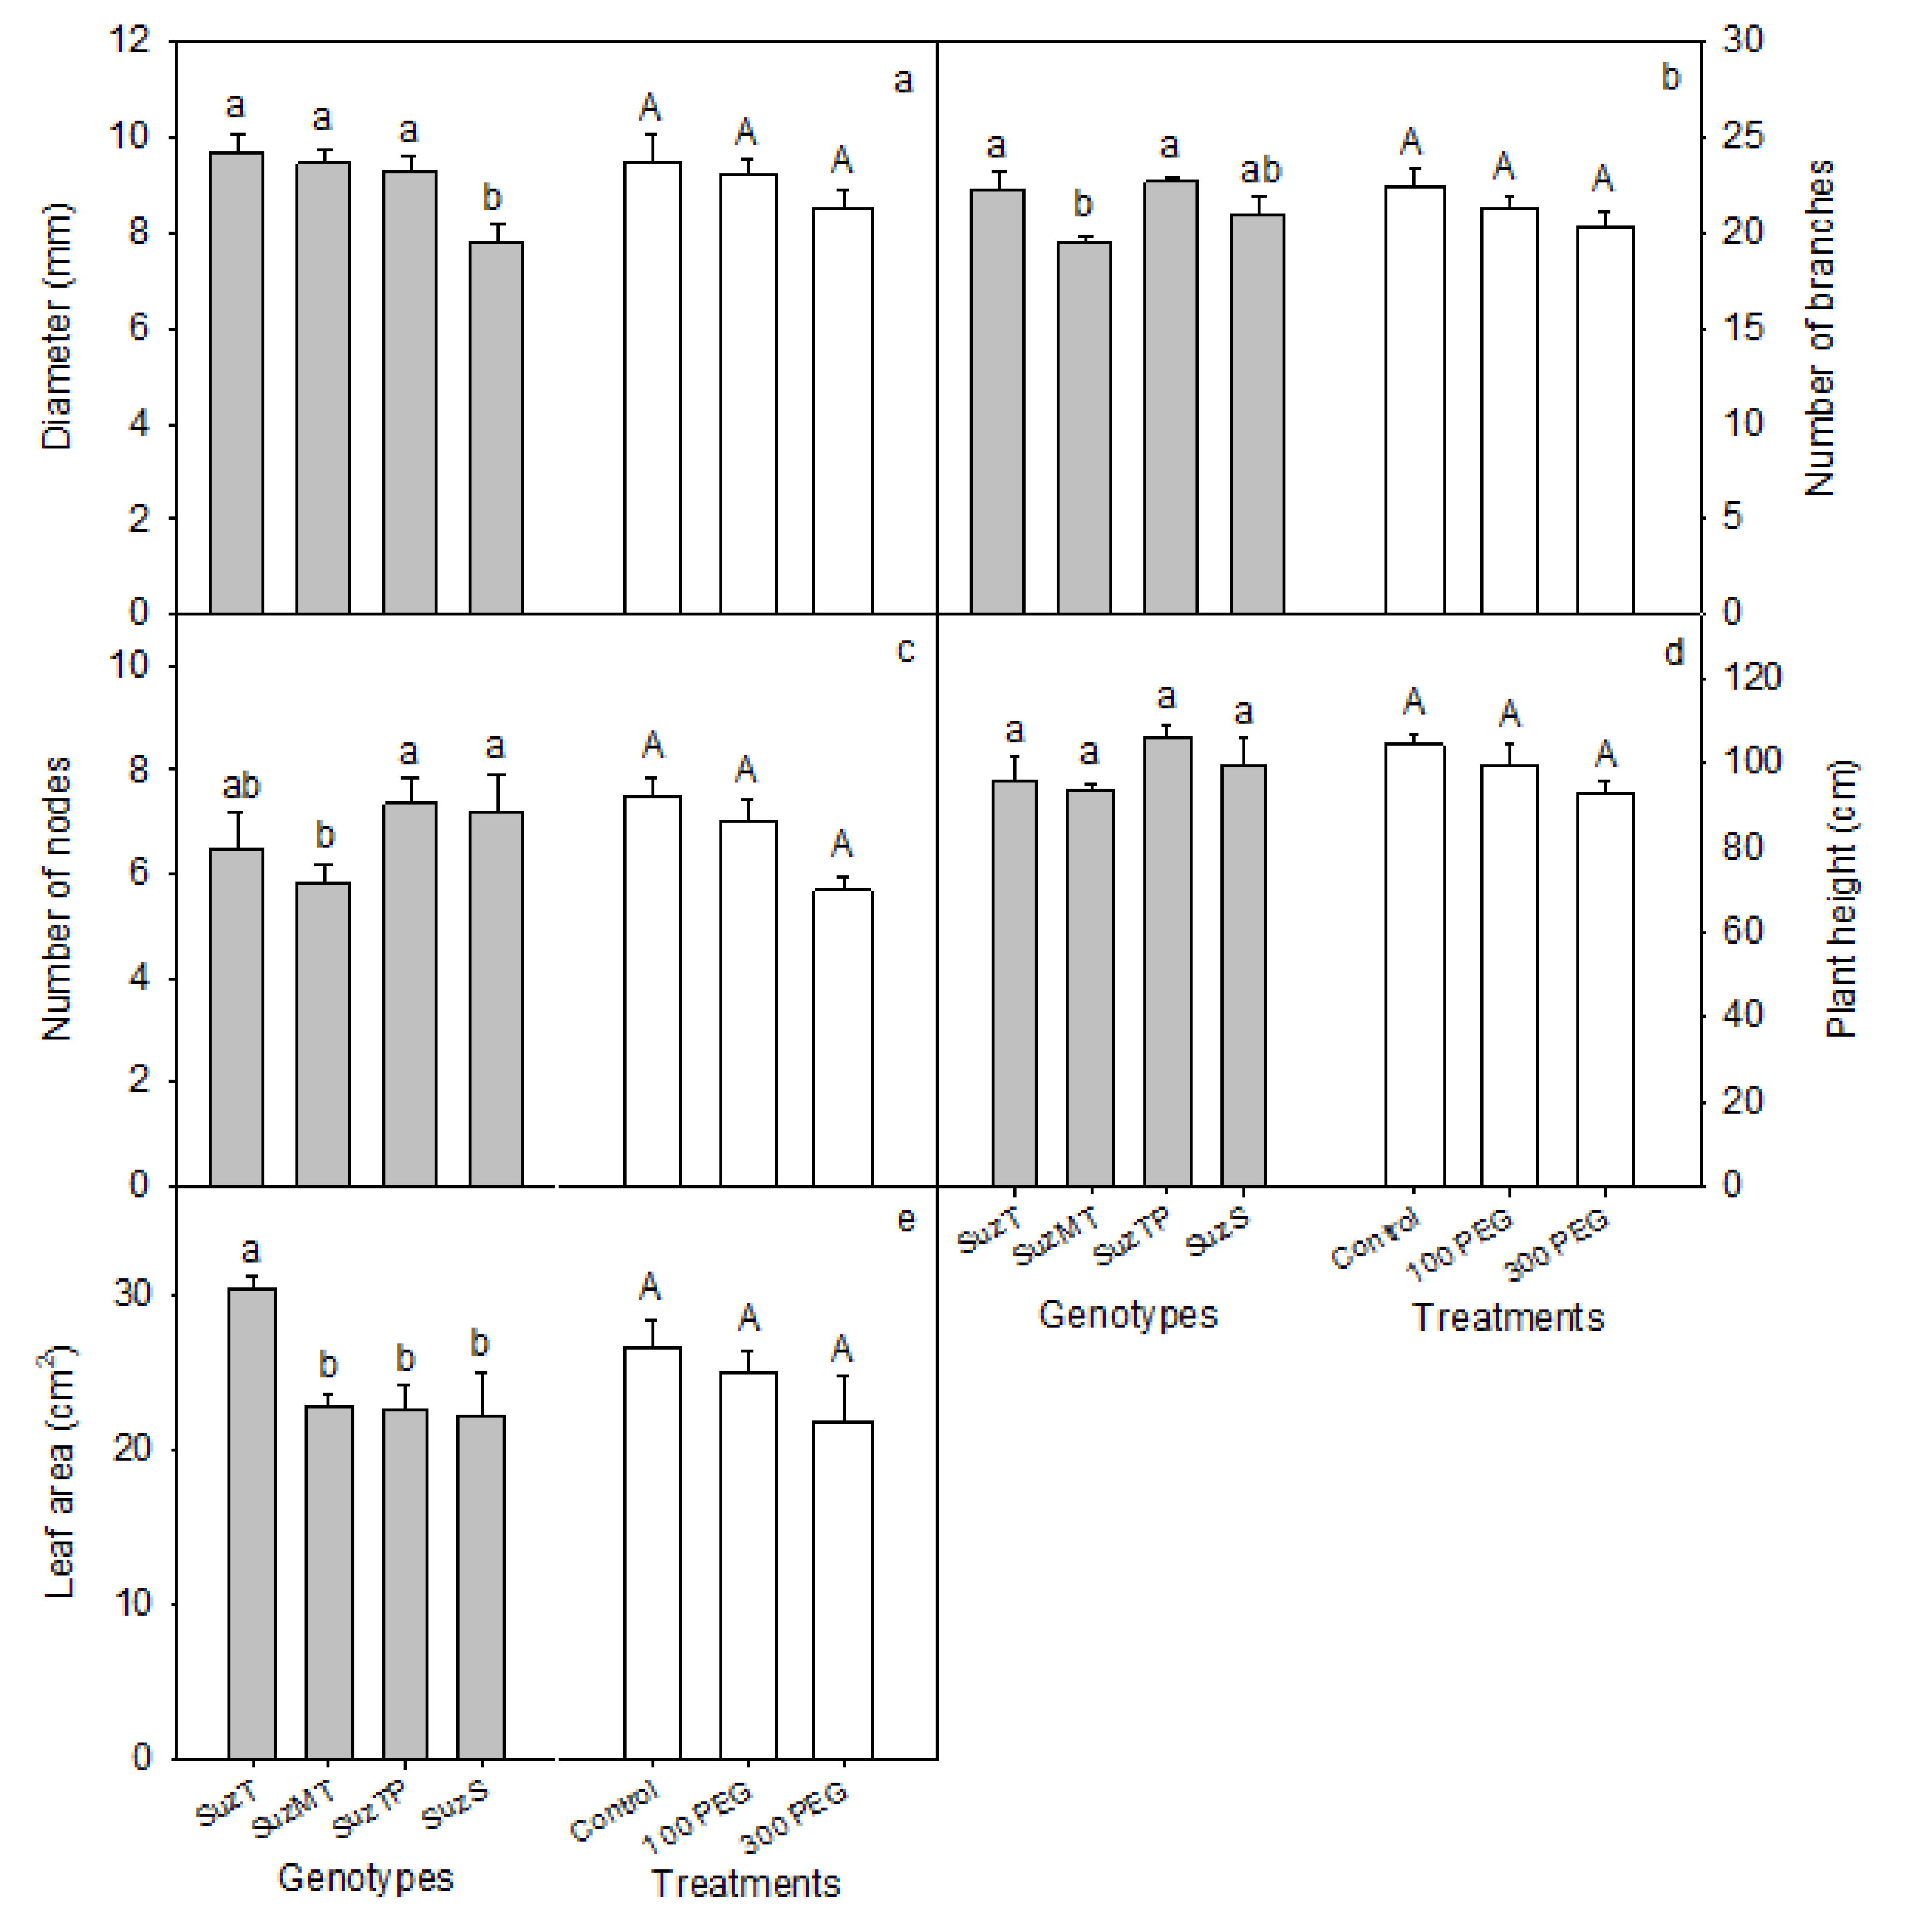
3.1. Osmotic Potential of Substrate Solution and Morphological Differences between Genotypes

The water potential of substrate solution decreased significantly as water deficit increased (Figure 1). The application of 100 and 300 mg L−1 PEG solutions significantly reduced the osmotic potential of the substrate where the eucalypt seedlings were grown.
The genotype–treatment interaction was non-significant to the morphological variables (Supplementary Table—Table S1), except for amino acid content and nutrients S and Cu. The differences due to the water deficit treatments were significant only to stem dry matter when considering only the morphological variables (Figure 2b). All plantlets suffered a reduction in stem dry matter with an increase in water deficit. The other morphological differences occurred only between the genotypes.
The SuzS plants exhibited the smallest stem diameter, distinguishing themselves from the other genotypes that did not differ significantly from each other (Figure 3a). SuzS had also lower dry matter of leaf, stem and total (Figure 2a,b,d). The SuzT plantlets showed the highest values of leaf area, leaf dry matter and total dry matter (Figure 2a,d and Figure 3e). The SuzT stem dry matter values were higher than those presented by SuzS (Figure 2b). The plant height and root dry matter did not differ between the genotypes (Figure 2c and Figure 3d) but the root/shoot ratio was the highest in SuzS and the lowest in SuzT (Figure 3e), indicating that the genotypes differed in biomass partitioning. SuzT invested a larger proportion of total dry matter in stem and leaves than SuzS. In contrast, SuzS invested more in root than the other genotypes (Figure 2f).

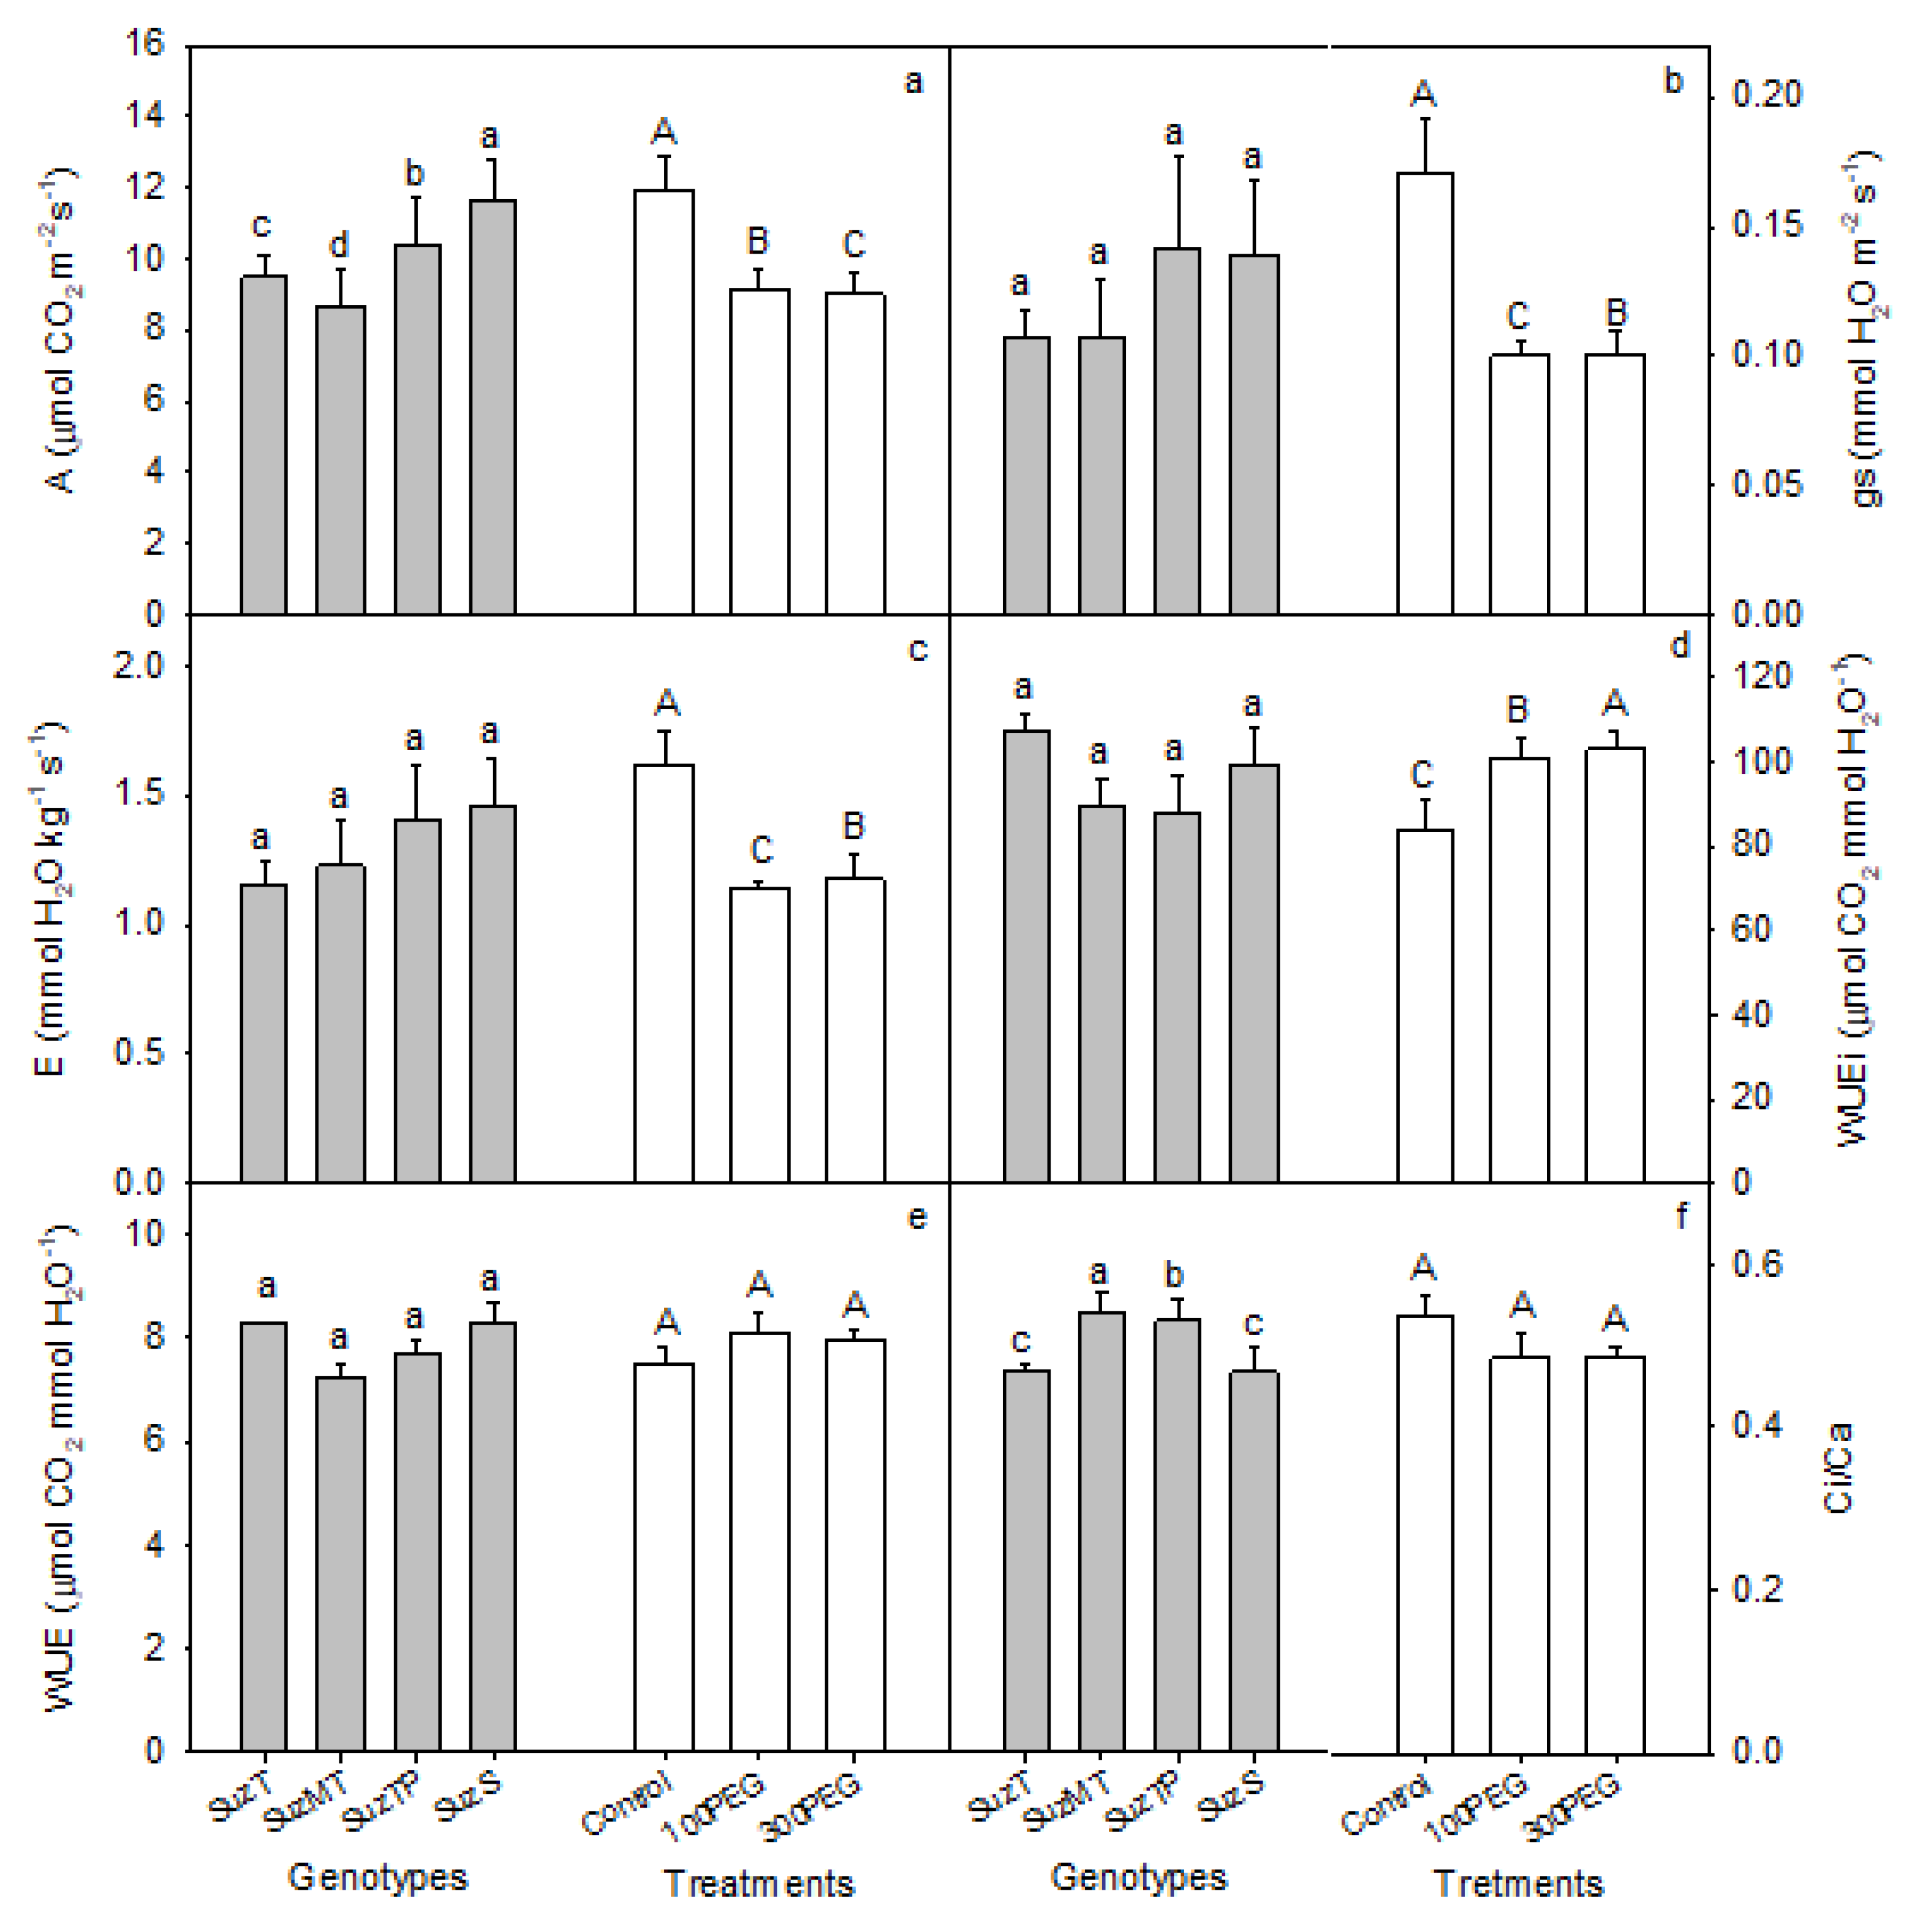
3.2. Gas Exchange Analysis

The genotype–treatment interaction was non-significant to the physiological variables (Supplementary Table—Table S1). p-values for all variables are presented in Supplementary Table—Table S2) Similarly to the other variables, based on this lack of significant interaction, grouping according genotypes and treatments were accomplished to evaluate possible trends among the different genotypes and treatments.
With the application of water deficit treatments, the photosynthetic (A) and the transpiration rate (E) and the stomatal conductance (gs) of all plantlets decreased (Figure 4a–c). The intrinsic water use efficiency (WUEi) increased with the application of water deficit treatments (Figure 4d). The photosynthetic rate was higher in SuzS than the other genotypes, but this genotype did not differ from SuzT in any other physiological variable (Figure 4).

3.3. Nutritional Status of Genotypes with Distinct Dieback Tolerance

The genotype–treatment interaction was significant to the levels of S and Cu and non-significant to the other nutritional variables (Supplementary Table—Table S1). For S, only for the control was observed a difference between genotypes by the Tukey test (Supplementary Table—Table S3). On the other hand, for Cu only in the treatment 100PEG, there was no differentiation between genotypes. The other nutritional variables varied only among genotypes, with no effect of the treatments between them (Table 1). Ca and B levels stood out by allowing the differentiation of the tolerant and susceptible genotypes. The level of Ca was significantly higher in SuzT than on SuzS, while the level of B was higher in the SuzS genotype than in SuzT and SuzMT (Table 1).

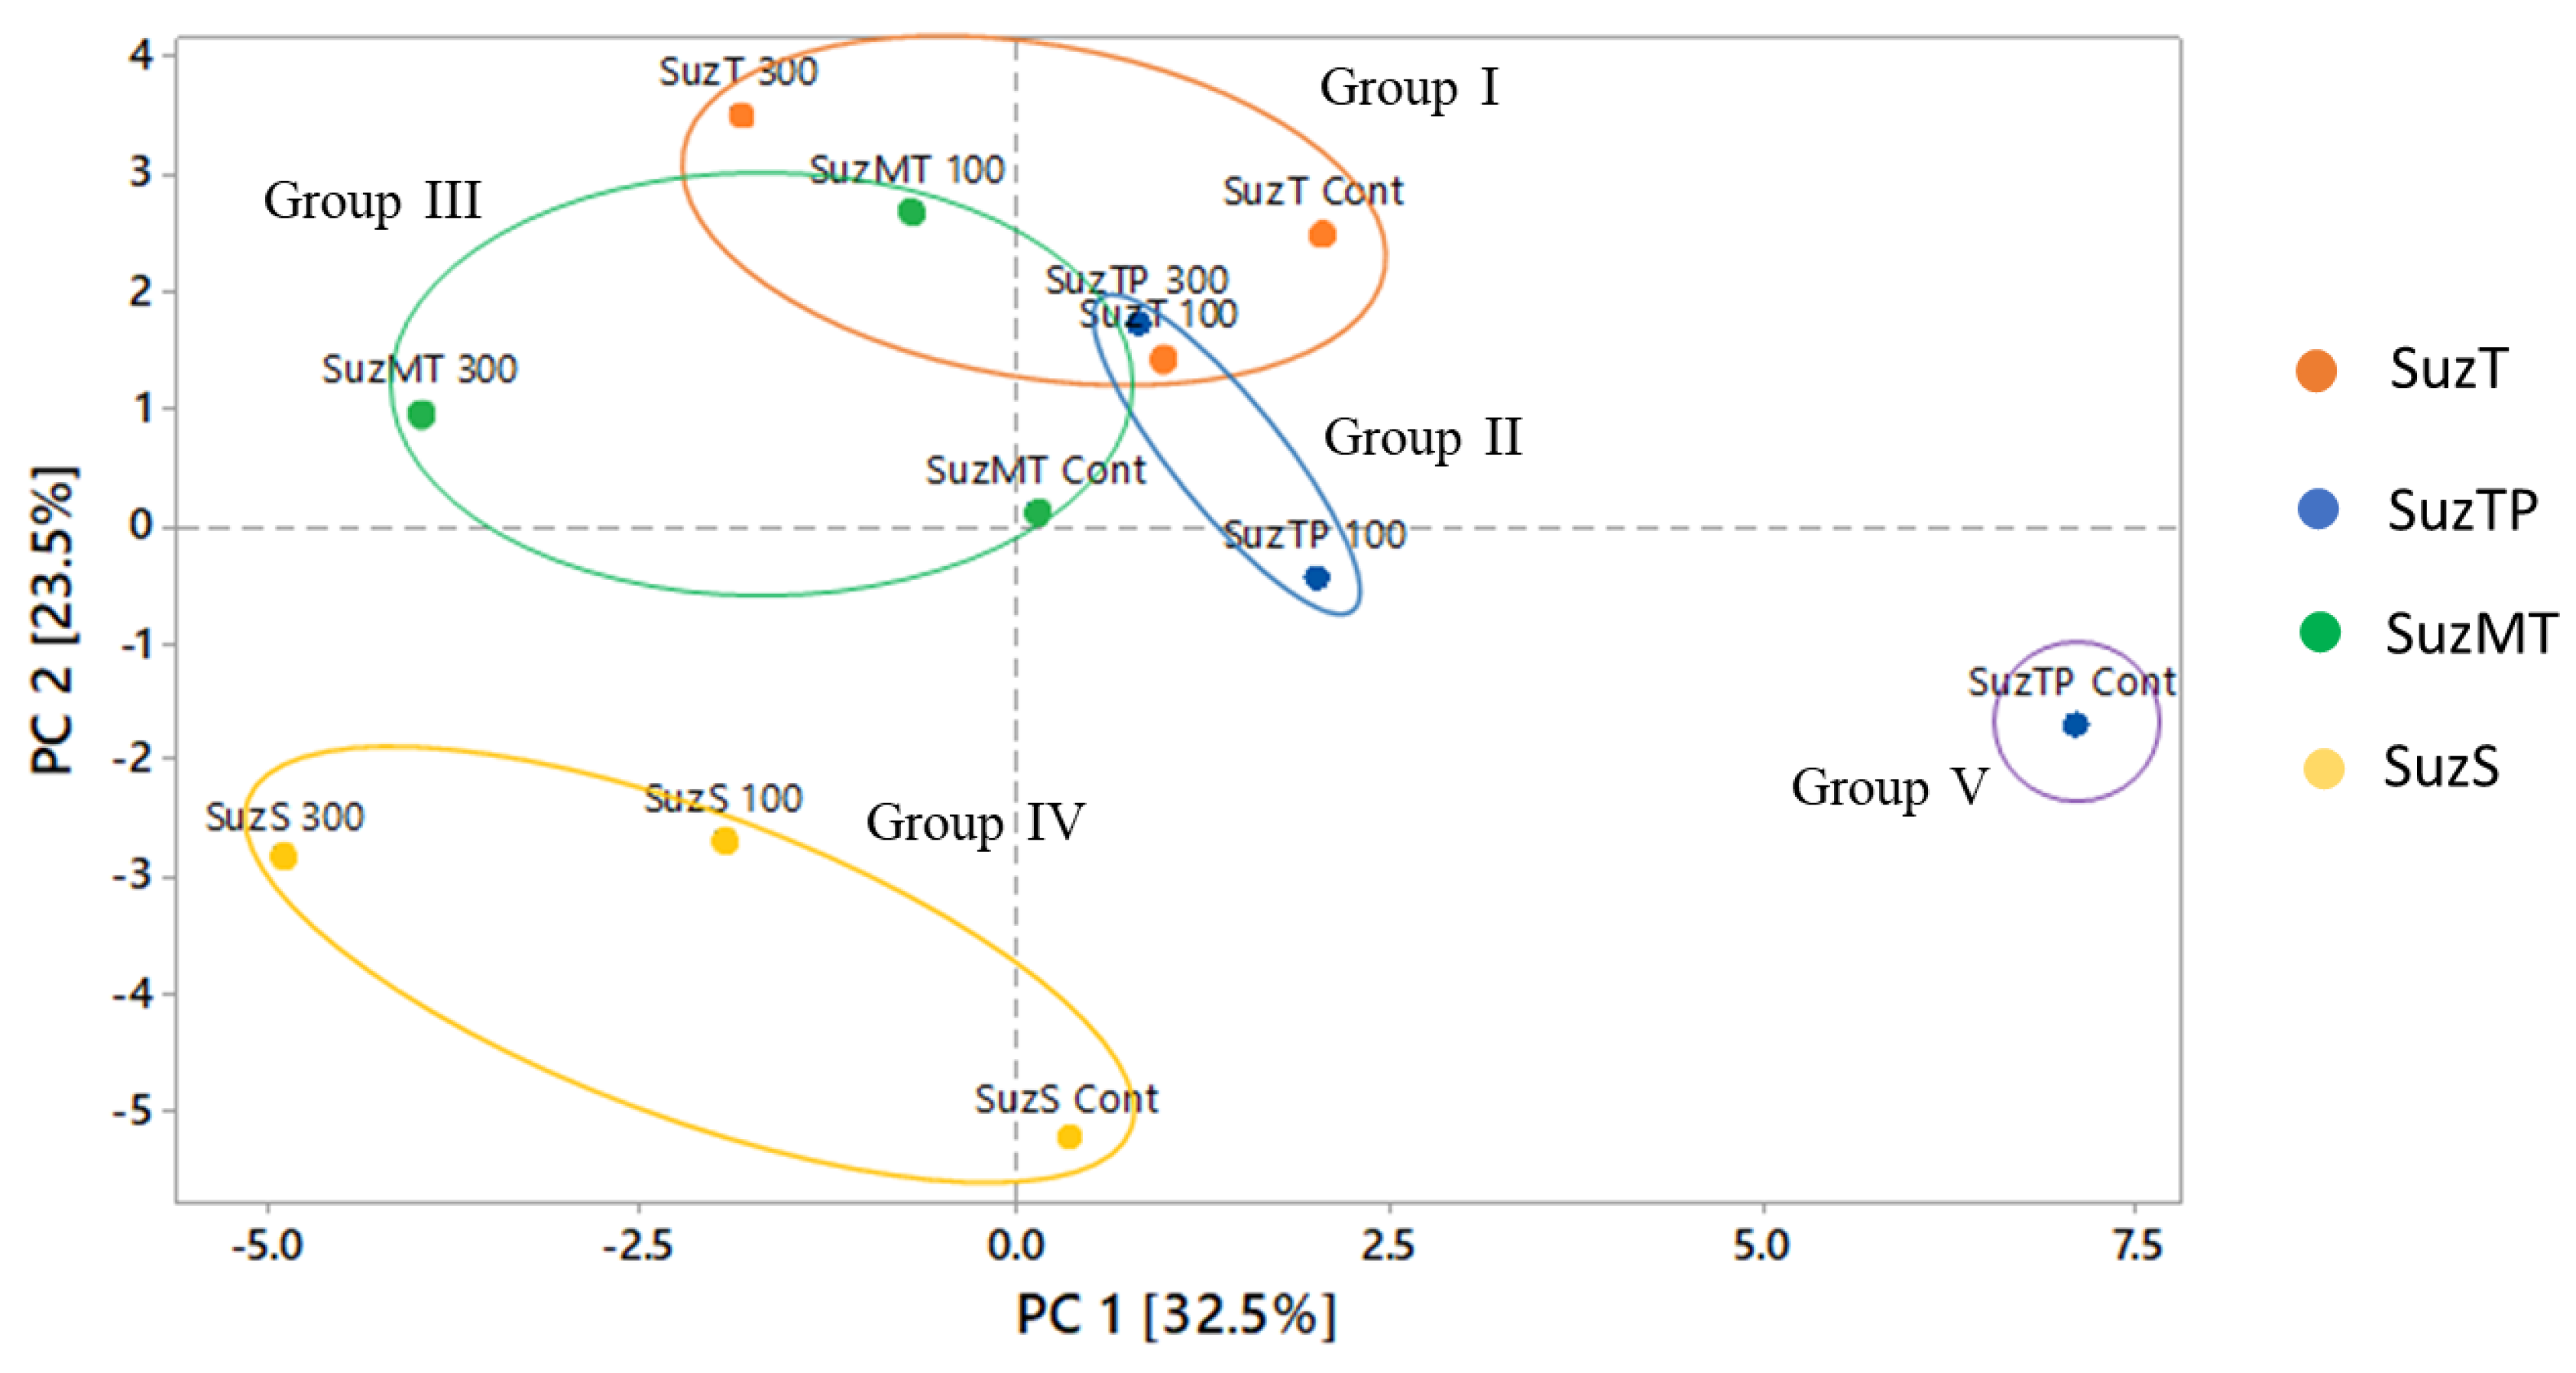
3.4. Multivariate Analysis

To understand the effect of the osmotic stress treatments on contrasting Eucalyptus genotypes, the morphological, physiological and nutritional variables were analyzed using PCA (Figure 5). Despite significant interaction, amino acid content was withdrawn from further analysis as it did not contribute to the principal components in this analysis. The first two components were used and they explained 56% of the variation, of which the most part belongs to PC1 (32.5%). The formation of five groups was observed by the Pearson correlation coefficients. Groups I, III and IV are formed by all treatments of the tolerant, medium tolerant and susceptible genotypes, respectively. Group II is formed by the water deficit treatments of the genotype in test phase (SuzTP), while the control treatment forms group V. This result indicates that plants from SuzTP genotype exhibit altered morphophysiological and nutritional parameters under the water deficit conditions when compared to the control treatment.
The separation of control treatment of the SuzTP genotype along component 1 is mainly due to the variables stem dry matter, number of branches, total dry matter and Zn and P concentration. The separation of the SuzS genotype from the others occurred manly due to leaf/total dry matter (L/TDM) and intrinsic water use efficiency (WUEi) on component 1 and to root/shoot partitioning, root/total dry matter (R/TDM), net photosynthesis and transpiration rate on component 2. The contribution of each variable to the separation of genotypes and treatments into two components (PC1 and PC2) is shown in Supplementary Table—Table S4.
Together, the PCA analysis associated with the clustering method indicates a clear separation of the susceptible genotype from the others. According to the previous analyses, the tolerant, medium tolerant and in-test-phase genotypes exhibit similar behavior when submitted to water deficit stress condition. The commercial eucalypt genotypes display differences among them in control and PEG treatments that may be attributed to their constitution or initial conditions. The spotlight is that the susceptible genotype samples from control or water stress treatment joined one group that differed from the other genotype and treatment samples (Figure 5).

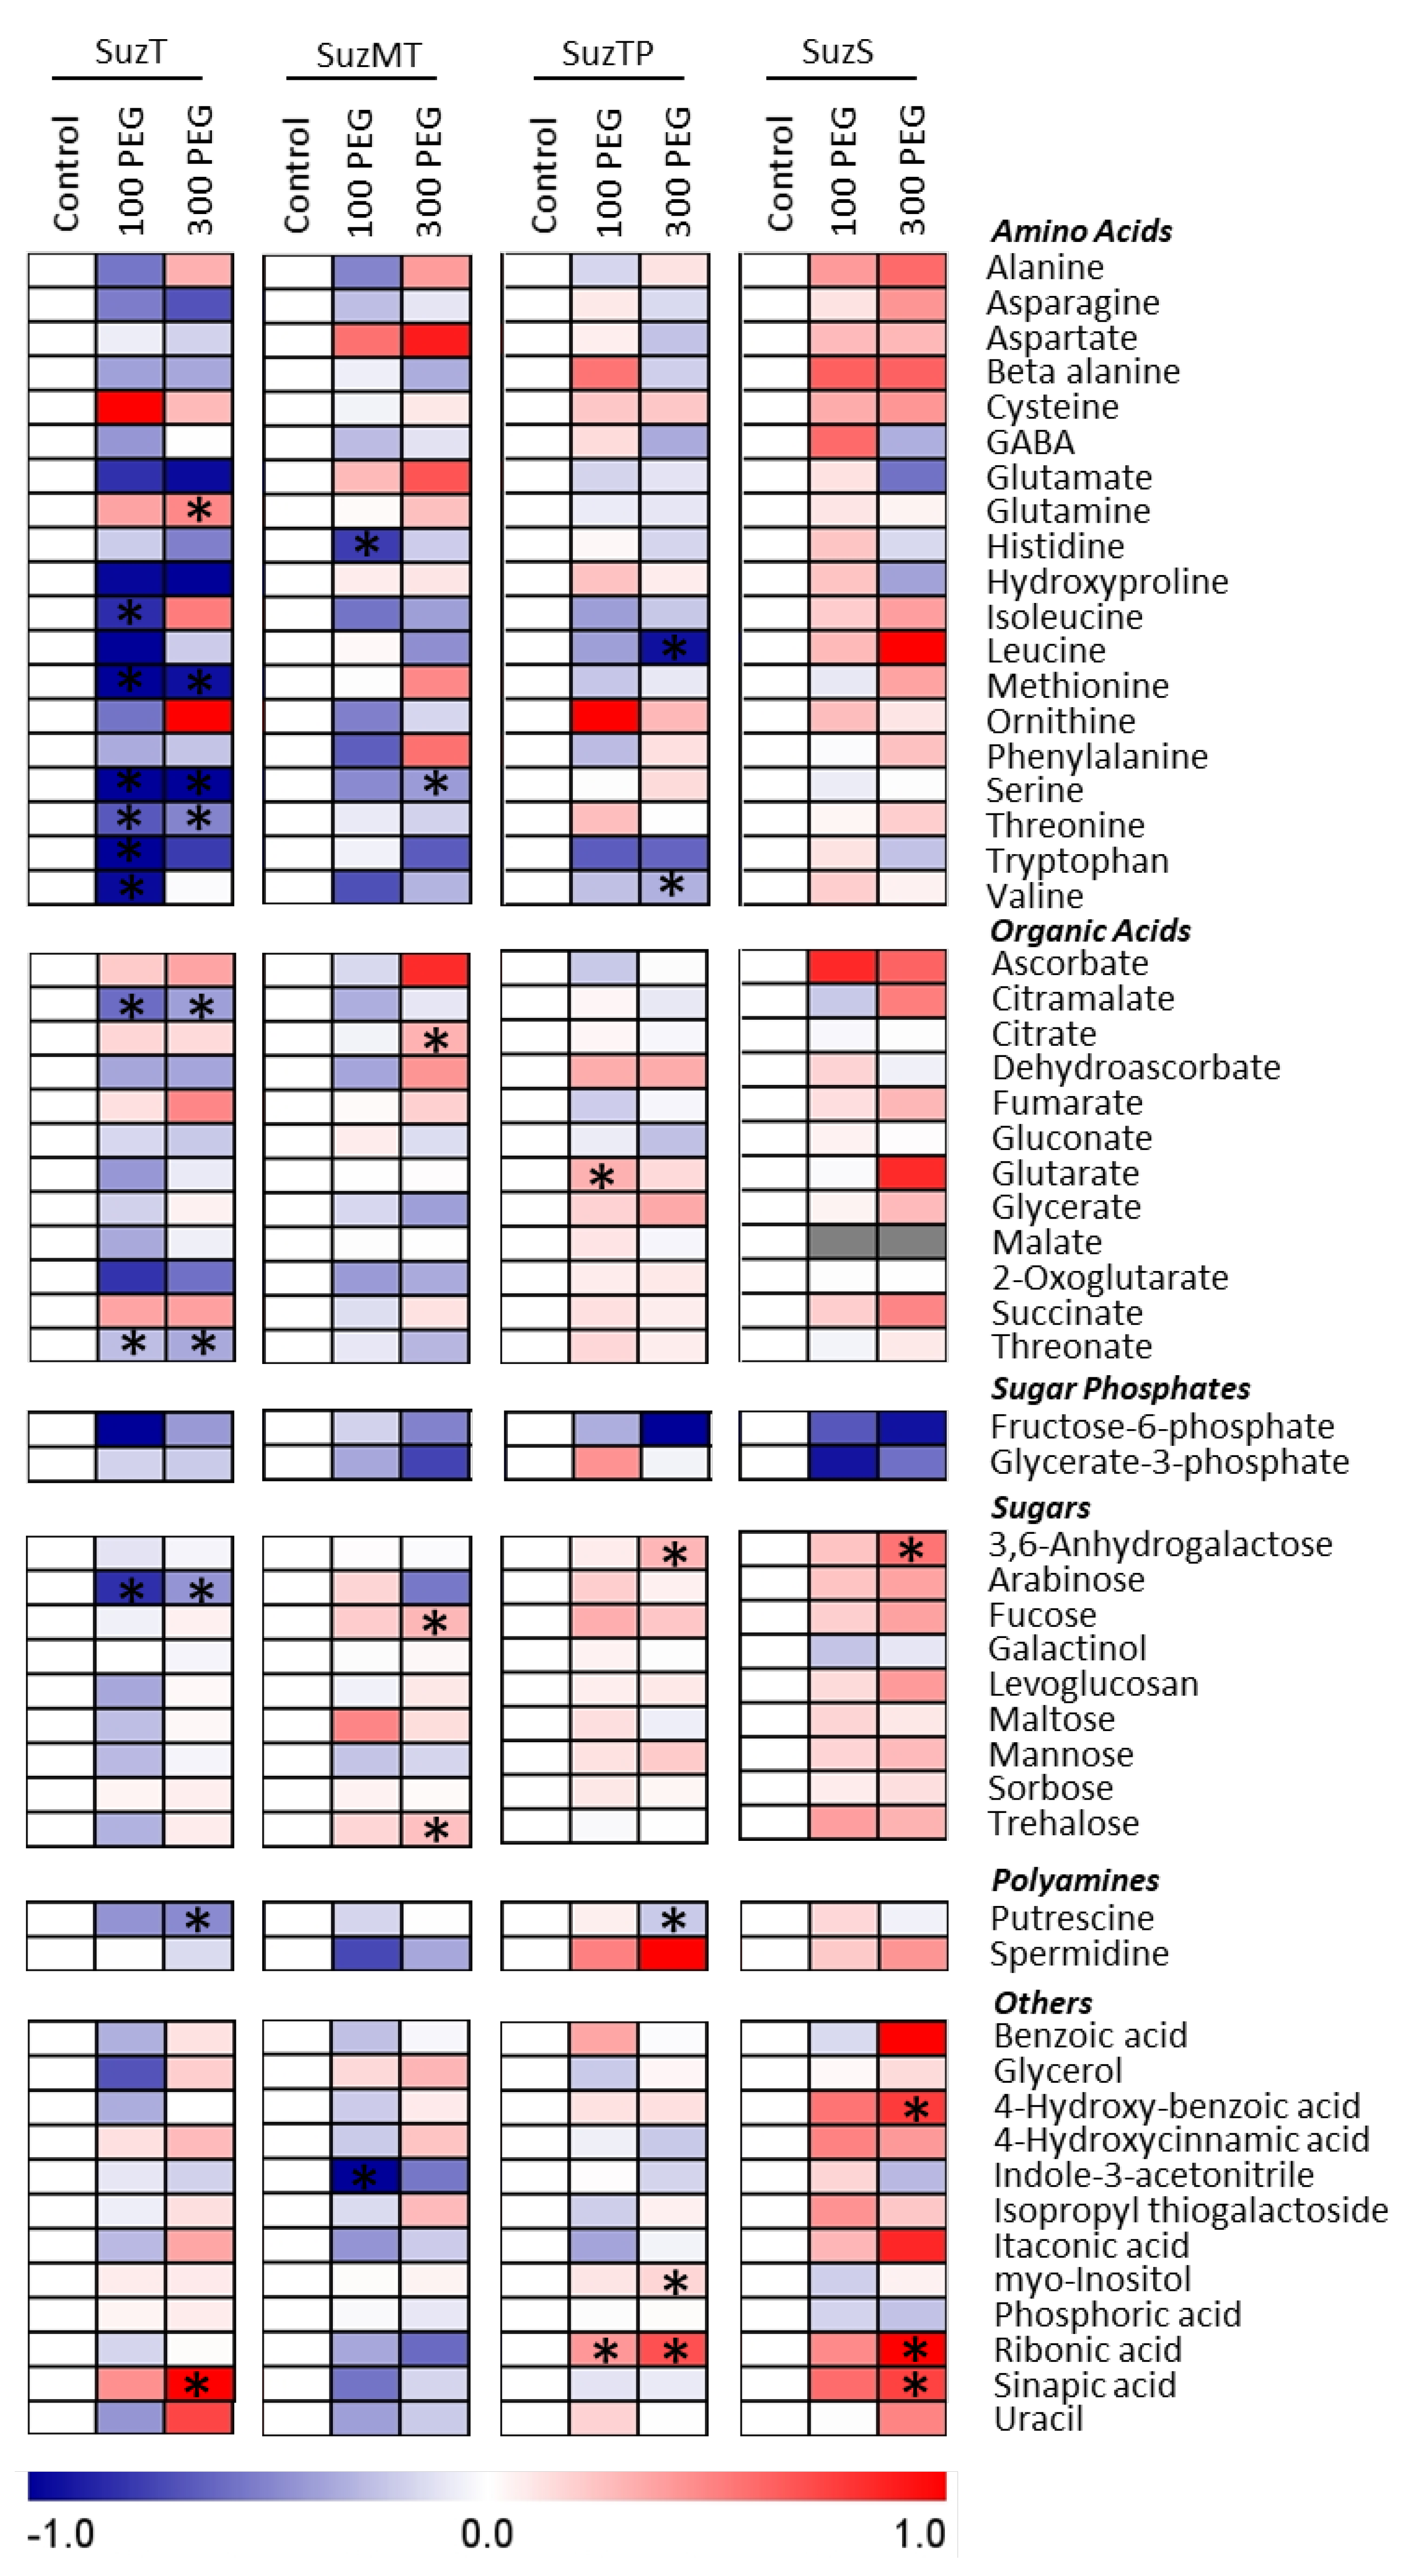
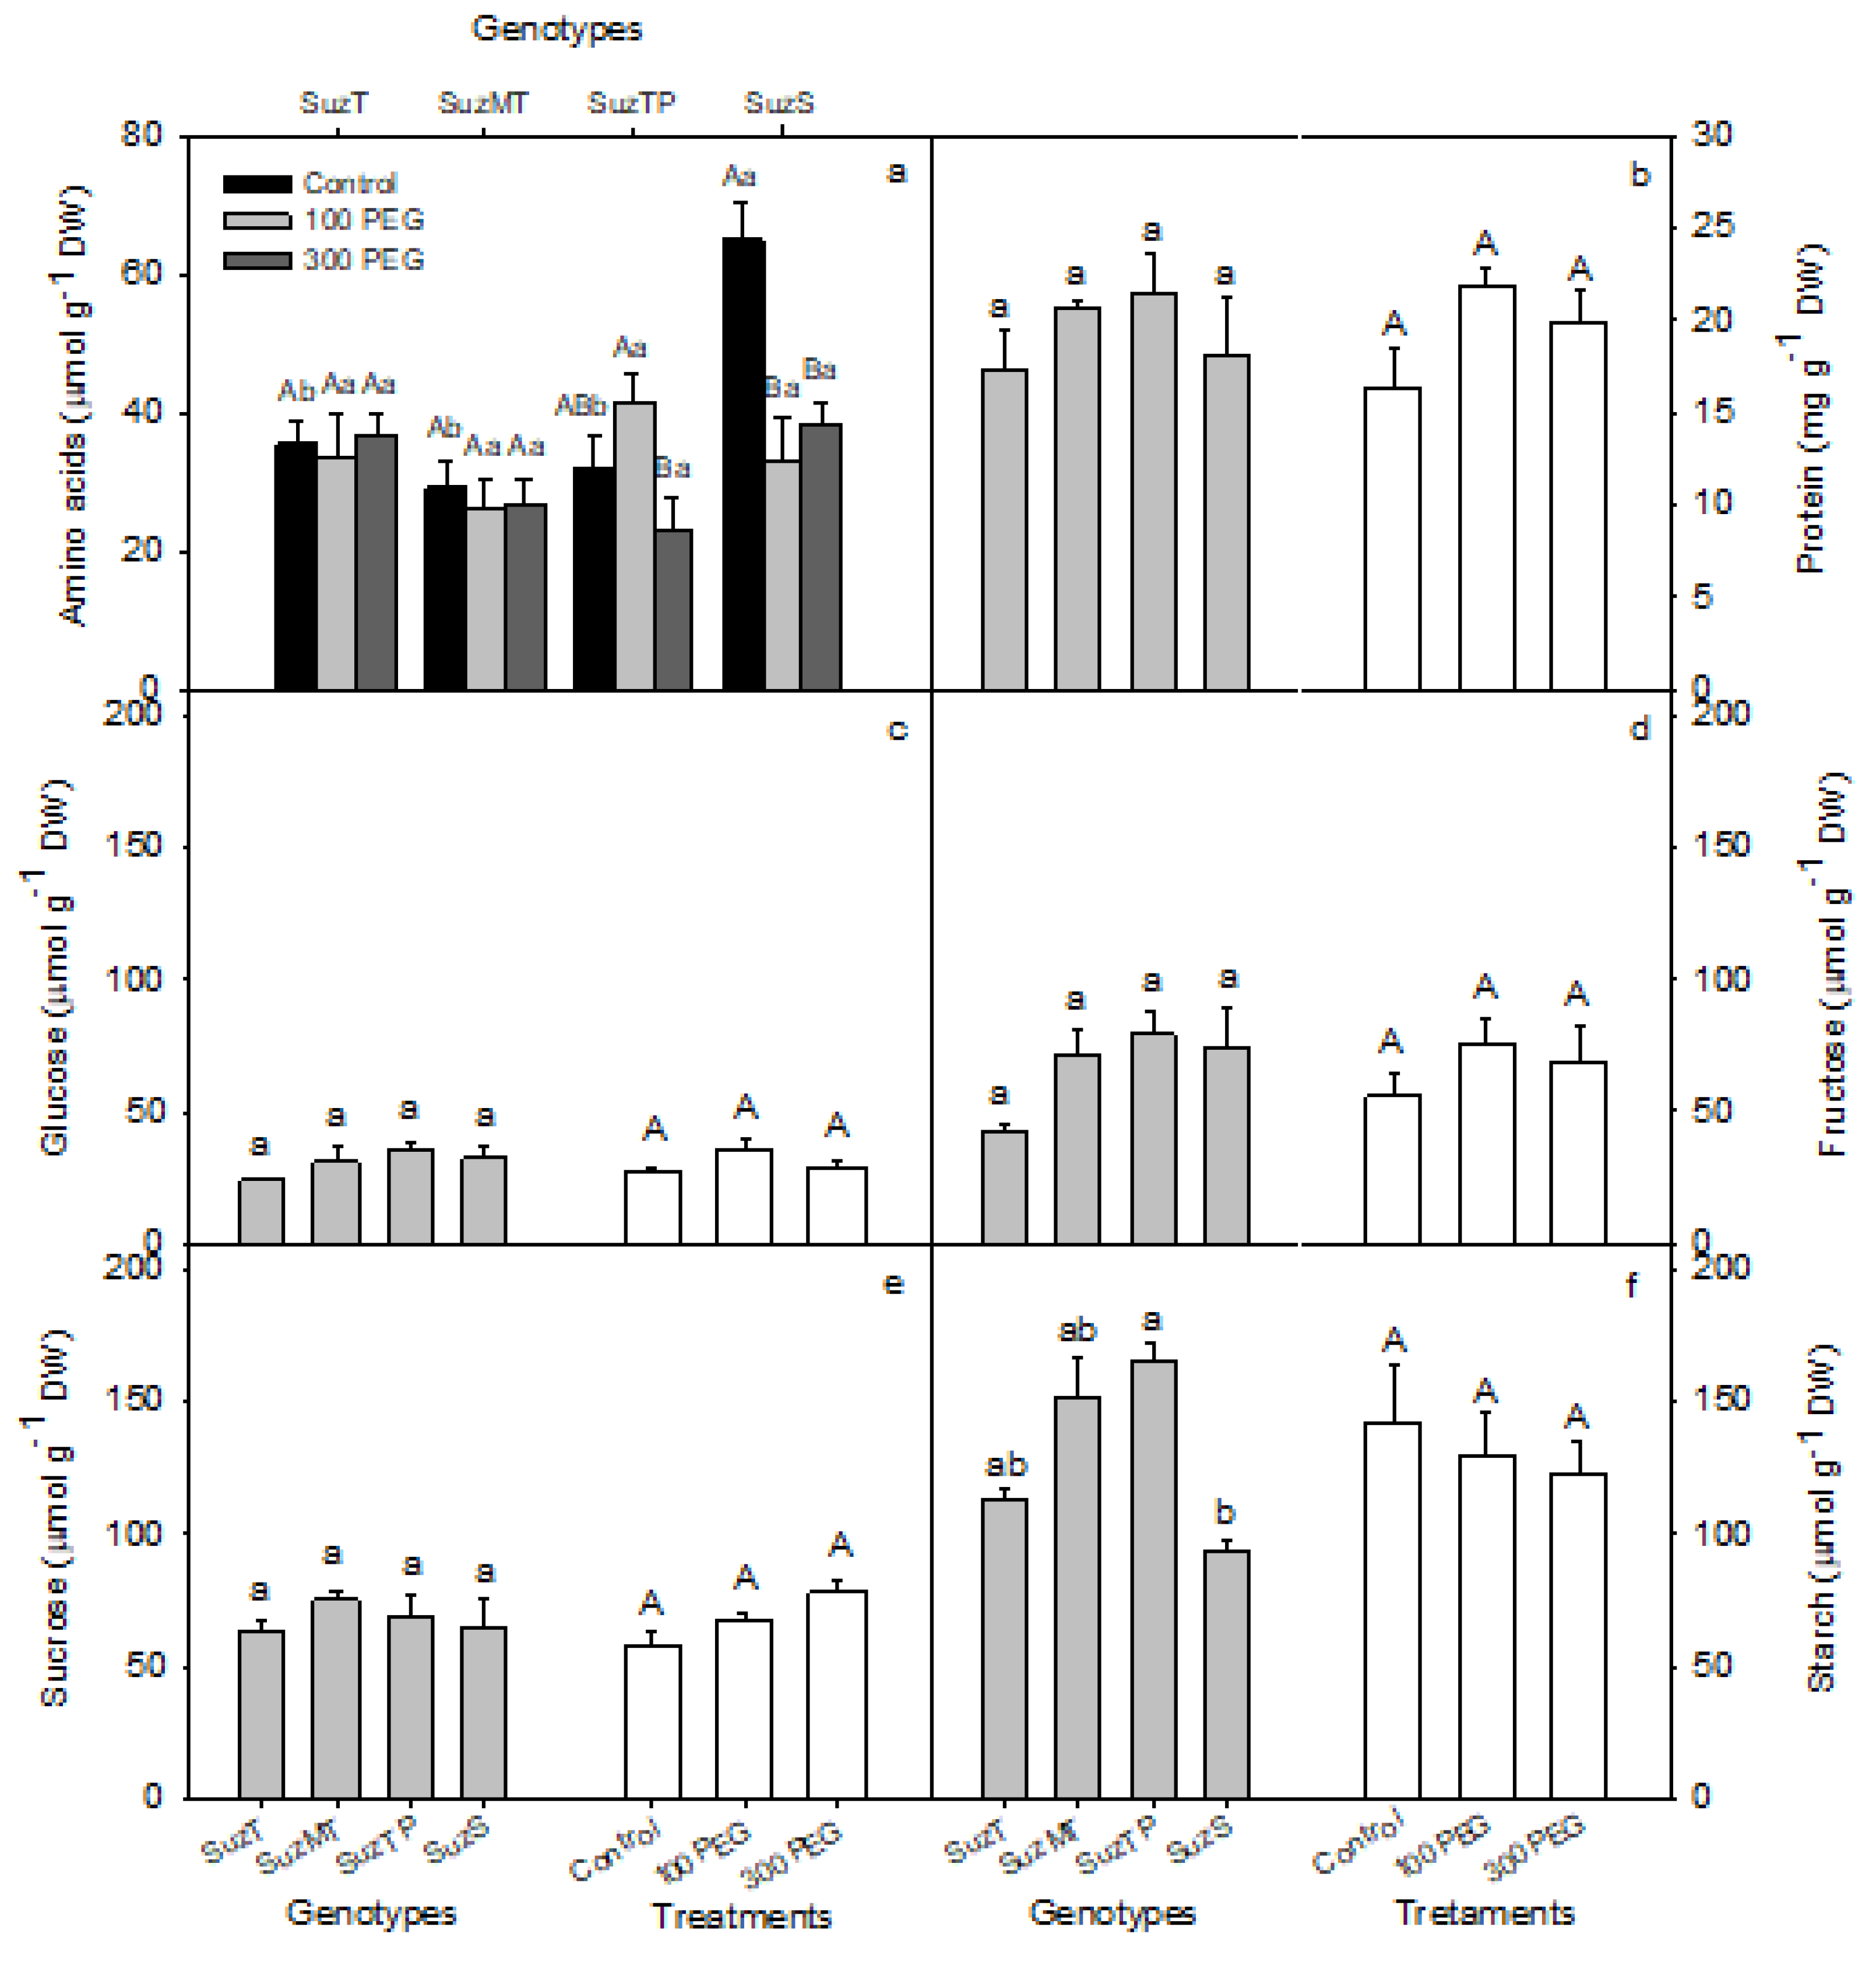
3.5. Effects of Water Deficit on Leaf Metabolites

Fifty-six metabolites were identified in the leaves of all genotypes. There were 19 amino acids, 12 organic acids, 2 sugar phosphates, 9 sugars, 2 polyamines and 12 compounds from others classes of compounds (Figure 6). The water deficit caused significant changes in the contents of some compounds identified by metabolic profile analysis.
There was a significant reduction in the level of six amino acids (serine, tryptophan, valine, threonine, isoleucine and methionine) and an increase in the level of glutamine in the SuzT genotype when subjected to water stress (Figure 6). Despite the variation in the level of these amino acids, when total amino acids were assessed by biochemical analysis (Figure 7a), no significant variations were observed between SuzT’s treatments. This difference occurs because the metabolic profile is efficient to detect only some amino acids, while the biochemical analysis of total amino acids can detect all amino acids present in the sample. Despite the significant variation in the levels of seven individual amino acids in SuzT, when all amino acids are evaluated, these individual variations do not significantly affect the whole. As for the SuzS genotype, no significant variations were detected in the levels of any amino acid identified by the metabolic profile (Figure 6). However, when the total amino acids were evaluated (Figure 7a), it was observed that SuzS had a higher total amino acid content in the control treatment than the other genotypes, but in the water stress treatments, it showed a significant reduction. The SuzMT genotype showed a significant reduction in serine level and SuzTP showed a reduction in leucine and valine levels under water stress.
In the organic acids group, the citramalate decreased significantly with reduction of water availability in SuzT and the citrate increased in the 300PEG treatment of SuzMT (Figure 6). Among the identified sugars, only a few undergone significant changes. A reduction in the level of arabinose was observed in SuzT. There was an increase in fucose and trehalose in SuzMT, while in SuzTP and SuzS an increase in 3,6-anhydrogalactose levels was observed (Figure 6). In the individual sugar analyses, there was no significant variation; however, there was a trend to increase the levels of glucose, fructose and sucrose with water deficit treatments (Figure 7c–e).

4. Discussion

We have little information on the behavior of eucalypt clones according the morphological, physiological, nutritional and metabolic responses range concomitantly. Most of the information is empirical and, in the present report, the information on the genotypes resilience level to dieback derived from the observation in commercial eucalypt plantations. The option for simulating water stress and the use of seedlings in an early selection approach were reasoned to easy future efforts to identify eucalypt genotypes to be used in commercial plots and that are more tolerant to dieback. Further, this information is useful for a better understanding of eucalypt physiological disorder and to the northern strategies and clone features that contribute to dieback tolerance. In this context, procedures that are applicable to general nursery conditions justify our option for the early selection, artificial substrate and the PEG approaches as standardization purpose.
There are several reports of the use of PEG successfully simulating water deficit stress [49,50,51,52,53,54,55]. Further, if plant roots are intact, it seems that the amounts of PEG that are absorbed may be disregarded, and it can be used for decreasing the plant water potential [53]. Corrêa et al.’s [33] results supported the expected reduction in plant water potential in eucalypt leaves submitted to water deficit stress simulation treatments, including PEG.
The water deficit was simulated by regularly supplementing a solution of PEG 6000 to plantlets of commercial Eucalyptus genotypes. The differences in the phenotypic characteristics revealed common mechanisms that eucalypt plants have to cope with water deficit tolerance that contributed to the different levels of tolerance to dieback despite these phenotypes being determined on empirical evaluation in field conditions. Similar approaches have been successfully used to observe plant adaptations to water deficit [49,50], including in Eucalyptus [9,55].
The reduction of plant growth and total biomass production is a common response exhibited by plants under conditions of water deficit [23,54], including the reduction of root growth and leaf area development [21,22]. In our work, the only morphological variable affected by water deficit treatments was stem dry matter. However, important differences were observed among genotypes. The SuzS genotype showed lower values than SuzT for the stem diameter, leaf area, leaf dry matter, stem dry matter and total dry matter. Similar results were reported for E. globulus, where genotypes susceptible to water deficit suffered reduction in growth and in the leaf area [21,23,24,25], while tolerant genotypes maintained a high growth rate and expansion of the leaf area [21,26]. These results indicate that the SuzT genotype has characteristics that allow it to have greater aerial part development, regardless of the treatment applied. This can also be completed by analyzing the root/shoot ratio and biomass partitioning data. Although the absolute dry matter of the roots and plant height do not differ between genotypes, the root/shoot ratio and biomass partition indicate that the SuzS genotype invests a greater proportion of its total dry matter in roots while SuzT invests more in aerial part. This indicates that eucalypt strategies to deal with water deficit in field conditions such as biomass partition are a feature that is sustained in eucalypt plantlets under similar stress conditions.
Despite similar root dry matter among the evaluated genotypes and treatments, there were significant differences in the carbon allocation, even though interactions between genotype and water deficit treatment were absent. This reinforces the need for a richer evaluation of root traits delineated in Picoli et al.’s [17] review that have drawn attention to root architecture, growth restriction, distribution and carbon allocation and that can provide further information to the water deficit resistance in eucalypts.
There are some opposing results for some morphological traits associated with water deficit. For instance, Razouk et al. [56] reported and reasoned an association of a greater leaf area with water deficit susceptibility in olives. There are similar [24,25] and opposing [21,26] observations for eucalypt. Although we observed greater leaf area for the dieback-tolerant eucalypt genotype and simulated water deficit as a trigger for plant responses, the motive for this contradiction deserves a sounder approach and may be due to a wider set of traits and strategies being associated with dieback tolerance.
Andrade Bueno et al. [57] observed that dieback-tolerant eucalypt genotypes had smaller but more frequent xylem vessel elements which reduced the chances of embolism and favored the maintenance of wood production. In contrast, Condé et al. [58], analyzing the same genotypes used in our work, observed that genotypes susceptible to dieback submitted to water deficit showed a reduction in the petiole phloem area, while tolerant genotypes showed similar responses independently from the water deficit treatment. The photoassimilate transport by phloem is affected in water deficit conditions, causing a reduction in carbon reserves in some tissues and, in severe situations, leading the plant to death [59]. Maintaining the phloem area in the tolerant genotype is advantageous because it allows greater translocation of nutrients necessary for the plant development [58]. A vascular system better adapted to situations of water deficit [50,57,60] is in accordance with the SuzT genotype responses, allowing greater aerial part development, regardless of the water deficit treatment applied.
It was observed that SuzT exhibits higher concentrations of Ca and lower of B compared to SuzS. Both Ca and B play important structural roles in plant cell walls, providing rigidity and maintaining their integrity [60,61]. Identifying the plant’s nutritional status depends on establishing reference values for nutrient concentration, such as the critical level [62]. The critical level is characterized as the concentration that determines whether the foliar content of the nutrient is deficient or sufficient. When the nutrient content in the leaf is below the critical level, it means that the nutrient accumulation rate is not sufficient to meet the demands of the biomass accumulation rate [63]. According to Wadt and Novais [64], the critical level of Ca for Eucalyptus grandis is equivalent to 1 dag.kg−1, and Herbert [65] mentions that the optimal value of Ca in eucalyptus leaves is greater than 1 dag.kg−1. According to these references, only the SuzT genotype has adequate concentrations of Ca in leaves. These reference values are variable and depend on factors such as the genotype and the environmental conditions under assessment [62]. Despite this, the higher values of Ca in the SuzT genotype may be associated with the greater accumulation of biomass (LDM, SDM and TDM) presented by it.
B is a continuously required nutrient for the formation of cell walls in developing plant tissues and the first signs of its deficiency in E. globulus are seen in young leaves [66]. According to Malavolta et al. [67], the B content considered adequate in leaf tissue of hybrids of Eucalyptus grandis × Eucalyptus urophylla is between 13 and 30 mg.kg−1, while contents between 8 and 12 mg.kg−1 are considered deficient. According to this classification, the values observed for all genotypes evaluated in this study are considered adequate, ranging from 19.17 to 26.61 mg.kg−1. The leaf content of B is a characteristic that can vary depending on the genetic material, the growing environment and the age of the plants [16]. Therefore, we believe that the variation observed in the genotypes evaluated in this study results from the genetic differences between them. However, we emphasize that the lower B content observed in SuzT and SuzMT genotypes, associated with higher LDM, SDM and TDM of these genotypes in relation to SuzS, may indicate greater efficiency in the use of this nutrient. This feature can be considered advantageous since B deficiency is the most common micronutrient problem in eucalyptus plantations in many parts of the world [68].
Although the N content does not differ between SuzT and SuzS, it contributed for the ranking of eucalypt genotypes according to their tolerance to dieback [9]. Interestingly, it was observed that SusS had higher levels of total amino acids than the other genotypes in the control treatment; however, there was no significant difference in protein content between the genotypes. Furthermore, when subjected to water stress, the SuzS genotype suffered a sharp drop in total amino acid content to levels similar to those of the other genotypes. In addition, the photosynthetic rate of SusS was higher than that of the others, but it had the lowest diameter, LDM, SDM and TDM, while SusT had the highest leaf area, LDM and TDM. These results indicate that, despite having a higher photosynthetic rate and higher amino acid content in the control treatment, the SuzS genotype suffered more by water deficit than the other genotypes, and this reflects in its lower biomass. Moreover, it implies that SuzT has a more efficient metabolism under optimal and water deficit conditions and that tolerance to water deficit does not depend exclusively on the amount of amino acids and proteins but on its quality as well.
In general, the water deficit promotes stomatal closure in plants in order to reduce water loss through transpiration, but, at the same time, there is a reduction in the CO2 assimilation through photosynthesis, which also decreases [69,70]. Photosynthesis (A), transpiration rate (E) and stomatal conductance (gs) decreased with water deficit treatments in all genotypes and the photosynthesis was greater in SuzS genotype than in the others. Despite this, gs, E, intrinsic water use efficiency (WUEi), instantaneous water use efficiency (WUE) and Ci/Ca ratio remained the same for SuzT and SuzS, suggesting that SuzT physiological responses are related to increased efficiency in carbon acquisition. This result is reinforced by the presence of a larger leaf area, stem dry mater and total dry matter by SuzT while having a lower photosynthetic rate than SusS, demonstrating that SuzT has a metabolic behavior that favors it in conditions of water deficit.
The accumulation of solutes in the cytosol, such as amino acids and sugars, is a common strategy used by plants in situations of water deficit [23,32]. SuzT displayed a reduction in the levels of several amino acids such as isoleucine, methionine, serine, threonine, tryptophan and valine in the genotype under water deficit. These results suggest that, for the studied eucalyptus genotypes, osmotic maintenance based on the evaluated metabolites does not seem to be one of the strategies to deal with water deficit. This does not rule out that this strategy is available for tolerance to water deficit in Eucalyptus plants [27,29,31,32]. It must be considered that there are several species as genetic background for commercial eucalypt genotypes that can grant it different water deficit tolerance strategies.
Surprisingly, and against our expectations, there were no significant differences in transpiration rate, WUE, WUEi, starch and mono- and disaccharides between SuzT and SuzS, in addition to a greater net photosynthesis for SuzS. We hypothesize that other strategies that were not screened in the present report may be contributing to a more tolerant phenotype [17]. Unpublished data of an ulterior experiment of our group point to different concentration of α and β glucose, among other metabolites, that could be associated with more and less tolerant eucalypt genotypes submitted to water deficit conditions. These isomers are associated with energy consumption/accumulation or cell wall deposition processes, respectively. Accordingly, higher photosynthetic rates in a susceptible clone were not expected, but the contrast with a diminished dry weight might be reasoned on the basis of a different destination of the produced photosynthates.
Conservative metabolism is foreseen to contribute to water deficit tolerance. Despite the reduction in photosynthesis, the concentration of primary metabolism compounds is sustained for all eucalypt genotypes evaluated, with the only exception of the decreased total amino acid content for SuzS when conducted under stress (Figure 7). Other outcomes of this metabolite balance should be the objective of additional research to better understand the metabolism of tolerant eucalypt genotypes under stress conditions.
According to the PCA and cluster analysis, it is possible to infer that the morphological, physiological and nutritional responses of the genotypes to water deficit are more dependent on or affected by inherent characteristics of each genotype than by the treatments with water deficit. This means that the behavior of the genotypes is related to predisposing factors associated with tolerance or susceptibility. In fact, it is possible to differentiate SuzS apart from the others independently of treatment with water deficit. This analysis corroborates the previous results [9,28], showing that, when subjected to water deficit, the SuzMT and SuzTP genotypes behave similarly to SuzT, while SuzS differs from them. Despite data from control and water deficit treatments being analyzed together, this may have caused noise [17,33] that will also have implications on the evaluation and response of each characteristic evaluated.
Plants are expected to have different metabolic, morphological, growth and nutritional responses when submitted to stress conditions [1,10,17,18,20,21,24,25]. These stress responses share common pathways, but it is also expected that the characteristics in a tolerant individual will contribute to this genotype to be better adapted to deal with this stressful factor. There are several lines of evidence that set water deficit as one of the triggers for the occurrence of Eucalyptus dieback [4,5,6,7,8,9]. Dieback is a complex physiological disorder, and, therefore, tolerant genotypes have a series of strategies that contribute to the tolerance, attenuation, slowing down or preventing dieback in conditions favorable to the disease. In the present work, growth characteristics, as higher partition of dry matter of leaves and stem, higher leaf area, nutritional and physiological features, higher Ca content, efficiency in the use of B and maintenance of growth even with reduced photosynthetic rate under water deficit, are reported to contribute to water deficit and dieback tolerance in Eucalyptus.
SuzT exhibited a combination of physiological, metabolic and structural features that granted its growth and, despite differences in photosynthesis, resulted in greater capacity to reallocate resources and sustain growth under water deficit. In addition, SuzT seems to invest in the leaf structure as a tolerance strategy since increasing Ca levels and greater investment in dry matter of the aerial organs are observed. Other adaptive responses of this genotype are related to predisposing factors that suffers little influence of the environment. The observation of broader leaves and the partition of dry matter preferentially to aerial organs, together with a more efficient metabolism and use of nutrients, embody a structural and metabolic scaffold that contributes to tolerance to water deficit in eucalypt.

5. Conclusions

The results presented here support structural, metabolic and physiological adjustments among the contrasting eucalypt genotypes when challenged with osmotic stress. These adjustments are integrated in the plant providing the tolerant genotype conditions to cope with stress conditions such as water deficit. These changes indicate features that characterize genotype ability to cope with stress conditions. Decrease in allometric traits such as stem diameter and leaf and stem dry matter marked the susceptible genotype; although there was a significant genotype/nutrient content interaction, calcium and boron were higher in the dieback-tolerant genotype. Considering the consistent and early evaluation of commercial eucalypt genotypes suggests that screening for dieback and water deficit resistance may be accessed in the plantlet stage. This information is essential to allow the identification of more resistant genotypes to dieback and water deficit conditions and to the understanding of the resistance phenotype.

Supplementary Materials

The following supporting information can be downloaded at: https://www.mdpi.com/article/10.3390/agronomy13051261/s1, Table S1: ANOVA performed to indicate the effect of genotypes (SuzT- tolerant; SuzMT—moderately tolerant; SuzTP- in testing phase; SuzS—susceptible to dieback), treatments (Control; 100 PEG; 300 PEG) and their interaction on osmotic potential, morphological, physiological and nutritional variables and on leaf metabolites. Table S2: Statistical p-value performed to indicate the effect of genotypes (SuzT- tolerant; SuzMT- moderately tolerant; SuzTP- in testing phase; SuzS- susceptible to dieback), treatments (Control; 100 PEG; 300 PEG) and their interaction on osmotic potential, morphological, physiological and nutritional variables and on leaf metabolites. Table S3: Sulfur (S) and copper (Cu) concentration in leaves of eucalyptus genotypes with different levels of dieback tolerance in response to water deficit. Table S4: Contribution morphological, physiological and nutritional variables of Eucalyptus genotypes for the variation of components 1 and 2 of PCA. Variables in bold present the major contributions.

Author Contributions

Conceptualization, E.A.d.T.P., A.N.-N. and T.R.C.; methodology, E.A.d.T.P., A.N.-N. and R.P.O.-G.; software, C.D.C.; validation, R.P.O.-G. and L.L.B.; formal analysis, R.P.O.-G., D.D.C.-M., L.L.B. and W.G.d.C.; investigation, E.A.d.T.P., R.P.O.-G., D.D.C.-M., T.L.E., C.B.d.S.L., G.A.d.S. and L.A.O.; resources, E.A.d.T.P.; data curation, E.A.d.T.P., T.R.C. and R.P.O.-G.; writing—original draft preparation, E.A.d.T.P., R.P.O.-G., D.D.C.-M., A.N.-N. and T.R.C.; writing—review and editing, E.A.d.T.P., R.P.O.-G., L.L.B. and W.G.d.C.; supervision, E.A.d.T.P.; project administration, E.A.d.T.P.; funding acquisition, E.A.d.T.P. All authors have read and agreed to the published version of the manuscript.

Funding

This experiment was part of collaborative research and an induced-demand project with the financial support of Suzano S/A. This work was supported by the “Conselho Nacional de Desenvolvimento Científico e Tecnológico (CNPq)”; and “Fundação de Amparo à Pesquisa do Estado de Minas Gerais (FAPEMIG). The project was awarded with grants and funding from FAPEMIG and CNPq. This study was financed in part by the Coordenação de Aperfeiçoamento de Pessoal de Nível Superior—Brasil (CAPES)—Finance Code 001. The funding sources were not involved in the decision to submit the article for publication.

Data Availability Statement

The datasets for this manuscript are available upon request to Suzano S/A staff. Some of the information may not be disclosed according to a confidentiality contract. Requests to access the datasets should be directed to Edival Zauza, edivalzauza@suzano.com.br.

Acknowledgments

We thank the company Suzano S/A for the availability of clones for the experiments, grants and grant permission to publish the results. The authors are grateful for the support in the conduction of the eucalyptus seedlings at Clonar’s facilities. This experiment was part of collaborative research and an induced-demand project with the financial support of Suzano S/A. Research fellowships granted by Conselho Nacional de Desenvolvimento Científico e Tecnológico (CNPq) to RPO-G (process number 150059/2018-3 and 152121/2019-6) and AN-N (process number 306818/2016-7) are gratefully acknowledged. Thanks to K.N. Kuki (Universidade Federal de Viçosa) for the support and help in the conversion of degrees Horvet (°H) to MegaPascal (MPa).

Conflicts of Interest

The authors declare no conflict of interest.

References

  1. Jurskis, V. Eucalypt decline in Australia, and a general concept of tree decline and dieback. For. Ecol. Manag. 2005, 215, 1–20. [Google Scholar] [CrossRef]
  2. Dianese, J.G.; Haridasan, M.; Moraes, T.S.A. Tolerance to ‘Mal do Rio Doce’, a major disease of Eucalyptus in Brazil. Trop. Pest. Manag. 1984, 30, 247–252. [Google Scholar] [CrossRef]
  3. Leite, F.P.; Novais, R.F.; Silva, I.R.; Barros, N.F.; Neves, J.C.L.; Medeiros, A.G.B.; Ventrella, M.C.; Villani, E.M.A. Manganese accumulation and its relation to “eucalyptus shoot blight in the Vale do Rio Doce”. Rev. Bras. Ciênc. 2014, 38, 193–204. [Google Scholar] [CrossRef] [Green Version]
  4. Fensham, R.J.; Holman, J.E. Temporal and spatial patterns in drought-related tree dieback in Australian Savanna. J. Appl. Ecol. 1999, 36, 1035–1050. [Google Scholar] [CrossRef] [Green Version]
  5. Worrall, J.J.; Egeland, L.; Eager, T.; Mask, R.A.; Johnson, E.W.; Kemp, P.A.; Shepperd, W.D. Rapid mortality of Populus tremuloides in southwestern Colorado, USA. For. Ecol. Manag. 2008, 255, 686–696. [Google Scholar] [CrossRef] [Green Version]
  6. Allen, C.D.; Macalady, A.K.; Chenchouni, H.; Bachelet, D.; McDowell, N.; Vennetier, M.; Kitzberger, T.; Rigling, A.; Breshears, D.D.; Hogg, E.H.; et al. A global overview of drought and heat induced tree mortality reveals emerging climate change risks for forests. For. Ecol. Manag. 2010, 259, 660–684. [Google Scholar] [CrossRef] [Green Version]
  7. Peng, C.; Ma, Z.; Lei, X.; Zhu, Q.; Chen, H.; Wang, W.; Liu, S.; Li, W.; Fang, X.; Zhou, X. A drought-induced pervasive increase in tree mortality across Canada’s boreal forests. Nat. Clim. Chang. 2011, 1, 467–471. [Google Scholar] [CrossRef]
  8. Carnicer, J.; Coll, M.; Ninyerola, M.; Pons, X.; Sánchez, G.; Peñuelas, J. Widespread crown condition decline, food web disruption, and amplified tree mortality with increase climate-type drought. Proc. Natl. Acad. Sci. USA 2011, 108, 1474–1478. [Google Scholar] [CrossRef] [Green Version]
  9. Corrêa, T.R.; Picoli, E.A.T.; Souza, G.A.; Condé, S.A.; Silva, N.M.; Lopes-Mattos, K.L.B.; Resende, M.D.V.; Zauza, E.A.V.; Oda, S. Phenotypic markers in early selection for tolerance to dieback in Eucalyptus. Ind. Crop. Prod. 2017, 107, 130–138. [Google Scholar] [CrossRef]
  10. Nogueira, R.J.M.C.; Moraes, J.A.P.V.; Burity, H.A.; Bezerra Neto, E. Alterações na resistência à difusão de vapor das folhas e relações hídricas em aceroleiras submetidas à déficit de água. Rev. Bras. Fisiol. Veg. 2001, 13, 75–87. [Google Scholar] [CrossRef]
  11. Flexas, J.; Bota, J.; Escalona, J.M.; Sampol, B.; Medrano, H. Effects of drought on photosynthesis in grapevines under field conditions: An evaluation of stomatal and mesophyll limitations. Funct. Plant Biol. 2002, 29, 461–471. [Google Scholar] [CrossRef] [PubMed] [Green Version]
  12. Chaves, M.M.; Maroco, J.; Pereira, J.S. Understanding plant responses to drought—From genes to the whole plant. Funct. Plant Biol. 2003, 30, 239–264. [Google Scholar] [CrossRef] [PubMed]
  13. Wright, I.J.; Groom, P.K.; Lamont, B.B.; Poot, P.; Prior, L.D.; Reich, P.B.; Schulze, E.D.; Veneklaas, E.J.; Westoby, M. Leaf trait relationships in Australian plant species. Funct. Plant Biol. 2004, 31, 551–558. [Google Scholar] [CrossRef] [PubMed]
  14. Bray, E.A. Plant responses to water deficit. Trends Plant Sci. 1997, 2, 48–54. [Google Scholar] [CrossRef]
  15. Callister, A.N.; Arndt, S.K.; Adams, M.A. Comparison of four methods for measuring osmotic potential of tree leaves. Physiol. Plant. 2006, 127, 383–392. [Google Scholar] [CrossRef]
  16. Dias, L.P.R.; Gatiboni, L.P.; Miquelutti, D.J.; Brunetto, G.; Campos, D.J.P. Boron in preventing of shoot dieback on Eucalyptus benthamii grown in soil with different water regimes. Rev. Sci. Agrar. 2017, 18, 37–43. [Google Scholar] [CrossRef] [Green Version]
  17. Picoli, E.A.T.; de Resende, M.D.V.; Oda, S. Come Hell or High Water: Breeding the Profile of Eucalyptus Tolerance to Abiotic Stress Focusing Water Deficit. In Plant Growth and Stress Physiology; Gupta, D.K., Palma, J.M., Eds.; Plant in Challenging Environments; Springer: Cham, Switzerland, 2021; Volume 3. [Google Scholar] [CrossRef]
  18. White, T.C.R. Weather, Eucalyptus Dieback in New England, and a General Hypothesis of the Cause of Dieback. Pac. Sci. 1986, 40, 58–78. Available online: http://hdl.handle.net/10125/1005 (accessed on 20 April 2023).
  19. Mattiello, E.M.; Ruiz, H.A.; Silva, I.R.; Barros, N.F.; Neves, J.C.L.; Behling, M. Transporte de boro no solo e sua absorção por eucalipto. Rev. Bras. Ciênc. 2009, 33, 1281–1290. [Google Scholar] [CrossRef] [Green Version]
  20. Shenker, M.; Plessner, O.P.; Tel-Or, E. Manganese nutrition effects on tomato growth, chlorophyll concentration, and superoxide dismutase activity. J. Plant Physiol. 2004, 161, 197–202. [Google Scholar] [CrossRef]
  21. Silva, F.C.; Shvaleva, A.; Maroco, J.; Almeida, M.H. Responses to water stress in two Eucalyptus globulus clones differing in drought tolerance. Tree Physiol. 2004, 4, 1165–1172. [Google Scholar] [CrossRef] [Green Version]
  22. Pita, P.; Cañas, I.; Soria, F.; Ruiz, F.; Toval, G. Use of physiological traits in tree breeding for improved yield in drought prone environments. The case of Eucalyptus globulus. For. Syst. 2005, 14, 383–393. [Google Scholar] [CrossRef] [Green Version]
  23. Amrutha, S.; Parveen, A.B.M.; Muthupandi, M.; Sivakumar, V.; Nautiyal, R.; Dasgupta, M.G. Variation in morpho-physiological, biochemical and molecular responses of two Eucalyptus species under short-term water stress. Acta Bot. Croat. 2019, 78, 125–134. [Google Scholar] [CrossRef] [Green Version]
  24. Correia, B.; Pintó-Marijuan, M.; Castro, B.B.; Brossa, R.; López-Carbonell, M.; Pinto, G. Hormonal dynamics during recovery from drought in two Eucalyptus globulus genotypes: From root to leaf. Plant Physiol. Biochem. 2014, 82, 151–160. [Google Scholar] [CrossRef] [PubMed]
  25. Correia, B.; Pintó-Marijuan, M.; Neves, L.; Brossa, R.; Dias, M.C.; Costa, A.; Castro, B.B.; Araújo, C.; Santos, C.; Chaves, M.M.; et al. Water stress and recovery in the performance of two Eucalyptus globulus clones: Physiological and biochemical profiles. Physiol. Plant 2014, 150, 580–592. [Google Scholar] [CrossRef]
  26. Valdés, A.E.; Irar, S.; Majada, J.P.; Rodríguez, A.; Fernández, B.; Pagès, M. Drought tolerance acquisition in Eucalyptus globulus (Labill.): A research on plant morphology, physiology and proteomics. J. Proteom. 2013, 79, 263–276. [Google Scholar] [CrossRef]
  27. Warren, C.R.; Aranda, I.; Cano, F.J. Metabolomics demonstrates divergent responses of two Eucalyptus species to water stress. Metabolomics 2012, 8, 186–200. [Google Scholar] [CrossRef] [Green Version]
  28. Dias, C.N.; Picoli, E.A.T.; Souza, G.A.; Farag, M.A.; Scotti, M.T.; Barbosa Filho, J.M.; da Silva, M.S.; Tavares, J.F. Phenolics metabolismo provides a tool for screening drought tolerant Eucalyptus grandis hybrids. Austr. J. Crop Sci. 2017, 11, 1016–1025. [Google Scholar] [CrossRef]
  29. Correia, B.; Valledor, L.; Hancock, R.D.; Renaut, J.; Pascual, J.; Soares, A.M.V.M.; Pinto, G. Integrated proteomics and metabolomics to unlock global and clonal responses of Eucalyptus globulus recovery from water deficit. Metabolomics 2016, 12, 141. [Google Scholar] [CrossRef]
  30. Adams, M.A.; Richter, A.; Hill, A.; Colmer, T. Salt tolerance in Eucalyptus spp.: Identity and response of putative osmolytes. Plant Cell Environ. 2005, 28, 772–787. [Google Scholar] [CrossRef]
  31. Merchant, A.; Tausz, M.; Arndt, S.K.; Adams, M.A. Cyclitols and carbohydrates in leaves and roots of 13 Eucalyptus species suggest contrasting physiological responses to water deficit. Plant Cell Environ. 2006, 29, 2017–2029. [Google Scholar] [CrossRef]
  32. Warren, C.R.; Bleby, T.; Adams, M.A. Changes in gas exchange versus leaf solutes as a means to cope with summer drought in Eucalyptus marginata. Oecologia 2007, 154, 1–10. [Google Scholar] [CrossRef] [PubMed]
  33. Corrêa, T.R.; Picoli, E.A.d.T.; Pereira, W.L.; Condé, S.A.; Resende, R.T.; de Resende, M.D.V.; da Costa, W.G.; Cruz, C.D.; Zauza, E.A.V. Very Early Biomarkers Screening for Water Deficit Tolerance in Commercial Eucalyptus Clones. Agronomy 2023, 13, 937. [Google Scholar] [CrossRef]
  34. Szijarto, L.; van de Voort, F.R. Determination of added water and bovine milk to caprine milk. J. Dairy Sci. 1983, 66, 620–623. [Google Scholar] [CrossRef] [PubMed]
  35. Baer, R.J.; Baldwin, K.A. Freezing Points of Bulking Agents Used in Manufacture of Low-Calorie Frozen Desserts. J. Dairy Sci. 1984, 67, 2860–2862. [Google Scholar] [CrossRef]
  36. Henriques, G.S.; Rosado, G.P. Formulação de dietas enterais artesanais e determinação da osmolalidade pelo método crioscópico. Rev. Nutr. 1999, 12, 225–232. [Google Scholar] [CrossRef] [Green Version]
  37. George, E.F.; Hall, M.A.; De Klerk, G.J. Plant growth regulators I: Introduction; auxins, their analogues and inhibitors. In Plant Propagation by Tissue Culture; Springer: Dordrecht, The Netherlands, 2008; pp. 115–174. [Google Scholar]
  38. Sarruge, J.R.; Haag, H.P. Análise Química em Plantas; Departamento de Química, ESALQ/USP: Piracicaba, Brazil, 1974; 56p. [Google Scholar]
  39. Braga, J.M.; Defelipo, B.V. Determinação espectrofotométrica do fósforo em extrato de solo e plantas. Rev. Ceres 1974, 1, 73–85. [Google Scholar]
  40. Alvarez, V.V.H.; Dias, L.E.; Ribeiro, E.S., Jr.; Fonseca, C.A. Métodos de Análises de Enxofre em Solos e Plantas; Editora UFV: Viçosa, Brazil, 2001; 131p. [Google Scholar]
  41. Lisec, J.; Schauer, N.; Kopka, J.; Willmitzer, L.; Fernie, A.R. Gas chromatographymass spectrometry-based metabolite profiling in plants. Nat. Protoc. 2006, 1, 387–396. [Google Scholar] [CrossRef]
  42. Cross, J.M.; von Korff, M.; Altmann, T.; Bartzetko, L.; Sulpice, R.; Gibon, Y.; Palacios, N.; Stitt, M. Variation of enzyme activities and metabolite levels in 24 Arabidopsis accessions growing in carbon-limited conditions. Plant Physiol. 2006, 142, 1574–1588. [Google Scholar] [CrossRef] [Green Version]
  43. Bradford, M.M. A rapid and sensitive method for the quantitation of microgram quantities of protein utilizing the principle of protein-dye binding. Anal. Biochem. 1976, 72, 248–254. [Google Scholar] [CrossRef]
  44. Fernie, A.R.; Roscher, A.; Ratcliffe, R.G.; Kruger, N.J. Fructose 2,6-bisphosphate activates pyrophosphate: Fructose-6-phosphate 1-phosphotransferase and increases triose phosphate to hexose phosphate cycling heterotrophic cells. Planta 2001, 212, 250–263. [Google Scholar] [CrossRef]
  45. Cuadros-Inostroza, A.; Caldana, C.; Redestig, H.; Kusano, M.; Lisec, J.; Peña-Cortés, H.; Willmitzer, L.; Hannah, M.A. (TargetSearch—A Bioconductor package for the efficient preprocessing of GC-MS metabolite profiling data. BMC Bioinform. 2009, 10, 428. [Google Scholar] [CrossRef] [PubMed] [Green Version]
  46. Kopka, J.; Schauer, N.; Krueger, S.; Birkemeyer, C.; Usadel, B.; Bergmüller, E.; Dörmann, P.; Weckwerth, W.; Gibon, Y.; Stitt, M.; et al. GMD@CSB.DB: The Golm Metabolome Database. Bioinformatics 2005, 21, 1635–1638. [Google Scholar] [CrossRef] [PubMed] [Green Version]
  47. Fernie, A.R.; Aharoni, A.; Willmitzer, L.; Stitt, M.; Tohge, T.; Kopka, J.; Caroll, A.J.; Saito, K.; Fraser, P.D.; Deluca, V. Recommendations for reporting metabolite data. Plant Cell 2011, 23, 2477–2482. [Google Scholar] [CrossRef] [PubMed] [Green Version]
  48. Cruz, C.D. GENES—A software package for analysis in experimental statistics and quantitative genetics. Acta Sci. Agron. 2013, 35, 271–276. [Google Scholar] [CrossRef]
  49. Nepomuceno, A.L.; Oosterhuis, D.M.; Stewart, J.M. Physiological responses of cotton leaves and roots to water deficit induced by polyethylene glycol. Environ. Exp. Bot. 1998, 40, 29–41. [Google Scholar] [CrossRef]
  50. Khalid, K.A.; da Silva, J.A.T.; Cai, W. Water deficit and polyethylene glycol 6000 affects morphological and biochemical characters of Pelargonium odoratissimum (L.). Sci. Hortic. 2010, 125, 159–166. [Google Scholar] [CrossRef]
  51. Ji, H.; Li, X. ABA mediates PEG-mediated premature differentiation of root apical meristem in plants. Plant Signal. Behav. 2014, 9, 11. [Google Scholar] [CrossRef] [Green Version]
  52. Basal, O.; Szabó, A.; Veres, S. Physiology of soybean as affected by PEG-induced drought stress. Curr. Plant Biol. 2020, 22, 100135. [Google Scholar] [CrossRef]
  53. Lawlor, D.W. Absorption of polyethylene glycols by plant and their effects on plant growth. New Phytol. 1970, 96, 501–513. [Google Scholar] [CrossRef]
  54. Slama, I.; Ghnaya, T.; Hessini, K.; Messedi, D.; Savouré, A.; Abdelly, C. Comparative study of the effects of mannitol and PEG osmotic stress on growth and solute accumulation in Sesuvium portulacastrum. Environ. Exp. Bot. 2007, 61, 10–17. [Google Scholar] [CrossRef]
  55. Condé, S.A.; Picoli, E.A.T.; Corrêa, T.R.; Dias, L.A.S.; Lourenço, R.D.S.; Silva, F.C.S.; Pereira, W.L.; Zauza, E.A.V. Biomarkers for early selection in eucalyptus tolerant to dieback associated with water deficit. Rev. Bras. Cienc. Agrar. 2020, 15, 7515. [Google Scholar] [CrossRef]
  56. Razouk, R.; Hssaini, L.; Alghoum, M.; Adiba, A.; Hamdani, A. Phenotyping Olive Cultivars for Drought Tolerance Using Leaf Macro-Characteristics. Horticulturae 2022, 8, 939. [Google Scholar] [CrossRef]
  57. Andrade-Bueno, I.G.; Picoli, E.A.T.; dos Santos Isaias, R.M.; Lopes-Mattos, K.L.B.; Cruz, C.D.; Kuki, K.N.; Zauza, E.A.V. Wood anatomy of field grown eucalypt genotypes exhibiting differential dieback and water deficit tolerance. Curr. Plant Biol. 2020, 22, 100186. [Google Scholar] [CrossRef]
  58. Condé, S.A.; Picoli, E.A.T.; Corrêa, T.R.; Lourenço, R.D.S. Marcadores anatômicos do pecíolo e a tolerância à seca de ponteiros e ao déficit hídrico em eucalipto. Nativa 2020, 8, 591–596. [Google Scholar] [CrossRef]
  59. Sala, A.; Piper, F.; Hoch, G. Physiological mechanisms of drought-induced tree mortality are far from being resolved. New Phytol. 2010, 186, 274–281. [Google Scholar] [CrossRef]
  60. Hepler, P.K. Calcium: A Central Regulator of Plant Growth and Development. Plant Cell 2005, 17, 2142–2155. [Google Scholar] [CrossRef] [PubMed]
  61. Miwa, K.; Fujiwara, T. Boron transport in plants: Co-ordinated regulation of transporters. Ann. Bot. 2010, 105, 1103–1108. [Google Scholar] [CrossRef] [Green Version]
  62. Wadt, P.G.S.; Novais, R.F.; Alvarez, V.; Fonseca, S.; Barros, N.F. Valores de referência para macronutrientes em eucalipto obtidos pelos métodos DRIS e chance matemática. Rev. Bras. Ciênc. Solo 1998, 22, 685–692. [Google Scholar] [CrossRef]
  63. Kurihara, C.H.; Maeda, S.; Alvarez, V.H.V. Interpretação de Resultados de Análise Foliar; Embrapa: CPAO: Dourados, Brazil, 2005; 44p, ((Embrapa: CPAO. Documentos, 74), Colombo, PR, Brazil). [Google Scholar]
  64. Wadt, P.G.S.; Novais, R.F. Influência da idade da árvore na interpretação do estado nutricional de Eucalyptus grandis, pelos métodos do nível crítico e do DRIS. In Proceedings of the IUFRO Conference on Silviculture and Improvement for Eucalypt, EMBRAPA; Centro nacional de Pesquisa de Florestas, Colombo, Brazil; 1997; pp. 262–268. [Google Scholar]
  65. Herbert, M.A. Fertilizers and eucalypt plantations in South Africa. In Nutrition of Eucalypts; Attiwill, P.M., Adams, M.A., Eds.; CSIRO: Collingwood, Australia, 1996; pp. 303–325. [Google Scholar]
  66. Marschner, H. Mineral Nutrition in Higher Plants, 2nd ed.; Academic Press: London, UK, 1995; p. 889. [Google Scholar]
  67. Malavolta, E.; Vitti, G.C.; Oliveira, A.S. Avaliação do Estado Nutricional das Plantas: Princípios e Aplicações, 2nd ed.; Potafós: Piracicaba, Brazil, 1997; 319p. [Google Scholar]
  68. Sakya, A.T.; Dell, B.; Huan, L. Boron requirements for Eucalyptus globulus seedlings. Plant Soil 2002, 246, 87–95. [Google Scholar] [CrossRef]
  69. Lawlor, D.W.; Cornic, G. Photosynthetic carbon assimilation and associated metabolism in relation to water deficits in higher plants. Plant Cell Environ. 2002, 25, 275–294. [Google Scholar] [CrossRef] [Green Version]
  70. Harfouche, A.; Meilan, R.; Altman, A. Molecular and physiological responses to abiotic stress in forest trees and their relevance to tree improvement. Tree Physiol. 2014, 34, 1181–1198. [Google Scholar] [CrossRef] [PubMed] [Green Version]
Figure 1. Estimated osmotic potential of the solution of the substrate in the pots where the plants were conducted in the experiment with three different treatments of osmotic stress. The bars represent combined average values of the four genotypes (SuzT-tolerant, SuzMT- medium tolerant, SuzTP-in testing phase, SuzS-susceptible to dieback) in each osmotic stress treatment. In this case, the values of the bars indicate mean ± standard error of twenty replicates (five individual plants per genotype). Lowercase letters compare the treatments by the Tukey test at 5% probability. Control-plantlets managed according to the nursery standard procedures; 300 PEG-plantlets managed according to the standard procedures, with application of 100 mL of 100 g L−1 PEG solution every 2 days; 300 PEG-plantlets managed according to the standard procedures, with application of 100 mL of 300 g L−1 PEG solution every 2 days. Letters indicate significant differences at 0.05 level.
Agronomy 13 01261 g001
Figure 2. Changes in morphological variables of seven-month-old seedlings of Eucalyptus genotypes with different levels of dieback tolerance in response to water deficit. (a) Leaf dry matter; (b) stem dry matter; (c) root dry matter; (d) total dry matter; (e) root/shoot ratio; (f) biomass partitioning. The genotype–treatment interaction was not significant. The gray and white bars show the values for the genotypes and treatments, respectively (ae). The grey bars represent combined average values of the three treatments in each genotype and the white bars represent combined average values of the four genotypes in each treatment. In this case, the values of the gray and white bars indicate mean ± standard error of fifteen and twenty replicates (five individual plants per genotype per treatment), respectively. The bars in graph f represent the percentage of biomass composed of root, stem and leaf for each genotype and treatment. Each subdivision in the genotype’s bars (root, stem, leaf) represents average values of the three combined treatments and each subdivision in the treatment’s bars (root, stem, leaf) represents average values of the four combined genotypes. Lowercase letters compare the four genotypes and capital letters compare the three treatments by the Tukey test at 10% probability. SuzT- tolerant; SuzMT- moderately tolerant; SuzTP- in testing phase; SuzS- susceptible to dieback. Control—plantlets managed according to the nursery standard procedures; 100 PEG—plantlets managed according to the standard procedures, with application of 100 mL of 100 g.L−1 PEG solution every 2 days; 300 PEG- plantlets managed according to the standard procedures, with application of 100 mL of 300 g.L−1 PEG solution every 2 days. Letters indicate significant differences at 0.05 level.
Agronomy 13 01261 g002
Figure 3. Morphological differences between seven-month-old seedlings of Eucalyptus genotypes with distinct levels of dieback tolerance in response to water deficit. (a) Stem Diameter; (b) number of branches; (c) number of nodes; (d) plant height; (e) leaf area. The genotype–treatment interaction was not significant, so the gray and white bars show the values for the genotypes and treatments, respectively. The grey bars represent combined average values of the three treatments in each genotype, and the white bars represent combined average values of the four genotypes in each treatment. In this case, the values of the gray and white bars indicate mean ± standard error of fifteen and twenty replicates (five individual plants per genotype per treatment), respectively. Lowercase letters compare the four genotypes and capital letters compare the three treatments by the Tukey test at 5% probability. SuzT- tolerant; SuzMT- moderately tolerant; SuzTP- in testing phase; SuzS- susceptible to dieback. Control- plantlets managed according to the standard nursery procedures; 100 PEG- plantlets managed according to the standard procedures, with application of 100 mL of 100 g.L−1 PEG solution every 2 days; 300 PEG- plantlets managed according to the standard procedures, with application of 100 mL of 300 g.L−1 PEG solution every 2 days. Letters indicate significant differences at 0.05 level.
Agronomy 13 01261 g003
Figure 4. Changes in physiological variables of seven-month-old seedlings of Eucalyptus genotypes with different levels of dieback tolerance in response to water deficit. (a) Net photosynthesis (A); (b) stomatal conductance (gs); (c) transpiration rate (E); (d) intrinsic water use efficiency (WUEi); (e) instantaneous water use efficiency (WUE); (f) internal and external CO2 concentration ratio (Ci/Ca). The genotype–treatment interaction was not significant, so the gray and white bars show the values for the genotypes and treatments, respectively. The grey bars represent combined average values of the three treatments in each genotype, and the white bars represent combined average values of the four genotypes in each treatment. The values of the gray and white bars indicate mean ± standard error of fifteen and twenty replicates (five individual plants per genotype per treatment), respectively. Lowercase letters compare the four genotypes and capital letters compare the three treatments by the Tukey test at 10% probability. SuzT- tolerant; SuzMT- moderately tolerant; SuzTP- in testing phase; SuzS- susceptible to dieback. Control- plantlets managed according to the nursery standard procedures; 100 PEG- plantlets managed according to the standard procedures, with application of 100 mL of 100 g.L−1 PEG solution every 2 days; 300 PEG- plantlets managed according to the standard procedures, with application of 100 mL of 300 g.L−1 PEG solution every 2 days. Letters indicate significant differences at 0.05 level.
Agronomy 13 01261 g004
Figure 5. Principal component analysis (PCA) biplot based on morphological, physiological and nutritional dataset of Eucalyptus seedlings submitted to water deficit treatments. Colorful score plot represent the clusters formed using Pearson’s correlation coefficients. Numbers in parentheses give the percent variation explained by the first and the second principal component (PC 1 and PC 2, respectively). Genotypes are identified as: SuzT- tolerant; SuzMT- moderately tolerant; SuzTP- in testing phase; SuzS- susceptible to dieback. Treatments are identified as: Cont- control (plantlets managed according to the nursery standard procedures); 100—100 PEG (plantlets managed according to the standard procedures, with application of 100 mL of 100 g.L−1 PEG solution every 2 days); 300–300 PEG (plantlets managed according to the standard procedures, with application of 100 mL of 300 g.L−1 PEG solution every 2 days). The groups are formed by Pearson correlation coefficients.
Agronomy 13 01261 g005
Figure 6. Heatmap of leaf metabolite profile of seven-month-old seedlings of Eucalyptus genotypes submitted to water deficit. The leaves used in the analysis were collected between 10:00 and 11:30 a.m. Mean of each treatment was normalized by the control mean of the respective genotype and by ln to get the data (n = 5). The significance of differences between the control and osmotic stress treatments of each genotype was determined by t test and is indicated by an asterisk. The scale represents relative values which increase or decrease on metabolite content is represented by the different shades of red and blue, respectively. SuzT- tolerant; SuzMT- moderately tolerant; SuzTP- in testing phase; SuzS- susceptible to dieback. Control—plantlets managed according to the nursery standard procedures; 100 PEG- plantlets managed according to the standard procedures, with application of 100 mL of 100 g.L−1 PEG solution every 2 days; 300 PEG- plantlets managed according to the standard procedures, with application of 100 mL of 300 g.L−1 PEG solution every 2 days.
Agronomy 13 01261 g006
Figure 7. Changes in the content of metabolites involved in nitrogen and carbon metabolism in leaves of seedlings of Eucalyptus genotypes with different levels of dieback tolerance submitted to water deficit treatment. (a) Amino acids; (b) proteins; (c) fructose; (d) sucrose; (e) starch; (f) glucose. The genotype–treatment interaction was significant (a), so the bars show the values for the combination of each genotype with each treatment. In this case, the values of each bar indicate mean ± standard error of five plants. The genotype–treatment interaction was not significant (bf), so the gray and white bars show the values for the genotypes and treatments, respectively. The grey bars represent combined average values of the three treatments in each genotype, and the white bars represent combined average values of the four genotypes in each treatment. In this case, the values of the gray and white bars indicate mean ± standard error of fifteen and twenty replicates (five individual plants per genotype per treatment), respectively. Capital letters compare the treatments within each genotype and lowercase letters compare the genotypes within each treatment by the Tukey test at 5% probability (a). Lowercase letters compare the four genotypes and capital letters compare the three treatments by the Tukey test at 5% probability (bf). SuzT- tolerant; SuzMT- moderately tolerant; SuzTP- in testing phase; SuzS- susceptible to dieback. Control—plantlets managed according to the nursery standard procedures; 100 PEG- plantlets managed according to the standard procedures, with application of 100 mL of 100 g.L−1 PEG solution every 2 days; 300 PEG- plantlets managed according to the standard procedures, with application of 100 mL of 300 g.L−1 PEG solution every 2 days. Abbreviation: DW, dry weight. Letters indicate significant differences at 0.05 level.
Agronomy 13 01261 g007
Table 1. Macro and micronutrients concentration in leaves of seven-month-old seedlings of Eucalyptus genotypes with different levels of dieback tolerance.
GenotypeSuzTSuzMTSuzTPSuzS
N1.22 ± 0.06 ab1.13 ± 0.08 b1.14 ± 0.06 b1.50 ± 0.09 a
P0.23 ± 0.01 a0.24 ± 0.01 a0.29 ± 0.01 a0.24 ± 0.01 a
K1.07 ± 0.02 ab0.83 ± 0.03 b0.98 ± 0.05 ab1.13 ± 0.06 a
Ca1.08 ± 0.03 a0.88 ± 0.04 ab0.95 ± 0.02 ab0.85 ± 0.05 b
Mg0.39 ± 0.01 a0.31 ± 0.01 b0.39 ± 0.01 a0.35 ± 0.01 ab
Zn22.9 ± 1.42 b21.93 ± 0.99 b33.55 ± 1.16 a19.81 ± 0.87 b
Fe173.28 ± 11.94 a95.39 ± 14.44 a177.22 ± 21.95 a118.07 ± 7.37 a
Mn242.52 ± 23.78 a172.01 ± 23.86 a204.50 ± 6.34 a193.81 ± 8.31 a
B20.84 ± 0.54 b19.17 ± 1.45 b24.27 ± 1.60 ab26.61 ±1.69 a
Means followed by the same lowercase letters on the horizontal do not differ from each other by the Tukey test at 5% probability level. Values indicate mean ± standard error of five plants. Nitrogen (N), phosphorus (P), potassium (K), calcium (Ca) and magnesium (Mg) expressed in dag.kg−1 and zinc (Zn), iron (Fe), manganese (Mn) and boron (B) in mg.kg−1. SuzT- tolerant; SuzMT- moderately tolerant; SuzTP- in testing phase; SuzS- susceptible to dieback. Letters indicate significant differences at 0.05 level.
Disclaimer/Publisher’s Note: The statements, opinions and data contained in all publications are solely those of the individual author(s) and contributor(s) and not of MDPI and/or the editor(s). MDPI and/or the editor(s) disclaim responsibility for any injury to people or property resulting from any ideas, methods, instructions or products referred to in the content.

