1. Introduction
As an important economic crop of the Guangdong Province, the banana is one of the pillar industries for the economic development of the province, which is also the largest banana-producing province in China [
1]. However, the process of planting fruit is still mainly carried out manually, which leads to issues such as high labor intensity, high costs, and low efficiency [
2,
3]. In comparison to human workers, agricultural robots offer several advantages, including the ability to operate for longer periods without fatigue. This can lead to increased productivity, application precision, and operational safety. In a prior study, we developed a row-following system for a spraying robot, using traditional image processing techniques. The system included several subtasks such as image binarization, boundary detection, and guidance path generation [
4,
5]. However, our previous findings indicated that changes in the environment, such as variations in light intensity or deep shadows, required frequent parameter adjustments to maintain the accuracy and robustness of the navigation system. To fill this gap, this study attempted to develop an orchard environment perception module that automatically detects and locates trunks based on a deep learning model and depth information. Additionally, a motion control module based on the DWA (dynamic window approach) was designed to cooperate with the final realization of the tree row following.
The existing approaches applied for agricultural robot navigation mainly include GNSSs, laser radars, and cameras [
6]. GNSS-based autonomous guidance is one of the commonly used methods for agricultural robots, with centimeter-level accuracy on a 3D terrain, and has matured into a commercial technology [
7]. However, in real orchards, there often exists dense canopy, which causes the signals emitted by the GNSS to be unstable. To achieve robot navigation in an orchard environment, researchers nowadays mainly focus on the application of LiDAR and camera sensors. LiDAR technology has the advantages of long-range measurement, high accuracy, and resolution, and is often used for obstacle avoidance. In LiDAR-based orchard navigation studies, researchers typically consider tree trunks as obstacles, and then the trunks point cloud data were obtained and clustered, the location of the tree rows could be calculated, and the navigation path could finally be generated [
8,
9,
10,
11]. It was found that there are certain limitations in applying LiDAR for automatic navigation in orchards: (1) The point cloud data provided by LiDAR are highly sparse, especially in the case of missing tree rows, which becomes a major challenge during point cloud clustering. (2) There exists noise in the point cloud data, especially in the unstructured orchard environment, which results in data accuracy reduction. To solve the drawback of the low density of LiDAR point cloud, researchers proposed the idea of using 3D LiDAR with a higher resolution point cloud [
12,
13] or the combination of 2D LiDAR for tree row detection [
14]. Even the density of the data point cloud has been increased by the approaches presented above. There still exist several drawbacks to the use of LiDAR in orchard navigation, as follows: (1) It can only obtain distance and angular orientation information; it cannot provide information about the type of object. (2) During the growth of fruit trees, the trunks are very often covered by leaves, and branches, making it difficult to determine either the driving path or the trunks by using LiDAR only.
Employing camera sensors as a means of perception in agricultural environments is becoming increasingly prevalent due to their cost-effectiveness and capacity to acquire rich sensing information. Image processing techniques, leveraging color-based segmentation approaches, have been frequently utilized in recent studies to detect and isolate path areas in citrus groves, and distinguish traversable terrain from obstacles using soil texture and shadow coloration, among other applications [
15,
16,
17]. Nonetheless, the performance of image processing techniques is notably sensitive to variations in illumination, particularly in orchard settings, where lighting conditions can be inconsistent between shaded and unshaded zones, leading to ambiguous target identification. Furthermore, image processing algorithms are known to require parameter adjustment to account for environmental changes, including seasonal, temporal, or meteorological shifts, to effectively detect and isolate the same target. In contrast, deep learning, which has been rapidly developed recently, has shown its superiority in learning higher-level features, and detecting targets with higher accuracy than image processing algorithms [
18]. Nowadays, deep learning has been widely applied to agricultural-related tasks, such as fruit detection [
19,
20], leaf detection [
21,
22], plant disease detection [
23], and weed detection [
24].
Based on previous literature, tree trunks are stable landmarks, and detecting them can help in building an accurate orchard map that the agricultural robot can rely on, to navigate safely and perform a variety of agricultural tasks. However, as mentioned above, the traditional image process has some limitations in finding these landmarks rapidly and accurately. The main aim of this work is as follows:
This study the attempts to develop an orchard environment perception model based on deep learning and a depth camera that improves the speed and accuracy of trunk detection and location. The model is trained using the designed dataset containing 2453 annotated trunk images.
Local trajectory planning based on the DWA has been designed to achieve row-following motion fluency. NVIDIA Jetson Xavier NX was then employed to perform real-time inference and motion control.
Simulations and experimental tests of the designed method were carried out. The experimental results showed that the robotic system was capable of adjusting its posture in response to different situational demands, and maneuvering through the tree rows.
The rest of this paper is structured as follows:
Section 2 provides an overview of the orchard environment perception model, the design of the trunk detection and location, and the motion control method.
Section 3 details the results of the simulation and row-following test and discussion. Finally,
Section 4 presents the conclusion of this study.
2. Materials and Methods
The block diagram in
Figure 1 shows the methodology, which is divided into two layers: environmental perception and navigation control. First, the RGB image was acquired, and the 3D point cloud was estimated by the ZED 2i camera (Stereolabs Inc., San Francisco, CA, USA). Then, trunk detection was performed, and the detected results were matched with the depth image to output the trunk location point cloud
. To improve the calculation speed and remove redundant information, the 3D point cloud was projected onto the ground to generate 2D coordinates
and feed to the DWA module. Integrated with parameters, such as heading weight, velocity weight, and distance weight, the navigation controller finally generated the expected linear velocity
and expected angular velocity
to the robot platform.
2.1. Field Data Collection and Pre-Processing
To give diversity to the training procedure, and robustness to the final inference result, more realistic elements of the orchard, such as leaves and weeds, different light intensities, canopy shadows, tree trunks with branches, etc., are considered. Four different orchards covering the above characteristics were selected and images were collected at different times of the day under natural daylight, such as morning (9–10 a.m.), noon (11 a.m.–12 p.m.), afternoon (2–3 p.m., 4–5 p.m.). In addition, the image dataset is collected using different types of cameras, including a webcam (Jacksoftw Inc., Finland), a cellphone camera (Xiaomi Inc., China), a monocular camera (Imaging Source DFK 21AU04, The Imaging Source Inc., Germany), and the stereo camera (ZED 2i, Stereolabs Inc., San Francisco, CA, USA). The images are captured under natural daylight, counting disturbances such as varying illumination and shadows, to give diversity to the training procedure and robustness to the final inference result. In addition, 10% of the total images without objects are added to the dataset to reduce false positives. The original dataset was then divided into the following categories: 1472 for training, 736 for validation, and 245 for testing. All images were resized to 640 × 480 before training. Some of the raw datasets taken from the different orchards are shown in
Figure 2.
All ground truth images are manually annotated using the annotation tool, Labelme 4.5.11 (MIT, Computer Science and Artificial Intelligence Laboratory, 32 Vassar St, Cambridge MA 02139) [
25]. The output of this process is a set of bounding boxes for each image. The bounding boxes are represented in a .txt file containing the label class. One of the major challenges in deep learning is overfitting. To improve the model generalization, data augmentation, such as rotation, translation, scaling, flipping, and saturation, are applied to increase data variability for training.
Figure 3 shows an example of applying augmentation operations to images.
2.2. Trunk Detection
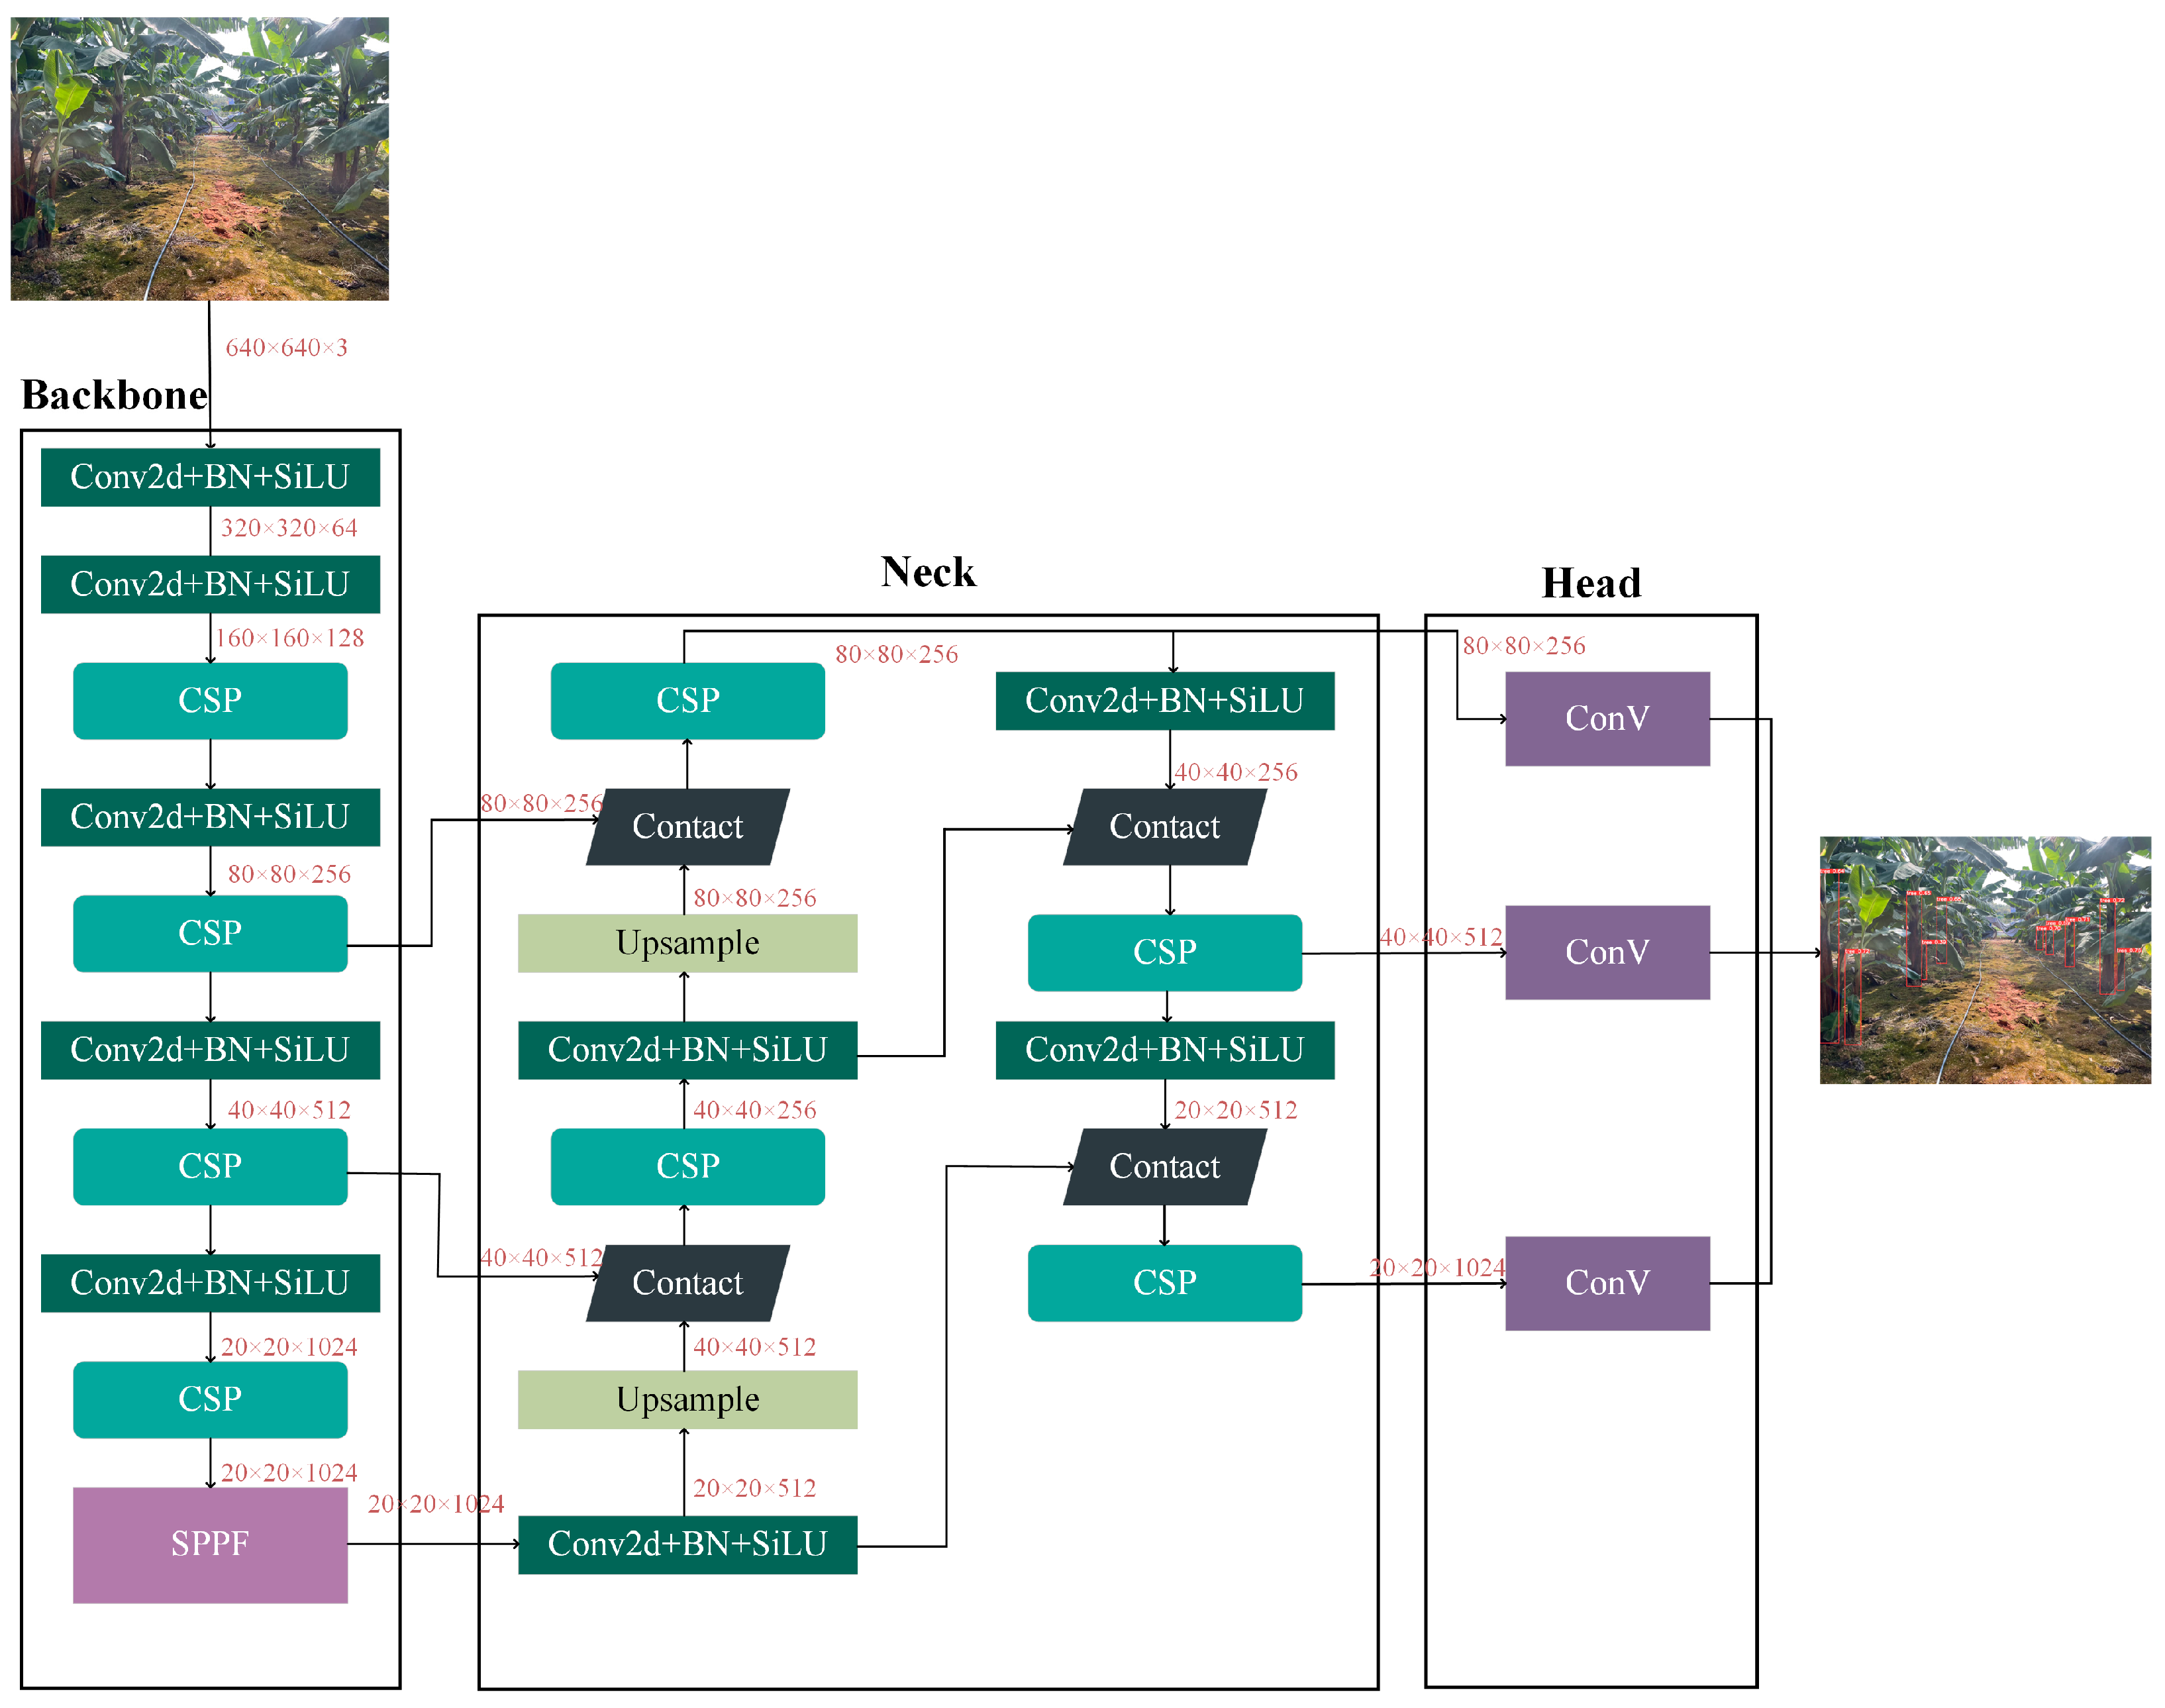
Deep-learning-based object detection can be categorized into two main types: one-stage classifiers and two-stage classifiers. The former tackles the problem of object detection as a regression task, thereby eliminating the need for region proposal, leading to faster processing compared to the latter. The YOLO algorithm is a one-stage object detection approach that leverages convolutional neural networks and is renowned for its high speed and accuracy, as documented in prior literature [
26]. The most recent iteration of the YOLO family, YOLOv5, differs from its predecessors in several respects. YOLOv5 6.0 employs PyTorch 1.70 instead of Darknet, with CSPDarknet53 serving as its backbone. This novel design solves the challenge of redundant gradient information in large backbones, by integrating the gradient changes into a feature map. This strategy, in turn, leads to a reduction in inference time, an improvement in accuracy, and a reduction in model size by minimizing the number of parameters. The path aggregation network (PANet) serves as a neck component in the object detection model and enhances the flow of information. It also incorporates a novel feature pyramid network (FPN) that consists of multiple bottom–up and top–down layers. The inclusion of FPN enhances the propagation of low-level features in the model, which, in turn, improves the localization accuracy of objects in the lower layers. The YOLOv5 model features a multi-scale prediction approach that utilizes three output feature maps generated by the head component to efficiently predict objects of varying sizes. The model’s overall architecture is depicted in
Figure 4. During the field test, the ZED 2i camera, which could provide depth information, was installed on the robot platform. Since the coordinates of the pixel points on the RGB image correspond to the coordinates of the pixel points on the XY plane of the depth image, the 3D point cloud of the tree trunk areas detected in the RGB image using YOLOv5 could be matched in the depth image.
2.3. Row-Following Motion Control
The reactive obstacle avoidance technique, known as the dynamic window approach (DWA), was first introduced by [
27] and subsequently adapted by numerous researchers [
28,
29,
30] for implementation in car-like robots. The goal of this planning algorithm is to generate feasible steering and motion instructions within short time intervals to guide the robot to its destination. Using the kinematic constraints of the robot, a 2D velocity search space is constructed by considering all feasible velocity pairs
that can be achieved based on its kinematics. Subsequently, this search space,
, is constrained to include only velocity pairs that allow the robot to stop in the vicinity of an obstacle, while taking into account the maximum deceleration of the robot. Such permissible velocity pairs are referred to as admissible velocities,
. Equation (1) is used to determine the admissibility of a velocity pair.
Consider a velocity pair denoted by
, where
and
represent the linear and angular velocities, respectively. The function
is used to calculate the minimum distance between the robot and the nearest obstacle. In addition, the velocity pair
is considered admissible only if the corresponding linear and angular accelerations,
and
, respectively, satisfy the condition expressed in Equation (1), which ensures that the robot can stop before hitting an obstacle. After identifying the feasible velocity pairs, a dynamic window is constructed to facilitate the search for the optimal velocity. The dynamic window is a subset of the velocity search space, denoted by
, which contains velocity pairs that can be reached within the subsequent time interval, while satisfying the acceleration constraints. The determination of reachable velocity pairs is done according to the condition expressed in Equation (2).
The velocity pairs present in the dynamic window
are determined based on both the selected admissible pairs and the current time. These pairs are time-dependent, as they correspond to the velocities that can be achieved during the current time interval, while satisfying the robot’s velocity constraints. A set of feasible trajectories is generated at each time step using all velocity pairs in
. The complete set of feasible velocities for the robot is obtained by combining the robot’s velocity constraints (
), the admissible velocities (
), and the dynamic window (
).
In the set of possible velocity pairs present in the dynamic window, there exists an optimal velocity pair that helps the robot navigate its path efficiently. This optimization problem is solved using a heuristic navigation function.
The process of selecting optimal velocity pairs from the dynamic window, , is based on maximizing the function . The function determines the orientation of the robot by calculating the angle between the current heading direction and the goal point. The function estimates the distance between the robot and the nearest obstacle on the path, while the expression represents the robot’s velocity. The weighting constants , , and are assigned values between 0 and 1 when optimizing the navigation function.
3. Results
3.1. Perceptual Model Evaluation Metrics
Precision, recall, mAP (mean average precision), F1-score, and FPS (frame per second) were used to evaluate the model performance. The formulas for precision, and recall are shown as Equations (5) and (6).
where “
True Positive” is the number of correctly identified good trunks, while “
False Positive” represents the number of non-good trunks incorrectly identified as good. “False Negative” is the number of good trunks missed by the algorithm. The F1 score, as defined by Equation (7), is used as a metric to evaluate the testing accuracy of the model.
The F1 score, which ranges from 0 to 1, indicates the balance between precision and recall, with a higher score indicating better performance. The mAP is used to measure the accuracy of the model, with the value computed using Equation (8),
where
is the average accuracy for a given query. Finally, the FPS metric is used to evaluate the inference speed of the algorithms. The model was trained for 115 epochs using the training data set. The training results showed that the precision, recall, mAP_0.5, and mAP_0.5:0.95 reached 0.78, 0.78, 0.82, and 0.35, respectively, while the F1 score reached 0.78, with a confidence of 0.43. The curves of the metrics were calculated for each training epoch and are shown in
Figure 5, and the curves of the F1 score and PR are shown in
Figure 6.
3.2. Field Test of Depth Error Estimation
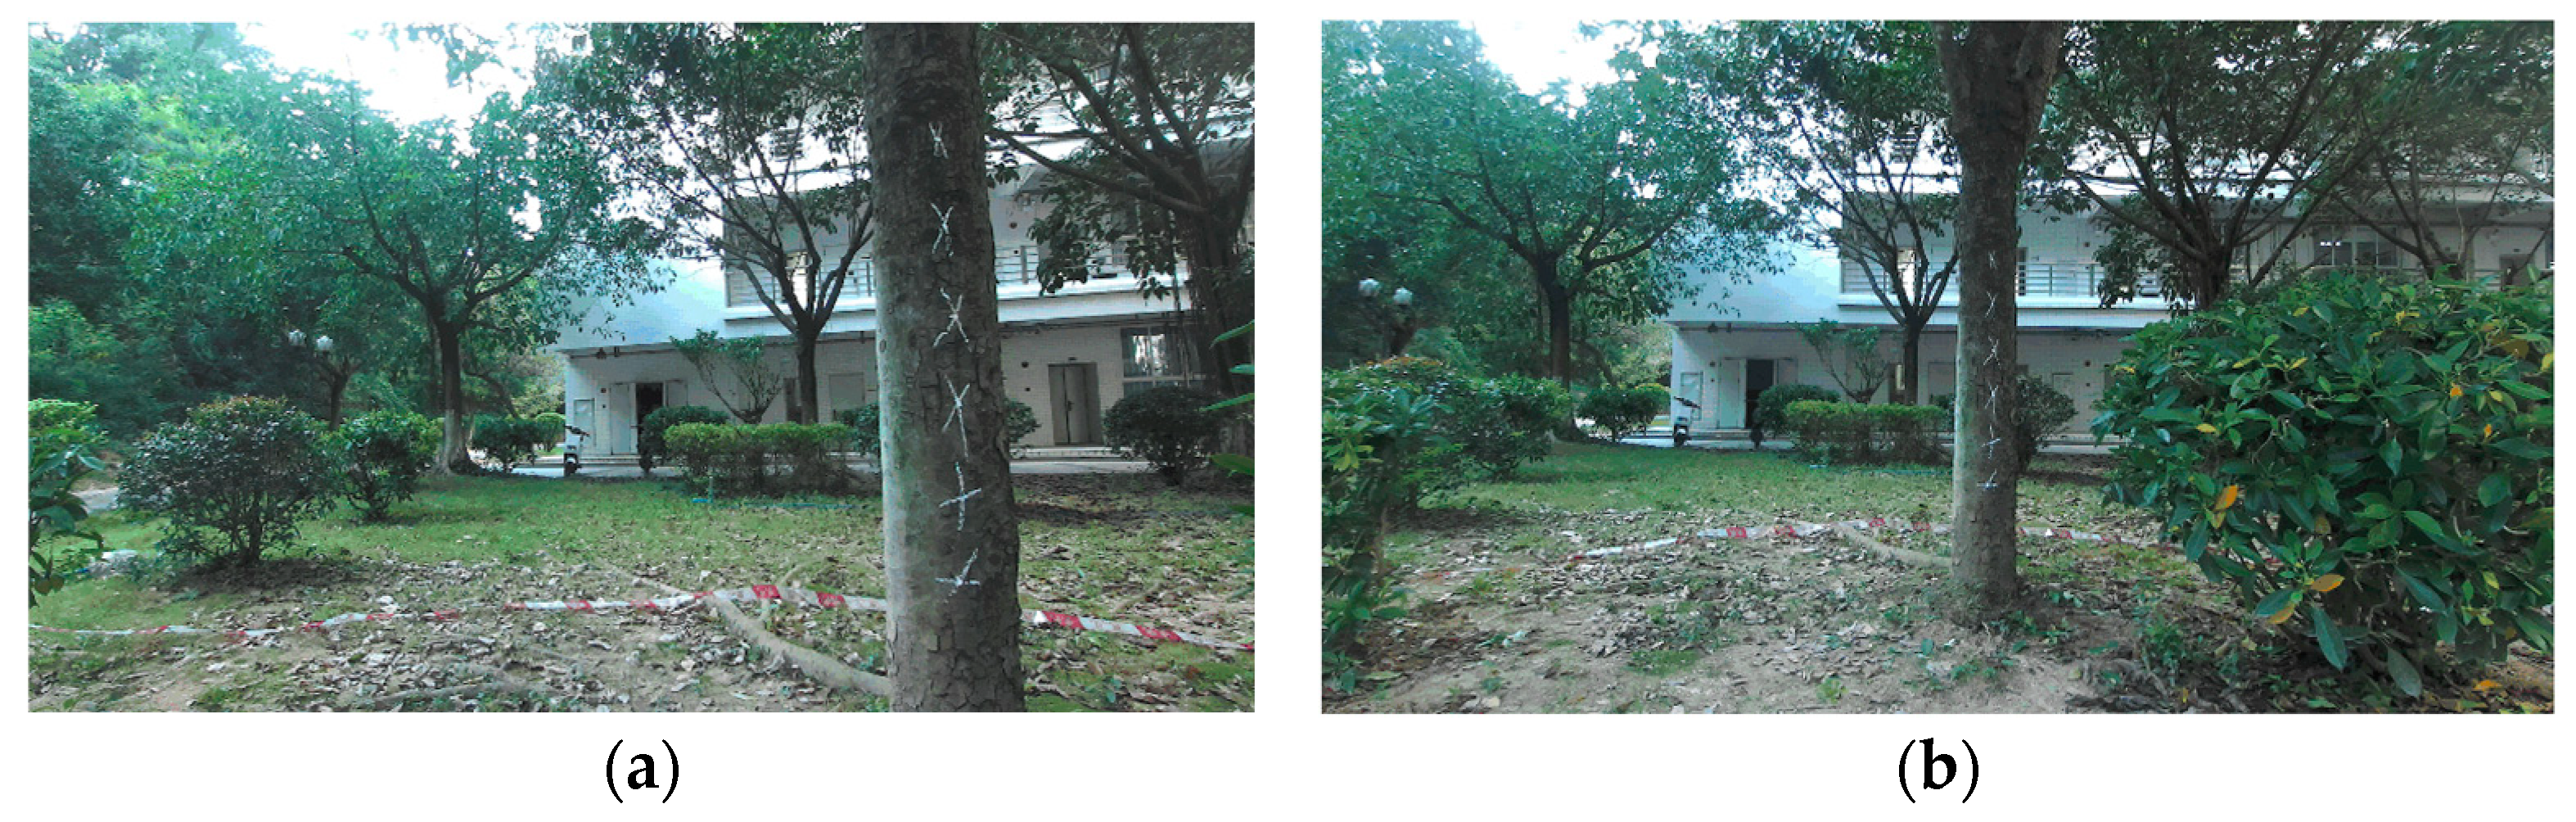
Depth data derived from stereo devices are prone to several sources of error, which can be categorized as hardware system errors, camera calibration errors, and stereo matching errors. It is critical to identify and address these errors in applications that utilize depth data generated by 3D vision sensors, to achieve accurate decision-making in navigation tasks. To fully utilize the sensor’s potential for estimating depth information, a systematic and random error analysis of the data is required. The accuracy of the depth data provided by the camera is first determined by the depth maps captured by the ZED 2i camera, and images are captured under the assumption that there are no changes in the environment, such as variation in light. The depth maps are then estimated using the stereo camera SDK. A field test of ZED2i depth error estimation was performed in an outdoor environment, as shown in
Figure 7. The camera is placed approximately 1.5 m and 2.8 m apart on a flat surface.
To verify the depth estimation, cross points were drawn on the trunks at 20 cm vertical intervals, as shown in
Figure 5. Depth estimates of the cross points were obtained by ZED2i, with the camera at distance 1.5 m and 2.8 m from the tree and at −30 deg, −15 deg, 0 deg, 15 deg, and 30 deg facing the trunks, respectively. The depth information was then compared to the manually measured values, resulting in a total of sixty data points used for error analysis. A comparison of the average error and the standard deviation is displayed in
Figure 8.
3.3. Row-Following Simulation Based on the DWA
To focus on the performance of the algorithms, simulations were developed to evaluate the system before deploying it in a real orchard. An S-shape path was constructed, and the map size was set to 25 m × 50 m. The predicted time was set to three seconds, and the desired gain values of the DWA were further tuned with different initial robot positions and heading. In our test, it was found that satisfactory gains were as follows:
= 0.1,
= 3.0,
= 1.0. The result of the simulation is shown in
Figure 9, and the details are shown in
Figure 10.
As shown in
Figure 9, it was found that even with large initial heading errors, the robot could still regain the center of the path smoothly and quickly. In general, the robot could automatically move forward along the S-shape path and successfully reach the ending pointing. In
Figure 10, the brown circles represent the trunk obstacles, while the yellow circle stands for the robot. After searching for the complete set of feasible velocities, possible robot trajectories were generated using the predicted time as green dashed lines. Finally, an optimal trajectory, represented as a black solid line, which helps the robot navigate its path efficiently, is determined using a heuristic navigation function, mentioned in
Section 2.2.
3.4. Field Test of Tree Row Following
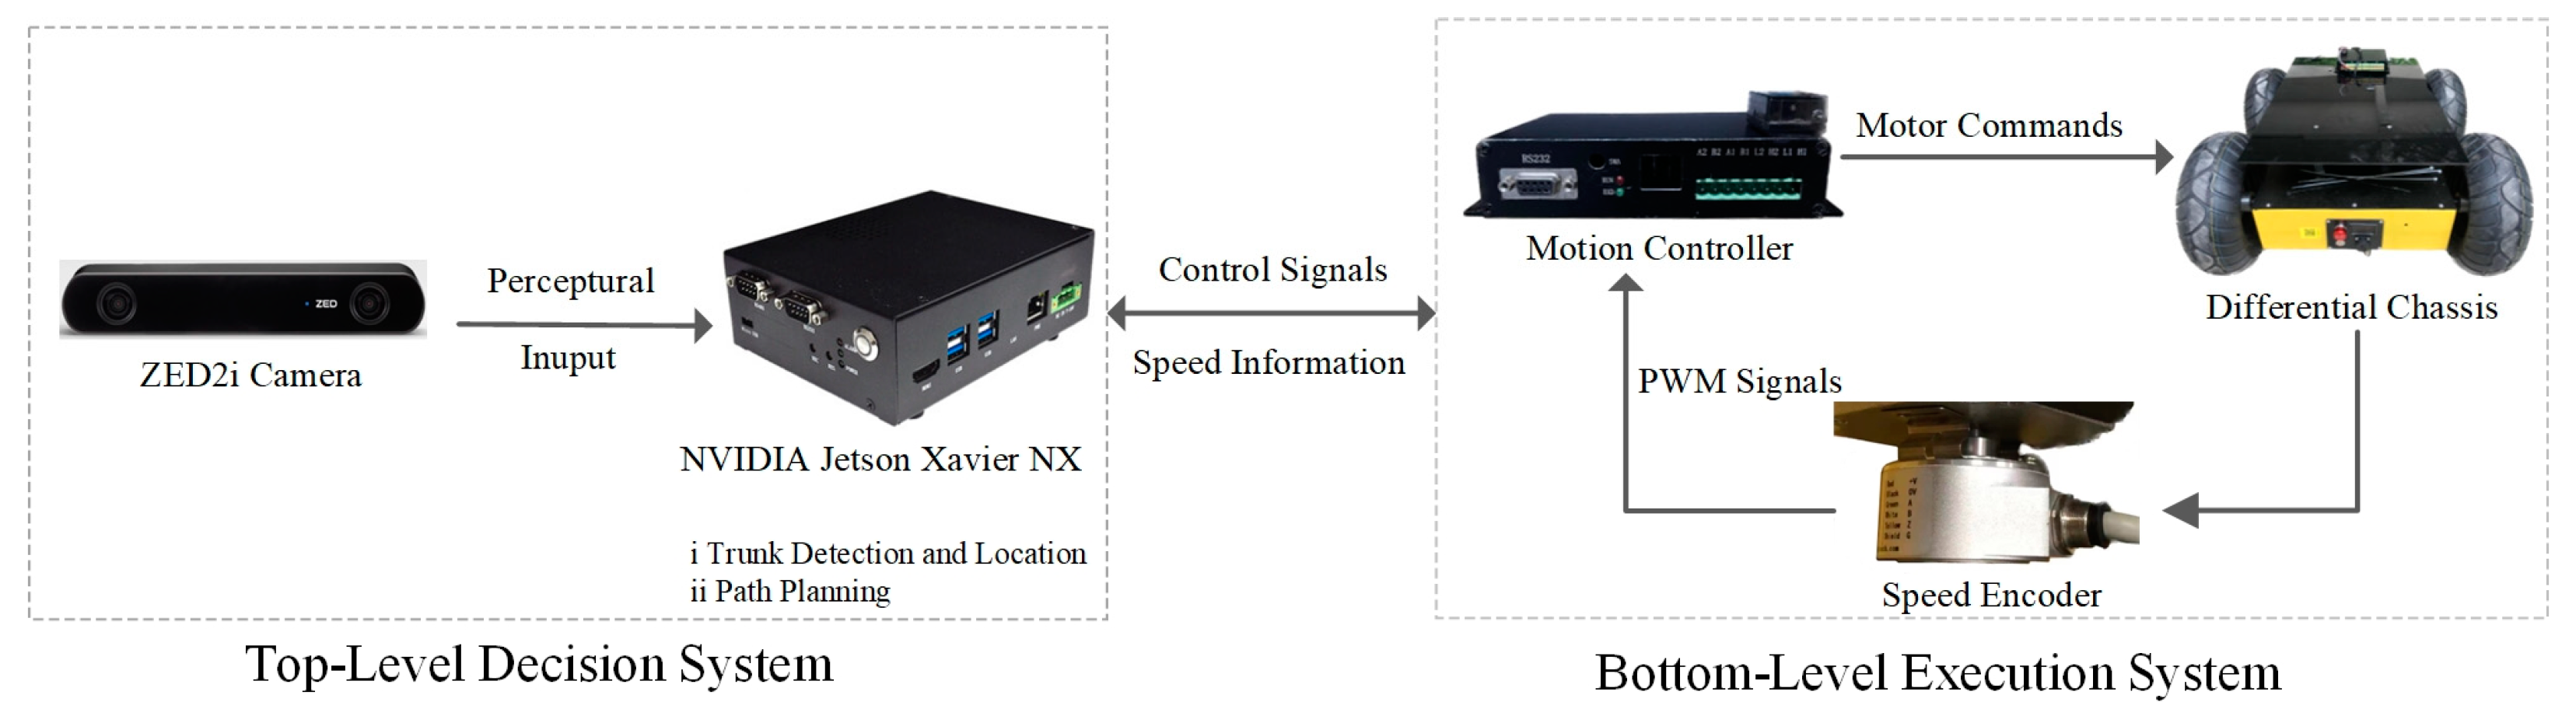
Training is performed on a deep learning server, with RTX3090i running Linux-5.4.0-109 kernel, and Python 3.8.13 is used to construct the deep neural network. After the training process, the best model was deployed in the Jetson Xavier NX, which could provide up to 21 TOPS of computing performance at 15 W maximum power consumption. A differential-drive robotic platform, Warthog01, is used in our study. As shown in
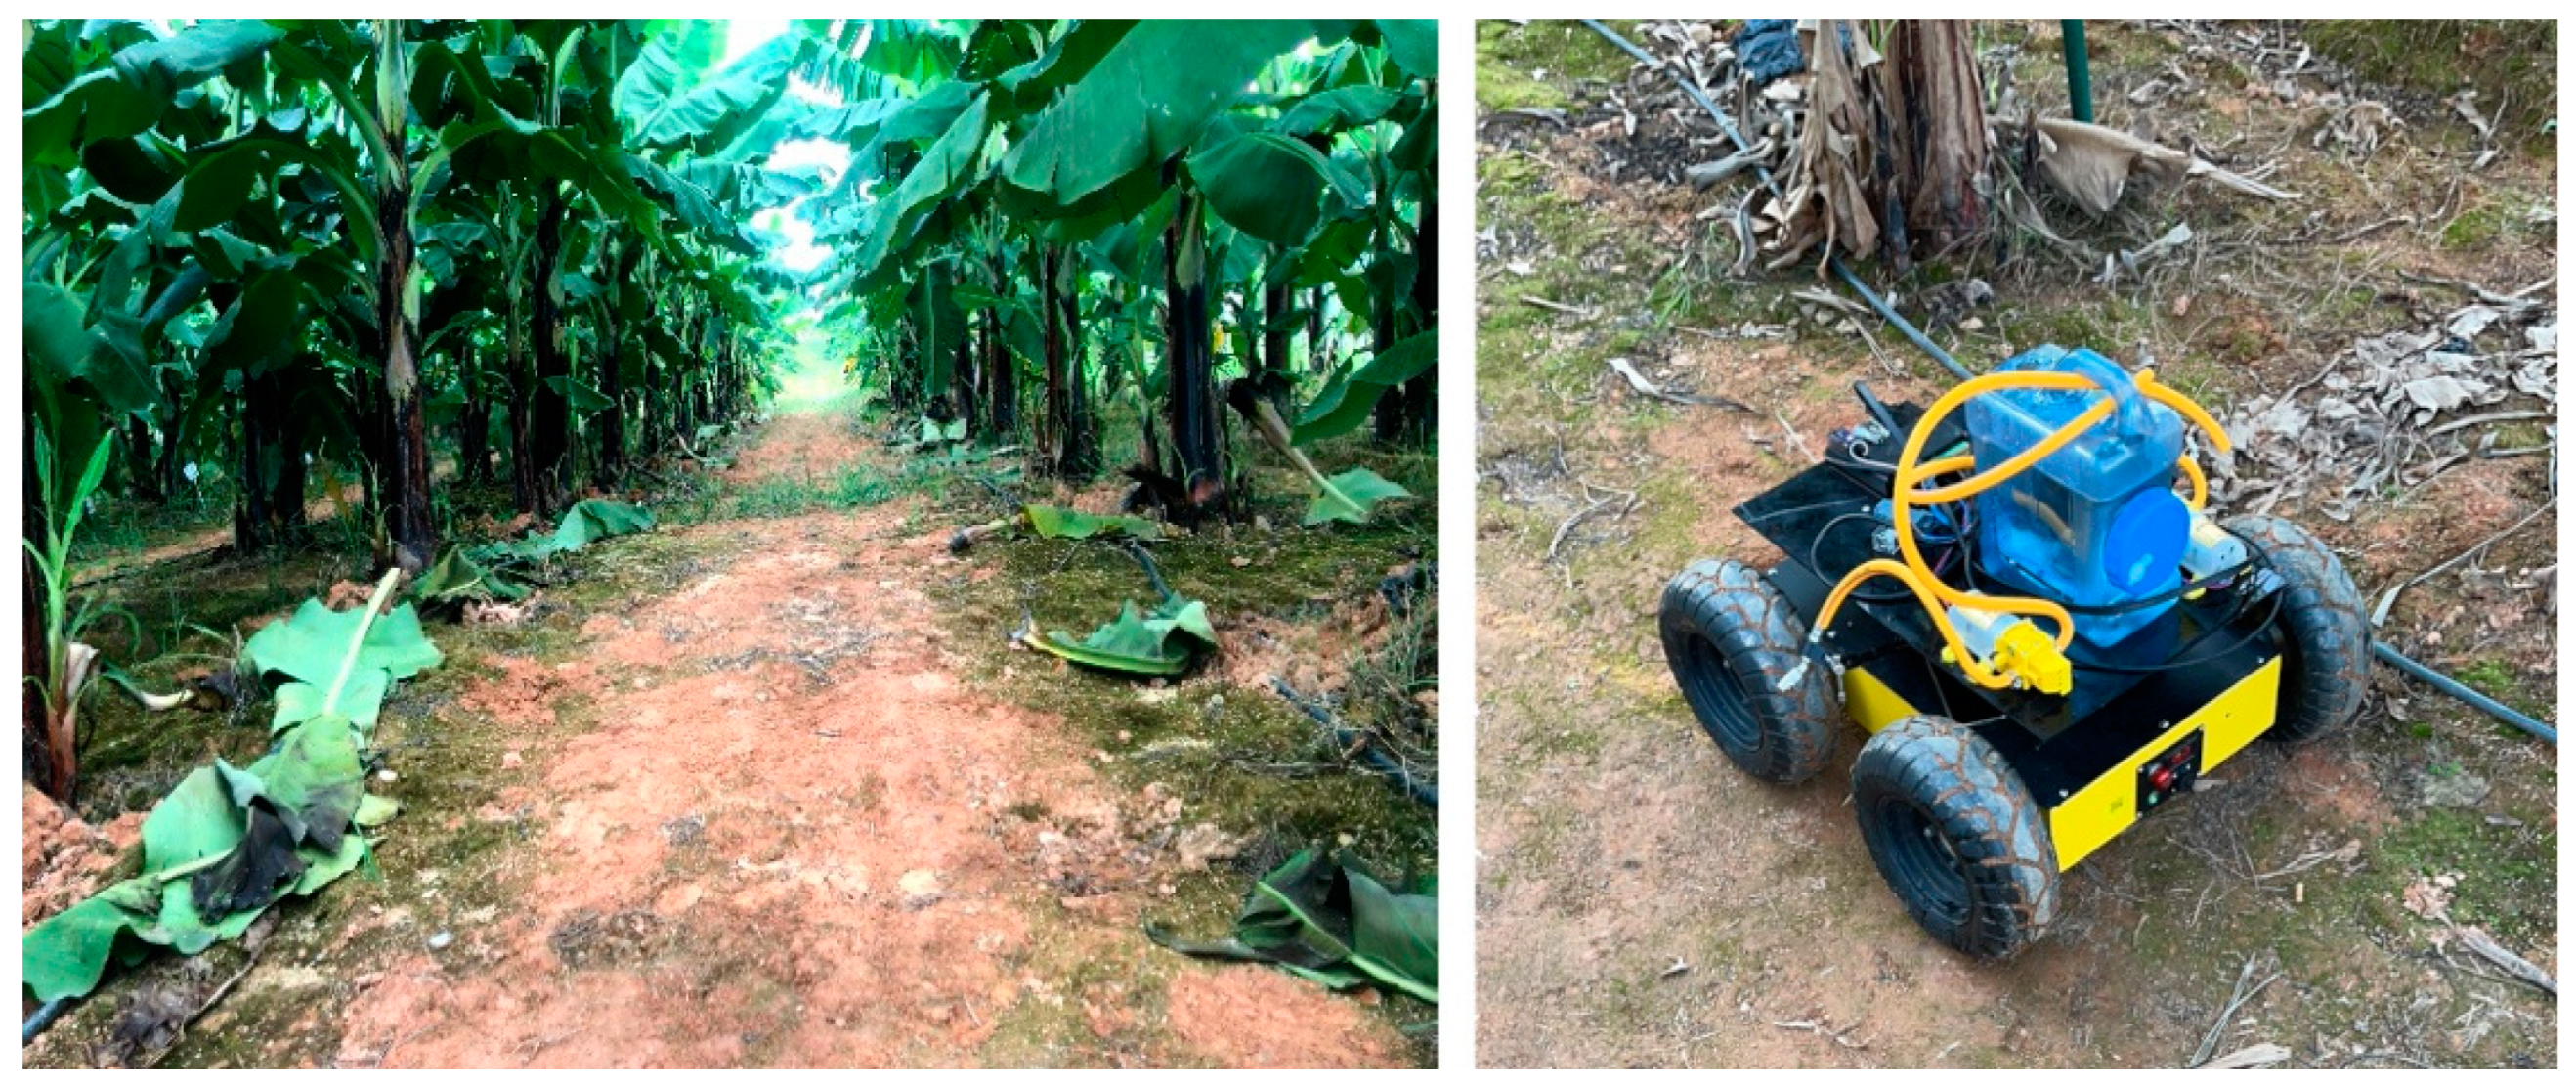
Figure 11, the robot navigation system adopts the structure of top-level decision and bottom-level execution. RS232 is used to realize data communication between the two-level system. Real-time images are captured by a ZED 2i camera and processed by an NVIDIA Jetson Xavier NX computer for trunk detection, location, and path planning. Once the top-level decision was made, the control commands were then sent to the bottom-level execution system. The differential chassis uses a motion controller and two speed encoders to achieve closed-loop control. The banana orchard environment is chosen to evaluate the row-following system and is shown in
Figure 12. The land is slightly uneven, and the surface is irregular, the soils are naturally hard and dense. Each row is about 2.5 m wide and 50 m long, the average height of the trees is 2.5 m, and the average distance of the trunks is 1.5 m.
During the test, the center line of the two side rows of trees is planned as the reference path. Considering that GNSS measurement in orchards can be unstable because trees may block the GNSS signal or introduce multipath errors, while the odometer measurement is prone to cumulative errors due to the sliding effects of the robot, the robot’s actual trajectory was marked on the soil by a marking wheel attached to the robot. The error measurements were taken manually with a tape measure, at regular intervals of 30 cm. This interval was chosen to obtain enough samples to correctly estimate the path error.
Table 1 shows the parameters of the navigation system and the robot platform during the experiment.
A total of eight runs were executed during the test and the performance is shown in
Figure 13. It was found that the average lateral error was controlled within 0.21 m and the standard deviation was controlled within 0.19, while the average heading error was controlled within 4.0 deg and the standard deviation was controlled within 3.5. Experiments with the perception module presented in our study in the banana orchard showed that the proposed detectors can be used to extract trunks and depth information in real time.
Figure 14 shows an example of these experiments. Calculating the median of all depths within each bounding box yields the depth of each trunk, which can be used to localize the robot, and consequently be used by the DWA algorithm. The NVIDIA device has a run time performance in the range of 55–70 ms. Two of the robot trajectories are shown in
Figure 15.
4. Discussion
During the field test, it is shown that the mAP of YOLOv5 with a 0.5 IOU threshold is 81.6%, and the average inference time per image is 60 ms, which meets the requirements of real-time applications. It was also found that the depth camera can perceive the outdoor environment in 3D with a wide-angle field of up to 120° view, and with a built-in polarizing filter, glare and reflections can be greatly reduced. The average error of depth estimation was controlled within 3.5 mm at 1.5 m and 9 mm at 2.8 m, while the standard deviation was within 1.0 at 1.5 m and 2.0 at 2.8 m. Based on the results, the perception range of the camera in our study was set within 1.5 m. In our previous study, a row-following system based on traditional machine vision was designed for an apple orchard, where navigation was divided into several subtasks, such as color space transformation, image binarization, boundary detection, and guidance path generation. Based on our previous test, it was found that when the complexity of the environment increases, such as fluctuation of light intensity, large area shadows, weeds, and branches, the system processing time would rise to 300–400 ms. In contrast, YOLOv5 maintains an average processing time of 60 ms in our field test environments. Another challenging issue is that the segmentation of tree rows based on traditional image processing may not be fully extracted or may be over-extracted due to the fluctuation of light intensity, eventually leading to reduced navigation accuracy. Based on test results, YOLOv5 could detect tree trunks with 90% accuracy in most cases. In addition, the parameters of YOLOv5 do not need to be adjusted after training. However, the parameters of traditional image processing need to be readjusted when the environment changes, such as different times of the day, different environments, etc. In general, compared with the previous navigation system based on image processing, the environmental perception module based on YOLOv5 has the potential to learn and achieve accurate and robust performance of perception tasks for robot navigation.
It was noticed that the DWA could generate smooth collision-free trajectories with low computational power. In addition, because it works in a velocity space, it does not require an additional controller, which was integrated as the DWA into NVIDIA Jetson Xavier NX with an environmental perception module within our study. It has been observed that the DWA effectiveness is significantly influenced by the specific parameter configurations within its cost function. These optimal parameter values frequently differ and fluctuate based on the environmental context, indicating that dynamic data-driven selection would be advantageous. Currently, there exists no standardized method for establishing these parameters, and they are often determined experimentally through trial-and-error procedures. To address this issue in future research, a promising avenue would be to explore the potential of leveraging deep neural networks, which have demonstrated the ability to effectively execute a multitude of complex tasks through learned parameter optimization. Furthermore, it has been found that the YOLOv5 models have a tendency to overlook smaller trunk objects, which results in inadequate detection outcomes under certain circumstances. More attention should be paid to the appropriate development of improved lightweight models based on YOLOv5 in future work, to improve this problem.
In addition, it was observed that the trunk perception and localization module performed poorly at noon compared to other times of the day. The reason for this problem is that the light fluctuation phenomenon is very severe at noon, especially when the robot drove along the trees with large gaps or when the trees happened to swing due to wind. This phenomenon results in a few overexposed images, with some tiny white areas where the depth information could not be estimated, and eventually leads to a decrease in the accuracy of environmental sensing. Moreover, if the robot gets too close to the trunks, such as less than 20 cm, depth information will be lost according to the camera’s sensing range. Another challenge is that near the end of the row, the sensor’s field of view goes beyond the tree line. The perceptual information provided by the camera would be unreliable. In our study, this range is at about 2 m relative to the last row. Sensor fusion technology, reference maps, or artificial landmarks would be good choices for accurate row-end detection in the follow-up research. Attention should also be paid to the slip effect, although it is not significant in our case. In further development, the slip effect should be considered to improve the DWA model so that the robot adapts to different terrain conditions, such as steep slope terrains.
5. Conclusions
In this paper, a visual tree row-following system, based on a depth camera, was developed for an agricultural robot in a banana orchard environment. Tree trunks were detected and located by the developed YOLOv5 model fusion of the depth information of the camera. To implement the tree row-following control, the DWA method was adopted in the study. Both simulation and field tests were conducted. The experimental findings demonstrated the robot’s capability to adapt its posture to varying scenarios and accurately navigate the tree row. When fitted with appropriate attachments, the insights gained from this study could be applied to diverse agricultural activities, including planting, fertilization, cultivation, harvesting, thinning, weeding, and inspection.
In future studies, more work should be carried out to improve the system: (1) Since there are a large number of fruit trees in the orchard, improving the speed of trunk detection has become one of the challenges of environmental perception. (2) Other challenges are leaves, weeds, and uneven illumination in a real orchard appearing as noise in the captured images; this affects the accuracy of the row-following system. Therefore, an improved and lightweight trunk detection method should be developed for the fast and accurate detection of trunks in an orchard environment. (3) The effectiveness of the DWA is closely linked to the weights assigned to obstacle clearance, speed, and heading within the cost function. As the optimal parameter selection depends heavily on the environmental context, which can vary extensively and unexpectedly, it is critical to dynamically determine these parameters through data-driven methodologies. Future investigations could explore the viability of employing deep neural networks to predict the parameters based on real-time sensor data, thereby enhancing the adaptability and efficacy of the approach.
Author Contributions
P.H. (Peichen Huang), P.H. (Peikui Huang) and Z.W.; data curation, Z.W. and J.L.; formal analysis, Z.W.; funding acquisition, L.Z.; methodology, P.H. (Peichen Huang) and P.H. (Peikui Huang); project administration, L.Z.; software, X.W. and J.L.; supervision, L.Z.; validation, X.W. and J.L.; visualization, P.H. (Peikui Huang) and X.W.; writing—original draft, P.H. (Peichen Huang); writing—review and editing, P.H. (Peichen Huang). All authors have read and agreed to the published version of the manuscript.
Funding
This work was funded by the Science and Technology R&D Projects in Key Fields of the Guangdong Province (2019B020223003), the National Natural Science Funds for Young Scholar (32101632), Basic and Applied Basic Research Project of Guangzhou Basic Research Program in 2022 (Project No.: 202201011691).
Data Availability Statement
The data presented in this study are available on request from the corresponding author. The data are not publicly available due to the privacy policy of the organization.
Acknowledgments
The authors are grateful to Zhou Dongji, Li Yingkai, and Zhuang Dongde, for their help with the experiments.
Conflicts of Interest
The authors declare no conflict of interest.
References
- Analysis of the Fruit Production and Marketing Situation in Guangdong Province in the Third Quarter of 2022. Available online: http://dara.gd.gov.cn/cxxsfx/content/post_4067419.html (accessed on 15 September 2022).
- Chengliang, L.; Liang, G.; Jin, Y.; Yanming, L. Current Status and Development Trends of Agricultural Robots. Trans. Chin. Soc. Agric. Mach. 2022, 53, 1–22+55. [Google Scholar] [CrossRef]
- Chengliang, L.; Hongzhen, L.; Yanming, L.; Liang, G.; Zhonghua, M. Analysis on Status and Development Trend of Intelligent Control Technology for Agricultural Equipment. Trans. Chin. Soc. Agric. Mach. 2020, 51, 1–18. [Google Scholar] [CrossRef]
- Huang, P.C.; Zhang, Z.G.; Luo, X.W.; Bin, Y.B.; Kui, H.P. Monocular visual navigation based on scene model of differential-drive robot in corridor-like orchard environments. Int. Agric. Eng. J. 2019, 28, 310–316. [Google Scholar]
- Huang, P.; Zhu, L.; Zhang, Z.; Yang, C. Row End Detection and Headland Turning Control for an Autonomous Banana-Picking Robot. Machines 2021, 9, 103. [Google Scholar] [CrossRef]
- Bai, Y.; Zhang, B.; Xu, N.; Zhou, J.; Shi, J.; Diao, Z. Vision-based navigation and guidance for agricultural autonomous vehicles and robots: A review. Comput. Electron. Agric. 2023, 205, 107584. [Google Scholar] [CrossRef]
- Cheng, C.; Fu, J.; Su, H.; Ren, L. Recent Advancements in Agriculture Robots: Benefits and Challenges. Machines 2023, 11, 48. [Google Scholar] [CrossRef]
- Wang, S.; Song, J.; Qi, P.; Yuan, C.; Wu, H.; Zhang, L.; Liu, W.; Liu, Y.; He, X. Design and development of orchard autonomous navigation spray system. Front. Plant Sci. 2022, 13, 960686. [Google Scholar] [CrossRef]
- Qiu, Q.; Li, X. LiDAR Point-Cloud Odometer Based Mobile Robot Routine Tracking in Orchards. In Proceedings of the 2022 12th International Conference on CYBER Technology in Automation, Control, and Intelligent Systems (CYBER), Baishan, China, 27–31 July 2022. [Google Scholar] [CrossRef]
- Qin, J.; Wang, W.; Mao, W.; Yuan, M.; Liu, H.; Ren, Z.; Shi, S.; Yang, F. Research on a Map-Based Cooperative Navigation System for Spraying–Dosing Robot Group. Agronomy 2022, 12, 3114. [Google Scholar] [CrossRef]
- Teixeira, A.; Dogru, S.; Marques, L. LiDAR-Based Topological Mapping of Orchard Environments. ROBOT2022: Fifth Iberian Robotics Conference: Advances in Robotics; Springer International Publishing: Cham, Switzerland, 2022; Volume 2, pp. 438–450. [Google Scholar] [CrossRef]
- Murcia, H.F.; Tilaguy, S.; Ouazaa, S. Development of a Low-Cost System for 3D Orchard Mapping Integrating UGV and LiDAR. Plants 2021, 10, 2804. [Google Scholar] [CrossRef]
- Liu, L.; Liu, Y.; He, X.; Liu, W. Precision Variable-Rate Spraying Robot by Using Single 3D LIDAR in Orchards. Agronomy 2022, 12, 2509. [Google Scholar] [CrossRef]
- Durand-Petiteville, A.; Le Flecher, E.; Cadenat, V.; Sentenac, T.; Vougioukas, S. Design of a sensor-based controller performing u-turn to navigate in orchards. In Proceedings of the 14th International Conference on Informatics in Control, Automation and Robotics-Volume 2: ICINCO, Madrid, Spain, 26–28 July 2017. [Google Scholar] [CrossRef]
- Mousazadeh, H. A technical review on navigation systems of agricultural autonomous off-road vehicles. J. Terramech. 2013, 50, 211–232. [Google Scholar] [CrossRef]
- Radcliffe, J.; Cox, J.; Bulanon, D.M. Machine vision for orchard navigation. Comput. Ind. 2018, 98, 165–171. [Google Scholar] [CrossRef]
- Yang, Z.; Ouyang, L.; Zhang, Z.; Duan, J.; Yu, J.; Wang, H. Visual navigation path extraction of orchard hard pavement based on scanning method and neural network. Comput. Electron. Agric. 2022, 197, 106964. [Google Scholar] [CrossRef]
- Jude, H.D.; Estrela, V.V. (Eds.) Deep Learning for Image Processing Applications; IOS Press BV: Amsterdam, The Netherlands, 2017; Volume 31. [Google Scholar]
- Koirala, A.; Walsh, K.B.; Wang, Z.; McCarthy, C. Deep learning–Method overview and review of use for fruit detection and yield estimation. Comput. Electron. Agric. 2019, 162, 219–234. [Google Scholar] [CrossRef]
- Koirala, A.; Walsh, K.B.; Wang, Z.; McCarthy, C. Deep learning for real-time fruit detection and orchard fruit load estimation: Benchmarking of ‘MangoYOLO’. Precis. Agric. 2019, 20, 1107–1135. [Google Scholar] [CrossRef]
- Wang, L.; Yan, W.Q. Tree Leaves Detection Based on Deep Learning. In Geometry and Vision. ISGV 2021. Communications in Computer and Information Science; Nguyen, M., Yan, W.Q., Ho, H., Eds.; Springer: Cham, Switzerland, 2021; Volume 1386. [Google Scholar] [CrossRef]
- Cap, H.Q.; Suwa, K.; Fujita, E.; Kagiwada, S.; Uga, H.; Iyatomi, H. A deep learning approach for on-site plant leaf detection. In Proceedings of the 2018 IEEE 14th International Colloquium on Signal Processing & Its Applications (CSPA), Penang, Malaysia, 9–10 March 2018. [Google Scholar] [CrossRef]
- Vasavi, P.; Punitha, A.; Rao, T.V.N. Crop leaf disease detection and classification using machine learning and deep learning algorithms by visual symptoms: A review. Int. J. Electr. Comput. Eng. 2022, 12, 2079. [Google Scholar] [CrossRef]
- Jin, X.; Liu, T.; Chen, Y.; Yu, J. Deep Learning-Based Weed Detection in Turf: A Review. Agronomy 2022, 12, 3051. [Google Scholar] [CrossRef]
- Russell, B.C.; Torralba, A.; Murphy, K.P.; Freeman, W.T. LabelMe: A database and web-based tool for image annotation. Int. J. Comput. Vis. 2008, 77, 157–173. [Google Scholar] [CrossRef]
- Jiang, P.; Ergu, D.; Liu, F.; Cai, Y.; Ma, B. A Review of Yolo algorithm developments. Procedia Comput. Sci. 2022, 199, 1066–1073. [Google Scholar] [CrossRef]
- Fox, D.; Burgard, W.; Thrun, S. The Dynamic Window Approach to Collision Avoidance. IEEE Robot. Autom. Mag. 1997, 4, 23–33. [Google Scholar] [CrossRef] [Green Version]
- Lin, Z.; Yue, M.; Chen, G.; Sun, J. Path planning of mobile robot with PSO-based APF and fuzzy-based DWA subject to moving obstacles. Trans. Inst. Meas. Control 2022, 44, 121–132. [Google Scholar] [CrossRef]
- Wu, B.; Chi, X.; Zhao, C.; Zhang, W.; Lu, Y.; Jiang, D. Dynamic Path Planning for Forklift AGV Based on Smoothing A* and Improved DWA Hybrid Algorithm. Sensors 2022, 22, 7079. [Google Scholar] [CrossRef] [PubMed]
- Dai, J.; Li, D.; Zhao, J.; Li, Y. Autonomous navigation of robots based on the improved informed-RRT algorithm and DWA. J. Robot. 2022, 2022, 3477265. [Google Scholar] [CrossRef]
Figure 1.
Methodology block diagram.
Figure 1.
Methodology block diagram.
Figure 2.
Raw data collection environment.
Figure 2.
Raw data collection environment.
Figure 3.
Sample generation by means of image augmentation. The red boxes represent trunks and the numbers above the red boxes represent the category numbers.
Figure 3.
Sample generation by means of image augmentation. The red boxes represent trunks and the numbers above the red boxes represent the category numbers.
Figure 4.
YOLOv5 architecture.
Figure 4.
YOLOv5 architecture.
Figure 5.
The curves of metrics per training epoch.
Figure 5.
The curves of metrics per training epoch.
Figure 6.
The F1 and PR curves.
Figure 6.
The F1 and PR curves.
Figure 7.
Field test environment: (a) 1.5 m; (b) 2.8 m.
Figure 7.
Field test environment: (a) 1.5 m; (b) 2.8 m.
Figure 8.
Comparison of depth estimation.
Figure 8.
Comparison of depth estimation.
Figure 9.
Simulation results of the S–shape path following, with a different initial heading.
Figure 9.
Simulation results of the S–shape path following, with a different initial heading.
Figure 10.
Details of the S-shape path following. Brown circles represent tree trunks, yellow circle represents robot, green dashed lines represent predicted trajectory, and black solid line represent an optimal trajectory.
Figure 10.
Details of the S-shape path following. Brown circles represent tree trunks, yellow circle represents robot, green dashed lines represent predicted trajectory, and black solid line represent an optimal trajectory.
Figure 11.
Schematic diagram of the robot navigation system.
Figure 11.
Schematic diagram of the robot navigation system.
Figure 12.
Spraying robot platform and the test environment.
Figure 12.
Spraying robot platform and the test environment.
Figure 13.
Field test performance of the row-following navigation system. The blue box is drawn from the median of the lower half of the dataset to the median of the upper half of the dataset with a horizontal green line drawn in the middle to denote the median.
Figure 13.
Field test performance of the row-following navigation system. The blue box is drawn from the median of the lower half of the dataset to the median of the upper half of the dataset with a horizontal green line drawn in the middle to denote the median.
Figure 14.
Examples of trunk detection in a banana orchard. Red boxes represent the detected trunks and the numbers above the boxes represent the detected confidence.
Figure 14.
Examples of trunk detection in a banana orchard. Red boxes represent the detected trunks and the numbers above the boxes represent the detected confidence.
Figure 15.
Robot trajectories during the test. Green circles represent the tree trunks.
Figure 15.
Robot trajectories during the test. Green circles represent the tree trunks.
Table 1.
Parameters of the navigation system and the robot platform during the experiment.
Table 1.
Parameters of the navigation system and the robot platform during the experiment.
| Type of Parameter | Parameters | Value |
|---|
| motion control | traveling velocity | 1.0 m/s |
| maximum angular velocity | 0.8 rad/s |
| maximum linear acceleration | 0.5 m/s2 |
| maximum angular acceleration | 1.57 rad/s2 |
| DWA | linear velocity resolution | 0.09 m/s |
| yaw rate resolution | 0.03 rad/s |
| heading weight | 2.0 |
| velocity weight | 1.0 |
| distance weight | 1.0 |
| Disclaimer/Publisher’s Note: The statements, opinions and data contained in all publications are solely those of the individual author(s) and contributor(s) and not of MDPI and/or the editor(s). MDPI and/or the editor(s) disclaim responsibility for any injury to people or property resulting from any ideas, methods, instructions or products referred to in the content. |
© 2023 by the authors. Licensee MDPI, Basel, Switzerland. This article is an open access article distributed under the terms and conditions of the Creative Commons Attribution (CC BY) license (https://creativecommons.org/licenses/by/4.0/).


