Article

Effect of NaCl on Morphophysiological and Biochemical Responses in Gossypium hirsutum L.

1
Institute of Molecular Biology and Biotechnology, Bahauddin Zakariya University, Multan 60800, Pakistan
2
Department of Forestry and Range Management, University of Agriculture, Faisalabad 38400, Pakistan
3
Department of Biochemistry and Biotechnology, The Women University, Multan 66000, Pakistan
4
School of Healthcare and Biomedical Engineering, Chonnam National University, Yeosu 59626, Republic of Korea
5
Department of Plant Breeding and Genetics, University of Agriculture, Faisalabad 38400, Pakistan
6
School of Agriculture Sciences, Zhengzhou University, Zhengzhou 450001, China
*
Authors to whom correspondence should be addressed.
Agronomy 2023, 13(4), 1012; https://doi.org/10.3390/agronomy13041012
Submission received: 4 February 2023 / Revised: 21 February 2023 / Accepted: 24 February 2023 / Published: 30 March 2023

Abstract

:
Soil salinity is increasing due to several factors such as climate change and areas with uneven rainfall. This increase in level of salinity compelled the cotton breeders to develop a new germplasm that exhibit the suitable for salty soil. This study aimed to determine the salt tolerance of 50 accessions of Gossypium hirsutum in hydroponic conditions having three levels of NaCl, i.e., 0 mM, 150 mM, and 200 mM. The experiment was carried out in a completely randomized design with a factorial arrangement. Morphological, physiological, and biochemical attributes were estimated in these genotypes. The Na+/K+ ratio was determined by dry digestion method. Salt-susceptible and -tolerant genotypes were identified by biplot and cluster analysis. The genotypes showed significant differences for morphophysiological and biochemical parameters. In control, Cyto-515 showed enhanced growth with shoot length (30.20 cm), root length (20.63 cm), fresh shoot weight (2.34 g), and fresh root weight (0.93 g), while under 150 mM and 200 mM salinity levels, MNH-992 had the maximum root length (15.67 cm) and shoot length (24.67 cm). At a 150 mM salinity level, maximum levels of antioxidants were found in Kehkshan and CIM-595, while at a 200 mM salinity level, AA-703, CIM-595, and Kehkshan showed maximum values of antioxidants. The highest Na+/K+ ratio was observed in VH-363 and FH-114, while Kehkshan had lowest Na+/K+ ratio. The biplot analysis revealed that Kehkshan, CIM-595, VH-330, Cyto-178, MNH-992, and Cyto-515 were widely dispersed and distant from the origin, and exhibiting variability for morphophysiological and biochemical traits under the salt stress. In terms of performance across the treatments, accessions MNH-992, Kehkshan, Cyto-515, and CIM-595 performed significantly better. Peroxidase activity, proline contents, H2O2 determination, and Na+/K+ ratio were shown to be useful for the salt tolerance selection criteria. The potential of such salt tolerant accessions (MNH-992, Kehkshan, Cyto-515, and CIM-595) could be assessed after planting in salt affected areas and could be used in breeding programs for the development of diverse salt tolerant new genotypes of upland cotton.

1. Introduction

Salinity is one of most prevalent abiotic factor that restricts crop production globally and as a result lower the yield of field crops. Salinity-affected land is constantly expanding due to unforeseen factors [1]. Every year, approximately 4 × 10⁴ hectares of land lose their ability to produce crops due to soil salinity. G. hirsutum is particularly sensitive to salinity during seedling and germination stages. Salinity will affect ~30% of cultivated areas over the next 25 years, posing a threat to global food security [2]. Approximately 800 million hectares of land or 6% of the global area have been converted into barren soils due to severe effects of salinity [3]. Due to climate change, salinity level as well as area affected due to salinity is an emerging issue in Pakistan’s arid to semi-arid region with 6.2 million hectares under salt stress of agricultural land. The excess of salts have a significant impact on crop productivity because of detrimental effects such as developmental and growth retardation of crop plants [4]. A variety of processes have been explored to understand how salinity negatively affects the development and growth stages of crop plants [5]; for example, (1) salinity causes the rhizosphere to have a lower water potential, which, in turn, causes water shortage in plant organs; (2) accumulation of Na+ and Cl ions causes ion toxicity; (3) a poor intake of micro- and macronutrients due to salt traces in the rhizosphere causes ionic imbalance [6]. These effects led plant scientists to develop those genotypes of crop plants that have the ability to tolerate salt stress. To proceed with this, it is necessary to have genotypes that are resistant to salts in addition to enormous genetic diversity present in available germplasms. It is a laborious task to screen a large number of field crops for salt tolerance. The estimation of Na+/K+ ratio has been applied as a reliable criterion for selection of salt tolerance in sorghum [7], alfalfa [8], wheat [9], and maize [10]. In general, salt-sensitive genotypes are incapable of maintaining the Na+ homeostasis, whereas salt-tolerant genotypes regulate the Na+ ion exclusion through their roots. However, according to some studies, maintaining an ideal Na+/K+ ratio determines the plant’s ability to perform under salt stress rather than Na+ exclusion [11].
Salt stress reduces the production of biomass by decreasing the leaf area, root and shoot weight, stem thickness, and seed cotton yield [12]. At seedling stage, salinity has a detrimental effect on cotton production, while at vegetative stage, water usage efficiency, photosynthesis, and rate of evaporation were reduced [13]. In later stages, diameter of stem, plant height, root/shoot ratio, and leaves expansion were significantly affected by salt stress. Furthermore, prolonged salt stress has caused an increase in fruit shedding, poor quality of fiber traits, and delay in fruit development [14]. Salt stress disrupts the cellular ions, osmotic stress, and increases the production of reactive oxygen species (hydroxyl radicals and superoxide anions). Plants have an efficient but complicated enzymatic defense system against these effects e.g., peroxidase and catalase and non-enzymatic defense systems against free radical toxicity (free proline) [15]. Considering the aforementioned discussion, it is necessary to develop such genotypes of cotton having potential against salt stress. Therefore, this study was designed to evaluate salt tolerance in cotton genotypes at the seedling stage using principal component analysis (PCA). The findings of this study may be useful in breeding programs particularly for the development of salt resistance in cotton.

2. Materials and Methodology

2.1. Collection of Germplasms

Cotton germplasms consisting of 50 genotypes were collected from various cotton breeding institutions and stations in the country, i.e., Central Cotton Research Institute, Multan; Cotton Research Station, Faisalabad; Cotton Research Station, Vehari; Department of Plant Breeding and Genetics, University of Agriculture, Faisalabad-Pakistan (Table 1).

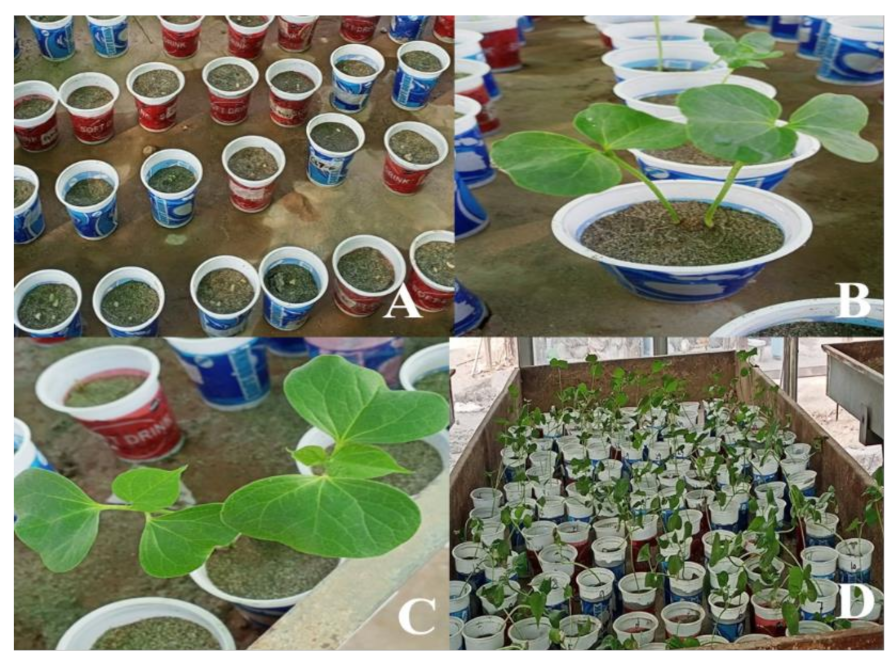
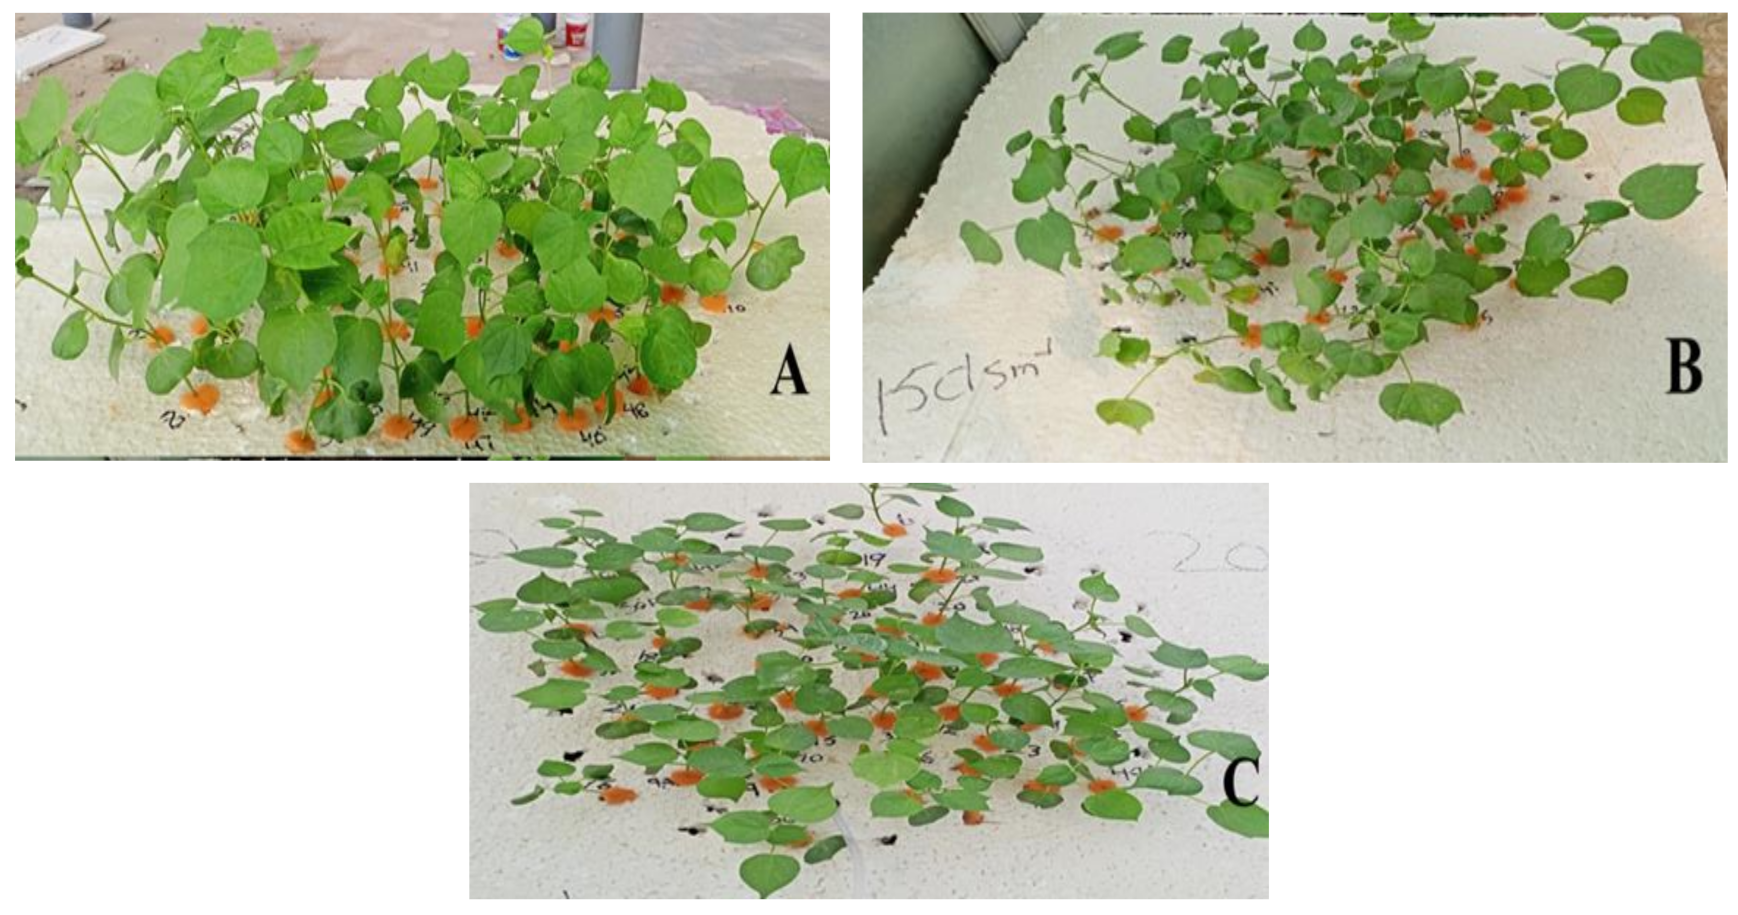
2.2. Experimental Design and Salt Treatment

The germplasms of upland cotton were assessed at three distinct levels of salinity, i.e., 0 mM (control), 150 mM, and 200 mM. The experiment was carried out in a completely randomized design with a factorial arrangement. The experiment was conducted in the greenhouse of the Institute of Molecular Biology and Biotechnology, Bahauddin Zakariya University, Multan (latitude 30.270172° N, longitude 71.505625° E).
Six healthy and uniform seeds of every genotype were planted into plastic pots containing the sand, and three pots were planted for each germplasm in each treatment. The pots were kept in greenhouse during last week of September-2021 and were exposed to a photoperiod and normal sunlight. After two weeks of germination and upon the emergence of true leaves, seedlings were gently removed from the sand (Figure 1).

2.3. Harvesting and Transplanting

The seedlings was washed carefully using distilled water to remove the sand before selecting seedlings of similar size from each accession for transplantation into hydroponics. One seedling was transplanted into each hole of thermophore sheet and then placed on plastic tubs containing 36 L of half-strength Hoagland solution [16]. Proper aeration was maintained in each tub throughout the experiment by the help of oxygen pumps. Salt stress was applied after three days of transplanting into Hoagland solution. Three different NaCl levels were slowly applied, i.e., control, 150 mM, and 200 mM (Figure 2). The EC of each treatment was maintained until the experiment was completed.

2.4. Analysis of Morphophysiological Parameters

The data for shoot length, root length, fresh root weight, fresh shoot weight, dry shoot weight, and dry root weight were recorded from each genotype after 40 days of salt stress. Shoots and roots were separated for each genotype by cutting at the shoot and root junction, and fresh weight of shoot and root was immediately measured by electric weighing balance. The shoot and root length from each genotype replication was measured in centimeters using a measuring scale. To determine the dry shoot and root weight of each genotype replication, shoots and roots were placed in Kraft paper bags, oven-dried at 80 °C for 48 h, and then weight of each section was determined through electric weighing balance. The SPAD 502 Plus chlorophyll meter was used for determination of chlorophyll contents. Simultaneously, one completely opened fresh leaf from every genotype was harvested and preserved at −80 °C. These frozen leaves were used to analyze the physiological and biochemical traits i.e., catalase and peroxidase activity, free proline contents, and H2O2 concentration.

Na+ and K+ Contents

Na+/K+ ratio was determined by dry digestion method [17]. For this purpose, leaves of each genotype were oven dried at 65–70 °C for 48 h. Dry and ground plant material was placed in a muffle furnace for 5 h at 550 °C. Ash was dissolved in 5 mL of 2 N HCL. Then, distilled water was added to make the volume 50 mL and allowed to stand for 30 min. Each sample was filtered with Whatman filter paper and filtrate was used to determine the Na+ and K+ contents by flame photometry (Jenway PFP7, Chelmsford, UK).

2.5. Analysis of Biochemical Parameters

2.5.1. Determination of Proline

Proline accumulation in leaf tissues was determined using the methodology proposed by [18]. ~0.1–0.5 g of leaves were homogenized in 5 mL of 3% sulfosalicylic acid using a pestle and mortar. After that, the extract was centrifuged for 10 min at 11,000 rpm to separate the supernatant. Then, acid-ninhydrin solution containing 1.25 g of ninhydrin, 30 mL of glacial acetic acid, and 20 mL of 6 M orthophosphoric acid was prepared. Then, 1 mL was taken out of each component i.e., leaf extract supernatant, ninhydrin solution, and glacial acetic acid which were poured in test tubes. The samples were then incubated for 50 min at 100 °C. After cooling the mixture in ice, the organic layer was obtained by adding 1 mL of toluene and by vortexing the mixture for 5 min. Following that, an organic layer was isolated and OD was recorded at 520 nm, and toluene was used as a blank.

2.5.2. Catalase Activity

To prepare enzyme extract, 0.2 g of leaves were ground in a pre-chilled mortar and pestle with 2 mL of 50 mM potassium phosphate buffer. The extract was centrifuged for 20 min at 10,000 rpm, and supernatant was collected in other Eppendorf tube. Afterward, 450 µL of 5.9 mM H2O2, 1 mL of 50 mM KP buffer, and 50 µL of enzyme extract were mixed together to prepare the reaction mixture. The absorbance at 240 nm was measured after every 20 s using a spectrophotometer (Beckman Coulter DU 730, Pasadena, CA, USA).

2.5.3. Peroxidase Activity

The activity of peroxidase was measured by using the protocol proposed by [19]. An amount of 50 mM KP buffer was used to grind 0.2 g of leaf tissues. Then the mixture was centrifuged for 20 min at 10,000 rpm, and supernatant was taken into other Eppendorf tube. Later on, 1.5 mL of reaction mixture was made by combining 200 µL of 20 mM guaiacol, 250 µL of 40 mM H2O2, and 1 mL of 50 mM KP buffer and this mixture was poured into 50 µL of enzyme extract. The absorbance was recorded at 470 nm with a spectrophotometer (Beckman Coulter DU 730, Pasadena, CA, USA).

2.5.4. Hydrogen Peroxide

Reactive oxygen species are produced in plant tissues during normal oxygen metabolism. However, the level of ROS increases dramatically under stress conditions [20]. The amount of ROS produced can be determined by estimating the hydrogen peroxide amount following the protocol of [21]. An amount of 0.2 g of leaves was grinded in 0.1% trichloroacetic acid (2 mL). The sample was then centrifuged at 10,000 rpm for 15 min. After this, 500 µL of 10 mM KP buffer (pH 7.0) and 1 mL of 1 M Potassium Iodide (KI) were mixed in 500 µL of supernatant. The OD of mixture was measured at 390 nm.

2.6. Statistical Analysis

The data was subjected to analysis of variance (ANOVA) with factorial option to determine the genetic diversity in 50 accessions for recoded traits. This analysis was carried out using Statistix version 8.1 software [22]. Tukey’s honestly significant difference (HSD) was used to compare significant differences in mean values at a significance level of p < 0.05, while biplot and cluster analyses were carried out to determine how different upland cotton cultivars responded to different salt stress levels and under the control conditions by using XLSTAT statistical software.

3. Results

Multivariate analysis was used to assess the morphological, physiological, and biochemical data.

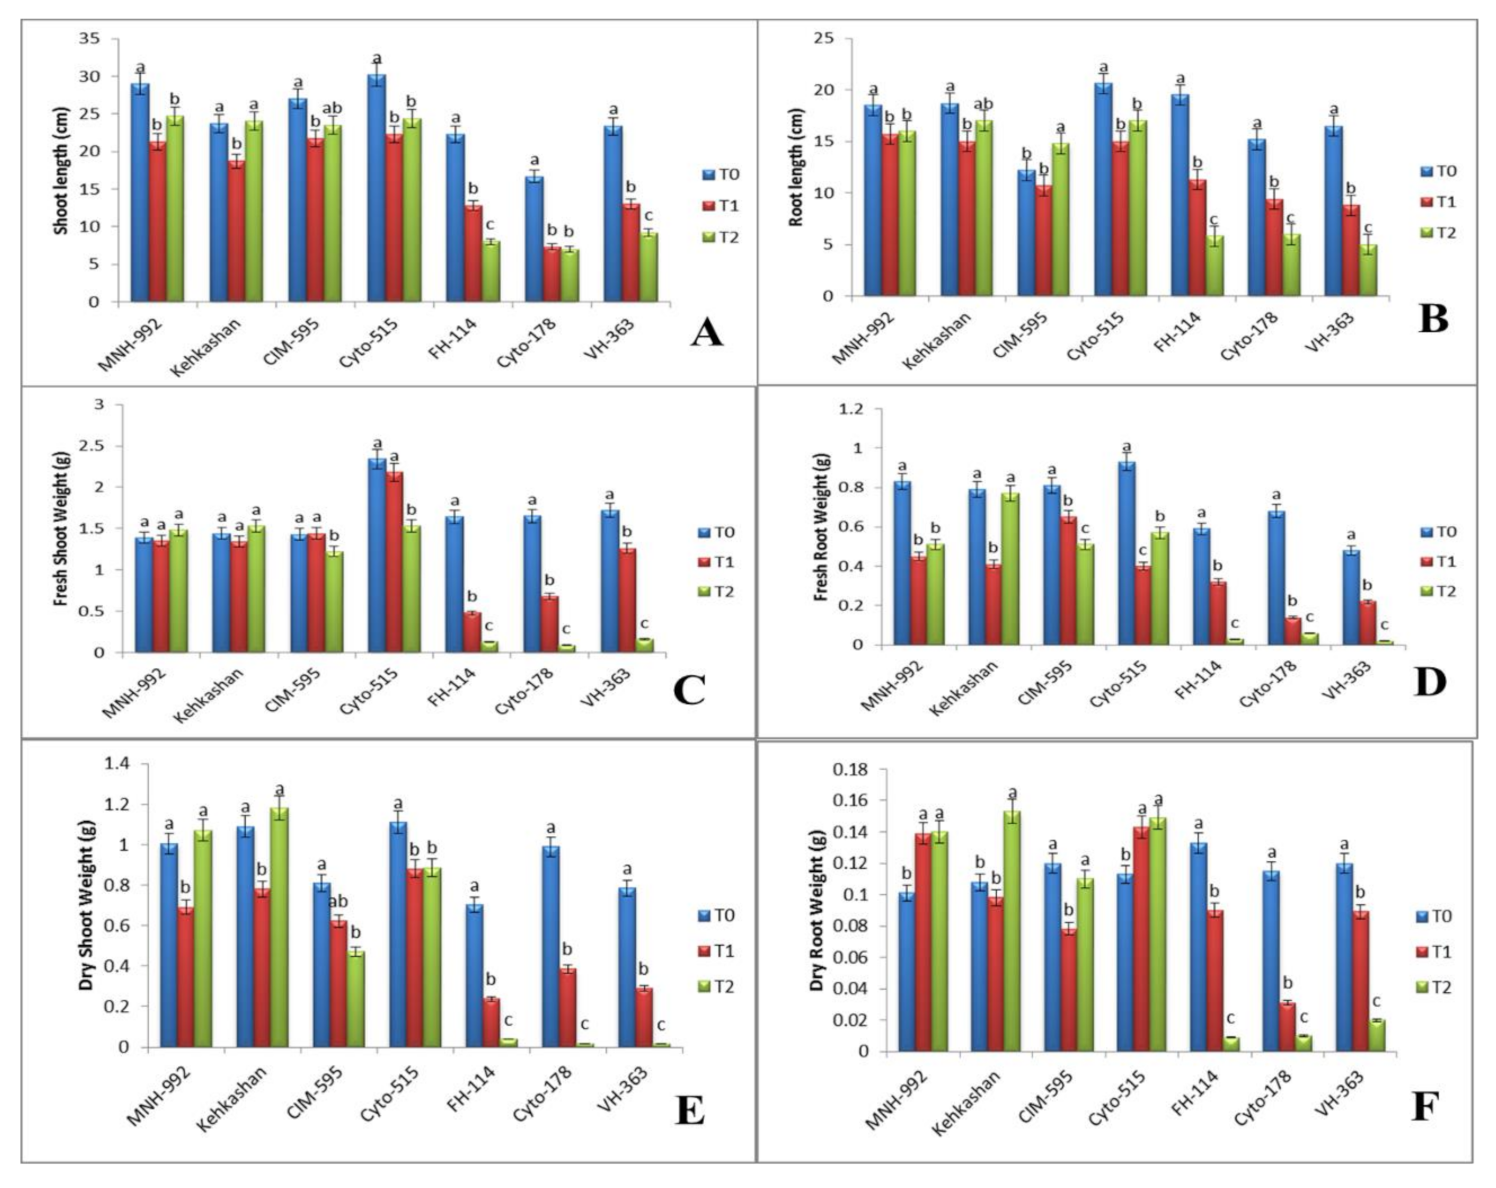
3.1. Effect of Salt Stress on Morphological Properties

Salt stress significantly reduced the shoot length and root length of all the genotypes, and fresh and dry weights of the shoot and root also changed significantly when salt stress was applied to plants. Shoot and root lengths of some genotypes were found to decrease with increased concentration of NaCl.

3.1.1. Shoot Length (cm)

The mean square values from analysis of variance (Table 2) of 50 cotton accessions for shoot length are presented in Table 2. At a 150 mM salinity level, the accessions Cyto-515 (G50) and CIM-595 (G39) had the longest shoot lengths of 22.3 cm and 21.7 cm, respectively, while the genotypes Cyto-178 (G13) had the shortest shoot length of 7.3 cm. At a 200 mM salinity level, the maximum shoot length was seen in MNH-992 (G8) of 24.67 cm, while Cyto-178 (G13) again showed the minimum shoot length of 7 cm (Figure 3A and Supplementary Figure S1).

3.1.2. Root Length (cm)

All of the genotypes showed significant differences in root length (Table 2). It was observed that salinity reduced the root length in all the genotypes except CIM-595 (G39), in which the root length increased at a 200 mM salinity level. At the control level, Cyto-515 (G50) had the longest roots (20. 63 cm) followed by S-9 (G15) (19.3 cm) and CIM-595 (G39) (19.2 cm), while VH-339 (G27) had the shortest root length (11 cm). At a 150 mM salinity level, the maximum root length was observed in MNH-992 (G8) and Cyto-515 (G50) with values of 15.67 cm and 15 cm, respectively, while the minimum root length was observed in VH-377 (G20), VH-330 (G38), and MNH-888 (G28) with values of 6.67 cm, 7.3 cm, and 7.4 cm, respectively. At a high salt stress of 200 mM, genotypes such as Cyto-515 (G50), Kehkshan (G31), and FH-490 (G49) showed better performance while VH-363 (G21), FH-114 (G12), and Cyto-178 (G21) showed poor performance (Figure 3B and Supplementary Figure S2).

3.1.3. Fresh Shoot Weight (g)

Variance of Analysis was performed for control and salinity levels of 150 mM and 200 mM NaCl, respectively, to obtain valuable data about the genotype differences. All genotypes showed significant differences (Table 2) in fresh shoot weight at all salinity stress levels. At the control (0 mM NaCl), Cyto-515 (G50) and MNH-992 (G8) had higher fresh shoot weights (Figure 3C), while Ghouri (G26) and VH-259 (G16) had the lowest fresh shoot weight (Supplementary Figure S3). At salinity levels of 150 mM and 200 mM NaCl, Cyto-515 (G50) had maximum fresh shoot weights of 2.18 g and 1.53 g, respectively.

3.1.4. Fresh Root Weight (g)

Significant differences were found by all genotypes for fresh root weight (Table 2). It was noticed that as the salinity level of NaCl increased from 150 mM to 200 mM, the fresh root weight of some genotypes decreased. The genotypes CIM-595 (G39), MNH-992 (G8), and FH-490 (G49) retained the highest fresh root weight of 0.66 g, 0.45 g, and 0.42 g, respectively, at the lower salinity level of 150 mM NaCl concentration (Supplementary Figure S4). The fresh root weight with the lowest mean values was recorded in FH-118 (G45) (0.05 g) and FH-114 (G12) (0.08 g) at the 150 mM NaCl level. At the 200 mM salinity level, some genotypes showed a reduction in fresh root weight such as AA-802 (G30), VH-363 (G21), and FH-114 (G12), indicating the salt-sensitive genotypes (Figure 3D), while the genotypes Kehkshan (G31), Cyto-515 (G50), and MNH-992 (G8) showed maximum mean values and were salt-tolerant genotypes (Table 3).

3.1.5. Dry Shoot Weight (g)

All of the genotypes showed significant differences in dry shoot weight (Table 2). Salinity had a negative effect on dry shoot weight, and the severity of this reduction varied from genotype to genotype, with certain genotypes being adversely affected by the higher level of salinity stress (200 mM NaCl), while others performed better and maintained a higher dry shoot weight. At a 150 mM salinity level, the accessions Cyto-515 (G50) and Kehkshan (G31) had the highest dry shoot weight of 0.88 g and 0.78 g, respectively (Figure 3E), while genotypes FH114 (G12), VH-363 (G21), and FH-490 (G49) showed the lowest mean values of 0.23 g, 0.29 g, and 0.22 g (Table 3), respectively. The genotypes FH-114 (G12), Cyto-178 (G13), and VH-363 (G21) performed poorly at higher levels of salinity stress and had the lowest mean values of dry shoot weight (0.04 g, 0.018 g, and 0.017 g, respectively) (Supplementary Figure S5).

3.1.6. Dry Root Weight (g)

The mean square values from the analysis of variance (Table 2) of 50 cotton accessions for dry root weight are presented in Table 2. Salinity was found to be a factor in the decrease in dry root weight compared to the control level. However, the reduction in dry root weight was less severe in certain genotypes, while, in other genotypes, a substantial decline was observed at higher levels of salinity stress. At a 0 mM NaCl concentration, minimum mean values of dry root weight were recorded in KZ-191 (G4) (0.02 g) and SB-149 (G1) (0.03 g), while the maximum value for dry root weight was recorded in VH-330 (G38) (0.22 g) (Table 3). At a 150 mM NaCl concentration, AA-802 (G30) (0.17 g), MNH-992 (G8) (0.139 g), and Cyto-515 (G50) (0.143 g) had the maximum dry root weight, while at a 200 mM NaCl concentration, Kehkshan (G31) and Cyto-515 (G50) exhibited higher dry root weights of 0.15 g and 0.149 g, respectively (Figure 3F and Supplementary Figure S6).

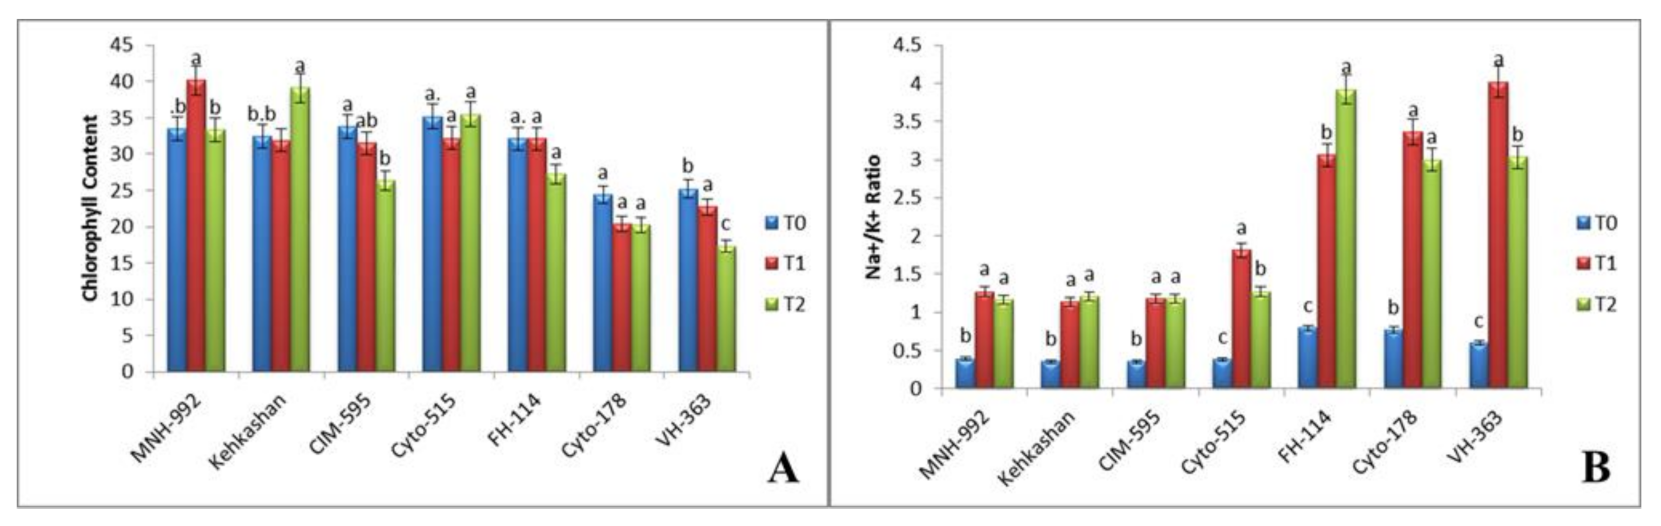
3.2. Effect of Salt Stress on Physiological Properties

3.2.1. Chlorophyll Content

Variance of Analysis of chlorophyll content was performed for control and salinity levels of 150 mM and 200 mM NaCl, respectively, to obtain valuable data about the genotype differences. Salt stress reduced the chlorophyll content in mostly genotypes that are salt-susceptible, but it increased in salt-tolerant genotypes. Under the Control level, the highest mean value of chlorophyll content was observed in Mubarak (G32) (47.77 CCI), while the lowest mean value was recorded in FH-118 (G45) (21.50 CCI) (Table 3). Under a 150 mM NaCl concentration, the highest chlorophyll content was measured in FH-452 (G2) (40.80 CCI) and MNH-992 (G8) (40. 2 CCI). Under a 200 mM salinity level, the maximum chlorophyll content was observed in Kehkshan (G31) (39.10 CCI), MNH-888 (G28) (38.7 CCI), and FH-172 (G42) (36.2 CCI) (Figure 4A and Supplementary Figure S7).

3.2.2. Na+/K+ Ratio

NaCl treatment had a major effect on plant ionic homeostasis, specifically Na+, K+, and Na+/K+ ratio. Na+ ion concentration in leaves was minimal in the 0 mM NaCl concentration but plants treated with NaCl had a higher level of Na+ content, especially when the salt concentration was higher, i.e., 200 mM. Genotypes showed significant differences in Na+, K+, and Na+/K+ ratio. In Tarzan (G9), FH-114 (G12), VH-259 (G16), and KZ-181 (G3) genotypes, there was more accumulation of Na+ ions in leaves than K+ ions, resulting in an increase in the Na+/K+ ratio (Supplementary Figure S8). The concentration of K+ ions significantly increased in Kehkshan (G31), FH-118 (G45), and CIM-595 (G39). The maximum value for K+ ions in FH-169 (G46) was obtained under a salt stress condition of 200 mM. A higher Na+/K+ ratio was recorded in VH-363 (G21) and Cyto-178 (G13) under a 150 mM stress level (Figure 4B), while under a 200 mM stress level, this ratio was high in FH-114 (G12) and NIAB-820 (G48).

3.3. Effect of Salt Stress on Biochemical Properties

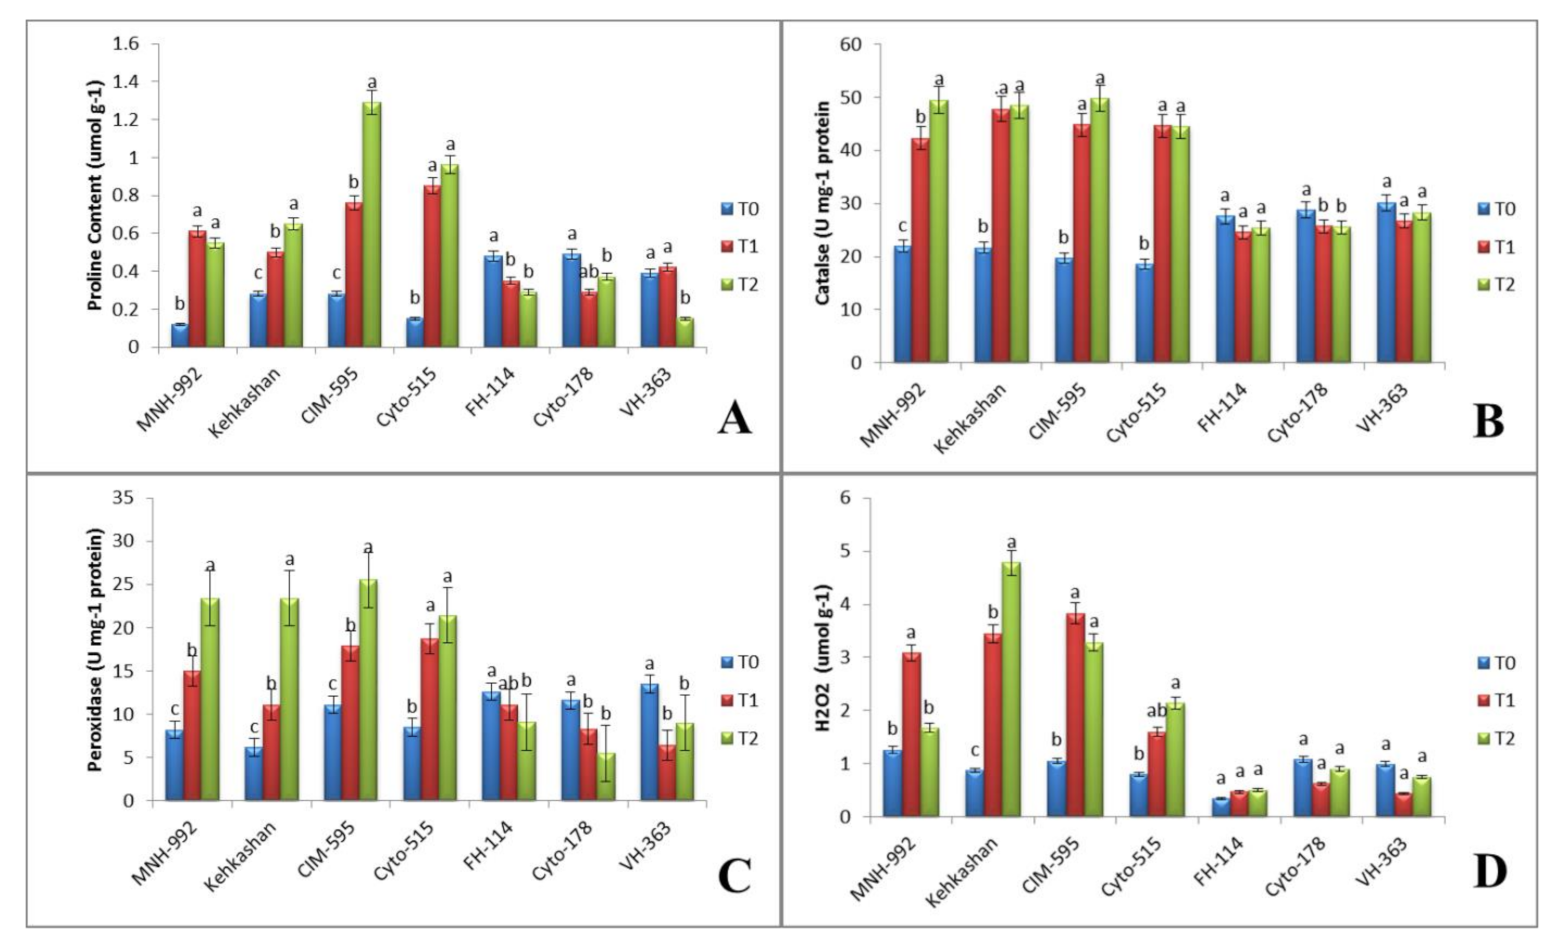
3.3.1. Proline Content

A significant correlation between proline accumulation and rising salt concentrations was found. Treated seedlings were found to have a higher proline content, and proline accumulation increased continuously as the salt concentration increased (Figure 5A). The maximum proline content (1.18 µmol g−1 FW) was found in the 200 mM NaCl treatment, whereas the minimum proline (0.65 µmol g−1 FW) content was found in untreated seedlings (Table 3). FH-114 (G12) showed a significant decrease in Proline content under a 200 mM salt stress level and remained unchanged under a 150 mM stress level (Supplementary Figure S9).

3.3.2. Catalase Activity

Significant differences among genotypes were observed for catalase activity in salt-stressed cotton leaves. In the CIM-595 (G39) genotype, salt stress greatly increased the CAT activity. In contrast, under the NaCl stress conditions, CAT was decreased in Cyto-178 (G13) (Figure 5B). CAT activity was much higher in MNH-992 (G8) and CIM-595 (G39) under a 200 mM NaCl stress condition compared to the 150 mM NaCl stress condition where it was significantly reduced (Supplementary Figure S10).

3.3.3. Peroxidase Activity

Cotton genotypes differ significantly in terms of peroxidase activity. Under NaCl stress conditions, the POD activity increased significantly in VH-228 (G35), Cyto-515 (G50), MNH-992 (G8), and Bahar-2017 (G33). Similarly, some genotypes, such as CRS-2 (G10), Cyto-178 (G13), and VH-363 (G21), exhibited a decrease in POD activity. Under a 200 mM salt stress, POD activity was observed higher in CIM-595 (G39) (25.50 U mg-1 protein) and lowest in MNH-888 (G28) (3.70 U mg-1 protein) under the 0 mM salt stress level (Figure 5C and Supplementary Figure S11)

3.3.4. Hydrogen Peroxidase

The mean square values from analysis of variance (Table 2) of 50 cotton accessions for H2O2 are presented in Table 2. Under normal conditions, the Tipo-1 (G7) genotype had a maximum mean value of 1.40 µmol g−1 FW while Bahar-2017 (G33) had a minimum value of 0.22 µmol g−1 FW (Table 3). It was observed that some genotypes showed a higher H2O2 amount as the salt concentration increased such as Kehkshan (G31) (4.78 µmol g−1 FW), Mubarak (G32) (1.89 µmol g−1 FW), Cyto-515 (G50) (2.14 µmol g−1 FW), and MNH-992 (G8) (1.67 µmol g−1 FW), but a decrease in H2O2 level was found in FH-114 (G12) (0.5 µmol g−1 FW), VH-363 (G21) (0.75 µmol g−1 FW), and VH-259 (G16) (0.6 µmol g−1 FW) (Figure 5D and Supplementary Figure S12).

3.4. Cluster Analysis

Cluster analysis of cotton genotypes was carried out based on morphophysiological and biochemical parameters under both normal and salt stress conditions, which are presented in the form of tables. This analysis grouped the germplasm into different clusters according to the performance and potential of traits. Similarly, this analysis was used to exploit the data obtained from this study. A total of 50 accessions were grouped using K-means cluster analysis according to the mean values of traits; five different clusters were generated under normal (Table 4 and salt stress conditions (Table 5 and Table 6)).
At a 0 mM (control) salinity level, cluster No. 4 showed the highest mean values for shoot length (21.88 cm), fresh shoot weight (1.29 g), dry root weight (0.11 g), chlorophyll content (30.88 chlorophyll concentration index), H2O2 (0.85 µmol g−1 FW), and POD (8.89 U mg−1 protein) except for root length (15.59 cm), fresh root weight (0.53 g), dry shoot weight (0.50 g), proline (0.23 µmol g−1 FW), and CAT (21.50 U mg−1 protein). Cluster 4 contained accessions such as AA-703 (G6), MNH-992 (G8), Tarzan (G9), IUB-14 (G11), S-9 (G15), VH-259 (G16), FH-170 (G23), VH-339 (G27), FH-215 (G34), Cyto-608 (G40), KZ-189 (G41), BS-80 (G43), FH-490 (G49), and Cyto-515 (G50). Cluster 5 also contained some positively associated traits such as root length, fresh root weight, proline, CAT, and Na+/K+ ratio (Table 7). On the other hand, the mean value for Na+/K+ ratio was higher in cluster 1 and lowest in cluster 5 (Table 7).
K-means cluster analysis grouped these 50 accessions into five clusters at a salinity level of 150 mM. The genotypes in cluster 5 had greater values for shoot length (18 cm), fresh shoot weight (0.80 g), fresh root weight (0.25 g), dry shoot weight (0.15 g), dry root weight (0.06 g), peroxidase (12.56 U mg−1 protein), chlorophyll (33.04 CCI), and proline contents (0.56 µmol g−1 FW) (Table 8. A higher potassium concentration was observed in Kehkshan (G31) while CIM-595 (G39) had higher H2O2 contents (cluster 2).
When the accessions were evaluated in greenhouse conditions at a salinity level of 200 mM, the accessions had five clusters. Similarly, some genotypes in cluster No. 2 performed well in biplot analysis, e.g., Cyto-515 (G50) and Kehkshan (G31) for root length (17 cm), fresh shoot weight (1.53 g), fresh root weight (0.77 g), dry shoot weight (1.19 g), and dry root weight (0.15 g). Similarly, CIM-595 (G39) showed the highest level of catalase (49.83 U mg−1 protein) and peroxidase (25.50 U mg−1 protein), essential indicators of salt tolerance (Table 9.

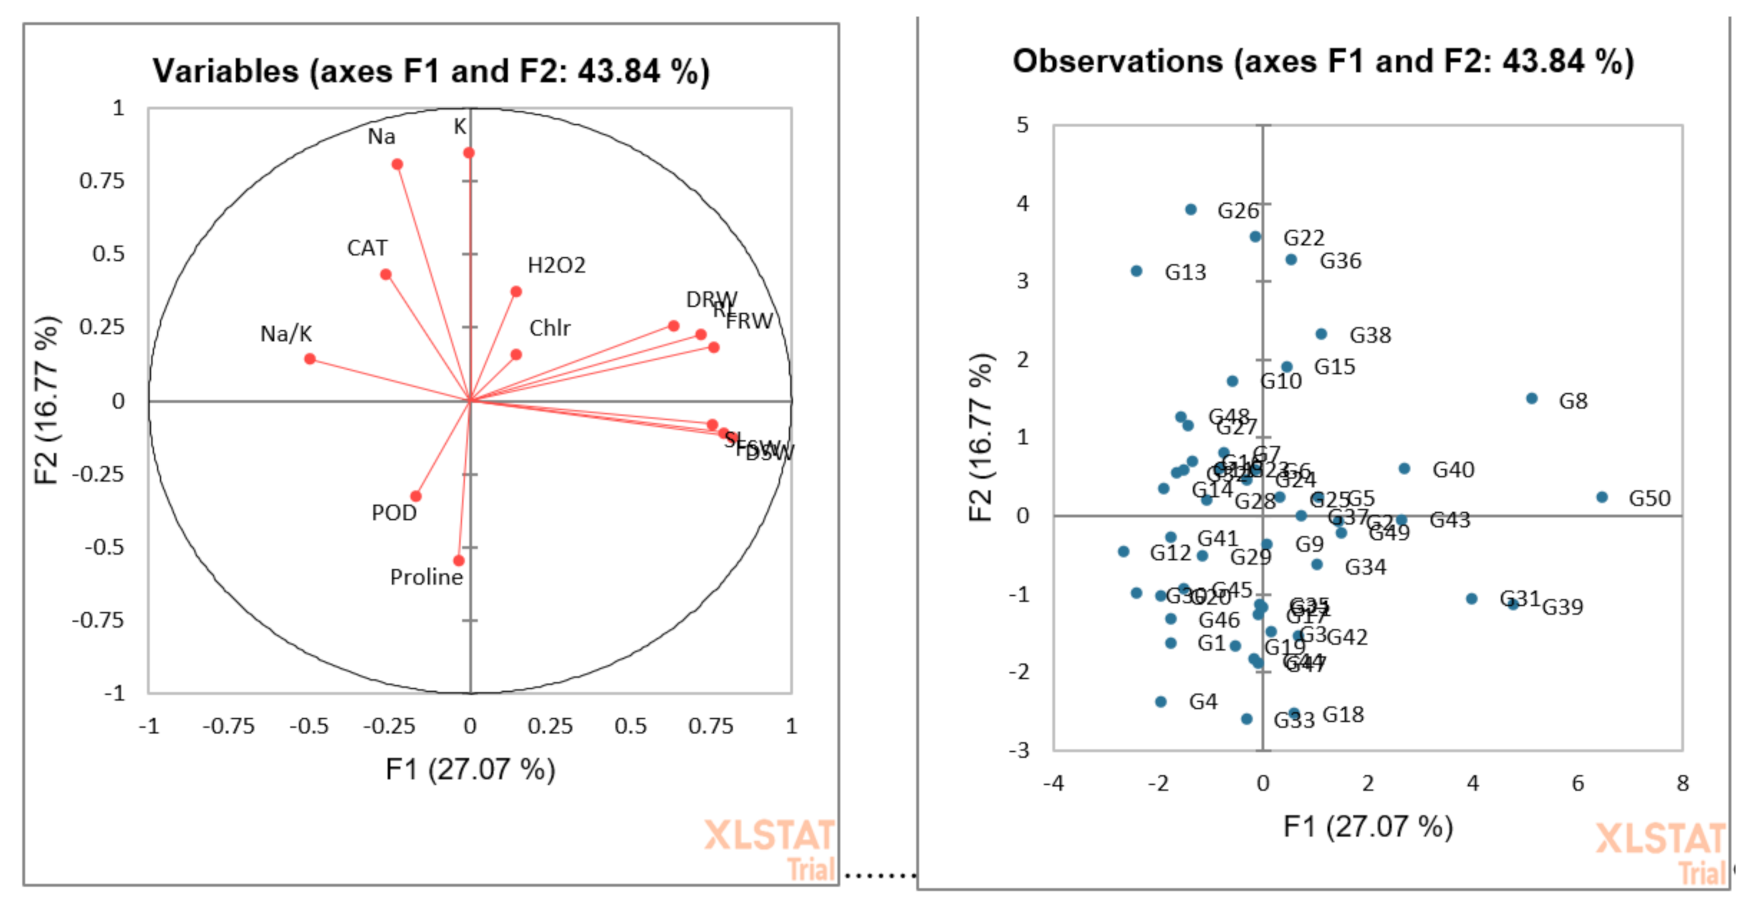
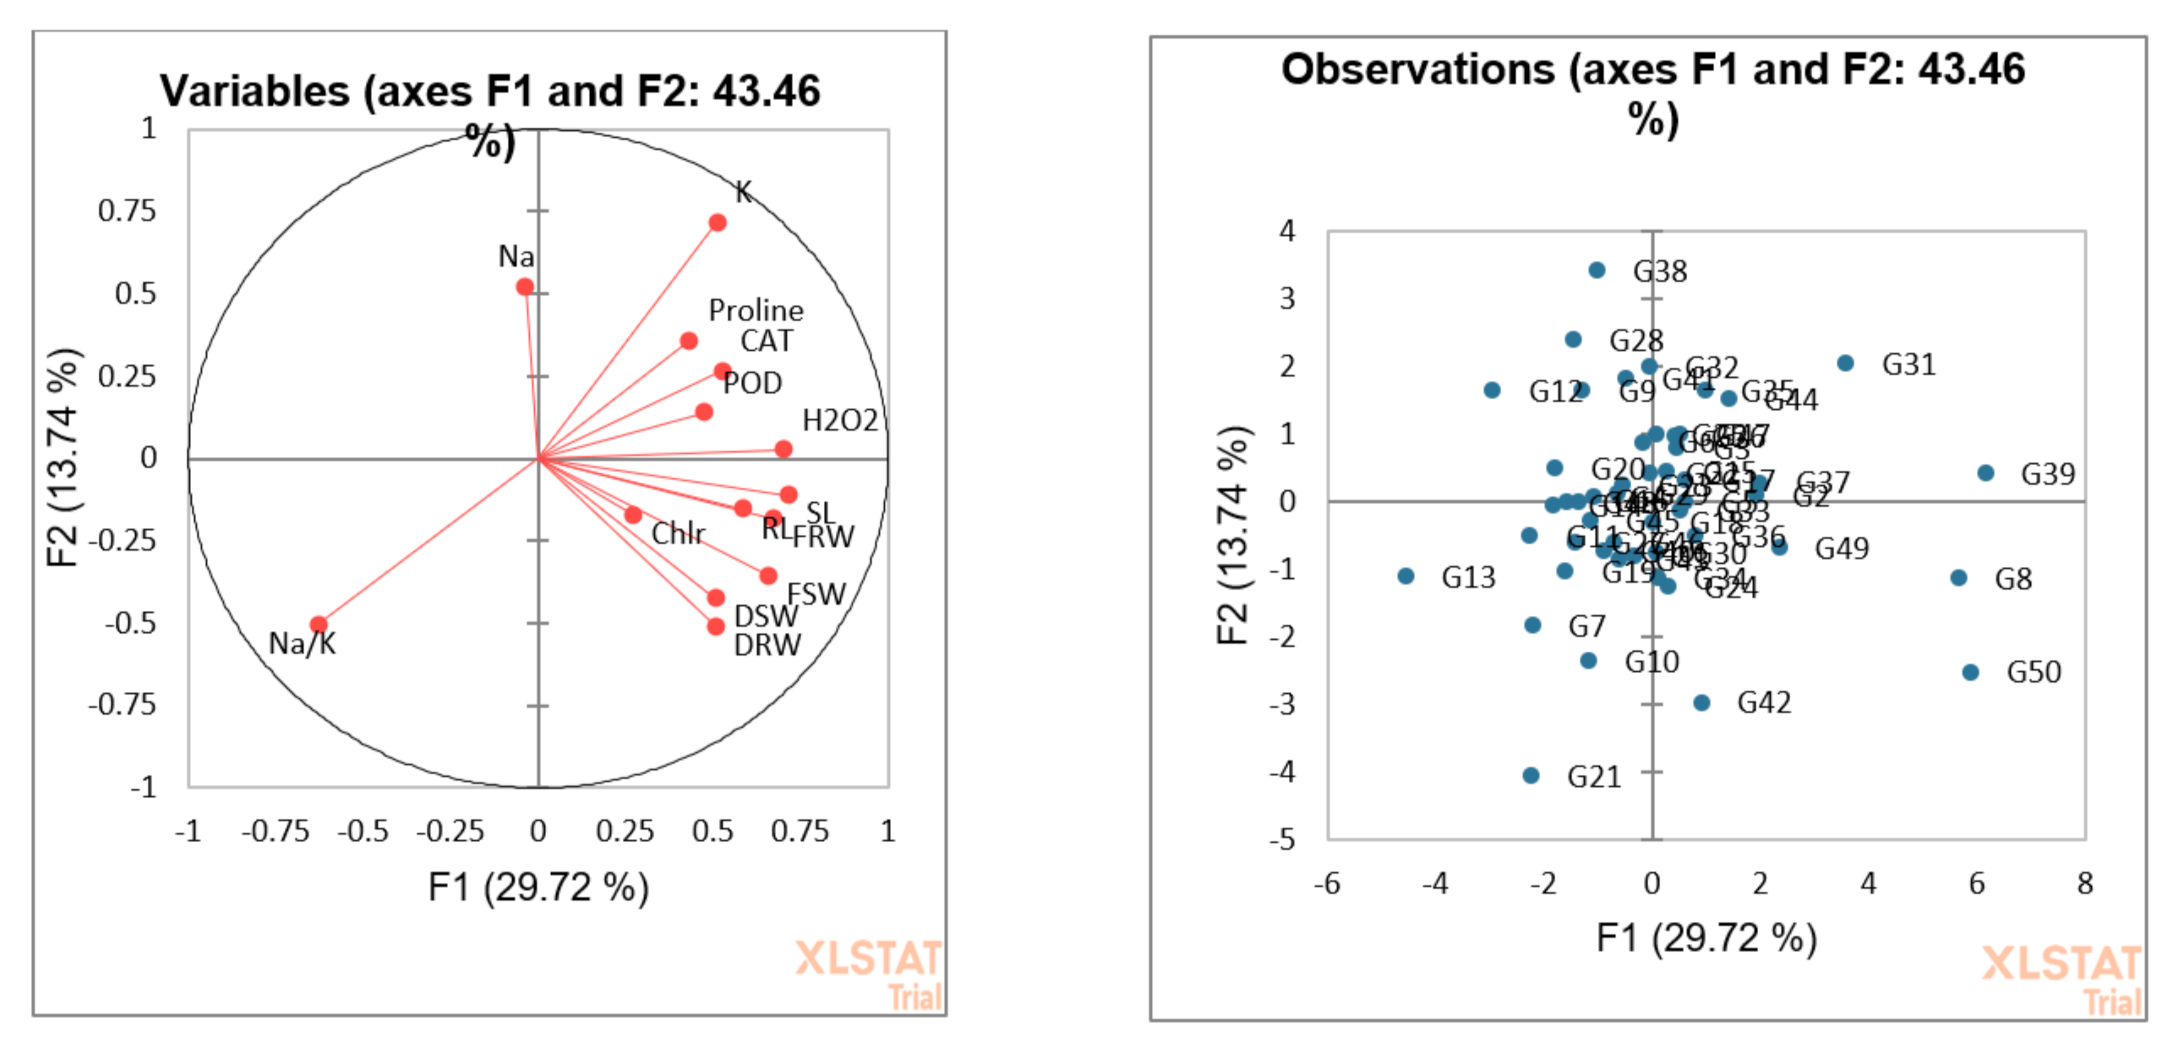
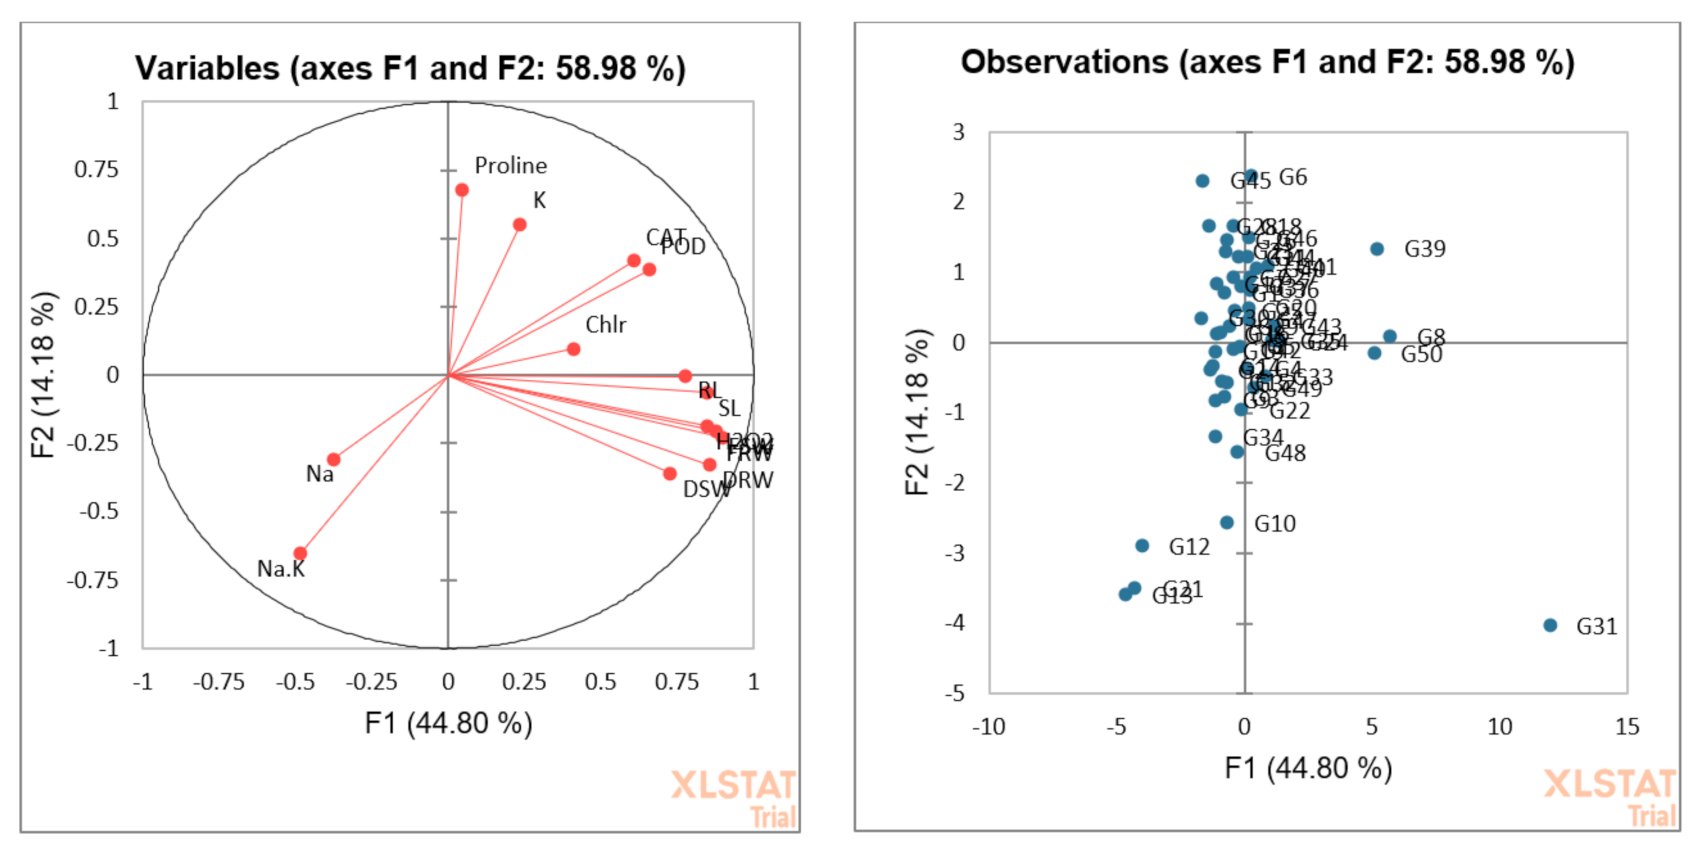
3.5. Principal Component or Biplot Analysis

The presence of genetic differences allows the researchers to conduct other biometrical analyses such as biplot analysis used in this article. The purpose of using biplot analysis is to characterize and identify the salt-susceptible and -tolerant lines. Under control and salt stress conditions, 43.84, 43.46 and 58.98% variabilities were present among the genotypes (Figure 6, Figure 7 and Figure 8).
It was observed that Kehkshan (G31), CIM-595 (G39), VH-330 (G38), Cyto-178 (G13), MNH-992 (G8), and Cyto-515 (G50) were widely dispersed and distant from the origin, exhibiting great variability for morphophysiological and biochemical traits under the salt stress. The sensitive genotypes FH-114 (G12) and MNH-888 (G28) were very near to the Na+ ion, and the genotypes Cyto-178 (G13) and VH-363 (G21) had higher Na+/K+ ratios under a 150 mM stress level (Figure 7). FH-114 (G12), Cyto-178 (G13), and VH-363 (G21) showed poor performance under salt stress conditions. Na+/K+ ratio was negatively correlated with other parameters. Due to the higher concentration of Na+, the genotypes Cyto-178 (G13), VH-363 (G21), CRS-2 (G10), and Tip-1(G7) responded poorly to salinity stress. The most contributing genotypes for the salt tolerance included MNH-992 (G8), Kehkshan (G31), CIM-595 (G39), and Cyto-515 (G50) (Figure 8).

4. Discussion

Plant breeders rely on genetic diversity in a variety of traits for the purpose of developing new genotypes that can provide resistance against the biotic and abiotic stresses. Scientists from around the world have validated the existence of genetic variation for salinity tolerance in cotton plants by characterizing biochemical, physiological, and yield-related parameters [23]. In our experiment, we screened the genotypes in a hydroponic culture. Several studies have shown that the screening of genotypes in a hydroponic culture is very efficient and comparable to soil conditions and this method can be used to select the genotypes [24]. There is no interspecific competition among plants for nutrients in hydroponic growth solutions, as there is in soil. Plant responses can be reproducibly and accurately determined and treatments can be controlled precisely [25]. The current study observed a significant reduction in cotton plant growth after being exposed to salinity stress. A similar reduction in growth was previously investigated in cotton plant [26]. Many metabolic and physiological changes take place under salt stress. It first disrupts the physiological function by causing osmotic stress, which is followed by oxidative stress and ion toxicity. However, plants developed various biochemical and physiological defense mechanisms in order to carry out their metabolic and cellular processes, in which Na+ compartmentalization is the key mechanism [27]. Along with antioxidant enzymes activation, maintaining ion homeostasis, particularly Na+ sequestration, is an important mechanism for survival under salt stress [14]. Considering the significance of this research on salinity, shoot- and root-related parameters are important when selecting the genotypes of cotton that are salt-tolerant, and these parameters have been successfully used as a selection in other field crops such tomato [28], wheat [29], okra [30], and cowpea [31]. Shoot and root lengths of salt-sensitive genotypes are more affected as compared to salt-tolerant genotypes. Under salt conditions, the genotypes Kehkshan (G31), MNH-992 (G8), CIM-595 (G39), and Cyto-515 (G50) have longer root lengths. A reduced shoot and root length was observed in FH-114, Cyto-178, and VH-363, indicating salt sensitivity [12]. The fresh shoot and root weight of few accessions varied significantly under salt stress and control conditions. Keeping in view the significance of these traits, MNH-992 (G8), Kehkshan (G31), CIM-595 (G39), and Cyto-515 (G50) were observed as salt-tolerant genotypes. Increased salt concentration in plant organelles causes the accumulation of Na+ in leaf sap, which is one of the main way plants react to salinity stress by disturbing cellular metabolism [32]. Under salt stress, the genotypes that have a low concentration of Na+ can survive better [33]. It was asserted that salt tolerance is linked to the Na+ ions balancing [34]. In this study, low Na+ level was found in the accessions MNH-992, Kehkshan, CIM-595, and Cyto-515. Na+/K+ ratio was significantly raised by salinity stress in cotton plant. Na+ content was found to be higher in NaCl-treated plants than in non-treated plants. Furthermore, significant differences in Na+, K+ and Na+/K+ ratio were observed between genotypes. In Tarzan (G9), FH-114 (G12), VH-259 (G16), Cyto-178 (G13), and KZ-181 (G3) genotypes, there was more accumulation of Na+ ions in leaves than K+ ions, resulting in an increase in the Na+/K+ ratio. Many physiological traits, such as chlorophyll contents, have been successfully used as suitable selection criteria, and these chlorophyll contents degrade during salt stress, resulting in a reduction in plant growth and photosynthesis rate, because high chlorophyll concentration increases the yield, photosynthesis rate, and dry matter production [35]. Salt stress causes the increase in production of reactive oxygen species such as hydroxyl radicals, H2O2, and superoxide anions. To counteract this effect, plants produce a variety of antioxidants (enzymatic and non-enzymatic), showing the presence of a positive correlation between antioxidants and ROS [36]. Plants under saline stress accumulate more proline as compared to control plants. Proline helps to maintain the cell membrane’s integrity and prevents NaCl from damaging it [37]. According to the present study, proline accumulation in cotton plant is positively correlated with increasing salt concentrations. In our study, tolerance to salt stress is positively associated with POD content in plants, which is in accordance with the findings of Munawar et al. [26]. As a result, the POD enzyme increased in order to detoxify reactive oxygen species (ROS) and prevent its production in plants. According to the findings of our study, under a 200 mM salt stress, the POD activity was observed higher in CIM-595 (G39) (25.50 U mg−1 protein) and lowest in MNH-888 (G28) (3.70 U mg−1 protein) under the 0 mM salt stress level. It is reported that, when cotton plants are exposed to salt stress, their CAT activity increases in order to deal with the production of ROS and protect the plant against oxidative damage [38]. In our experiment, an increased level of CAT was noted in salt-tolerant genotypes MNH-992 (G8) and CIM-595 (G39) under a 200 mM NaCl stress. The CAT activity was reduced in Cyto-178 (G13) and VH-363 (G21) under stress conditions. In comparison to the other accessions, such as Bahar-2017, CRS-2007, Ghouri, and NIAB-820, some genotypes including MNH-992, Kehkshan, CIM-595, and Cyto-515 have high antioxidant properties. The genotypes were classified into homogenous groups by cluster analysis based on morphophysiological and biochemical parameters. On the basis of cluster analysis results, 50 genotypes of cotton were divided into five major clusters. Using PCA, we identified and selected salt-susceptible and -tolerant genotypes of cotton at the seedling stage. According to PCA results, MNH-992 (G8), Kehkshan (G31), CIM-595 (G39), and Cyto-515 (G50) are the most resistant genotypes followed by Cyto-178 (G13), VH-363 (G21), and FH-114 (G12), which are the most sensitive genotypes. This indicator has also been used successfully to identify salt-tolerant lines in maize [39], wheat [40], rice [41], and cotton germplasms [42].

5. Conclusions

Based on the findings of this study, we can conclude that salt-tolerant genotypes MNH-992, Kehkshan, CIM-595, and Cyto-515 respond differently under the salt stress conditions in terms of the effective transport system that favors the preferential absorption of K+ over Na+ and better antioxidant defense system. The potential for quantitative traits of the identified salt-tolerant genotypes such as MNH-992, Kehkshan, CIM-595, and Cyto-515 could be evaluated after planting in salt-affected regions of the country. These genotypes may be used in breeding programs to develop the new salt-tolerant genotypes. Such germplasms could be beneficial to cotton breeders and would offer a chance to expand the region where cotton is grown in the country.

Supplementary Materials

The following supporting information can be downloaded at: https://www.mdpi.com/article/10.3390/agronomy13041012/s1, Figure S1: Comparison of different treatments on the shoot length of 50 cotton genotypes. T0 = control, T1 = 150 mM, T3 = 200 mM NaCl; Figure S2: Comparison of different treatments on the root length of 50 cotton genotypes. T0 = control, T1 = 150 mM, T3 = 200 mM NaCl; Figure S3: Comparison of different treatments on the fresh shoot weight of 50 cotton genotypes. T0 = control, T1 = 150 mM, T3 = 200 mM NaCl; Figure S4: Comparison of different treatments on the fresh root weight of 50 cotton genotypes. T0 = control, T1 = 150 mM, T3 = 200 mM NaCl; Figure S5: Comparison of different treatments on the dry shoot weight of 50 cotton genotypes. T0 = control, T1 = 150 mM, T3 = 200 mM NaCl; Figure S6: Comparison of different treatments on the dry root weight of 50 cotton genotypes. T0 = control, T1 = 150 mM, T3 = 200 mM NaCl; Figure S7: Comparison of different treatments on the chlorophyll content of 50 cotton genotypes. T0 = control, T1 = 150 mM, T3 = 200 mM NaCl; Figure S8: Comparison of different treatments on the Na+/K+ ratio of 50 cotton genotypes. T0 = control, T1 = 150 mM, T3 = 200 mM NaCl; Figure S9: Comparison of different treatments on the proline content of 50 cotton genotypes. T0 = control, T1 = 150 mM, T3 = 200 mM NaCl; Figure S10: Comparison of different treatments on the catalase activity of 50 cotton genotypes. T0 = control, T1 = 150 mM, T3 = 200 mM NaCl; Figure S11: Comparison of different treatments on the peroxidase activity of 50 cotton genotypes. T0 = control, T1 = 150 mM, T3 = 200 mM NaCl; Figure S12: Comparison of different treatments on the hydrogen peroxide of 50 cotton genotypes. T0 = control, T1 = 150 mM, T3 = 200 mM NaCl.

Author Contributions

S.S. conducted the field work, performed lab experiments, and wrote the manuscript. S.A. (Sidra Aslam) and S.A. (Seema Aslam) helped in lab experiments. R.W. and M.S. helped in statistical analysis. M.B. and M.T.A. supervised the study, monitored and helped in carrying out the experiments on a regular basis. H.S. reviewed the manuscript. All authors have read and agreed to the published version of the manuscript.

Funding

This study was funded by the Institute of Molecular Biology and Biotechnology, Bahauddin Zakariya University, Multan, 60800, Pakistan.

Institutional Review Board Statement

Not applicable.

Informed Consent Statement

Not applicable.

Data Availability Statement

Data related to the research are reported in the manuscript. Any additional data may be acquired from the corresponding author upon request.

Acknowledgments

We are grateful to the Institute of Molecular Biology and Biotechnology, Bahauddin Zakariya University, Multan-60800, Pakistan for providing all kind of support.

Conflicts of Interest

The authors declare no conflict of interest.

References

  1. Shrivastava, P.; Kumar, R. Soil salinity: A serious environmental issue and plant growth promoting bacteria as one of the tools for its alleviation. Saudi J. Biol. Sci. 2015, 22, 123–131. [Google Scholar] [CrossRef] [PubMed] [Green Version]
  2. Manikandan, A.; Sahu, D.; Blaise, D.; Shukla, P.K. Cotton response to differential salt stress. Int. J. Agri. Sci. 2019, 11, 0975–3710. [Google Scholar]
  3. Ismail, A.M.; Heue, S.; Thomson, M.J.; Wissuwa, M. Genetic and genomic approaches to develop rice germplasm for problem soils. Plant Mol. Biol. 2007, 65, 547–570. [Google Scholar] [CrossRef] [PubMed]
  4. Hussain, S.; Shaukat, M.; Ashraf, M.; Zhu, C.; Jin, Q.; Zhang, J. Salinity stress in arid and semi-arid climates: Effects and management in field crops. J. Clim. Change Agri. 2019, 13, 197–222. [Google Scholar]
  5. Munns, R. Comparative physiology of salt and water stress. J. Plant Cell Environ. 2002, 25, 239–250. [Google Scholar] [CrossRef] [PubMed] [Green Version]
  6. Zörb, C.; Geilfus, C.M.; Dietz, K.J. Salinity and crop yield. J. Plant Biol. 2019, 21, 31–38. [Google Scholar] [CrossRef]
  7. Forghani, A.H.; Almodares, A.; Ehsanpour, A.A. Potential objectives for gibberellic acid and paclobutrazol under salt stress in sweet sorghum (Sorghum bicolor [L.] Moench cv. Sofra). J. Appl. Biol. Chem. 2018, 61, 113–124. [Google Scholar] [CrossRef] [Green Version]
  8. Al-Farsi, S.M.; Nawaz, A.; Nadaf, S.K.; Al-Sadi, A.M.; Siddique, K.H.; Farooq, M. Effects, tolerance mechanisms and management of salt stress in lucerne (Medicago sativa). J. Crop Pasture Sci. 2020, 71, 411–428. [Google Scholar] [CrossRef]
  9. Wang, C.; Xiao, R.; Cui, Y.; Ma, Z.; Guo, Y.; Wang, Q.; Xiu, Y.; Zhang, M. Photosynthate-13C allocation in the plant-soil system after 13C–pulse labeling of Phragmites australis in different salt marshes. Geoderma 2019, 347, 252–261. [Google Scholar] [CrossRef]
  10. Farooq, M.; Hussain, M.; Wakeel, A.; Siddique, K.H.M. Salt stress in maize: Effects, resistance mechanisms, and management. A review. J. Agron. Sustain. Dev. 2015, 35, 461–481. [Google Scholar] [CrossRef] [Green Version]
  11. Ding, W.; Song, L.; Wang, X.; Bi, Y. Effect of abscisic acid on heat stress tolerance in the calli from two ecotypes of Phragmites communis. J. Biol. Plant 2010, 54, 607–613. [Google Scholar] [CrossRef]
  12. SSharif, I.; Aleem, S.; Farooq, J.; Rizwan, M.; Younas, A.; Sarwar, G.; Chohan, S.M. Salinity stress in cotton: Effects, mechanism of tolerance and its management strategies. J. Physiol. Mol. Biol. Plants 2019, 25, 807–820. [Google Scholar] [CrossRef] [PubMed]
  13. Higbie, S.M.; Wang, F.; Stewart, J.M.; Sterling, T.M.; Lindemann, W.C.; Hughs, E.; Zhang, J. Physiological response to salt (NaCl) stress in selected cultivated tetraploid cottons. Int. J. Agron. 2010, 2010, 643475. [Google Scholar] [CrossRef] [Green Version]
  14. Gupta, B.; Huang, B. Mechanism of salinity tolerance in plants: Physiological, biochemical, and molecular characterization. Int. J. Genom. 2014, 2014, 701596. [Google Scholar] [CrossRef] [Green Version]
  15. Majeed, S.; Malik, T.A.; Rana, I.A.; Azhar, M.T. Antioxidant and physiological responses of upland cotton accessions grown under high-temperature regimes. Iran J. Sci. Technol. Trans. A Sci. 2019, 43, 2759–2768. [Google Scholar] [CrossRef]
  16. Hoagland, D.R.; Arnon, D.I. The water-culture method for growing plants without soil. Circ. Calif. Agric. Exp. Station 1950, 347, 360–361. [Google Scholar]
  17. Hosseini, G.; Thengane, R.J. Salinity tolerance in cotton (Gossypium hirsutum L.) genotypes. Int. J. Bot. 2007, 3, 48–55. [Google Scholar] [CrossRef] [Green Version]
  18. Bates, L.S.; Waldren, R.P.; Teare, I. Rapid determination of free proline for water-stress studies. Plant Soil 1973, 39, 205–207. [Google Scholar] [CrossRef]
  19. Fielding, J.; Hall, J. A biolchemical and cytochemical study of peroxidase activity in roots of Pisum sativum: I. a comparison of DAB-peroxidase and guaiacol-peroxidase with particular emphasis on the properties of cell wall activity. J. Exp. Bot. 1978, 29, 969–981. [Google Scholar] [CrossRef]
  20. Sachdev, S.; Ansari, S.A.; Ansari, M.I.; Fujita, M.; Hasanuzzaman, M. Abiotic stress and reactive oxygen species: Generation, signaling, and defense mechanisms. Antioxidants 2021, 10, 277. [Google Scholar] [CrossRef]
  21. Velikova, V.; Yordanov, I.; Edreva, A. Oxidative stress and some antioxidant systems in acid rain-treated bean plants: Protective role of exogenous polyamines. J. Plant Sci. 2000, 151, 59–66. [Google Scholar] [CrossRef]
  22. Torrie, J.H.; Steel, R.G. Principles and Procedures of Statistics: A Biometrical Approach; McGraw-Hill: New York, NY, USA, 1980. [Google Scholar]
  23. Zhao, G.; Song, Y.; Wang, Q.; Yao, D.; Li, D.; Qin, W.; Ge, X.; Yang, Z.; Xu, W.; Su, Z.; et al. Gossypium hirsutum salt tolerance is enhanced by overexpression of G. arboreum JAZ1. Front. Bioeng. Biotechnol. 2020, 8, 157. [Google Scholar] [CrossRef] [PubMed]
  24. Naher, T.; Sarkar, M.; Kabir, A.; Haider, S.; Paul, N. Screening of Zn-efficient rice through hydroponic culture. J. Plant Environ. Dev. 2014, 3, 14–18. [Google Scholar]
  25. Sharma, N.; Acharya, S.; Kumar, K.; Singh, N.; Chaurasia, O.P. Hydroponics as an advanced technique for vegetable production: An overview. J. Soil Water Conserv. 2018, 17, 364–371. [Google Scholar] [CrossRef]
  26. Munawar, W.; Hameed, A.; Khan, M.K.R. Differential morphophysiological and biochemical responses of cotton genotypes under various salinity stress levels during early growth stage. Front. Plant Sci. 2021, 12, 622309. [Google Scholar] [CrossRef]
  27. Wang, N.; Wang, X.; Shi, J.; Liu, X.; Xu, Q.; Zhou, H.; Song, M.; Yan, G. Mepiquat chloride-priming induced salt tolerance during seed germination of cotton (Gossypium hirsutum L.) through regulating water transport and K+/Na+ homeostasis. J. Exp. Bot. 2019, 159, 168–178. [Google Scholar] [CrossRef]
  28. Maggio, A.; Raimondi, G.; Martino, A.; De Pascale, S. Salt stress response in tomato beyond the salinity tolerance threshold. J. Environ. Exp. Bot. 2007, 59, 276–282. [Google Scholar] [CrossRef]
  29. Tiwari, S.; Singh, P.; Tiwari, R.; Meena, K.K.; Yandigeri, M.; Singh, D.P.; Arora, D.K. Salt-tolerant rhizobacteria-mediated induced tolerance in wheat (Triticum aestivum) and chemical diversity in rhizosphere enhance plant growth. J. Biol. Fertil. Soils. 2011, 47, 907–916. [Google Scholar] [CrossRef]
  30. Zhan, Y.; Wu, Q.; Chen, Y.; Tang, M.; Sun, C.; Sun, J.; Yu, C. Comparative proteomic analysis of okra (Abelmoschus esculentus L.) seedlings under salt stress. BMC Genom. 2019, 20, 381. [Google Scholar] [CrossRef]
  31. Farooq, M.; Rehman, A.; Al-Alawi, A.K.; Al-Busaidi, W.M.; Lee, D.-J. Integrated use of seed priming and biochar improves salt tolerance in cowpea. J. Sci. Hortic. 2020, 272, 109507. [Google Scholar] [CrossRef]
  32. Meneguzzo, S.; Navari-Izzo, F.; Izzo, R. NaCl effects on water relations and accumulation of mineral nutrients in shoots, roots and cell sap of wheat seedlings. J. Plant Physiol. 2000, 156, 711–716. [Google Scholar] [CrossRef]
  33. Akram, M.S.; Athar, H.; Ashraf, M. Improving growth and yield of sunflower (Helianthus annuus L.) by foliar application of potassium hydroxide (KOH) under salt stress. Pak.J. Bot. 2007, 39, 769–776. [Google Scholar]
  34. Santa-María, G.E.; Epstein, E. Potassium/sodium selectivity in wheat and the amphiploid cross wheat X Lophopyrum elongatum. J. Plant Sci. 2001, 160, 523–534. [Google Scholar] [CrossRef]
  35. Harinasut, P.; Tsutsui, K.; Takabe, T.; Nomura, M.; Takabe, T.; Kishitani, S. Exogenous glycinebetaine accumulation and increased salt-tolerance in rice seedlings. J. Biosci. Biotechnol. Biochem. 1996, 60, 366–368. [Google Scholar] [CrossRef] [PubMed] [Green Version]
  36. Kim, Y.; Mun, B.-G.; Khan, A.L.; Waqas, M.; Kim, H.-H.; Shahzad, R.; Imran, M.; Yun, B.-W.; Lee, I.-J. Regulation of reactive oxygen and nitrogen species by salicylic acid in rice plants under salinity stress conditions. PLoS ONE 2018, 13, e0192650. [Google Scholar] [CrossRef] [Green Version]
  37. El Moukhtari, A.; Cabassa-Hourton, C.; Farissi, M.; Savouré, A. How does proline treatment promote salt stress tolerance during crop plant development? Front. Plant Sci. 2020, 11, 1127. [Google Scholar] [CrossRef]
  38. Abdelraheem, A.; Esmaeili, N.; O’Connell, M.; Zhang, J. Progress and perspective on drought and salt stress tolerance in cotton. Ind. Crops Prod. 2019, 130, 118–129. [Google Scholar] [CrossRef]
  39. Chen, Y.-E.; Mao, J.-J.; Sun, L.-Q.; Huang, B.; Ding, C.-B.; Gu, Y.; Liao, J.-Q.; Hu, C.; Zhang, Z.-W.; Yuan, S.; et al. Exogenous melatonin enhances salt stress tolerance in maize seedlings by improving antioxidant and photosynthetic capacity. J. Physiol. Plant 2018, 164, 349–363. [Google Scholar] [CrossRef]
  40. Yassin, M.; El Sabagh, A.; Mekawy, A.M.M.; Islam, M.S.; Hossain, A.; Barutcular, C.; Alharby, H.; Bamagoos, A.; Liu, L.; Ueda, A.; et al. Comparative performance of two bread wheat (Triticum aestivum L.) genotypes under salinity stress. J. Appl. Ecol. Environ. Res. 2019, 17, 5029–5041. [Google Scholar] [CrossRef]
  41. Vaidyanathan, H.; Sivakumar, P.; Chakrabarty, R.; Thomas, G. Scavenging of reactive oxygen species in NaCl-stressed rice (Oryza sativa L.)—Differential response in salt-tolerant and sensitive varieties. J. Plant Sci. 2003, 165, 1411–1418. [Google Scholar] [CrossRef]
  42. Taghizadeh, N.; Ranjbar, G.A.; Nematzadeh, G.A.; Ramazani Moghaddam, M.R. Salt-related genes expression pattern in salt-tolerant and salt-sensitive cultivars of cotton (Gossypium sp.) Under NaCl stress. J. Plant Mo.l Breed. 2018, 6, 1–15. [Google Scholar]
Figure 1. Visual appearance of seedling emergence under greenhouse conditions: (A) Sowing of seeds in sand pots; (B) emergence of cotyledon leaves; (C) emergence of first and second true leaves; (D) overall view of pots before the harvesting day.
Agronomy 13 01012 g001
Figure 2. Pictorial view of cotton plant growth under the normal and salt stress conditions in hydroponic system: (A) Treatment with no NaCl (0 mM) served as a control; (B) Treatment with 150 mM salinity level; (C) Treatment with 200 mM salinity level.
Agronomy 13 01012 g002
Figure 3. Effect of NaCl stress on morphological properties of salt-tolerant and salt-susceptible genotypes of cotton: (A) Shoot length, (B) Root length, (C) Fresh shoot weight), (D) Fresh root weight, (E) Dry shoot weight, (F) Dry root weight. Treatments: T0 = Control, T1 = 150 mM NaCl, T2 = 200 mM NaCl. Bars with different letters indicate statistically significant differences according to Tukey’s HSD test (p < 0.05).
Agronomy 13 01012 g003
Figure 4. Effect of NaCl stress on physiological properties of salt-tolerant and salt-susceptible genotypes of cotton: (A) Chlorophyll content, (B) Na+/K+ Ratio. Treatments: T0 = Control, T1 = 150 mM NaCl, T2 = 200 mM NaCl. Bars with different letters indicate statically significant differences according to Tukey’s HSD test (p < 0.05).
Agronomy 13 01012 g004
Figure 5. Effect of NaCl stress on biochemical properties of salt-tolerant and salt-susceptible genotypes of cotton: (A) Proline Content, (B) Catalase Activity, (C) Peroxidase Activity, (D) Hydrogen peroxidase. Treatments: T0 = Control, T1 = 150 mM NaCl, T2 = 200 mM NaCl. Bars with different letters indicate statistically significant differences according to Tukey’s HSD test (p < 0.05).
Agronomy 13 01012 g005
Figure 6. Biplot analysis of 50 cotton genotypes under control condition. SL = shoot length; RL = Root length; FSW = Fresh shoot weight; FRW = Fresh root weight; DSW = Dry shoot weight; DRW= Dry root weight; Na+ = Sodium ion; K+ = Potassium ion; Na+/K+ = Sodium-to-potassium ratio; Chlr = Chlorophyll contents; CAT = Catalase activity; POD = Peroxidase; Proln; Proline; H2O2 = Hydrogen peroxide.
Agronomy 13 01012 g006
Figure 7. Biplot analysis of 50 cotton genotypes under 150 mM salinity level. SL = shoot length; RL = Root length; FSW = Fresh shoot weight; FRW = Fresh root weight; DSW = Dry shoot weight; DRW = Dry root weight; Na+ = Sodium ion; K+ = Potassium ion; Na+/K+ = Sodium-to-potassium ratio; Chlr = Chlorophyll contents; CAT = Catalase activity; POD = Peroxidase; Proln; Proline; H2O2 = Hydrogen peroxide.
Agronomy 13 01012 g007
Figure 8. Biplot analysis of 50 cotton genotypes grown under 200 mM salinity level. SL = shoot length; RL = Root length; FSW = Fresh shoot weight; FRW = Fresh root weight; DSW = Dry shoot weight; DRW = Dry root weight; Na+ = Sodium ion; K+ = Potassium ion; Na+/K+ = Sodium-to-potassium ratio; Chlr = Chlorophyll contents; CAT = Catalase activity; POD = Peroxidase; Proln; Proline; H2O2 = Hydrogen peroxide.
Agronomy 13 01012 g008
Table 1. List of cotton genotypes used to see the potential in salinity conditions.
CodeGenotypesCodeGenotypesCodeGenotypesCodeGenotypesCodeGenotypes
G1SB-149G11IUB-13G21VH-363G31KehkshanG41KZ-189
G2FH-452G12FH-114G22IR-3701G32MubarakG42FH-172
G3KZ-181G13Cyto-178G23FH-170G33Bahar-2017G43BS-80
G4KZ-191G14CRS-2007G24Cyto-124G34FH-215G44NS-121
G5VH-341G15S-9G25AGC-2G35VH-228G45FH-118
G6AA-703G16VH-259G26GhouriG36FH-142G46FH-169
G7Tipo-1G17DebalG27VH-339G37NIAB-777G47AGC-501
G8MNH-992G18FH-154G28MNH-888G38VH-330G48NIAB-820
G9TarzanG19Cyto-179G29FH-458G39CIM-595G49FH-490
G10CRS-2G20VH-377G30AA-802G40Cyto-608G50Cyto-515
G = Genotype.
Table 2. Mean squares for various quantitative traits of cotton under salt stress.
Source of VariationDFSLRLFSWFRWDSWDRWChlrNa+K+Na+/K+H2O2ProlnPODCAT
Salinity21730.49 **998.7 **18.25 **3.86 **4.29 **0.18 **596.36 **34,853.9 **4387.25 **109.9 **10.8 **21.11 **275.9 **200.5 **
Genotypes4982.11 **41.74 **0.798 **0.14 **0.25 **0.007 **85.6 **3484.6 **139.97 **1.55 **1.9 **0.20 **49.11 **44.91 **
Salinity ×
Genotypes
9825.15 **8.91 **0.19 **0.047 **0.13 **0.004 *60.41 **1963.9 **921.78 **0.83 **0.5 *0.20 **23.43 **43.72 **
Error3005.437.470.0960.0450.0450.00312.53225.6101.820.060.40.0203.5618.39 **
Total449
* p < 0.05, ** p < 0.01. DF = Degree of Freedom; SL = Shoot length; RL = Root length; FSW = Fresh shoot weight; FRW = Fresh root weight; DSW = Dry shoot weight; DRW = Dry root weight; Chlr = Chlorophyll content; Na+ = Sodium ion; K+ = Potassium ion; Na+/K+ = Sodium-to-Potassium ratio; H2O2 = Hydrogen peroxide; Proln = Proline; POD = Peroxidase; CAT = Catalase.
Table 3. Maximum and minimum values and representative genotypes for the parameters of cotton grown under normal salt stress conditions.
Normal150 mM200 mM
TraitsGenotypesCodingMax. Value
Min. Value
GenotypesCodingMax. Value
Min. Value
GenotypesCodingMax. Value
Min. Value
SLCyto-515G5030.20Cyto-515G5022.33MNH-992G824.67
VH-339G2711.00Cyto-178G137.33Cyto-178G137.00
RLCyto-515G5020.63MNH-992G815.67Cyto-515G5017.00
MNH-888G289.33VH-377G206.67VH-363G215.00
FSWCyto-515G502.34Cyto-515G502.18Cyto-515G501.53
GhouriG260.48IUB-13G110.23Cyto-178G130.08
FRWCyto-515G500.93CIM-595G390.66KehkshanG310.77
MubarakG320.12FH-118G450.05AA-802G300.02
DSWCyto-608G401.05Cyto-515G500.88KehkshanG311.19
VH-339G270.70FH-114G120.23FH-114G120.04
DRWVH-330G380.22AA-802G300.17KehkshanG310.15
KZ-191G40.02KZ-191G40.01GhouriG260.00
ChlrMubarakG3247.77FH-452G240.80KehkshanG3139.10
FH-118G4521.50TarzanG915.13FH-118G4511.73
NaFH-142G3667.33FH-114G12195.33TarzanG9242.33
CIM-595G3915.00FH-172G4238.33VH-377G2045.67
KGhouriG26118.00KehkshanG3192.33FH-169G994.67
VH-228G3542.67FH-172G4220.33KZ-191G424.67
Na/KCyto-124G240.80VH-363G214.02FH-114G123.92
CIM-595G390.35KehkshanG311.13FH-142G361.16
H2O2Tipo-1G71.40CIM-595G393.83KehkshanG314.78
Bahar-2017G330.22VH-363G210.44FH-114G120.50
ProlnKZ-191G40.65FH-118G311.18AA-703G62.12
CRS-2007G140.02GhouriG260.26VH-363G210.15
PODAGC-501G4715.13Cyto-515G5018.67CIM-595G3925.50
MNH-888G283.70CRS-2G104.67Cyto-178G135.47
CATTipo-1G731.80KehkshanG3147.77CIM-595G3949.83
Bahar-2017G3315.63Cyto-178G1325.7Cyto-178G1325.53
G = Genotype; SL = Shoot length (cm); RL = Root length (cm); FSW = Fresh shoot weight (g), FRW = Fresh root weight (g); DSW = Dry shoot weight (g); DRW = Dry root weight (g); Chlr = Chlorophyll content (CCI); Na+ = Sodium ion; K+ = Potassium ion; Na+/K+ = Sodium-to-potassium ratio; H2O2 = Hydrogen peroxide (µmol g−1 FW); Proln = Proline content (µmol g−1 FW); POD = Peroxidase (U mg−1 protein); CAT = Catalase (U mg−1 protein).
Table 4. Clustering of cotton accessions based on mean values of recorded parameters under control conditions.
Cluster No.No. of GenotypesCoding
120G1, G2, G3, G4, G12, G14, G19, G20, G21, G24, G25, G28, G29, G30, G33, G35, G37, G45, G46, G47
21G32
37G10, G13, G22, G26, G36, G38, G48
414G6, G8, G9, G11, G15, G16, G23, G27, G34, G40, G41, G43, G49, G50
58G5, G7, G17, G18, G31, G39, G42, G44
Table 5. Clustering of cotton accessions based on mean values of recorded parameters under 150 mM salinity level.
Cluster No.No. of GenotypesCoding
113G3, G5, G6, G9, G12, G14, G18, G28, G32, G38, G45, G47, G48
210G2, G8, G17, G26, G31, G35, G39, G41, G44, G49
312G7, G13, G20, G21, G24, G27, G29, G33, G34, G40, G43, G46
44G4, G10, G16, G42
511G1, G11, G15, G19, G22, G23, G25, G30, G36, G37, G50
Table 6. Clustering of cotton accessions based on mean values of recorded parameters under200 mM salinity level.
Cluster No.No. of GenotypesCoding
15G3, G9, G12, G15, G48
25G1, G14, G19, G31, G50
321G6, G7, G8, G11, G17, G18, G23, G24, G26, G27, G28, G36, G37, G39, G40, G41, G43, G44, G45, G46, G49
42G4, G20
517G2, G5, G10, G13, G16, G21, G22, G25, G29, G30, G32, G33, G34, G35, G38, G42, G47
Table 7. K-means cluster analysis of 50 cotton genotypes grown under control conditions.
Cluster 1Cluster 2Cluster 3Cluster 4Cluster 5
SL19.5211.3318.1221.8821.33
RL13.2514.8315.0115.5915.61
FSW0.991.010.901.291.20
FRW0.380.120.530.530.57
DSW0.300.130.250.500.60
DRW0.070.040.110.110.09
Chlr31.2347.7731.3730.8830.54
Na+29.9836.0059.1935.7619.71
K+45.4357.0091.3865.2145.92
Na+/K+0.660.640.650.550.43
H2O20.740.910.830.850.84
Proln0.300.160.210.230.29
POD9.806.778.508.898.55
CAT20.9817.2722.9321.5022.53
SL = Shoot length (cm); RL = Root length (cm); FSW = Fresh shoot weight (g), FRW = Fresh root weight (g); DSW = Dry shoot weight (g); DRW = Dry root weight (g); Chlr = Chlorophyll content (CCI); Na+ = Sodium ion; K+ = Potassium ion; Na+/K+ = Sodium-to-potassium ratio; H2O2 = Hydrogen peroxide (µmol g-1 FW); Proln = Proline content (µmol g−1 FW); POD = Peroxidase (U mg−1 protein); CAT = Catalase (U mg−1 protein).
Table 8. K-means cluster analysis of 50 genotypes grown under 150 mM salinity level.
Cluster 1Cluster 2Cluster 3Cluster 4Cluster 5
SL16.6918.6815.5417.0318.00
RL10.6412.5411.4111.7911.32
FSW0.620.900.680.650.80
FRW0.180.330.190.180.25
DSW0.130.170.120.090.15
DRW0.040.050.040.050.06
Chlr31.1735.4132.2432.5933.04
Na+148.82106.7380.9253.33102.52
K+67.3181.8734.6426.0853.12
Na+/K+2.331.322.512.152.04
H2O20.781.610.921.031.02
Proln0.620.590.500.440.56
POD11.9913.9612.2611.6612.56
CAT38.4542.4537.6441.5740.66
SL = Shoot length (cm); RL = Root length (cm); FSW = Fresh shoot weight (g), FRW = Fresh root weight (g); DSW = Dry shoot weight (g); DRW = Dry root weight (g); Chlr = Chlorophyll content (CCI); Na+ = Sodium ion; K+ = Potassium ion; Na+/K+ = Sodium-to-potassium ratio; H2O2 = Hydrogen peroxide (µmol g−1 FW); Proln = Proline content (µmol g−1 FW); POD = Peroxidase (U mg−1 protein); CAT = Catalase (U mg−1 protein).
Table 9. K-means cluster analysis of 50 genotypes grown under 200 mM salinity level.
Cluster 1Cluster 2Cluster 3Cluster 4Cluster 5
SL11.5516.0213.7913.2512.52
RL7.4911.239.939.508.88
FSW0.350.640.400.370.33
FRW0.110.320.170.130.13
DSW0.030.290.060.050.04
DRW0.020.050.020.030.02
Chlr28.3633.2628.2129.6828.42
Na+202.8786.53112.1047.83140.29
K+67.6050.4081.6227.8355.55
Na+/K+3.131.921.391.742.60
H2O21.142.121.331.181.20
Proln0.721.061.101.000.96
POD16.0419.4518.1817.3316.85
CAT43.7144.3143.7645.4241.17
SL = Shoot length (cm); RL = Root length (cm); FSW = Fresh shoot weight (g), FRW = Fresh root weight (g); DSW = Dry shoot weight (g); DRW = Dry root weight (g); Chlr = Chlorophyll content (CCI); Na+ = Sodium ion; K+ = Potassium ion; Na+/K+ = Sodium-to-potassium ratio; H2O2 = Hydrogen peroxide (µmol g−1 FW); Proln = Proline content (µmol g−1 FW); POD = Peroxidase (U mg−1 protein); CAT = Catalase (U mg−1 protein).
Disclaimer/Publisher’s Note: The statements, opinions and data contained in all publications are solely those of the individual author(s) and contributor(s) and not of MDPI and/or the editor(s). MDPI and/or the editor(s) disclaim responsibility for any injury to people or property resulting from any ideas, methods, instructions or products referred to in the content.

