Article

Effect of Plastic Film Colours and Perforations on Energy Distribution, Soil Temperature, and Evaporation

1
College of Water Resources and Civil Engineering, China Agricultural University, Beijing 100083, China
2
National Field Scientific Observation and Research Station on Efficient Water Use of Oasis Agriculture, Wuwei 733000, China
3
Department of Soil and Water Sciences, The Robert H. Smith Faculty of Agriculture, Food and Environment, The Hebrew University of Jerusalem, Rehovot P.O. Box 12, Israel
4
Department of Civil and Environmental Engineering, The University of Tennessee, Knoxville, TN 37996, USA
*
Author to whom correspondence should be addressed.
Agronomy 2023, 13(3), 926; https://doi.org/10.3390/agronomy13030926
Submission received: 28 February 2023 / Revised: 16 March 2023 / Accepted: 18 March 2023 / Published: 21 March 2023

Abstract

:
Plastic film mulching is a commonly used agricultural measure in arid/cold regions to improve crop growth. Despite previous studies on the impact of film mulching on soil water/heat status and crop growth, it is not clear how plastic film colours and perforations affect energy distribution, soil temperature, and evaporation. Six sets of column experiments were performed with three plastic film colours: transparent (T), black (B), and silver-grey (G), and two perforation ratios: 4.49% and 21.44%, to monitor soil evaporation and soil/film mulching temperature. Using these two main control factors, a soil–mulch–atmosphere system (SMAS) model was established to simulate soil evaporation and energy distribution. The simulations of soil evaporation compared well with the measurements. The available net energy was positively related to the perforation ratio and transmittance of the plastic film, which further influenced soil temperature and altered energy distribution. Both simulated and measured results gave the following order for transpiration with the plastic films: T > B > G. The SMAS model was more accurate when a mulch with weak light transmittance covered the field. Moreover, by comparing simulated evaporation mass loss with and without considering heat conduction between the plastic mulch and the soil surface, C s m , we found that it is feasible to exclude C s m . However, C s m is indispensable in the SMAS model for understanding the mechanism of plastic film mulching in agroecosystems, particularly at night.

1. Introduction

Soil-water evaporation is a fundamental component in farmland ecosystems’ water balance. It controls the microclimate in the canopy by influencing energy distribution between the soil surface and adjacent atmosphere, and it is widely considered to be non-beneficial water loss. This water loss may be particularly crucial in arid regions [1,2,3], where water scarcity is the major constraint to socioeconomic development [4].
Plastic film mulching is commonly used due to its beneficial effects on soil evaporation, weed suppression, and yield increases in maize, vegetables, and other crops [5,6,7]. Research has found that plastic mulch hinders water vapor transfer between the soil surface and the atmosphere [8]. Studies of surface energy distribution for plastic mulch using the energy balance for the different components—net radiation (Rn), sensible heat (H), and latent heat (λE)—concluded that plastic mulch changes the available energy and energy distribution, particularly when the leaf area index is lower than 1.0 [9]. Both heat flux from the soil surface layer (0 to 5 cm) and sensible heat increase with soil temperature. The surface soil heat flux should not be neglected when the surface energy balance is evaluated, regardless of whether transparent or black plastic mulch is used [8,9].
In practice, plastic films of different colours with different perforation ratios are used for various purposes [10]. Perforation may be intentional, such as film perforation upon seedling emergence, or unintentional, such as by natural degradation of the film. Assessment of the effects of plastic film colour and perforation on evaporation and energy distribution is more complex [11,12]. Chen et al. (2017) found that the film temperature decreases by 6–13 °C at 14:00 daily when a perforated white film is used compared to a non-perforated white film [12]. A linear relationship between cumulative evaporation and the square root of time for different perforation ratios was found for perforated plastic mulches by Li et al. (2003) [11]. These studies indicated that the influence of perforation on soil temperature and evaporation should not be neglected. While film perforation influences soil temperature and evaporation, film colours can influence evaporation, soil temperature, and surface energy distribution due to reflection, transmission, and absorption [9,13]. Transparent and black plastic films are the two most widely used materials in mulching. Previous research has shown that transparent film mulches can effectively reduce soil evaporation, and increase soil surface temperature, water-use efficiency of some crops, and grain yield [7,14,15]. The transparent plastic mulch increases the surface albedo, which modifies the energy exchange between the soil, mulch, and atmosphere [16]. Ai et al. (2018) concluded that plastic mulch increases surface albedo and decreases net radiation [9]. Zhang et al. (2017) reported that transparent plastic film mulching significantly decreases Rn in the early stage and slightly increases Rn in the later stages [17]. Monitoring the energy balance for strips of black plastic film mulching, Tarara (1999) found that the strips of black plastic mulch provided numerous sources of sensible heat compared to the bare soil between the film strips [8]. Tuovinen et al. (2006) and Kasperbauer (2000) found that black polyethylene mulch reduces soil temperature and enhances strawberry and potato yield compared to non-mulched controls [13,18].
Several shoot and root crop plants, such as strawberry and potato, benefit from the reflected wavelength combinations in the visible and far-red parts of the electromagnetic spectrum of some coloured film mulching [13,19]. Strawberry fruit size was found to be larger under new red plastic mulch because the reflected far-red and red light are the main factors affecting the phytochrome-mediated allocation of photosynthate [13]. These laboratory and field studies concentrated either on the colour and arrangement of film mulching or on the comprehensive influence of film perforation. The effect of film colour on soil energy distribution and evaporation has seldom been monitored or discussed in detail.
Most current crop models barely simulate the water and heat dynamics for the plastic films used in agricultural systems, and only a particular part of the evaporation decrease is assumed [20,21,22]. For example, Liu et al. (2013), Han et al. (2015), and Li et al. (2015) utilised HYDRUS-2D to simulate a mulched field [23,24,25]. Whereas Han et al. (2015) and Li et al. (2015) set a no-flux boundary for the upper domain [24,25], Liu et al. (2013) added a partition coefficient of 0.07 to simulate a drip-irrigated cotton field under plastic mulch [23]. Tan et al. (2018) and Adeboye (2019) adjusted parameters for crop development, crop production, and water/salinity stress in the AquaCrop model to simulate soil evaporation in a mulched field with no explanation of their rationale [26,27]. Ran et al. (2017) described soil evaporation under plastic film mulch using a semi-empirical-based fraction of the mulch, f r m u l c h , and an adjustment factor, f m , introduced into the AquaCrop and SIMDualKc models [28]. As film mulching affects the soil temperature, the energy balance feeds back to water transfer, particularly under coloured films. A comprehensive modelling approach is needed to demonstrate the interactions between energy distribution and water/heat transfer under different film colours and mulching conditions.
In this study, we investigated the impact of plastic film colour and perforation ratio on soil evaporation and energy distribution using soil column experiments. In addition, a soil–mulch–atmosphere system (SMAS) model was established to quantify soil evaporation and energy distribution under various plastic film mulch conditions.

2. Materials and Methods

2.1. Study Site

Soil column experiments were conducted in May 2017 at the National Field Scientific Observation and Research Station on Efficient Water Use of Oasis Agriculture in Wuwei of Gansu Province, north-western China (37°52′ N, 102°52′ E, elevation of 1581 m). The climate is cold temperate continental, with an average annual rainfall of 164 mm and potential annual evaporation of 2400 mm. The winter is long, and the summer is characterised by long hours of sunshine and a significant temperature difference between day and night. The temperature rises quickly in the spring and drops rapidly in autumn. The average annual temperature is 8 °C, with more than 3000 h of sunshine and 14.78 MJ m−2 of solar radiation. The average groundwater depth in the region is ~30–50 m below the soil surface [29].

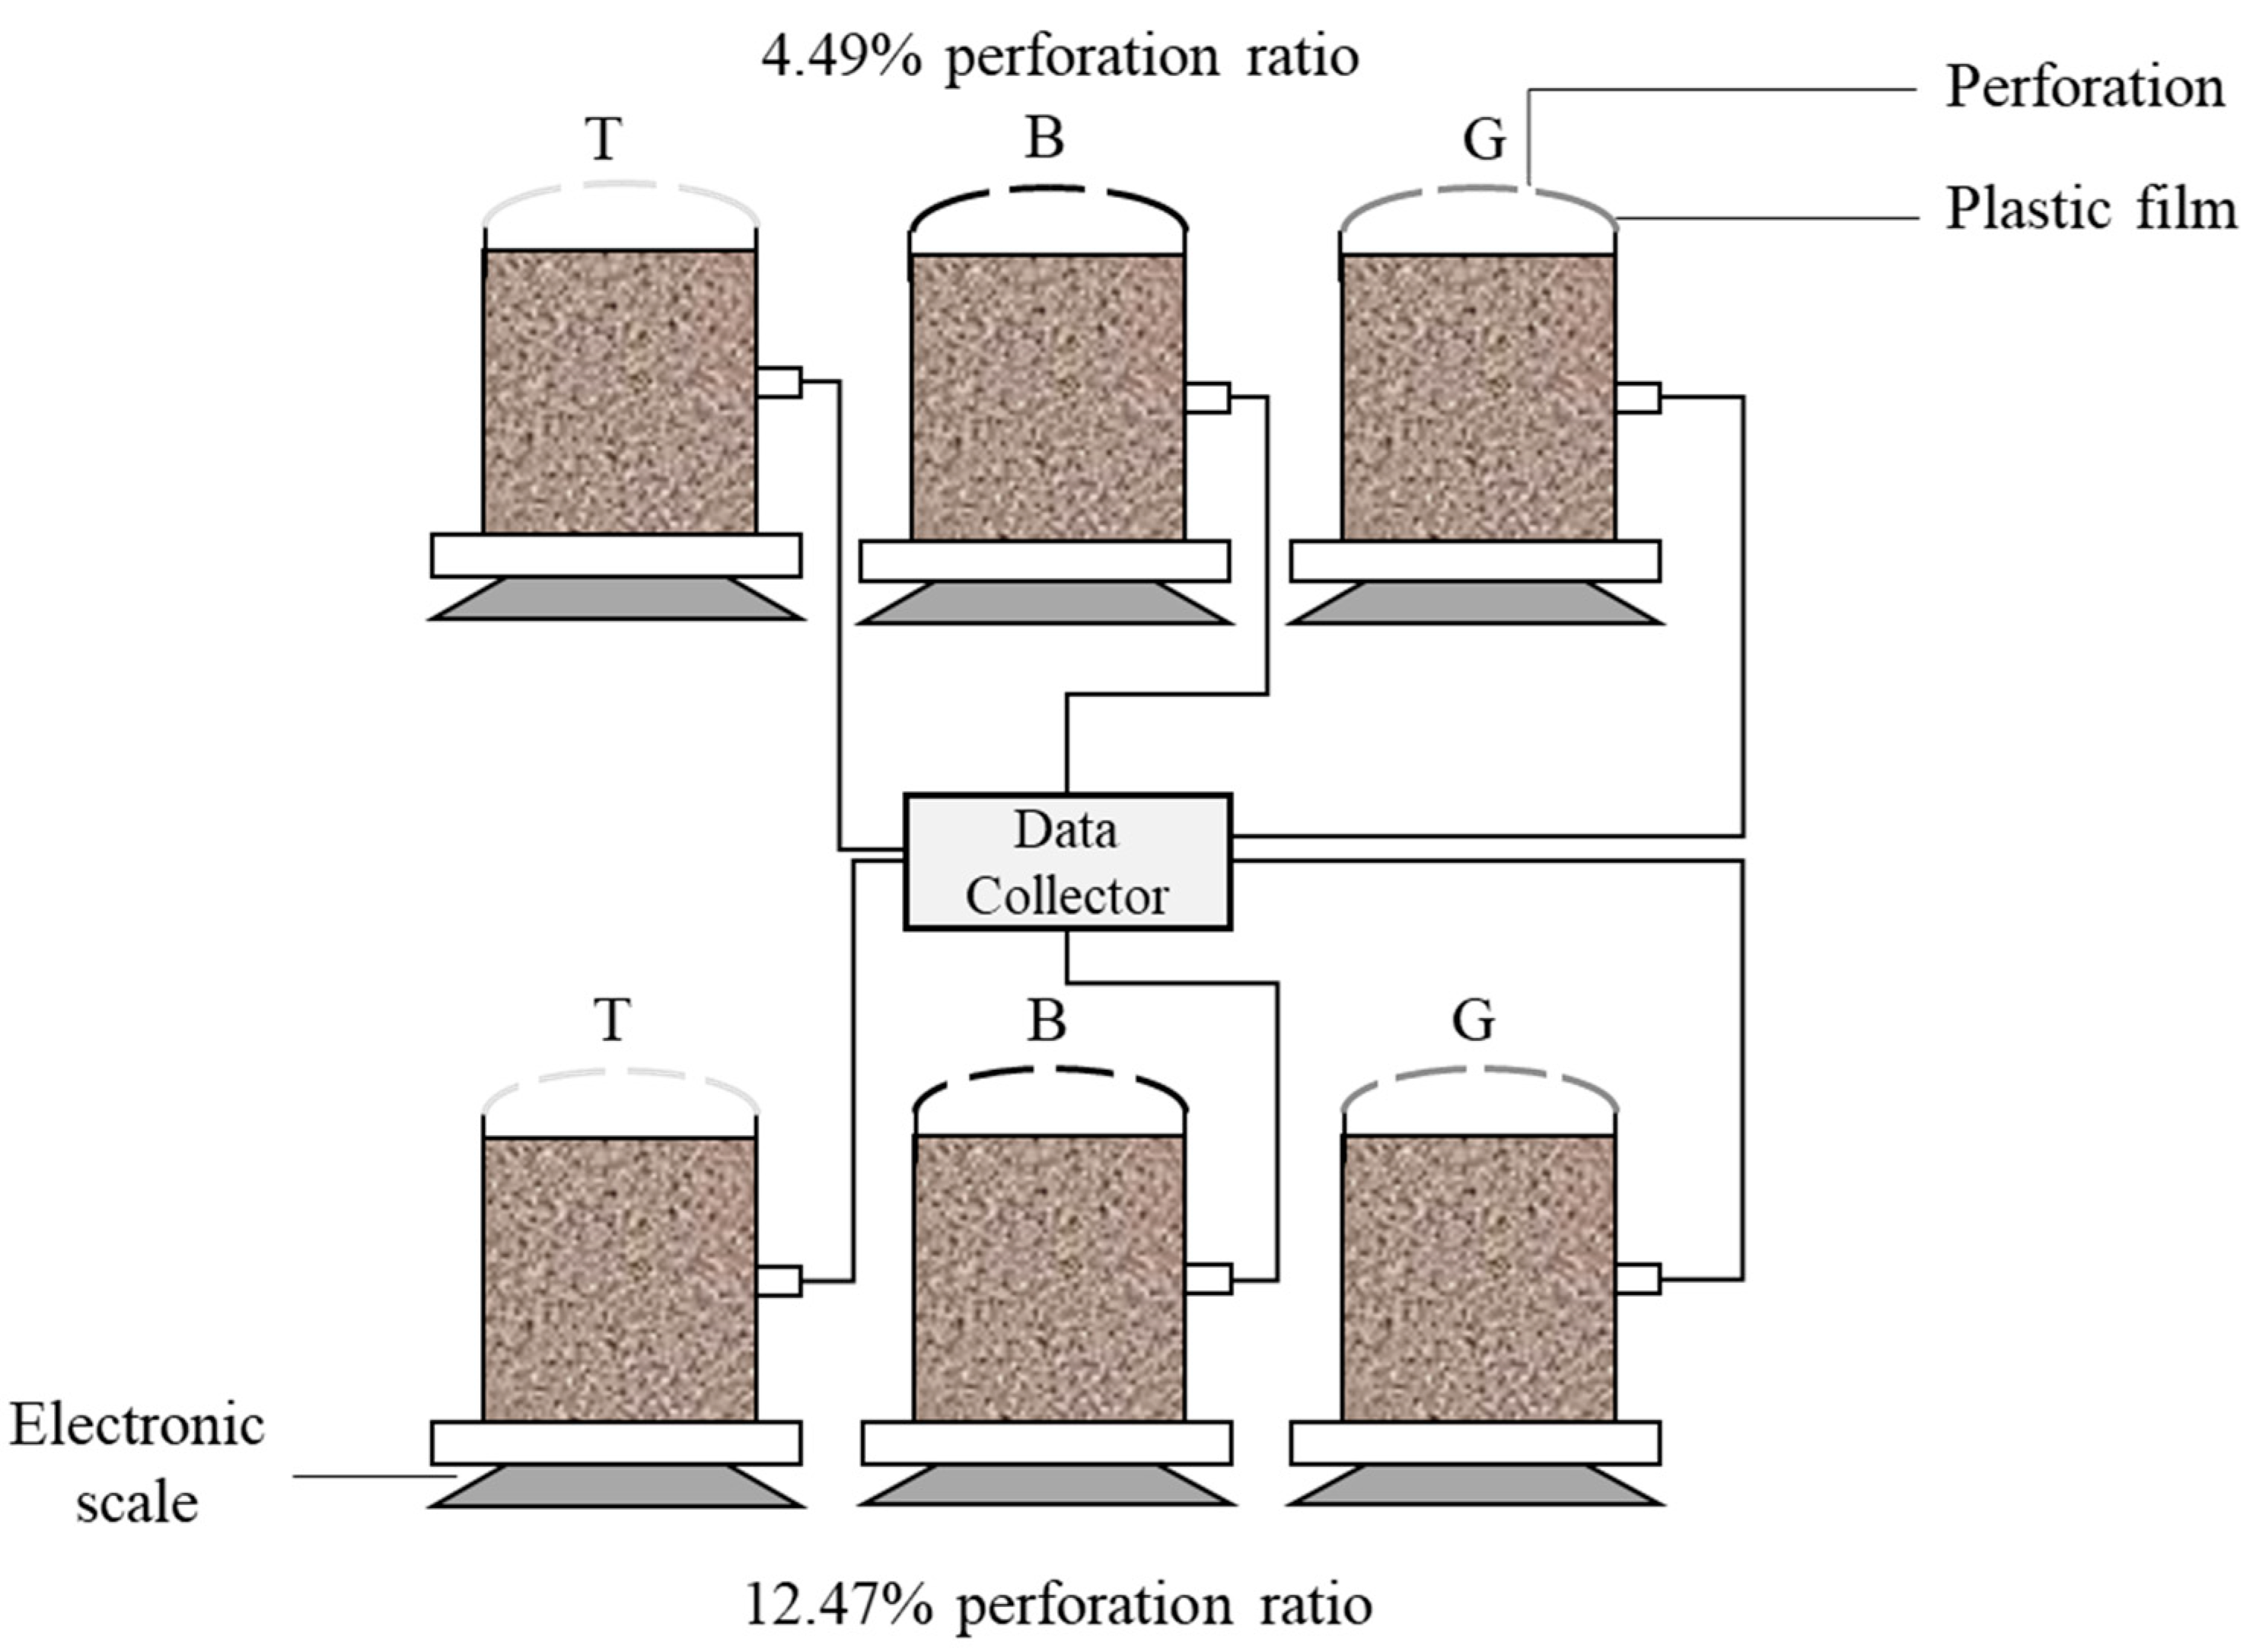
2.2. Column Experiment Design

Soil column experiments were used to determine soil evaporation and energy distribution under plastic film mulching with six treatments that included two substantial variables—film colour and film perforation ratio. The plastic films were transparent (T), black (B), or silver-grey (G) with two perforation ratios: 4.49% (1) or 12.47% (2). The plastic films were made of polyethylene (PE). The space between the plastic film and soil surface affects evaporation and energy distribution [30]; increasing it reduces the energy loss by heat conduction and convection. This effect was not tested in the current study, and a 30 mm space was maintained for all six treatments.
The soil used for the column experiments was taken from 20–40 cm below the soil surface to avoid film mulching residue, gravel, straw, and fertiliser. Its texture is given in Table 1. The soil was packed in transparent acrylic columns, which were 28 cm long with an internal diameter of 19 cm, at 5 cm increments. A perforated acrylic plate was placed 5 cm above the column bottom with a piece of gauze on it. Each column was filled to a height of 20 cm with bulk density of 1.55 g cm−3. The column was gradually saturated from the bottom to displace air. The plastic films were placed at the outer part of the column inlet. After packing, all the columns were placed on a 10 m×10 m plot of vacant farmland without any plants. Solar radiation was used as the energy source. Schematic diagram of the column experimental setup is shown in Figure 1.

2.3. Data Acquisition

Meteorological data (precipitation, solar radiation, relative humidity, wind speed, and air temperature) were measured using a standard automatic weather station (HOBO H21-001, Onset Computer Corp., Cape Cod, MA, USA). The sensors were located 2 m above the ground surface. To avoid precipitation interference, a big umbrella was used to protect the soil columns from wetting during rain events. The consequent reduction in solar radiation was negligible due to the lack of solar radiation during the rain event. The rainfall period, amounting to several hours, was short compared to the entire experimental period.
The variations in volumetric soil water content (cm3 cm−3) and soil temperature (°C) during the experimental period were measured by soil sensors (5TE, Decagon, Pullman, WA, USA) installed 10 cm below the soil surface. Evaporation (mm) was determined for each soil column by weighing it using a high-precision (0.1 g, equivalent to 3.53 × 10⁻³ mm) electronic scale (2002E/02, Mettler Toledo, Switzerland). Columns were weighed daily at 6:00, 10:00, 13:30, and 20:00.

3. The SMAS Model

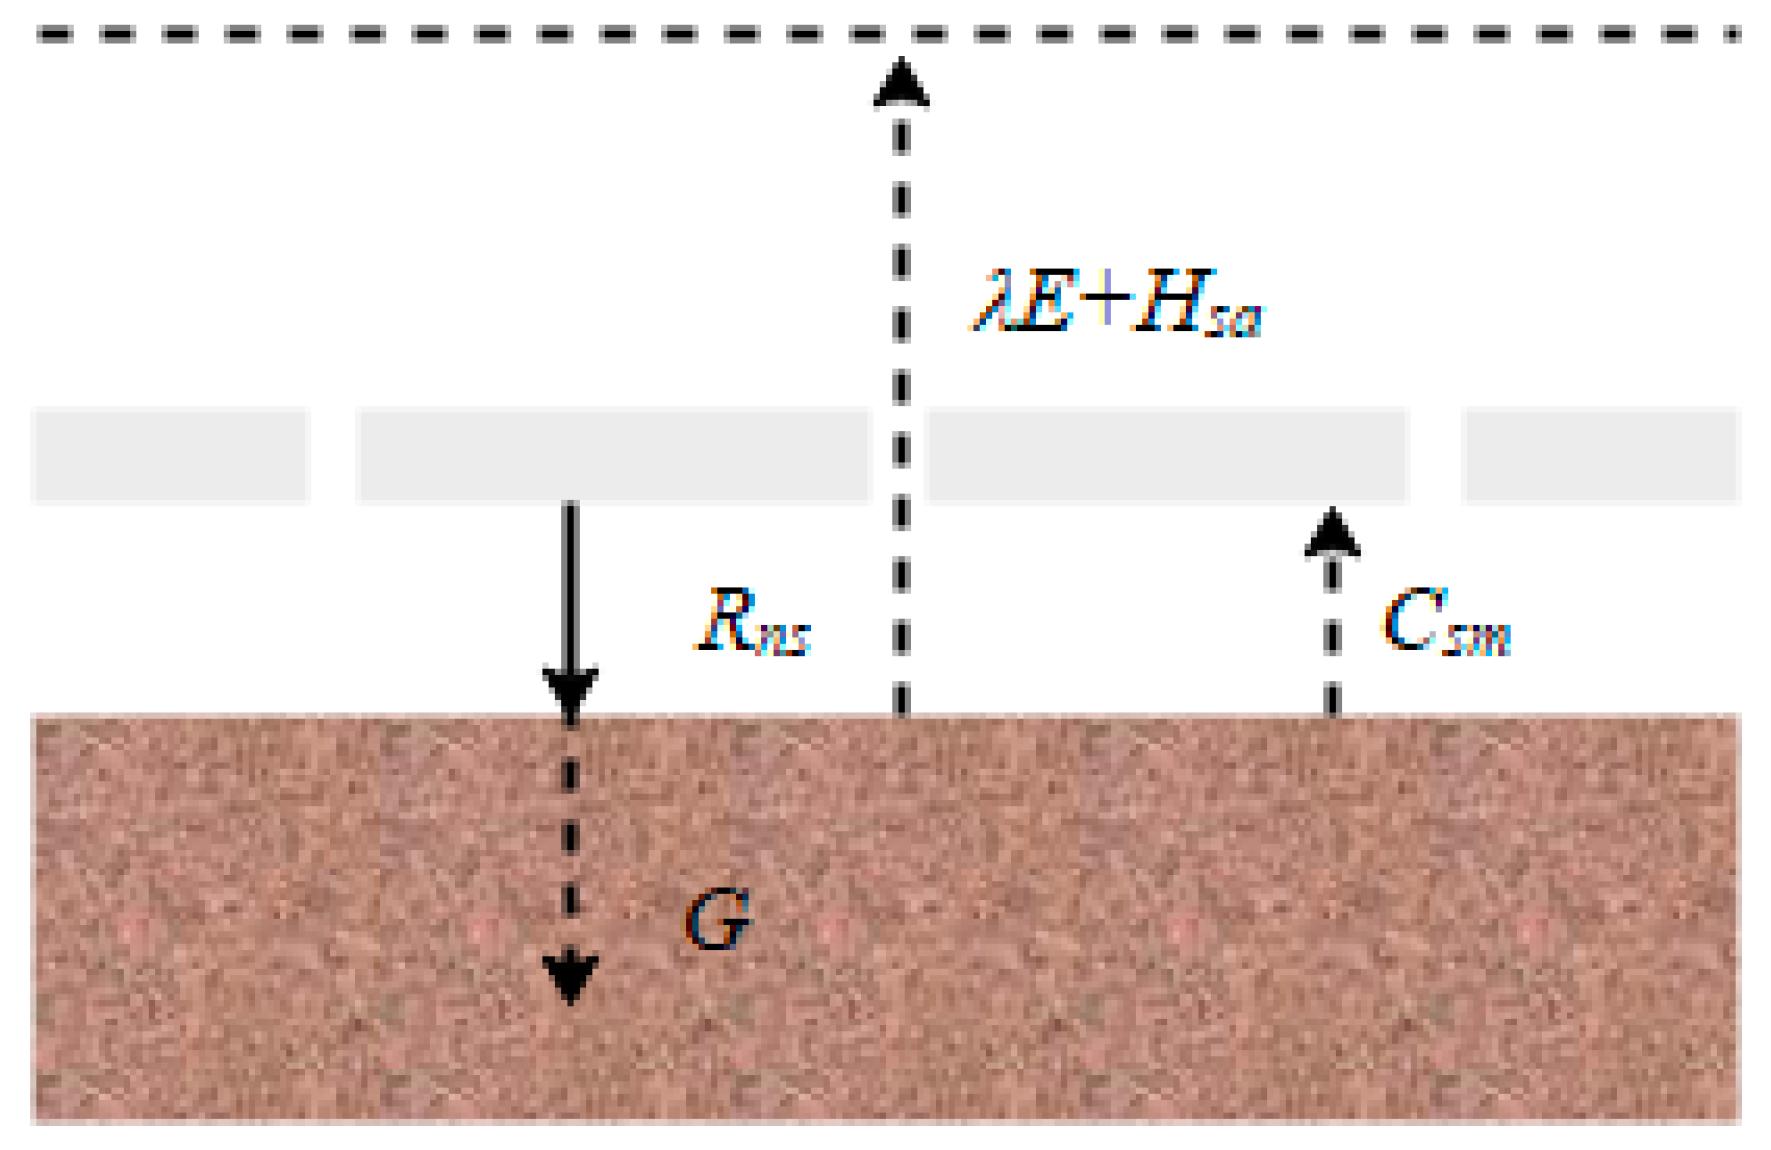
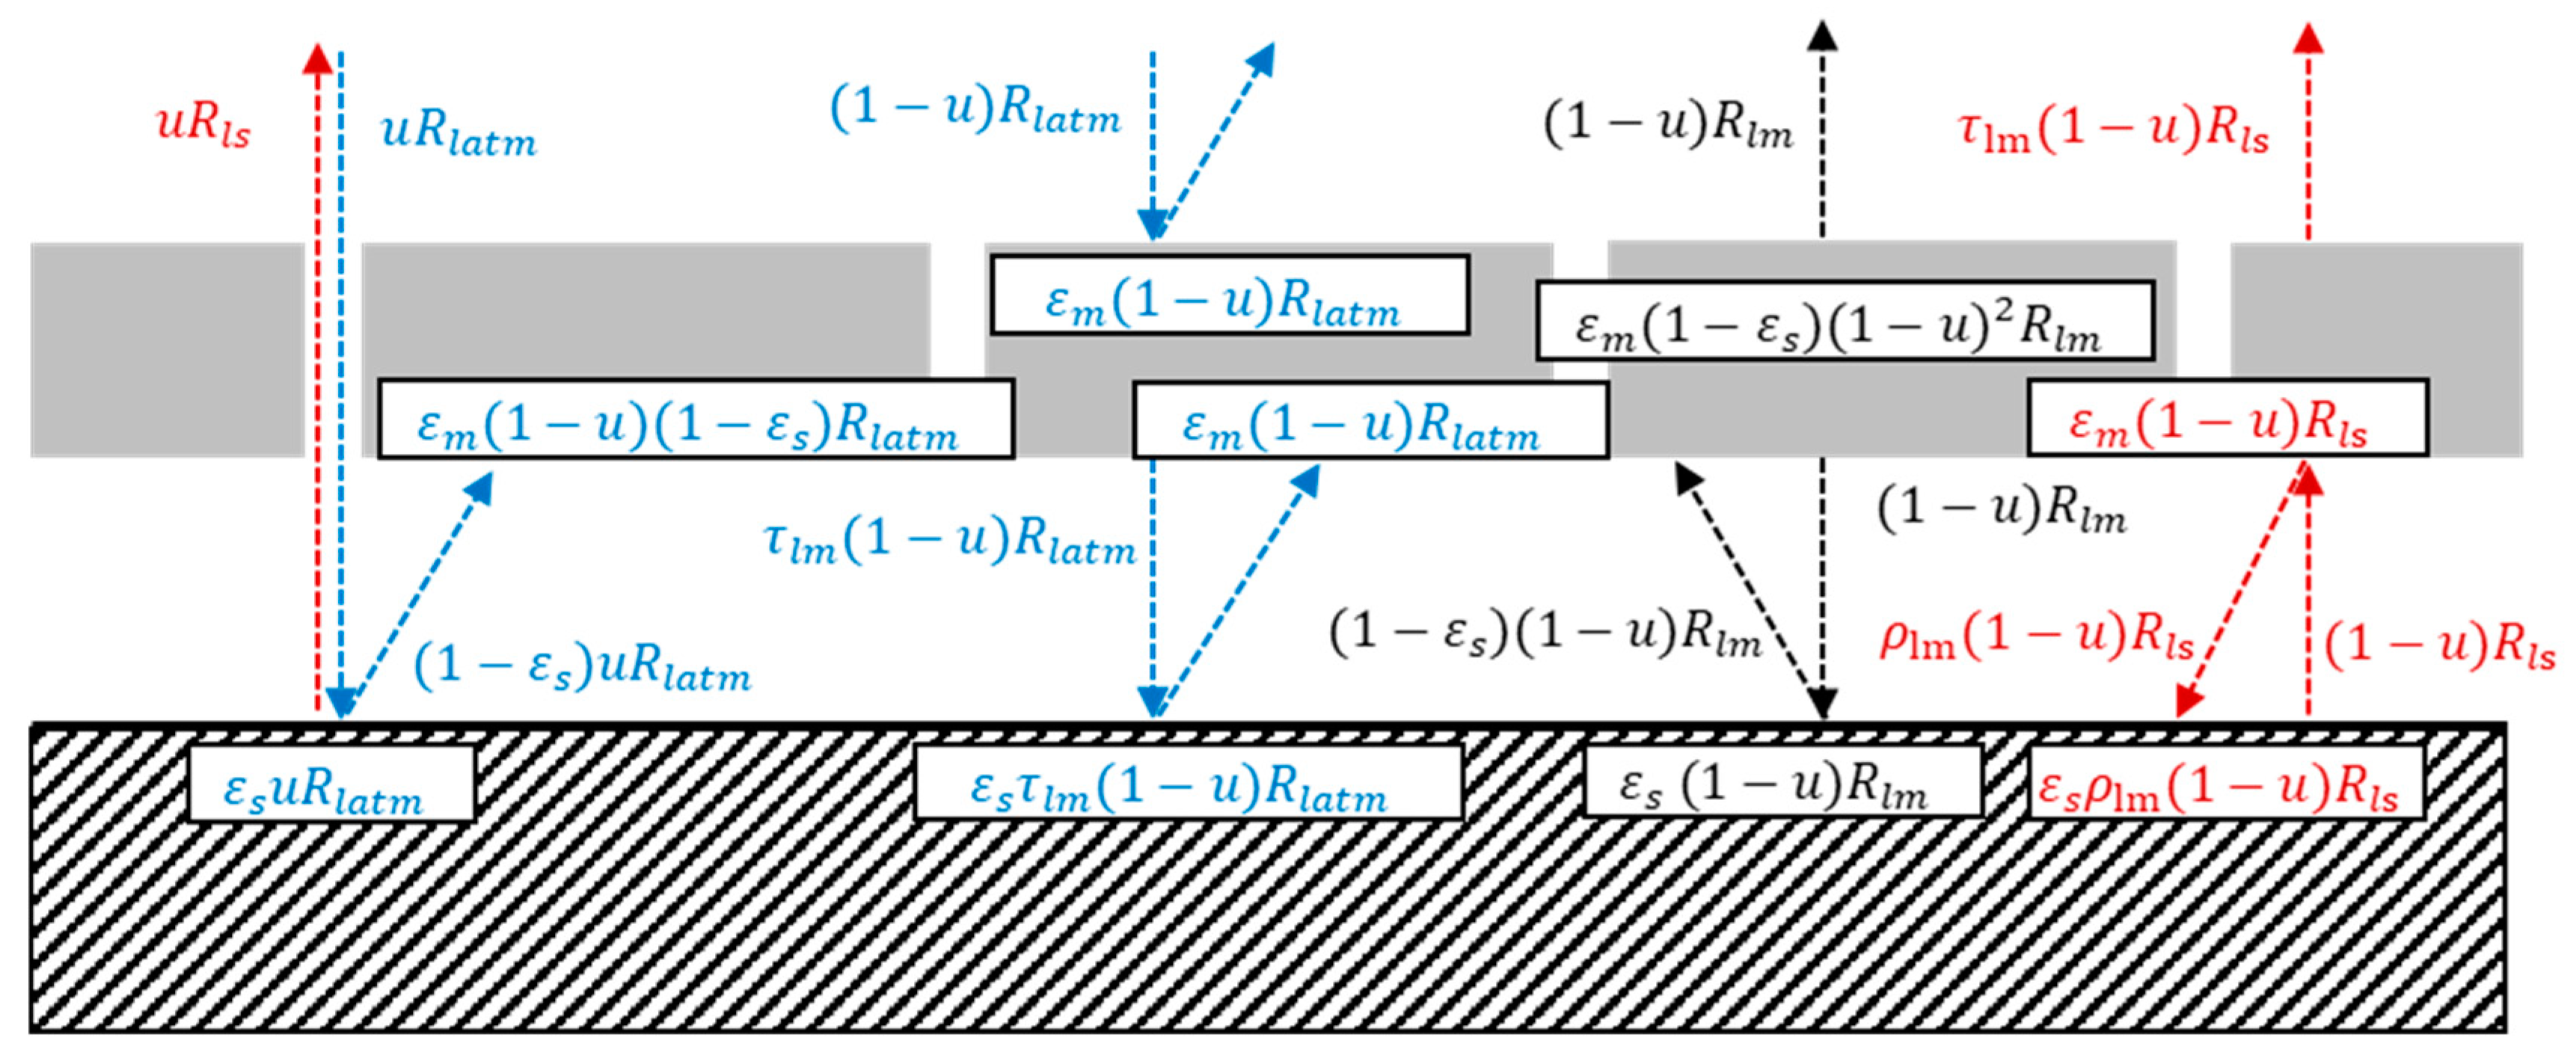
3.1. Model Establishment

The SMAS model considered the different plastic film colours and perforation ratios, with the following assumptions: the perforation holes in the plastic film are of similar size and are uniformly distributed; the gap between the film and the soil surface is constant, despite the micro variations in the soil surface formed during soil wetting; soil evaporation is driven by radiant energy; the heat variation due to phase changes (evaporation and condensation) within the gap between the plastic film and the soil surface is ignored; lateral heat transfer within the cylindrical soil columns is ignored. All of the parameters in the SMAS model are listed in Table 2.
The soil–film continuum consisted of three layers bounded by the atmosphere (at the reference height of 2 m), the plastic film, and the soil surface (Figure 2). For the unperforated parts, the solar radiation reached the soil surface through transmission, reflection, and absorption, and by direct radiation through the perforated parts in the plastic film (Figure 3).
The energy balance for the soil–plastic film–atmosphere continuum is:
R n s + λ E + H s a + C s m + G = 0
where R n s (W m−2) is the net radiation at the soil surface; λ E (W m−2) is the latent heat flux between the soil surface and atmosphere with λ , the vaporisation latent heat equal to 2.45 MJ kg−1; H s a is the air sensible heat flux between the soil surface and the atmosphere; C s m (W m−2) is the heat conduction between the plastic film and the soil surface; and G (W m−2) is the heat flux downward through the soil surface.
The net radiation at the soil surface is:
R n s = R s s + R l s
where R s s and R l s are the shortwave and longwave radiation, respectively, at the soil surface. A schematic diagram of the shortwave radiation transmission, reflection, and absorption at the plastic and soil surface boundaries is presented in Figure 3. Based on Figure 3, the shortwave radiation at the soil surface can be expressed as:
R s s = 1 ρ s s u R s + 1 ρ s s τ s m 1 u R s
The longwave radiation, R l , is emitted by the soil, plastic film, and atmosphere. The relationship between Rl and an object’s temperature T0 (°C) is [33]:
R l = ε 0 σ T 0 4
where ε 0 is emissivity, and σ is the Stefan–Boltzmann constant.
In the SMAS system, longwave radiation emitted by the atmosphere, plastic film, and soil is demonstrated in Figure 4. R l a t m in Figure 4 is the longwave radiation emitted by the atmosphere, expressed as R l a t m = ε a t m σ T a t m 4 , where ε a t m and T a t m (°C) are the atmospheric emissivity and temperature, respectively. R l m is the longwave radiation emitted by the plastic film, expressed as R l m = ε m σ T m 4 , where ε m is the plastic film emissivity and T m (°C) is the plastic film temperature. R l s is the longwave radiation emitted by the soil, expressed as R l s = ε s σ T s 4 , where ε s is soil emissivity and T s (°C) the soil surface temperature. Based on Figure 4, the longwave radiation at the soil surface can be expressed as:
R l s = ε s u R l a t m + ε s τ l m 1 u R l a t m + ε s 1 u R l m + ε s ρ l m 1 u R l s
H s a was assumed to be proportional to λ E with a proportionality factor β :
H s a = β λ E
The one-dimensional heat-conduction equation determines soil heat conduction (G in Equation (1)):
G = K θ T l T s / z
where K θ is soil thermal conductivity and can be calculated empirically [34]:
K θ = b 1 + b 2 θ + b 3 θ 0.5
where b 1 , b 2 , and b 3 are constants.
C s m in Equation (1) is calculated by Equation (9) [33]:
C s m = T s T m / r c
where r c (m2 °C W−1) is the thermal resistance between the film mulching and the soil surface, and r c is related to the thickness of the gap between the mulch and the ground surface and is expressed as [33]:
r c = d / k a N u d
The SMAS model was obtained by combining Equations (2), (6), (7) and (9) with Equation (1). The evaporation rate (E; m s−1) is the only unknown variable to be evaluated. The time step for the SMAS model simulations, conducted between 25 May 2017 at 6:00 and 30 May 2017 at 4:00, was set to 2 h.
The simulation results were compared to the measured values. The value of the calibrated parameters was selected using the smallest error between the simulated and measured values, where treatments T1, B1, and G1 were used for the calibration, and the other three treatments, T2, B2, and G2, were used for the validation. The meteorological data were similar for the experimental period. Note that the soil water content, soil surface and plastic film temperatures, and the perforation ratio introduced into the model were measured independently for the different treatments.

3.2. SMAS Model Simulations

The SMAS model simulations were evaluated by comparing the measured and simulated values using different measures: root mean square error (RMSE), mean relative error (MRE), index of agreement (IA), and coefficient of determination (R2). These measures are defined, respectively, as:
R M S E = ( i = 1 n S i M i 2 ) / n
M R E = ( i = 1 n S i M i / M i ) / n × 100 %
I A = 1 i = 1 n S i M i / i = 1 n ( S i M + M i M ) 2
R 2 = i = 1 n M i M ( S i S ) 2 / i = 1 n M i M 2 i = 1 n S i S 2
where S i and M i (i = 1, 2, …, n) are the simulated and measured values, respectively, n is the number of observations, and S and M are the average of the simulated and measured values, respectively. The above indexes represent the average degree of absolute error, deviation, and coincidence degree, respectively, between the simulated and measured values [35].

4. Results and Discussion

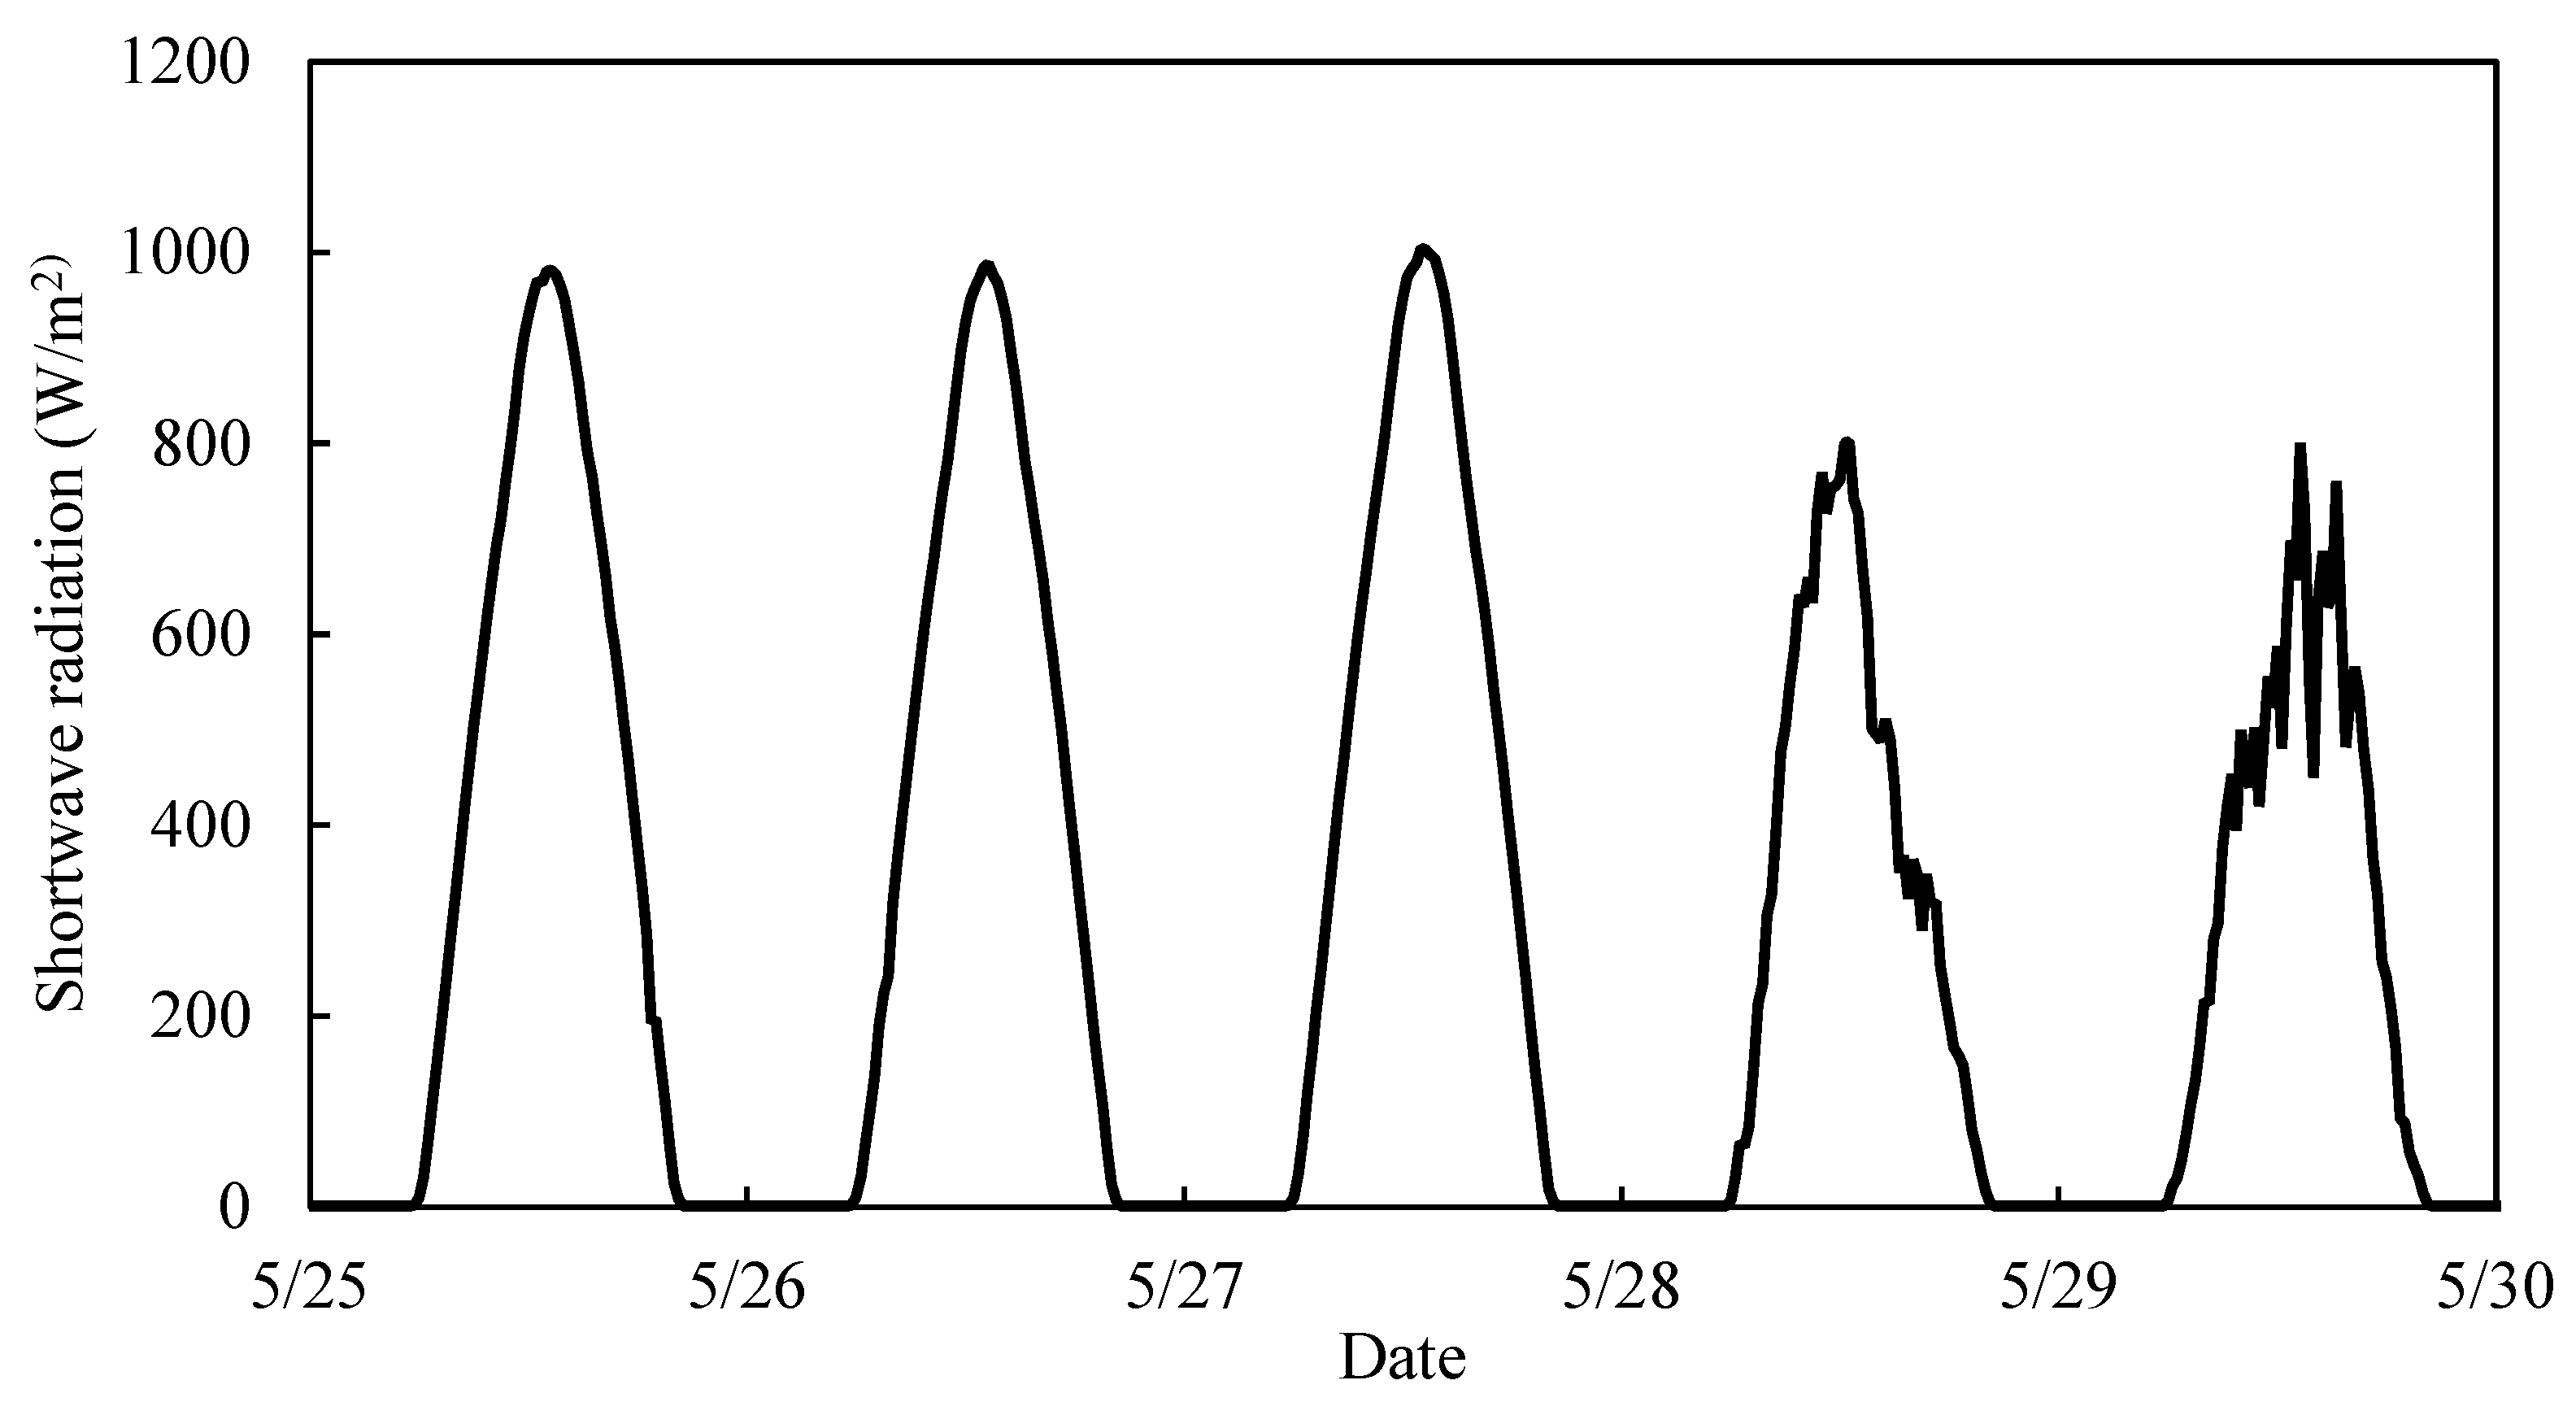
4.1. Shortwave Radiation

The measured shortwave radiation during the experimental period is depicted in Figure 5. It consisted of a single daily peak of 981.9, 988.1, 1004.4 801.9, and 800.6 W m−2 at 13:45 on May 25, 26, 27, 28, and 29, respectively, and decreased to 0.6 W m−2 from 20:45 h to 5:45.

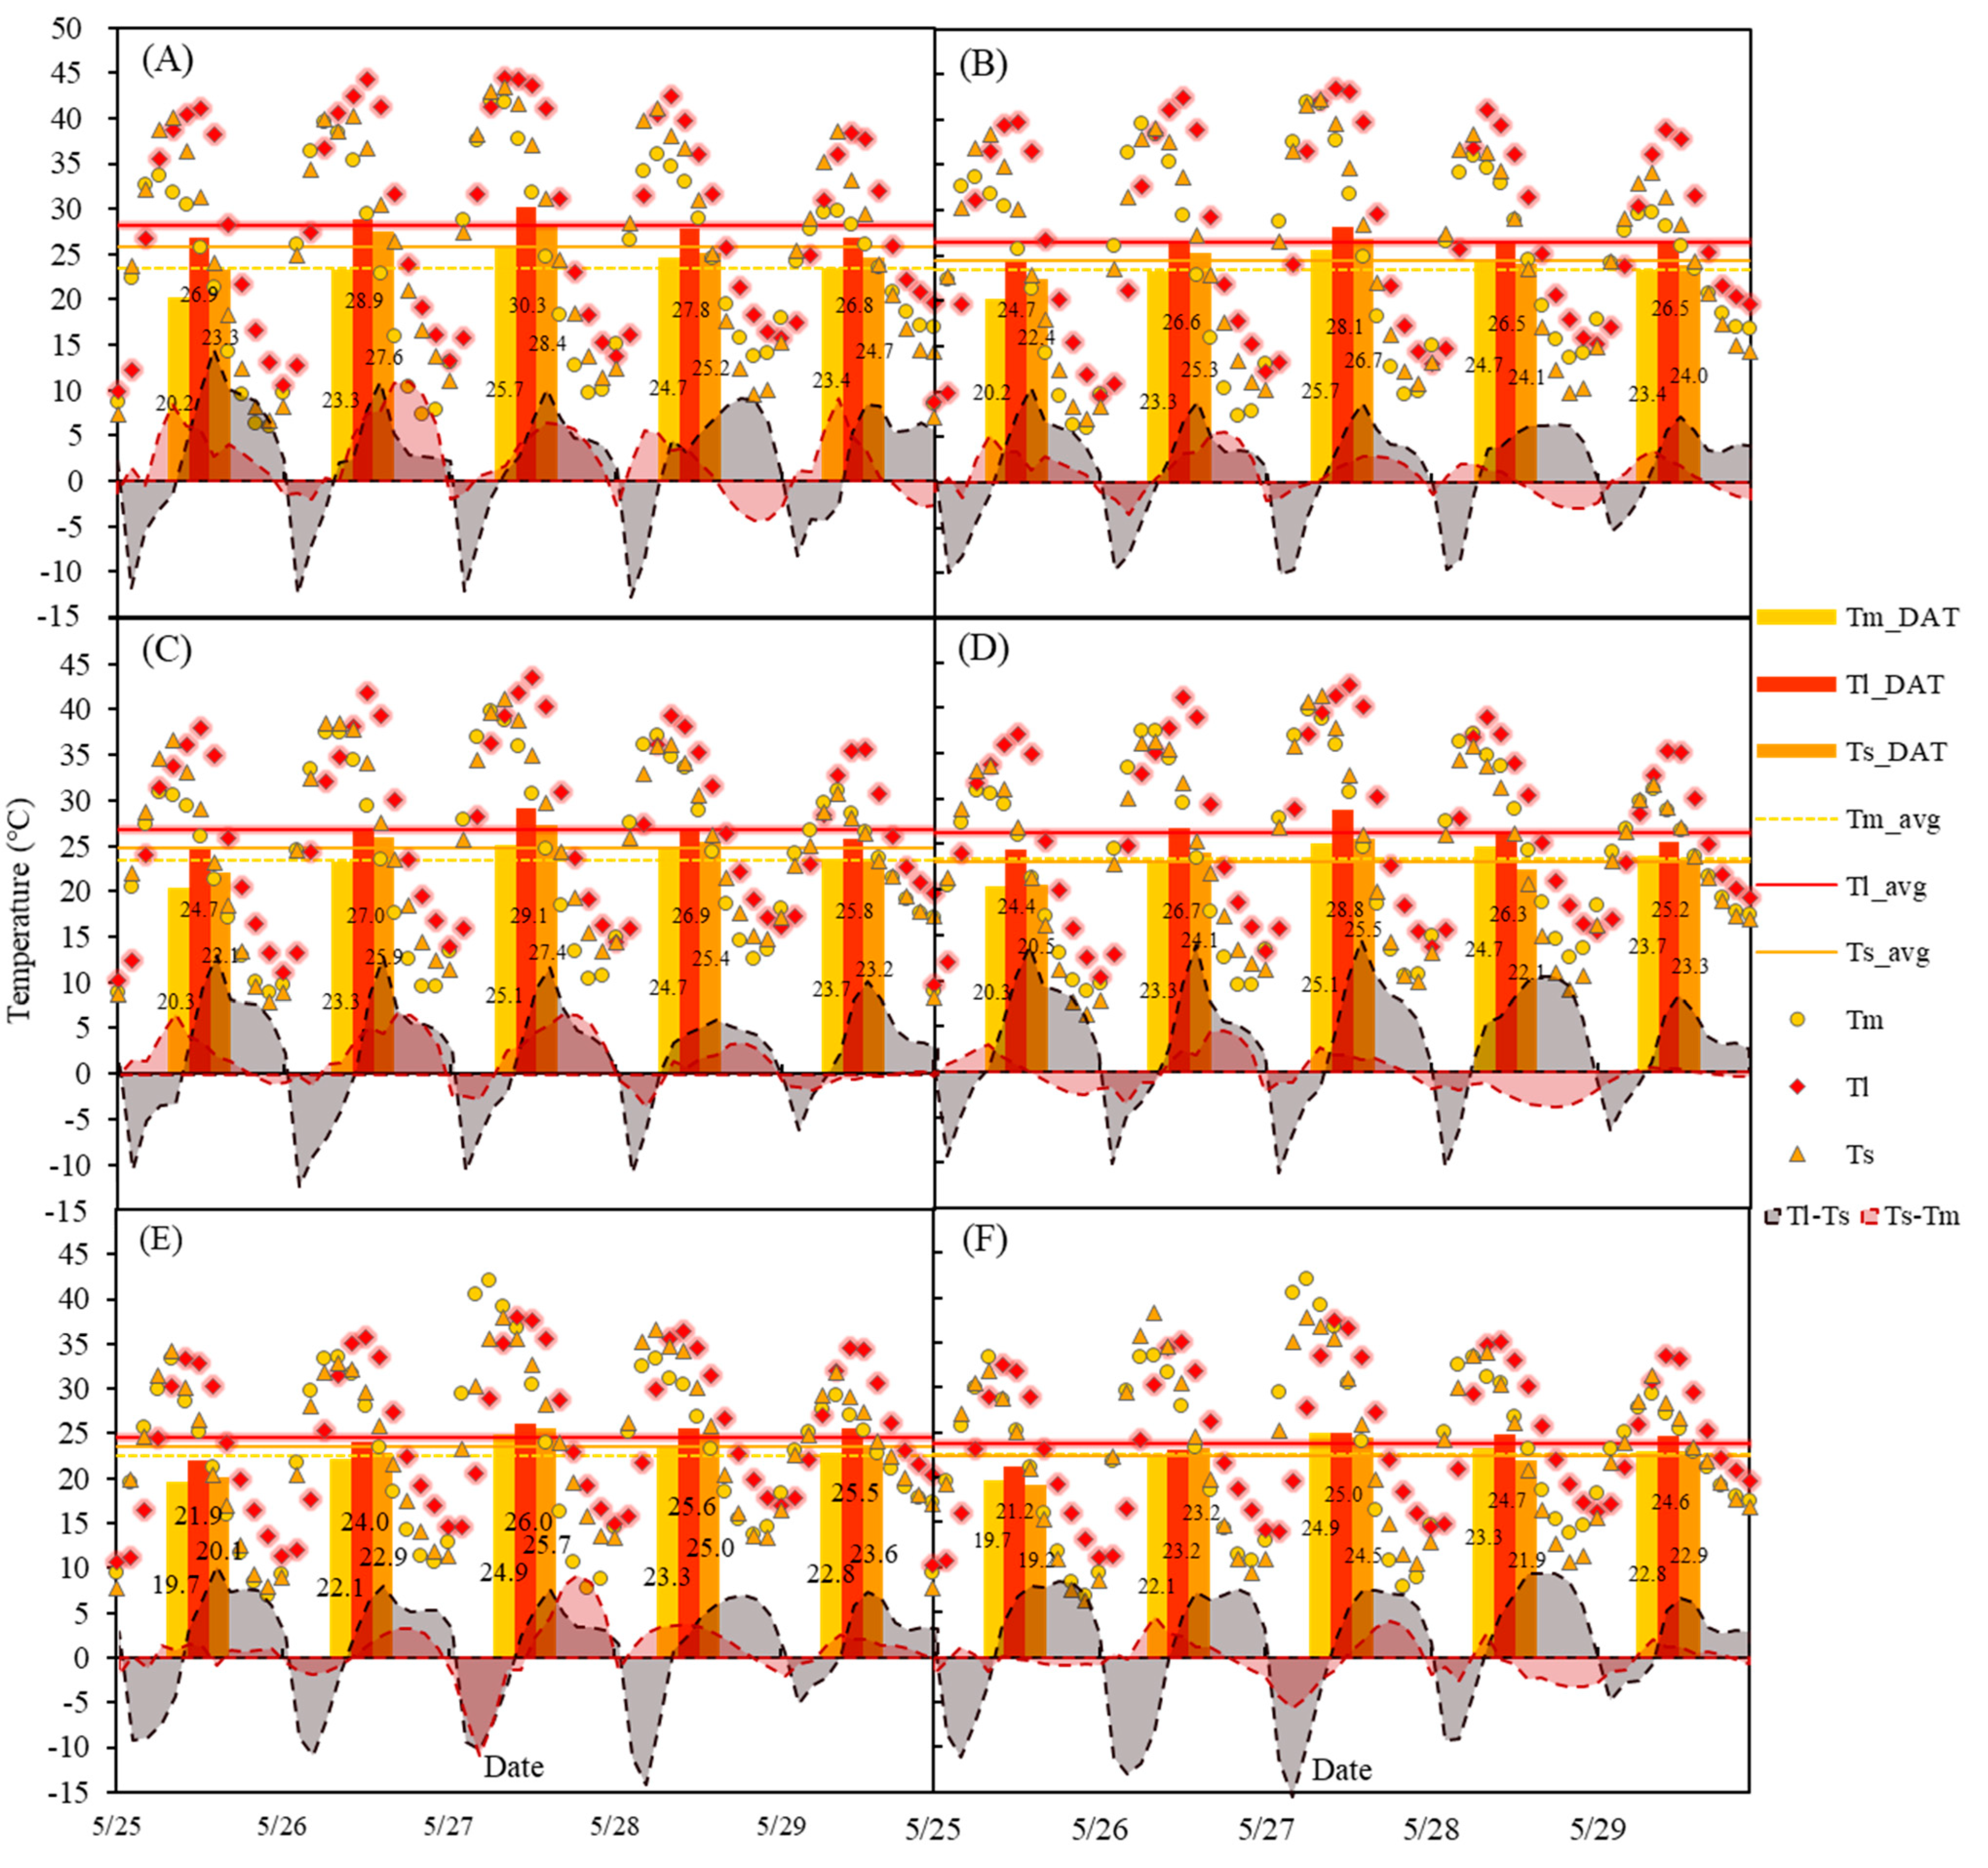
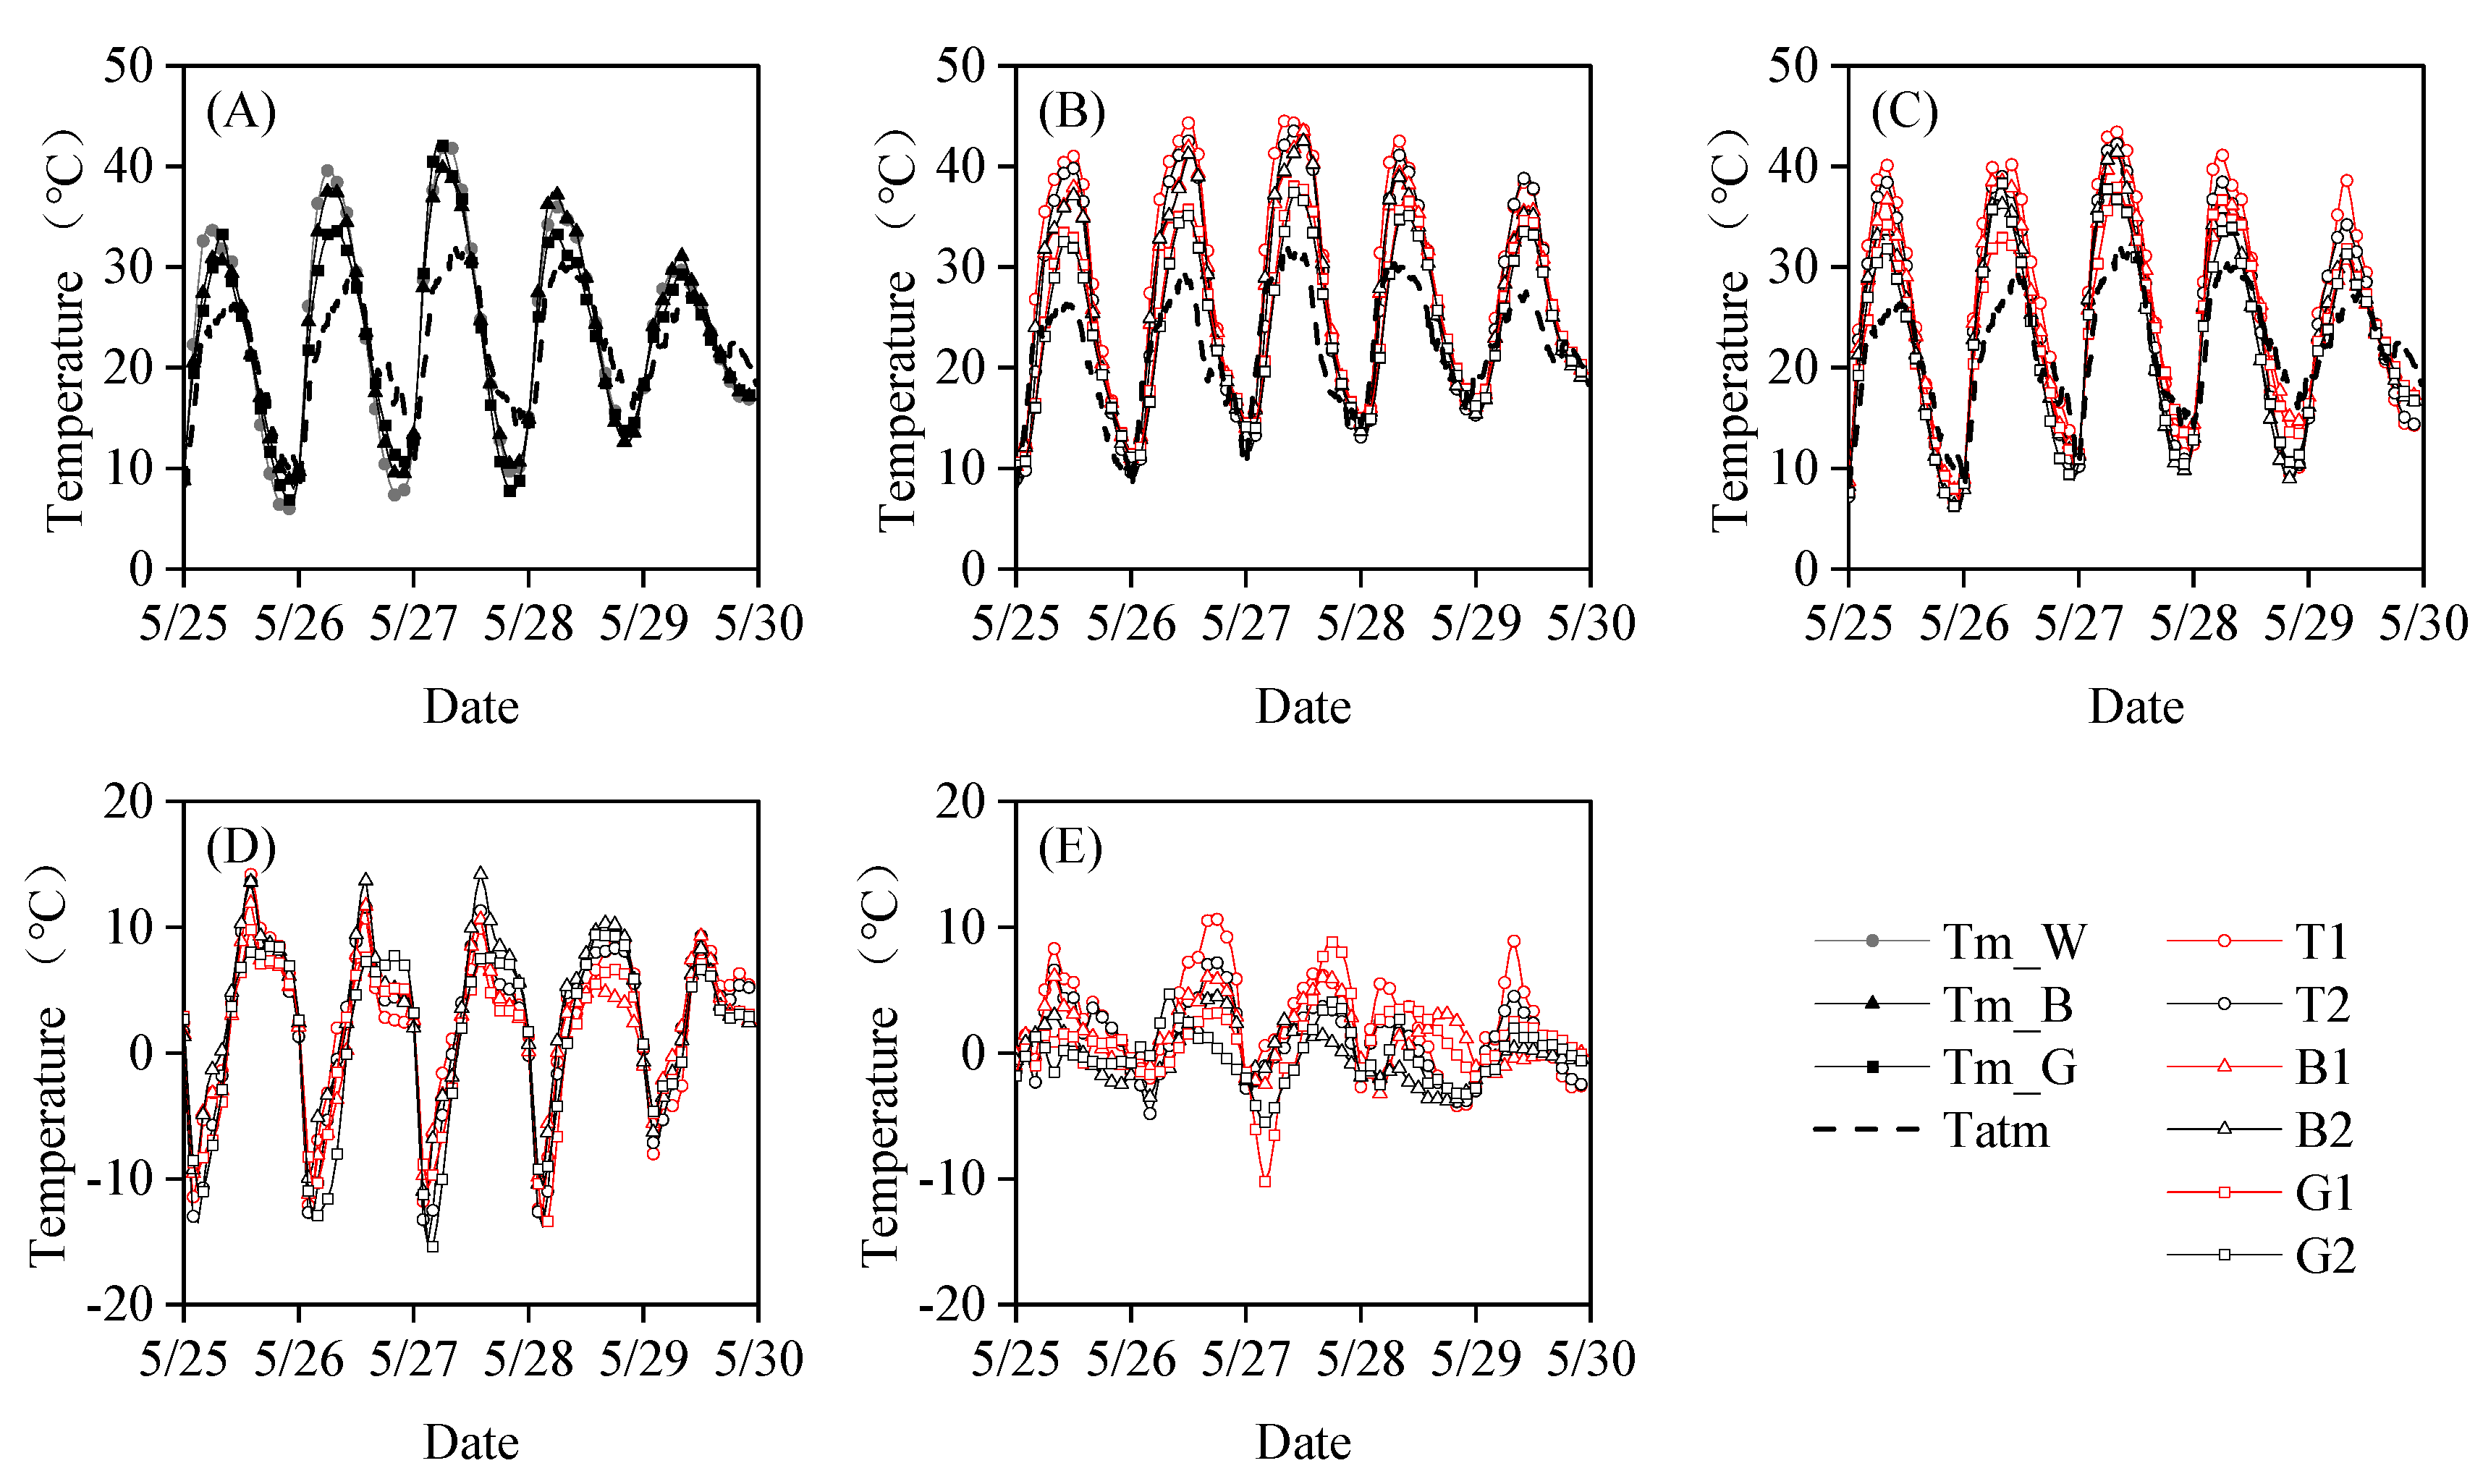
4.2. Soil Surface, Below Surface, and Plastic Film Temperatures

The variations in the patterns of plastic film temperature ( T m ), soil surface temperature ( T s ), and temperature measured 10 cm below the soil surface ( T l ) (Figure 6) followed the variations in shortwave radiation (Figure 5). T m and T s varied similarly, with highest values between 12:00 and 14:00; the variation in T l was shifted, peaking at around 18:00. The three temperatures were higher on May 25, 26, and 27 than on May 29 and 30. The column charts in Figure 6 indicate that the daily average temperature below the soil surface ( T l _ D A T ) was highest for treatments T1, T2, B1, and G1, followed by the soil surface ( T s _ D A T ) and plastic film ( T m _ D A T ) temperatures. T l _ D A T in the B2 and G2 treatments was still higher than T s _ D A T and T m _ D A T , except on May 26 for the G2 treatment. T s _ D A T was lower than T m _ D A T on May 25, 27, and 28 for the B2 treatment and on May 28 and 29 for the G2 treatment. The total average temperature below the soil surface ( T l _avg) was highest for treatments T1, T2, B1, B2, G1, and G2 (28.1, 26.5, 26.7, 26.3, 24.6, and 23.7 °C, respectively), followed by that of the soil surface ( T s _avg) for T1, T2, B1, and G1 (25.8, 24.5, 24.8, and 23.5 °C, respectively) and of the plastic film ( T m _avg) for T1, T2, B1, and G1 (23.5, 23.5, 23.4, and 22.6 °C, respectively); under the B2 and G2 treatments, T s _avg (23.1 and 22.3 °C, respectively) was slightly lower than T m _avg (23.4 and 22.6 °C, respectively).
T l _avg was lower for treatments with the same colour and a larger perforation ratio (B2, G2) (Figure 6). For the transparent plastic film, T l _avg was 1.6 °C lower under the perforation ratio of 12.47% (T2) than under the lower perforation ratio (T1), compared to a 0.4 and 0.9 °C difference for the B and G plastic films, respectively. Similarly, the larger perforation ratio reduced T s _avg by 1.3, 1.7, and 1.2 ℃ compared to the lower perforation ratio for T, B, and G, respectively. Note that the perforation ratio had a minor effect on T m _avg. T m _avg, T l _avg, and T s _avg were all influenced by the plastic color, being highest for the transparent plastic film (T1 and T2), followed by the black plastic film (B1 and B2), and silver-grey plastic film (G1 and G2).
Following Equations (7) and (9), the soil heat conduction (G) is positively related to the difference between T l and T s ( T l T s ), and the heat conduction between the plastic film and soil surface ( C s m ) is positively related to the difference between T s and T m ( T s T m ) . Figure 7 shows that T s T m was consistently positive at around 18:00 to around 2:00 on the next day for T1, T2, B1, and G1, and less consistently so for B2 and G2. The positive values of T s T m were 10.6, 7.2, 6.1, 4.5, 8.8, and 4.7 °C in the T1, T2, B1, B2, G1, and G2 treatments, respectively, whereas the lower values were −4.2, −4.8, −3.2, −3.8, −10.2, and −5.5 °C, respectively. T l - T s was higher than T s - T m , with positive values for the former of 14.2, 13.6, 11.9, 14.2, 9.8, and 9.4 °C, respectively, and lowest values of −12.4, −13.2, −11.2, −11.0, −13.4, and −15.4 °C, respectively.
The plastic film temperature ( T m ), temperature 10 cm below the soil surface ( T l ), soil surface temperature ( T s ), T l T s , and T s T m for the six treatments are depicted in Figure 7. T l T s for the G film (G1 and G2) was lower than that for the B and T plastic films (Figure 7D), in contrast to the lack of a clear pattern for T s T m under the different treatments (Figure 7E). T m , T l , and T s differed significantly during the day compared to the night hours for the coloured plastic films (Figure 7A–C). Moreover, T l and T s were higher for the 4.49% vs. 12.47% perforation ratio, independent of the time of day (Figure 7B,C). The lower T s and T l for the larger perforation ratio indicated that the plastic film acts as an insulator, namely, decreases the sensible heat flux and maintains soil temperature at a constant level at night. Both T l and T s were higher under the T vs. B plastic film, followed by that under G, because plastic film with lower transmittance intercepts more radiation, which decreases the net radiation reaching the soil surface. The soil releases heat during the night through sensible heat flux along with the decrease in atmospheric temperature, T a t m .

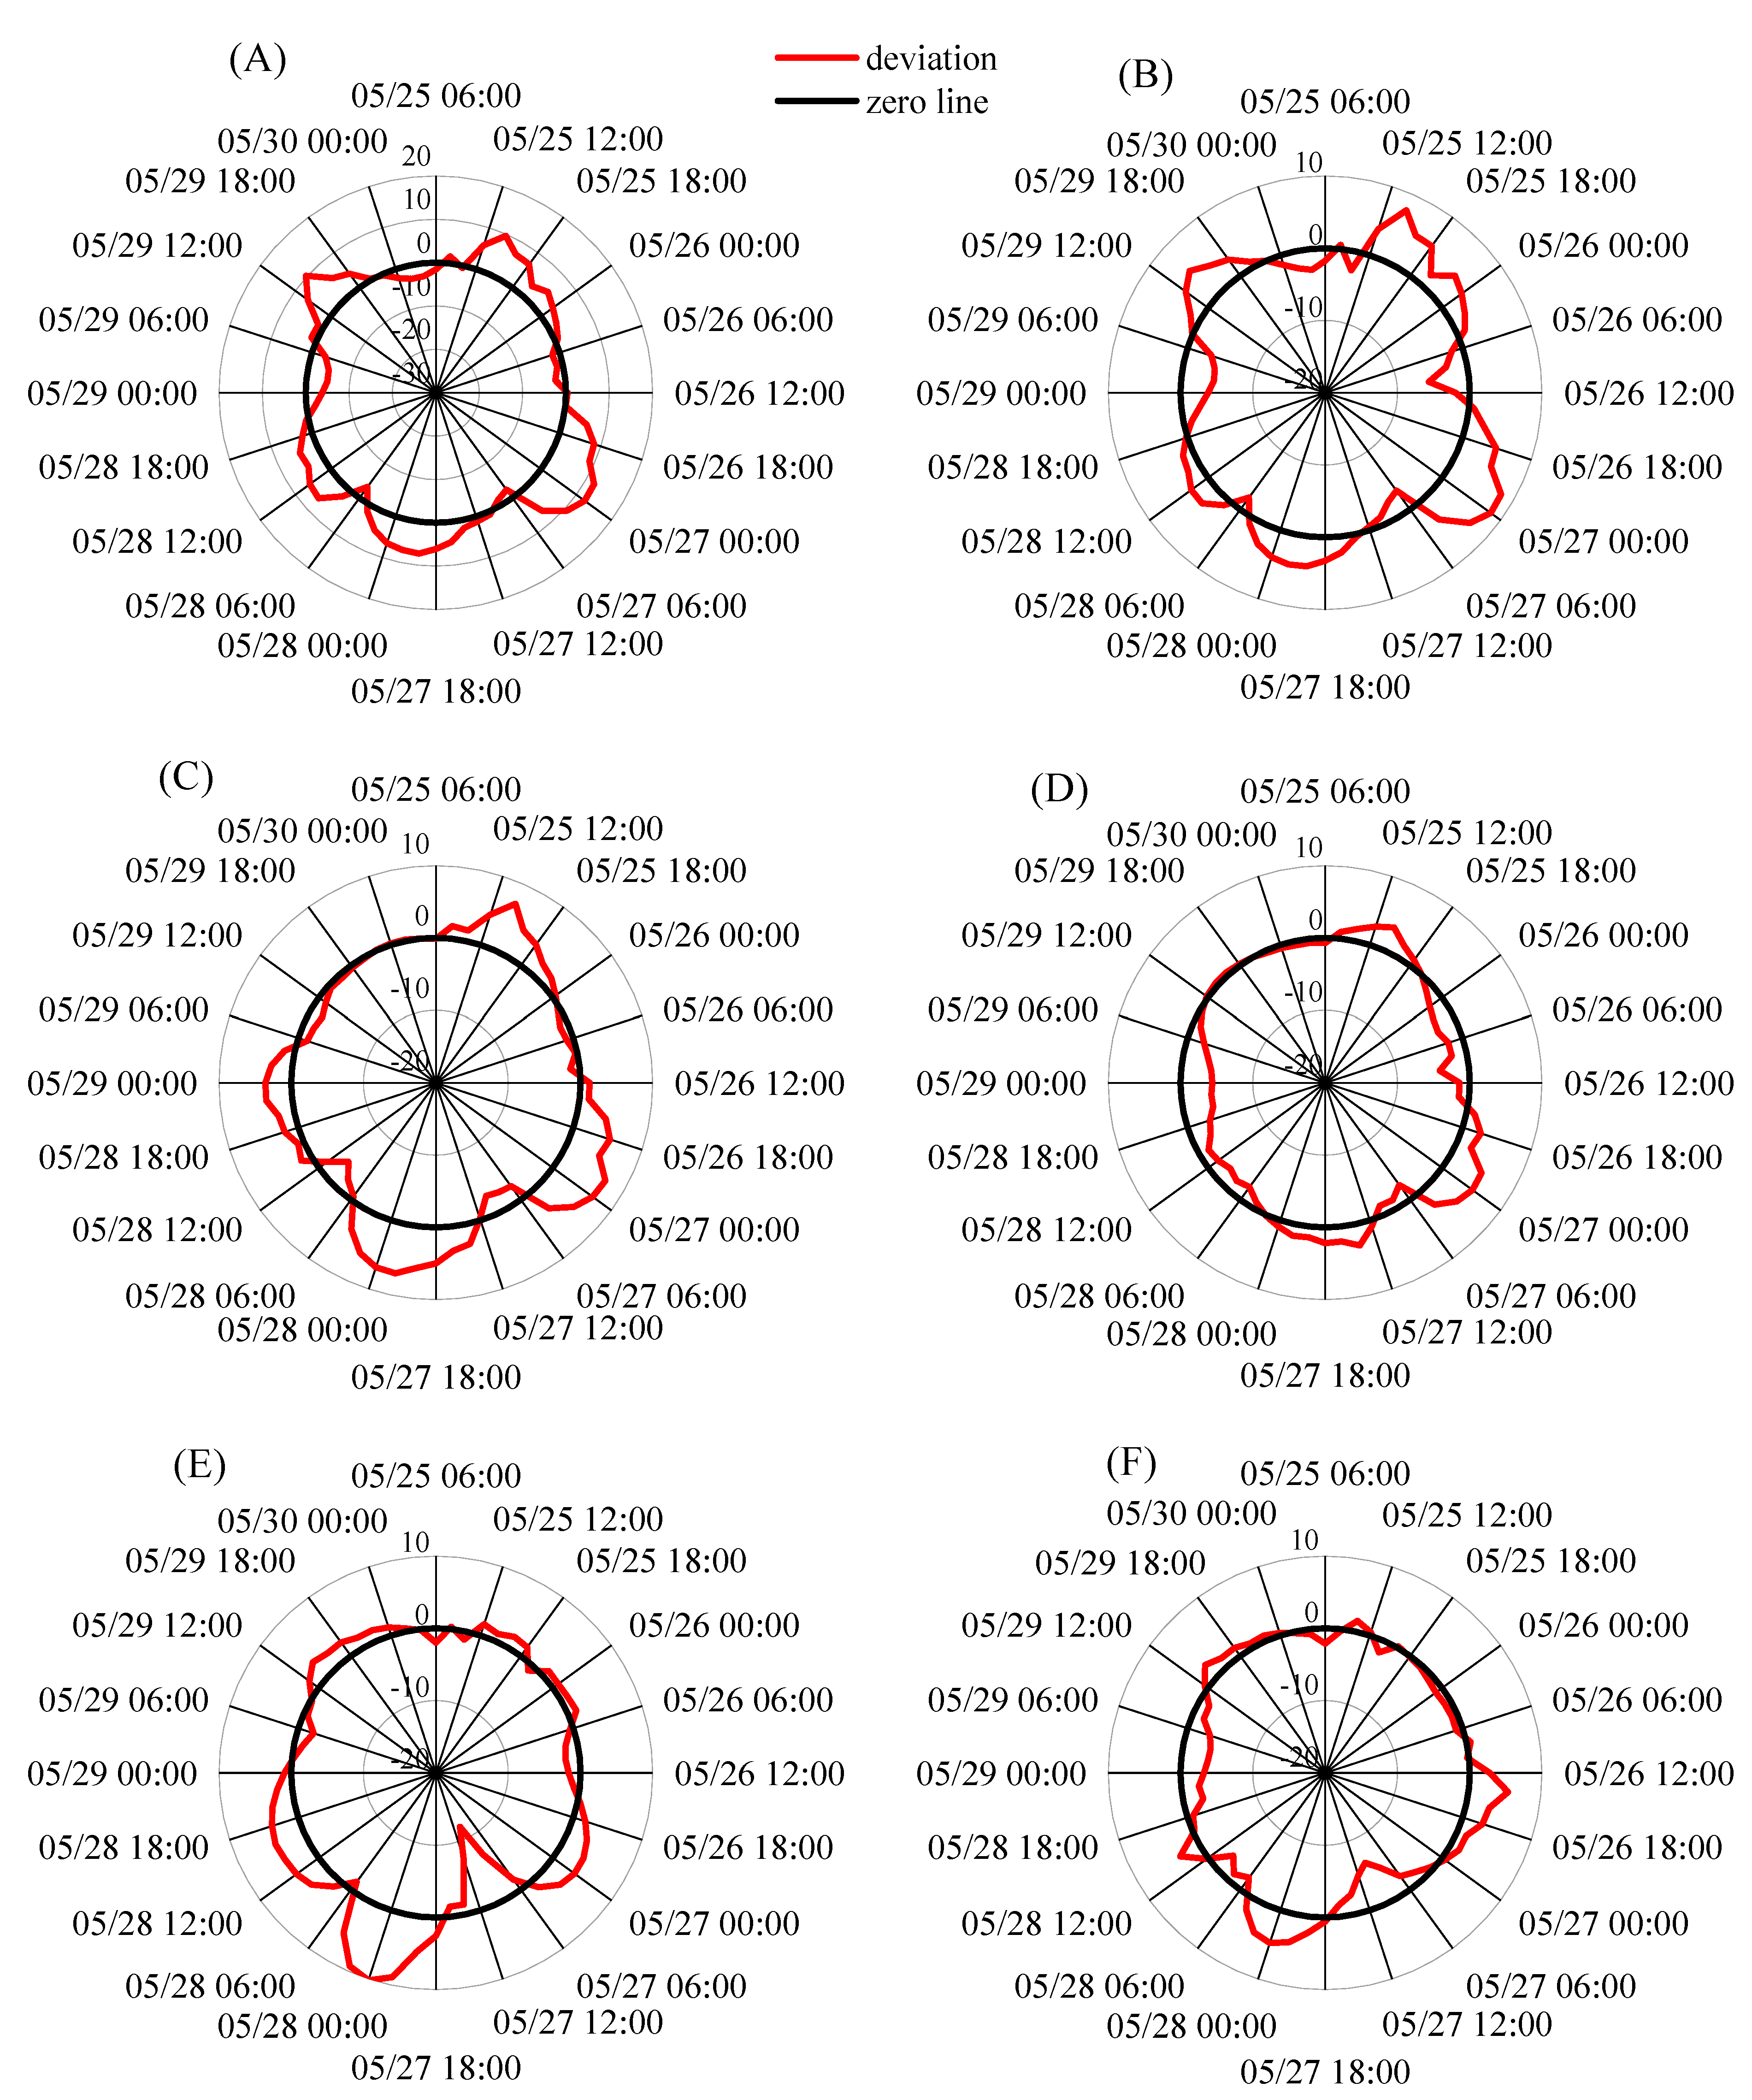
4.3. Measured and Simulated Soil Evaporation

The measured and simulated evaporation rates for the different treatments are shown in Figure 8. Both had single peak values for all treatments. The plastic film colour and perforation ratio affected the soil evaporation rate; the daily evaporation rate peaks were negatively correlated with plastic film colour (opacity) and positively correlated with the perforation ratio. Compared to the transparent plastic film (T1 and T2), the peak evaporation rate for the black film (B1 and B2) and grey-silver film (G1 and G2) decreased by nearly one-third and two-thirds, respectively. Moreover, the peak evaporation rate for 12.47% perforation (B2, G2) increased by 23.1% and 30.7%, compared to 4.49% perforation (B1, G1, respectively). The unexpected decrease in evaporation rate for T2 compared to T1 on May 28 and 29 (Figure 8) could be related to soil-crust formation. The trend for the measured and simulated evaporation rates was well-matched according to the IA, with values above 0.82 for all the six treatments (Figure 8). The RMSE values between the simulated and measured evaporation rates were 4.82, 5.42, 2.34, 2.89, 1.54 and 2.35 mm day−1 for T1, T2, B1, B2, G1, and G2, respectively. The IA and RMSE values decreased for the higher perforation ratio (except that IA was higher for T2 than T1), indicating that the SMAS model prediction was closer to the measured results for the small perforation ratio (Figure 8). The SMAS model simulations were more reliable for the grey-silver film (G1 and G2) treatment, followed by the black (B1 and B2) and transparent (T1 and T2) films, revealing that the model predictions were better for mulch with weak light transmittance.
The measured and simulated soil evaporation mass losses (cumulative evaporation rate over time) for the six treatments are depicted in Figure 9. Daily patterns were ladder-type, with a sharp increase during the day and a slight increase at night. Evaporation mass loss was higher for the larger perforation ratio, regardless of film colour. Evaporation mass loss was highest for the transparent plastic films, followed by black and grey-silver plastic films, regardless of perforation ratio.
A plot of the simulated vs. measured evaporation mass loss yielded a linear relationship for all films (Figure 10). A slope lower than 1 was obtained for the larger perforation ratio (0.9554 for T2 and 0.9113 for G2), indicating that the SMAS model slightly underestimated the evaporation mass losses for the partially covered soil. Comparison with the MRE, RMSE, and IA values for the evaporation rate revealed that the simulated evaporation mass losses are more consistent with the measured data: the MRE of simulated and measured evaporation mass losses decreased sharply (9.13%, −3.52%, 15.48%, 7.6%, 7.87%, and −3.91% for T1, T2, B1, B2, G1, and G2, respectively), while the MRE for evaporation rate was −21.48%, −20.45%, −14.95%, −17.68%, −16.94%, and −20.57%, respectively. Furthermore, the RMSE of the simulated and measured evaporation mass losses was quite low (0.57, 1.16, 1.15, 0.40, 0.48, and 1.04 for T1, T2, B1, B2, G1, and G2, respectively), whereas the IA increased to 0.9988, 0.9949, 0.9901, 0.9991, 0.9971, and 0.9904, respectively. Thus, the large error between the simulated and measured evaporation rates decreased when the evaporation mass loss was considered, indicating plausibility of the simulated results for evaporation mass losses.

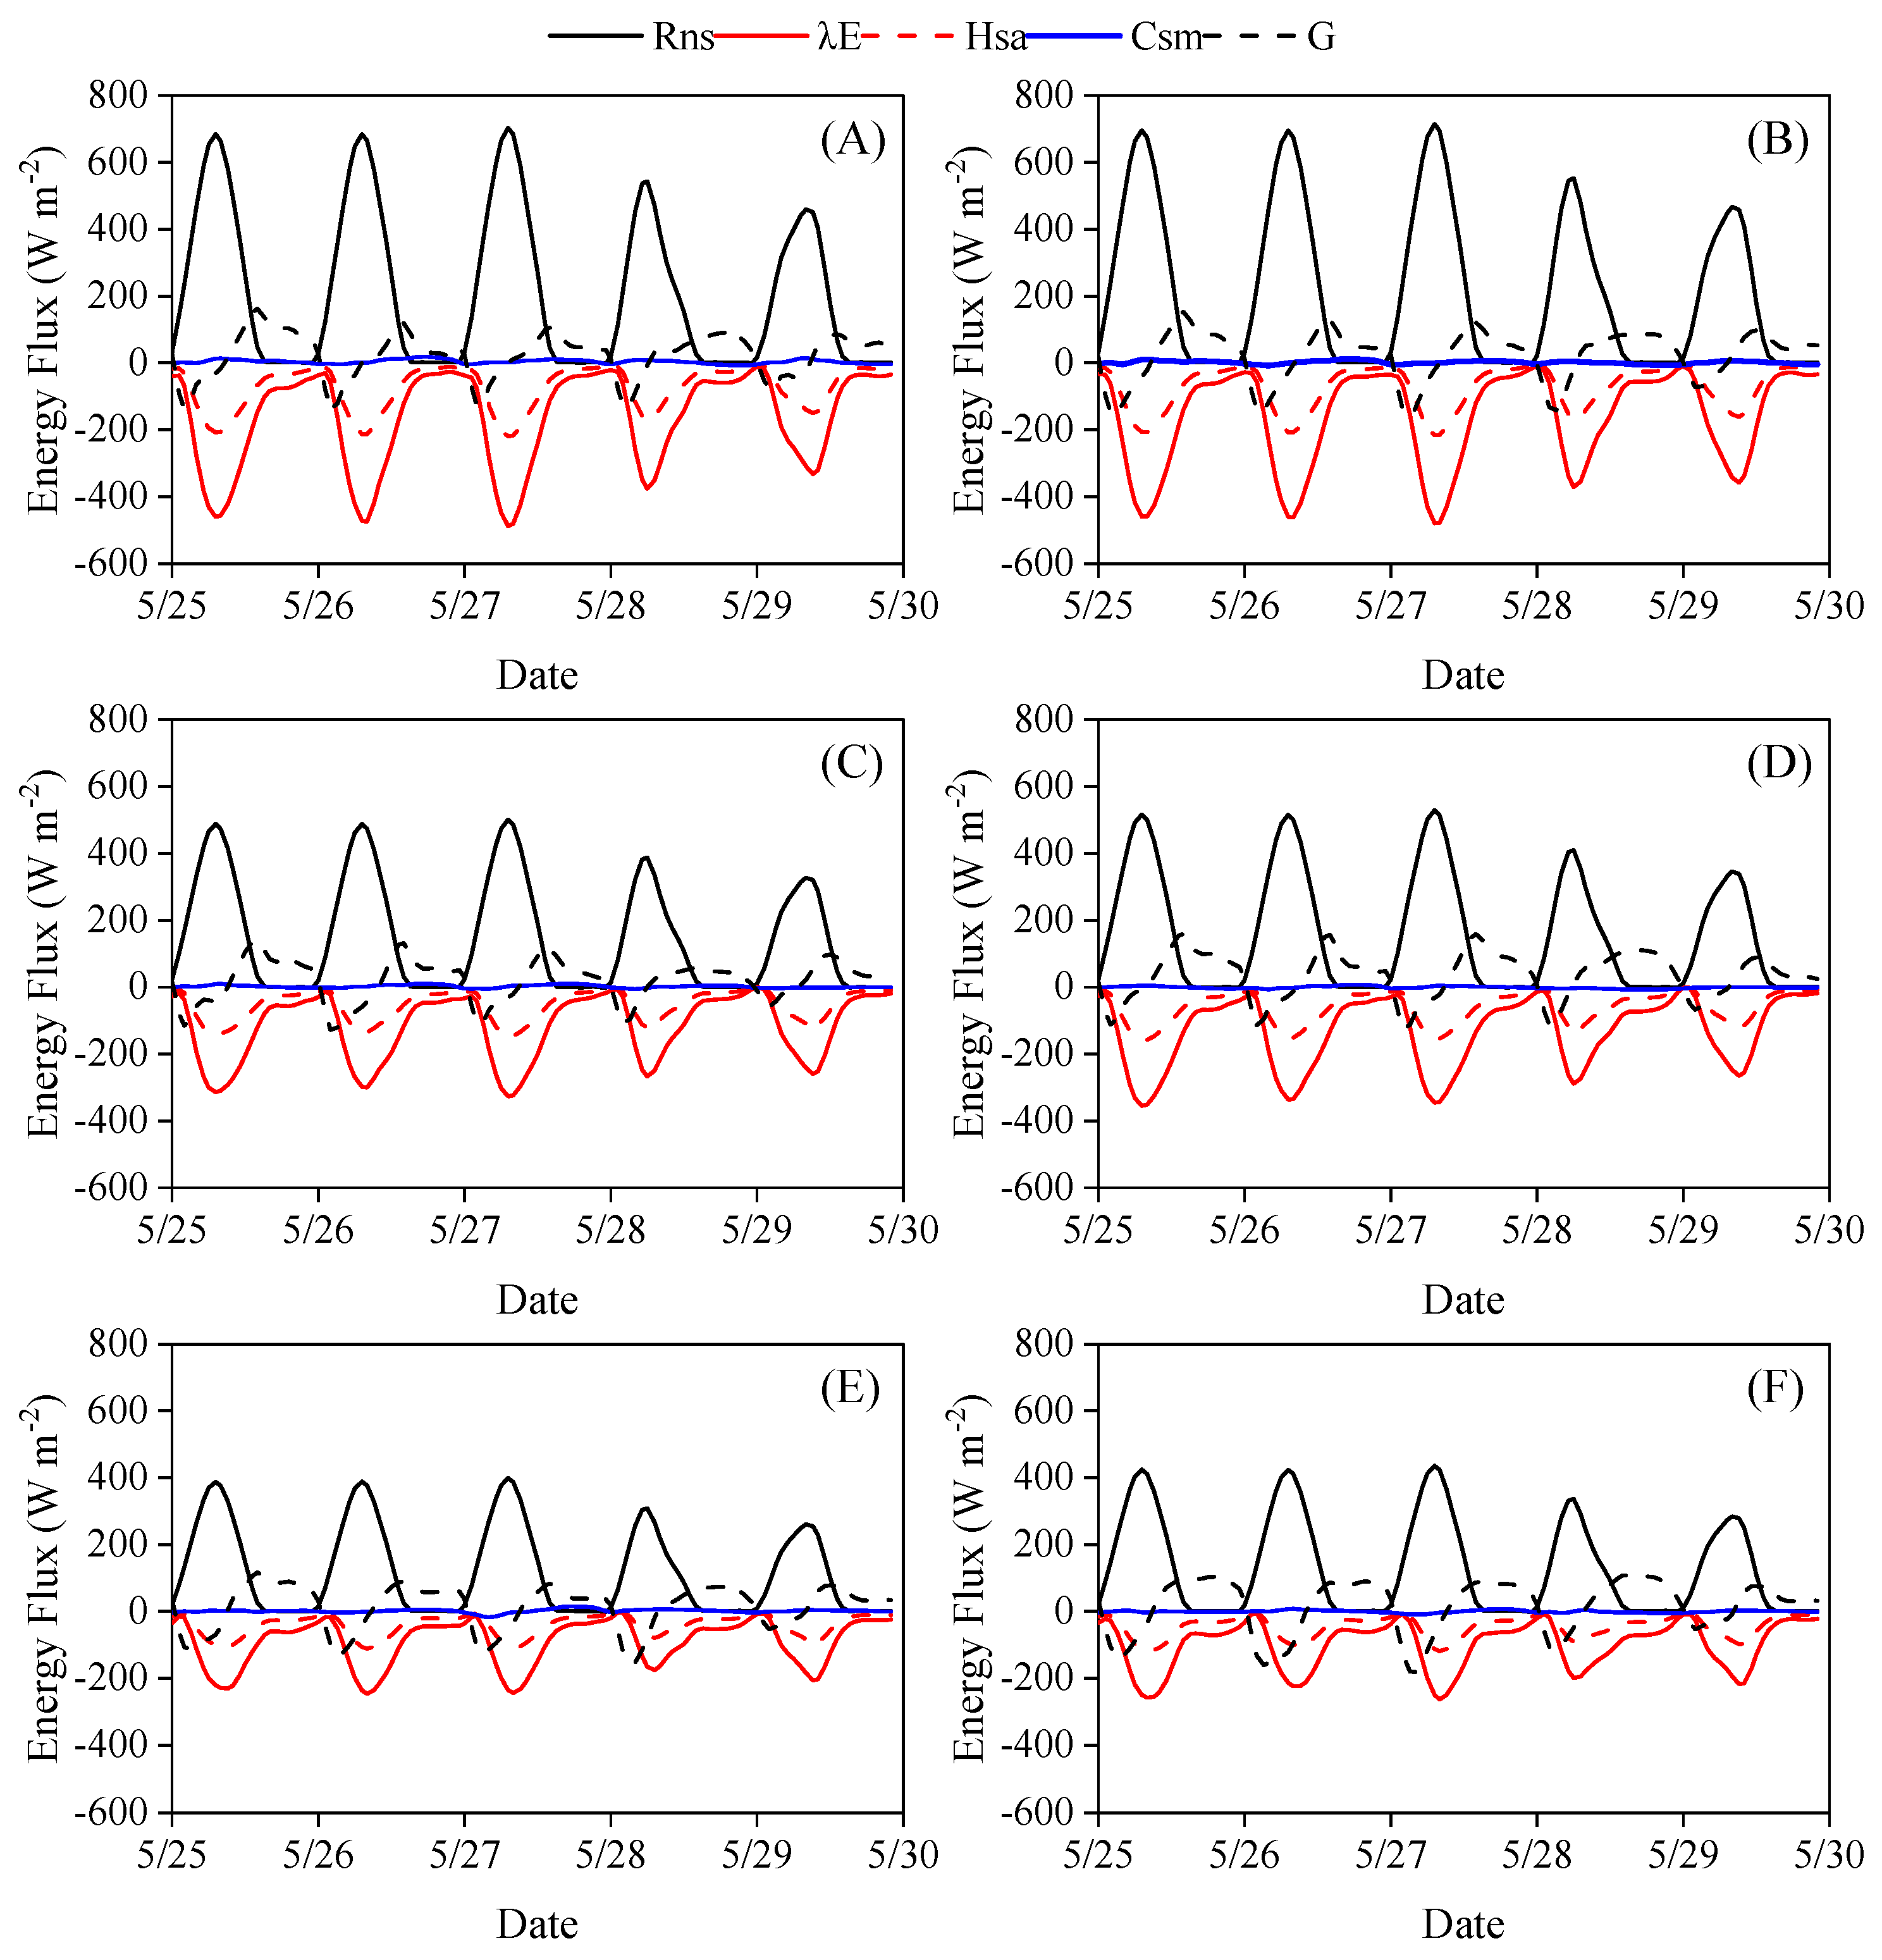
4.4. Energy Distribution in the SMAS Model

The following energy components are included in agroecosystem modelling: net radiation (Rn), soil heat flux (G), latent heat flux ( λ E ), and sensible heat flux (H). These four components are considered in most research on mulched fields [8,16,36,37,38,39], while ignoring the conduction between the mulch and soil surface, C s m , driven by the temperature difference between the two. The C s m component was considered by Ham and Kluitenberg (1994) and Zhang et al. (2020) [33,40]. The relative contribution of each of the five components is depicted in Figure 11. Note that R n s is the primary energy source for λ E and H s a . The summed R n s during the experimental period was 12,596, 12,801, 8963, 9471, 7144, and 7804 W m−2 for T1, T2, B1, B2, G1, and G2, respectively. The summed λ E was −9846, 9765, −7120, −7950, −5532, and −6013 W m−2, respectively, and the summed H s a was −4431, −4394, −3204, −3578, −2489, and −2706 W m−2, respectively. λ E and H s a had a negative pattern, mirroring the positive pattern of R n s . C s m barely varied with time, while the oscillations in G had negative values during the night and positive values most of the day. The net value of C s m was 238, 106, 141, −28, 89, and −23 W m−2 for T1, T2, B1, B2, G1, and G2, respectively, whereas the net contribution of G was 1443, 1253, 1220, 2085, 788, and 938 W m−2, respectively. These results are consistent with the measured temperatures in Section 4.2, indicating that the oscillations in G are greater than those in C s m , resulting from the relatively small T l T s and T s T m (Figure 7), despite the small differences in the coefficients in Equations (7) and (9). C s m is low (Figure 11) due to the small conduction coefficient in the air between the soil surface and the mulch, which helps store energy, decreases the release of heat flux, and preserves the soil temperature at night. This provides a good demonstration of the thermal insulation of plastic film mulching in agroecosystems. The energy distribution in these systems always comes up with crop growth [41,42,43,44]. Although the current study with bare soil columns does not provide information about the films’ effect on plant growth or yield, it does provide information for the seedling stage without surface canopy coverage. The absolute λ E value in Figure 11 is one-third of that of H s a , as was also found by Feng et al. (2017) at the seedling stage [43]. However, under field conditions, these energy components vary during the plant growing period due to dynamic ambient conditions (leaf area index, rainfall, evaporation, and soil moisture) [39,43,45,46].

4.5. The effect of Csm on SMAS model predictions

As shown in Figure 11, the heat conduction between the soil surface and the plastic film, C s m , is lower than R n s , λ E , H s a , and G, and as a consequence, C s m is disregarded in agroecosystem models [16,36], and even for mulched fields [8,38]. We therefore further quantified the impact of C s m on λ E and determined whether this component is essential in the energy balance for calculations beyond the mechanistic process evaluation. Figure 12 demonstrates the deviation in the latent heat flux ( λ E ) when C s m ( D λ E ) is included in the SMAS model. The range of the radar chart is uniform for T1 and T2, and more significant for the B1, B2, G1, and G2 treatments due to the larger D λ E under the transparent plastic film. Where the red curve extends beyond the bold black circle, λ E increases with the inclusion of C s m ; when the red curve shows the opposite pattern, λ E decreases upon exclusion of C s m . The difference between maximum and minimum D λ E is 17.24, 13.89, 10.76, 9.61, 21.99, and 11.80 W m−2 for T1, T2, B1, B2, G1, and G2, respectively. The fluctuations of D λ E are small compared to the value of the latent heat flux itself, and C s m can therefore be excluded from the calculation of daily evaporation mass loss. In contrast, C s m should be considered when the SMAS model is used to follow the evaporation dynamics, in particular during the night when small changes in C s m can induce a substantial relative difference. The absolute relative error between λ E during the night hours when C s m was taken into account compared to when it was excluded reached 11.9%, 8.1%, 29.8%, 7.4%, 7.9%, and 4.3% for T1, T2, B1, B2, G1, and G2, respectively. When the daily evaporation, but not its dynamics, is of concern, ignoring C s m simplifies the energy-partition calculation. In this case, T m does not need to be measured. The lower C s m values obtained in the current experiments compared with those in Ham and Kluitenberg (1994) may be related to the smaller difference between T m and T s in our study [33]. Beyond the embedded differences between column experiments and field studies, emerging inter alia due to scale and the soil disturbance of the former that affects its hydraulic properties [47,48,49,50], Ham and Kluitenberg’s (1994) study was performed with intact films (with no perforations) [33]. These may explain the inconsistency between the results obtained by Ham and Kluitenberg (1994) and those of our study [33].

4.6. Impact of Plastic Film Parameters on Energy Distribution

Activities which tend to alter land surface parameters such as aerodynamic resistance, roughness and surface albedo, or soil heat flux can also affect the surface energy budget [8,51,52]. The commonly used mulching films represent one such activity that can be reflected in the energy acquisition and distribution in the underlying soil surface [31]. The theoretical and practical importance of the physical mechanisms involved in land–atmosphere interactions in film-mulched agroecosystems has led to recent studies on this topic [38,43,53]. Analysis of the relative contribution of the different components in the energy balance for different mulching films is shown in Figure 13, where the patterns of the different components ( λ E , H s a , G, and R n s ) are compared for the six treatments. The net radiation at the soil surface is comprised of the shortwave ( R s s ) and longwave ( R l s ) radiation there (Equation (2)). Following the convolution of reflection, transmission, and emission of the plastic film and soil surface, the longwave radiation emitted by the plastic film combined with the shortwave radiation was cut by 29%, 27%, 49%, 46%, 59%, and 56% at 1400 h for T1, T2, B1, B2, G1, and G2, respectively. It can be seen in Figure 8 that T l under the transparent plastic (T) was lower than that under the black (B) and silver-grey (G) plastic, indicating that plastic film with higher transmittance provides relatively poor thermal insulation during the night.
In other words, R n s was lowest for the G plastic film, followed by the B and T films (Figure 13). The optical properties of the surface cover, solar elevation angle, soil water content, and soil colour, all affect the surface albedo. When the field is covered with coloured plastic film, the surface albedo largely depends on the plastic film’s optical and physical properties [39,54]. The available net energy was positively related to the perforations because the mulch filtered less of the areal part of the energy. The surface reflectance of the incoming shortwave radiation component largely depends on the surface albedo, and the surface albedo of a continuous plastic cover is higher than that of a perforated one [9,30,54].
This result contradicts Chen et al.’s (2017) study, in which soil temperature decreased with film perforation [12], but is in agreement with Li et al. (2003), where evaporation increased with perforation ratio [11]. The contradiction in these results may emanate from the variations in temperature fluctuations and environmental conditions in the two experimental studies. However, a comparison between the dotted black and solid yellow lines representing the transparent plastic film (Figure 13) indicates that the positive effect of the perforations on the available net radiation is relatively weak. We found no reports with comparable conclusions. A feasible explanation is that the energy intercepted by the mulch is similar to the energy that passes directly through the perforation holes, given that the difference between the areas of the holes in our experimental study was 1.65%, which is relatively small. In film-mulched agroecosystems, the plastic film may rupture during the growing season, thus increasing this difference. The available net energy is negatively related to the opacity of the plastic film [55], and further influences the soil temperature and alters the energy distribution, i.e., H s a , G, and λ E . However, it can be seen in Figure 7 that T l under the T film was lower than that under the B and G films, despite the higher transmittance. This indicates that plastic film with higher transmittance provides relatively poor thermal insulation during the night.

5. Conclusions

Bare soil columns were covered by combinations of differently coloured and perforated plastic film mulching to study their effect on evaporation through the soil surface. The experimental results were successfully compared with simulations using a SMAS model. The net radiation, sensible heat, latent heat, heat conduction between plastic mulch and soil surface, and soil heat conduction were measured and analysed for their relative contribution to evaporation. The following conclusions were drawn from this study:
Overall, the SMAS model exhibited high accuracy in simulations of the soil evaporation mass losses under plastic films with different colours and perforation ratios.
The SMAS model, in which transmission, reflection, and absorption were considered in the process of energy transmission through plastic films with different optical properties, showed that evaporation under the films followed the order: T > B > G.
With a perforation ratio increase of 7.98%, the evaporation mass loss increased by 1.26 and 2.32 mm for the G and B plastic films, respectively. In contrast, the impact on the T film was insignificant. The SMAS model was more accurate for coverage with a mulch with weak light transmittance.
C s m can be excluded when the daily evaporation mass loss, rather than the mechanism of plastic film mulching in agroecosystems, is being considered. However, it is essential to consider C s m in the SMAS model for simulations of evaporation dynamics, particularly at night when evaporation is low, and small changes may yield substantial differences in evaporation.

Author Contributions

Conceptualization, Z.X. and X.M.; methodology, Z.X. and J.S.; software, J.S. and Z.X.; validation, Z.X. and J.S.; formal analysis, Z.X. and X.M.; investigation, Z.X.; resources, X.M.; data curation, X.M.; writing—original draft preparation, Z.X.; writing—review and editing, R.W. and X.M.; visualization, Z.X.; supervision, R.W. and X.M.; project administration, X.M.; funding acquisition, X.M. All authors have read and agreed to the published version of the manuscript.

Funding

This work was supported by the National Key Research and Development Program (2021YFD1900801) and National Natural Science Foundation of China (51790535, 51861125103). We are very grateful to the National Field Scientific Observation and Research Station on Efficient Water Use of Oasis Agriculture in Wuwei of Gansu Province.

Data Availability Statement

Not applicable.

Conflicts of Interest

The authors declare no conflict of interest.

References

  1. Balwinder-Singh; Eberbach, P.L.; Humphreys, E. Simulation of the evaporation of soil water beneath a wheat crop canopy. Agric. Water Manag. 2014, 135, 19–26. [Google Scholar] [CrossRef]
  2. Hou, X.Q.; Li, R. Interactive effects of autumn tillage with mulching on soil temperature, productivity and water use efficiency of rainfed potato in loess plateau of China. Agric. Water Manag. 2019, 224, 105747. [Google Scholar] [CrossRef]
  3. Yang, H.; Wu, G.; Mo, P.; Chen, S.; Wang, S.; Xiao, Y.; Ma, H.A.; Wen, T.; Guo, X.; Fan, G. The combined effects of maize straw mulch and no-tillage on grain yield and water and nitrogen use efficiency of dry-land winter wheat (Triticum aestivum L.). Soil Tillage Res. 2020, 197, 104485. [Google Scholar] [CrossRef]
  4. Li, J.; Song, J.; Li, M.; Shang, S.H.; Mao, X.M.; Yang, J.; Adeloye, A.J. Optimization of irrigation scheduling for spring wheat based on simulation-optimization model under uncertainty. Agric. Water Manag. 2018, 208, 245–260. [Google Scholar] [CrossRef]
  5. Hou, X.Y.; Wang, F.X.; Han, J.J.; Kang, S.Z.; Feng, S.Y. Duration of plastic mulch for potato growth under drip irrigation in an arid region of Northwest China. Agric. For. Meteorol. 2010, 150, 115–121. [Google Scholar] [CrossRef]
  6. Liu, J.L.; Bu, L.D.; Zhu, L.; Luo, S.S.; Chen, X.P.; Li, S.Q. Optimizing Plant Density and Plastic Film Mulch to Increase Maize Productivity and Water-Use Efficiency in Semiarid Areas. Agron. J. 2014, 106, 1138–1146. [Google Scholar] [CrossRef]
  7. Yang, J.; Mao, X.; Wang, K.; Yang, W. The coupled impact of plastic film mulching and deficit irrigation on soil water/heat transfer and water use efficiency of spring wheat in Northwest China. Agric. Water Manag. 2018, 201, 232–245. [Google Scholar] [CrossRef]
  8. Tarara, J.M.; Ham, J.M. Measuring sensible heat flux in plastic mulch culture with aerodynamic conductance sensors. Agric. For. Meteorol. 1999, 95, 1–13. [Google Scholar] [CrossRef]
  9. Ai, Z.P.; Yang, Y.H.; Wang, Q.X.; Han, S.M.; Yang, Y.M.; Wang, Q.; Qiu, G.Y. Changes of surface energy partitioning caused by plastic mulch in a cotton field. Int. Agrophysics 2018, 32, 349. [Google Scholar] [CrossRef]
  10. Bristow, K.L.; Horton, R. Modeling the impact of partial surface mulch on soil heat and water flow. Theor. Appl. Climatol. 1996, 54, 85–98. [Google Scholar] [CrossRef]
  11. Li, Y.; Shao, M.G.; Wang, W.Y.; Wang, Q.J.; Horton, R. Open-hole effects of perforated plastic mulches on soil water evaporation. Soil Sci. 2003, 168, 751–758. [Google Scholar] [CrossRef]
  12. Chen, G.; Dong, J.; Wang, Y.; Yan, F.; Li, J.; Bu, Y.; Geng, S.; Zou, Y.; Chai, Y.; Xiong, Y. Effects of perforated film mulching on growth and quality of tobacco in Chuxiong. Tob. Sci. Technol. 2017, 50, 37–41. [Google Scholar]
  13. Kasperbauer, M.J. Strawberry yield over red versus black plastic mulch. Crop Sci. 2000, 40, 171–174. [Google Scholar] [CrossRef]
  14. Li, F.M.; Wang, J.; Xu, J.Z. Plastic film mulch effect on spring wheat in a semiarid region. J. Sustain. Agric. 2005, 25, 5–17. [Google Scholar] [CrossRef]
  15. Du, Y.J.; Li, Z.Z.; Li, W.L. Effect of different water supply regimes on growth and size hierarchy in spring wheat populations under mulched with clear plastic film. Agric. Water Manag. 2006, 79, 265–279. [Google Scholar] [CrossRef]
  16. Fan, Y.Q.; Ding, R.S.; Kang, S.Z.; Hao, X.M.; Du, T.S.; Tong, L.; Li, S. Plastic mulch decreases available energy and evapotranspiration and improves yield and water use efficiency in an irrigated maize cropland. Agric. Water Manag. 2017, 179, 122–131. [Google Scholar] [CrossRef]
  17. Zhang, Y.L.; Wang, F.X.; Shock, C.C.; Yang, K.J.; Kang, S.Z.; Qin, J.T.; Li, S.E. Effects of plastic mulch on the radiative and thermal conditions and potato growth under drip irrigation in arid Northwest China. Soil Tillage Res. 2017, 172, 1–11. [Google Scholar] [CrossRef]
  18. Tuovinen, T.; Kikas, A.; Tolonen, T.; Kivijarvi, P. Organic mulches vs. black plastic in organic strawberry: Does it make a difference for ground beetles (Col., Carabidae)? J. Appl. Entomol. 2006, 130, 495–503. [Google Scholar] [CrossRef]
  19. Zhao, H.; Xiong, Y.; Li, F.; Wang, R.; Qiang, S.; Yao, T.; Mo, F. Plastic film mulch for half growing-season maximized WUE and yield of potato via moisture-temperature improvement in a semi-arid agroecosystem. Agric. Water Manag. 2012, 104, 68–78. [Google Scholar] [CrossRef]
  20. Dusek, J.; Ray, C.; Alavi, G.; Vogel, T.; Sanda, M. Effect of plastic mulch on water flow and herbicide transport in soil cultivated with pineapple crop: A modeling study. Agric. Water Manag. 2010, 97, 1637–1645. [Google Scholar] [CrossRef]
  21. Han, J.; Jia, Z.K.; Wu, W.; Li, C.S.; Han, Q.F.; Zhang, J. Modeling impacts of film mulching on rainfed crop yield in Northern China with DNDC. Field Crops Res. 2014, 155, 202–212. [Google Scholar] [CrossRef]
  22. Liang, H.; Hu, K.L.; Qin, W.; Zuo, Q.; Zhang, Y.A. Modelling the effect of mulching on soil heat transfer, water movement and crop growth for ground cover rice production system. Field Crops Res. 2017, 201, 97–107. [Google Scholar] [CrossRef]
  23. Liu, M.X.; Yang, J.S.; Li, X.M.; Yu, M.; Wang, J. Numerical Simulation of Soil Water Dynamics in a Drip Irrigated Cotton Field Under Plastic Mulch. Pedosphere 2013, 23, 620–635. [Google Scholar] [CrossRef]
  24. Li, X.Y.; Shi, H.B.; Simunek, J.; Gong, X.W.; Peng, Z.Y. Modeling soil water dynamics in a drip-irrigated intercropping field under plastic mulch. Irrig. Sci. 2015, 33, 289–302. [Google Scholar] [CrossRef] [Green Version]
  25. Han, M.; Zhao, C.Y.; Feng, G.; Yan, Y.Y.; Sheng, Y. Evaluating the Effects of Mulch and Irrigation Amount on Soil Water Distribution and Root Zone Water Balance Using HYDRUS-2D. Water 2015, 7, 2622–2640. [Google Scholar] [CrossRef] [Green Version]
  26. Tan, S.; Wang, Q.J.; Zhang, J.H.; Chen, Y.; Shan, Y.Y.; Xu, D. Performance of AquaCrop model for cotton growth simulation under film-mulched drip irrigation in southern Xinjiang, China. Agric. Water Manag. 2018, 196, 99–113. [Google Scholar] [CrossRef]
  27. Adeboye, O.B.; Schultz, B.; Adekalu, K.O.; Prasad, K.C. Performance evaluation of AquaCrop in simulating soil water storage, yield, and water productivity of rainfed soybeans (Glycine max L. merr) in Ile-Ife, Nigeria. Agric. Water Manag. 2019, 213, 1130–1146. [Google Scholar] [CrossRef]
  28. Ran, H.; Kang, S.Z.; Li, F.S.; Tong, L.; Ding, R.S.; Du, T.S.; Li, S.; Zhang, X.T. Performance of AquaCrop and SIMDualKc models in evapotranspiration partitioning on full and deficit irrigated maize for seed production under plastic film-mulch in an arid region of China. Agric. Syst. 2017, 151, 20–32. [Google Scholar] [CrossRef]
  29. Chen, Y.; Wang, L.; Tong, L.; Hao, X.; Wu, X.; Ding, R.; Kang, S.; Li, S. Effects of biochar addition and deficit irrigation with brackish water on yield-scaled N2O emissions under drip irrigation with mulching. Agric. Water Manag. 2023, 277, 108129. [Google Scholar] [CrossRef]
  30. Bonachela, S.; Granados, M.R.; Lopez, J.C.; Hernandez, J.; Magan, J.J.; Baeza, E.J.; Baille, A. How plastic mulches affect the thermal and radiative microclimate in an unheated low-cost greenhouse. Agric. For. Meteorol. 2012, 152, 65–72. [Google Scholar] [CrossRef]
  31. Tarara, J.M. Microclimate modification with plastic mulch. Hortscience 2000, 35, 169–180. [Google Scholar] [CrossRef] [Green Version]
  32. Xiang, J.; Li, C.; Zhang, Q.; Xiong, Y.; Qiu, G. Effects of wind conditions on the bowen ratio and evapotranspiration in an oasis-desert ecotone. Acta Ecol. Sin. 2016, 36, 705–720. [Google Scholar]
  33. Ham, J.M.; Kluitenberg, G.J. Modeling the effect of mulch optical-properties and mulch soil contact resistance on soil heating under plastic mulch culture. Agric. For. Meteorol. 1994, 71, 403–424. [Google Scholar] [CrossRef]
  34. Chung, S.O.; Horton, R. Soil heat and water-flow with a partial surface mulch. Water Resour. Res. 1987, 23, 2175–2186. [Google Scholar] [CrossRef] [Green Version]
  35. He, Q.S.; Li, S.E.; Kang, S.Z.; Yang, H.B.; Qin, S.J. Simulation of water balance in a maize field under film-mulching drip irrigation. Agric. Water Manag. 2018, 210, 252–260. [Google Scholar] [CrossRef]
  36. Gong, D.Z.; Hao, W.P.; Mei, X.R.; Gao, X.; Liu, Q.; Caylor, K. Warmer and Wetter Soil Stimulates Assimilation More than Respiration in Rainfed Agricultural Ecosystem on the China Loess Plateau: The Role of Partial Plastic Film Mulching Tillage. PLoS ONE 2015, 10, e0136578. [Google Scholar] [CrossRef] [PubMed]
  37. Zhang, B.Z.; Xu, D.; Liu, Y.; Li, F.S.; Cai, J.B.; Du, L.J. Multi-scale evapotranspiration of summer maize and the controlling meteorological factors in north China. Agric. For. Meteorol. 2016, 216, 1–12. [Google Scholar] [CrossRef]
  38. Yuan, X.; Bai, J.; Li, L.; Kurban, A.; De Maeyer, P. Modeling the effects of drip irrigation under plastic mulch on vapor and energy fluxes in oasis agroecosystems, Xinjiang, China. Agric. For. Meteorol. 2019, 265, 435–442. [Google Scholar] [CrossRef]
  39. Li, B.; Shi, B.J.; Yao, Z.Z.; Shukla, M.K.; Du, T.S. Energy partitioning and microclimate of solar greenhouse under drip and furrow irrigation systems. Agric. Water Manag. 2020, 234, 106096. [Google Scholar] [CrossRef]
  40. Zhang, Y.L.; Wang, F.X.; Shock, C.C.; Feng, S.Y. Modeling the Interaction of Plastic Film Mulch and Potato Canopy Growth with Soil Heat Transport in a Semiarid Area. Agronomy 2020, 10, 190. [Google Scholar] [CrossRef] [Green Version]
  41. Lei, H.M.; Yang, D.W. Interannual and seasonal variability in evapotranspiration and energy partitioning over an irrigated cropland in the North China Plain. Agric. For. Meteorol. 2010, 150, 581–589. [Google Scholar] [CrossRef]
  42. Pardo, N.; Sanchez, M.L.; Perez, I.A.; Garcia, M.A. Energy balance and partitioning over a rotating rapeseed crop. Agric. Water Manag. 2015, 161, 31–40. [Google Scholar] [CrossRef]
  43. Feng, Y.; Gong, D.Z.; Mei, X.R.; Hao, W.P.; Tang, D.H.; Cui, N.B. Energy balance and partitioning in partial plastic mulched and non-mulched maize fields on the Loess Plateau of China. Agric. Water Manag. 2017, 191, 193–206. [Google Scholar] [CrossRef]
  44. Zhang, Y.C.; Shen, Y.J.; Xu, X.L.; Sun, H.Y.; Li, F.; Wang, Q. Characteristics of the water-energy-carbon fluxes of irrigated pear (Pyrus bretschneideri Rehd) orchards in the North China Plain. Agric. Water Manag. 2013, 128, 140–148. [Google Scholar] [CrossRef]
  45. Yoshifuji, N.; Kumagai, T.; Tanaka, K.; Tanaka, N.; Komatsu, H.; Suzuki, M.; Tantasirin, C. Inter-annual variation in growing season length of a tropical seasonal forest in northern Thailand. For. Ecol. Manag. 2006, 229, 333–339. [Google Scholar] [CrossRef]
  46. Tanaka, N.; Kume, T.; Yoshifuji, N.; Tanaka, K.; Takizawa, H.; Shiraki, K.; Tantasirin, C.; Tangtham, N.; Suzuki, M. A review of evapotranspiration estimates from tropical forests in Thailand and adjacent regions. Agric. For. Meteorol. 2008, 148, 807–819. [Google Scholar] [CrossRef]
  47. Lewis, J.; Sjostrom, J. Optimizing the experimental design of soil columns in saturated and unsaturated transport experiments. J. Contam. Hydrol. 2010, 115, 1–13. [Google Scholar] [CrossRef]
  48. Bromly, M.; Hinz, C.; Aylmore, L. Relation of dispersivity to properties of homogeneous saturated repacked soil columns. Eur. J. Soil Sci. 2007, 58, 293–301. [Google Scholar] [CrossRef]
  49. Toride, N.; Inoue, M.; Leij, F.J. Hydrodynamic dispersion in an unsaturated dune sand. Soil Sci. Soc. Am. J. 2003, 67, 703–712. [Google Scholar] [CrossRef]
  50. Bagarello, V.; Caltabellotta, G.; Iovino, M. Manual packing and soil reuse effects on determination of saturated hydraulic conductivity of a loam soil. Geoderma 2022, 405, 115465. [Google Scholar] [CrossRef]
  51. Berger, S.; Kim, Y.; Kettering, J.; Gebauer, G. Plastic mulching in agriculture-Friend or foe of N2O emissions? Agric. Ecosyst. Environ. 2013, 167, 43–51. [Google Scholar] [CrossRef]
  52. Zhao, Y.; Mao, X.; Shukla, M.K.; Tian, F.; Hou, M.; Zhang, T.; Li, S. How does film mulching modify available energy, evapotranspiration, and crop coefficient during the seed-maize growing season in northwest China? Agric. Water Manag. 2021, 245, 106666. [Google Scholar] [CrossRef]
  53. Chen, N.; Li, X.Y.; Simunek, J.; Shi, H.B.; Ding, Z.J.; Zhang, Y.H. The effects of biodegradable and plastic film mulching on nitrogen uptake, distribution, and leaching in a drip-irrigated sandy field. Agric. Ecosyst. Environ. 2020, 292, 106817. [Google Scholar] [CrossRef]
  54. Ochege, F.U.; Luo, G.P.; Yuan, X.L.; Owusu, G.; Li, C.F.; Justine, F.M. Simulated effects of plastic film-mulched soil on surface energy fluxes based on optimized TSEB model in a drip-irrigated cotton field. Agric. Water Manag. 2022, 262, 107394. [Google Scholar] [CrossRef]
  55. Li, H.; Chang, W.Y. Exploring optimal film mulching to enhance potato yield in China: A meta-analysis. Agron. J. 2021, 113, 4099–4115. [Google Scholar] [CrossRef]
Figure 1. Schematic diagram of the column experimental setup.
Agronomy 13 00926 g001
Figure 2. Schematic diagram of energy transport with perforated plastic film mulch.
Agronomy 13 00926 g002
Figure 3. Schematic diagram of shortwave radiation transmission, reflection, and absorption process for the plastic–soil surface vicinity.
Agronomy 13 00926 g003
Figure 4. Schematic diagram of longwave radiation transmission, reflection, and absorption process emitted by the atmosphere (blue lines), the plastic film (black lines) and the soil (red lines).
Agronomy 13 00926 g004
Figure 5. Shortwave radiation patterns measured by the standard automatic weather station during the experiment.
Agronomy 13 00926 g005
Figure 6. Variations in plastic film temperature ( T m _ D A T ), soil surface temperature ( T s _ D A T ), temperature below the soil surface ( T l _ D A T ), t h e   d i f f e r e n c e   b e t w e e n   T l   a n d   T s T l T s ,   t h e   d i f f e r e n c e   b e t w e e n   T s   a n d   T m T s T m , daily average temperature for the plastic film ( T m _ a v g ), soil surface ( T s _ a v g ) and 10 cm below the soil surface ( T l _ a v g ), and the overall average temperatures for film, soil surface, and soil at 10 cm depth between 25 May and 30 May ( T m _avg, T s _avg, T l _avg, respectively) for the six treatments: (A) T1; (B) T2; (C) B1; (D) B2; (E) G1; (F) G2.
Agronomy 13 00926 g006
Figure 7. Comparisons of (A) plastic film temperature ( T m ); (B) temperature below the soil surface ( T l ); (C) soil surface temperature ( T s ); (D) the difference between T l and T s ( T l T s ); (E) the difference between T s and T m ( T s T m ) for the six treatments.
Agronomy 13 00926 g007
Figure 8. Comparison of simulated and measured evaporation rates for the six treatments: (A) T1; (B) T2; (C) B1; (D) B2; (E) G1; (F) G2.
Agronomy 13 00926 g008
Figure 9. Comparison of simulated and measured evaporation mass losses for the six treatments.
Agronomy 13 00926 g009
Figure 10. Relationship between simulated and measured evaporation mass losses for the six treatments: (A) T1-calibration; (B) T2-validation; (C) B1-calibration; (D) B2-validation; (E) G1-calibration; (F) G2-validation.
Agronomy 13 00926 g010
Figure 11. Simulated energy balance for the six treatments: (A) T1; (B) T2; (C) B1; (D) B2; (E) G1; (F) G2. Included are the net radiation at the soil surface ( R n s ); the latent heat flux between the soil surface and atmosphere ( λ E ); the air sensible heat flux between the soil surface and the atmosphere ( H s a ); the heat conduction between the plastic film and the soil surface ( C s m ); and the heat flux downward through the soil surface ( G ).
Agronomy 13 00926 g011
Figure 12. Deviation of the latent heat flux (λE) with vs. without inclusion of C s m in the SMAS model for the six treatments: (A) T1; (B) T2; (C) B1; (D) B2; (E) G1; (F) G2.
Agronomy 13 00926 g012
Figure 13. Comparisons of the different components: (A) the latent heat flux between the soil surface and atmosphere ( λ E ); (B) the air sensible heat flux between the soil surface and the atmosphere ( H s a ); (C) the heat flux downward through the soil surface ( G ); (D) the net radiation at the soil surface ( R n s ).
Agronomy 13 00926 g013
Table 1. Particle size distribution and texture of soil used in the study.
Sand (%)
(2–0.05 mm)
Silt (%)
(0.05–0.005 mm)
Clay (%)
(<0.005 mm)
Soil Texture
(USDA)
Bulk   Density   ρ (g cm−3)
34.44156.7478.812Silty loam1.55
Table 2. List of parameters and their symbols.
SymbolDefinitionMeansValue
R s Solar radiation (W m−2)Meteorological stationInput file
T a t m Atmospheric temperature (°C)Meteorological stationInput file
τ s m Shortwave transmissivity of the plastic filmCalibrated [31]T: 0.83; 0.6–0.9
B: 0.58; 0.1–0.6
G: 0.45; 0.1–0.5
τ l m Longwave transmissivity of the plastic filmCalibrated [31]T: 0.82; 0.6–0.9
B: 0.2; 0.1–0.6
G: 0.49; 0.1–0.5
ρ l m Longwave reflectivity of the plastic filmCalibrated [31]T: 0.13; 0.1–0.4
B: 0.01; 0.01–0.1
G: 0.01; 0.01–0.1
ε m Plastic film emissivityCalibrated [31]T: 0.05; 0.01–0.1
B: 0.79; 0.5–0.8
G: 0.5; 0.5–0.8
T m Plastic film temperature (°C)Infrared thermometerInput file
T s Soil surface temperature (°C)Infrared thermometerInput file
T l Temperature at 10 cm below the soil surface (°C)5TEInput file
z Vertical distance between the soil surface and the reference points below the soil surface (m)Experimental design0.1
u Perforation ratio (%)Experimental design4.49 or 12.47
ρ s s Soil’s shortwave reflectivityCalibrated [31]0.15; 0.15–0.3
ε s Soil emissivityCalibrated [31]0.98; 0.78–0.98
β Proportionality factorCalibrated [32]0.45 (−17.3–16.2)
λ Latent heat of vaporisation (MJ kg−1)Determined2.45
b 1 Empirical coefficient of soil thermal conductivity (W m−1 °C−1)Determined0.243
b 2 Empirical coefficient of soil thermal conductivity (W m−1 °C−1)Determined0.393
b 3 Empirical coefficient of soil thermal conductivity (W m−1 °C−1)Determined1.534
θ Volume moisture content (cm3 cm−3)5TEInput file
d Thickness of the gap between plastic film and soil surface (m)Experimental design0.03
k a Air conductivity (W m−1 °C−1)Determined0.02517
N u d Nusselt numberDetermined [33]1
Disclaimer/Publisher’s Note: The statements, opinions and data contained in all publications are solely those of the individual author(s) and contributor(s) and not of MDPI and/or the editor(s). MDPI and/or the editor(s) disclaim responsibility for any injury to people or property resulting from any ideas, methods, instructions or products referred to in the content.

