
The Influence of Different Irrigation Scenarios on the Yield and Sustainability of Wheat Fodder under Hydroponic Conditions


Abstract
:1. Introduction
2. Materials and Methods
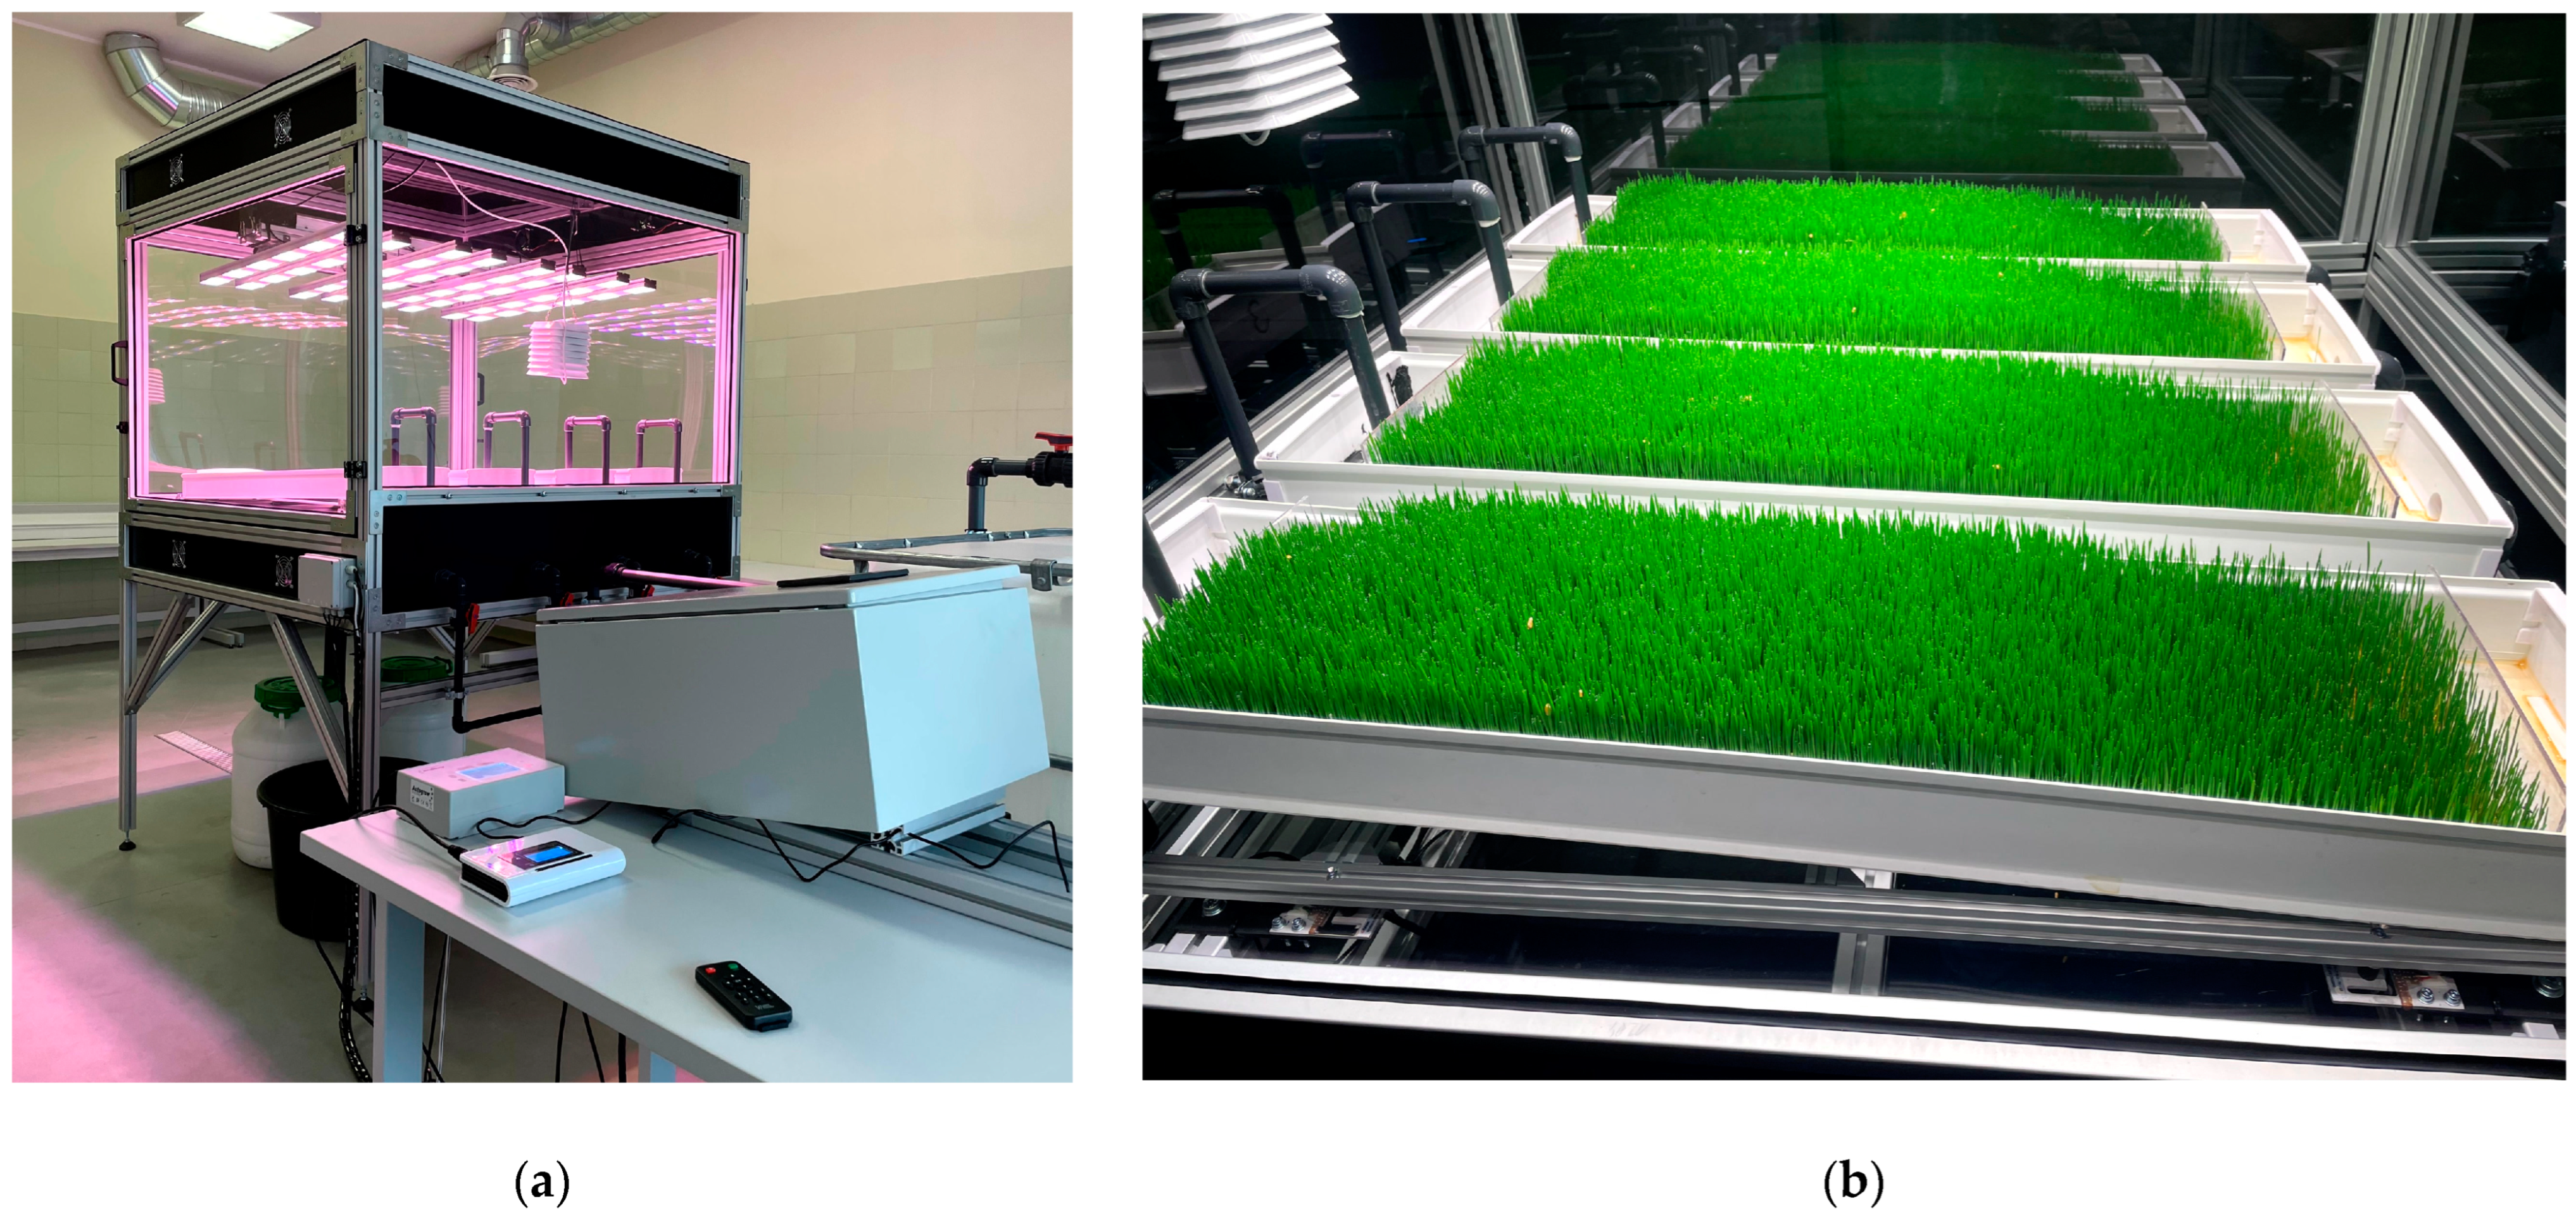
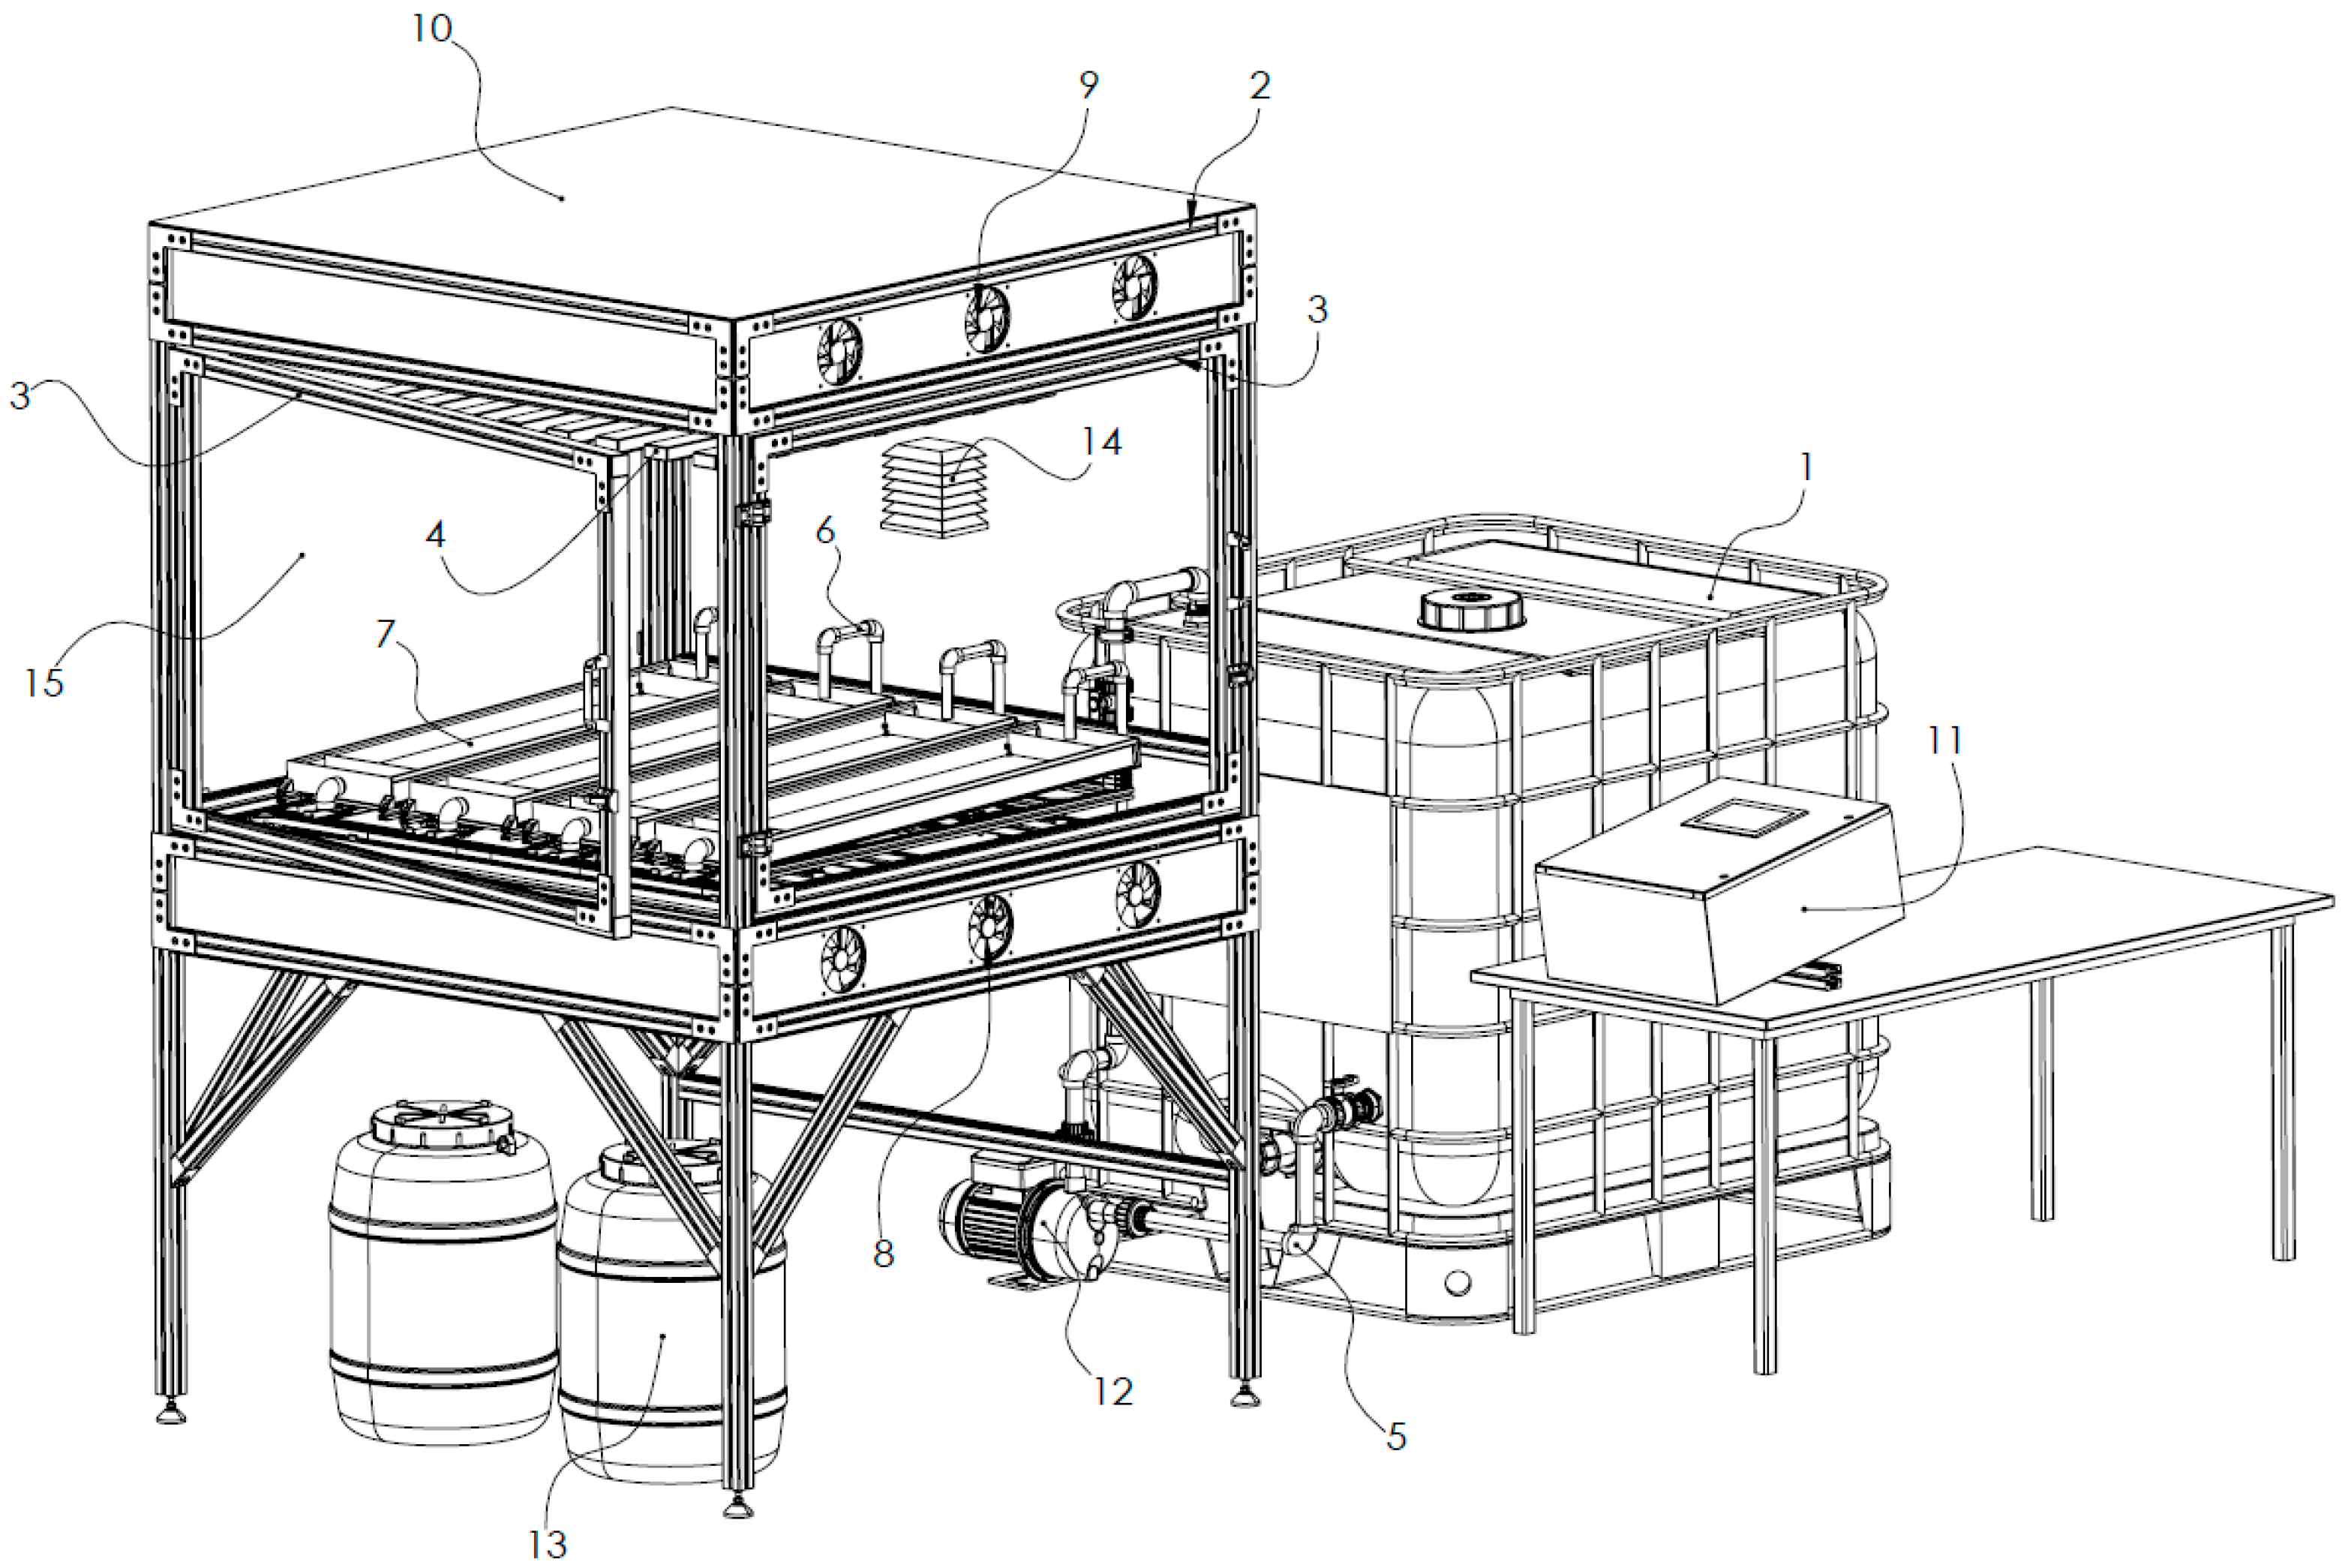
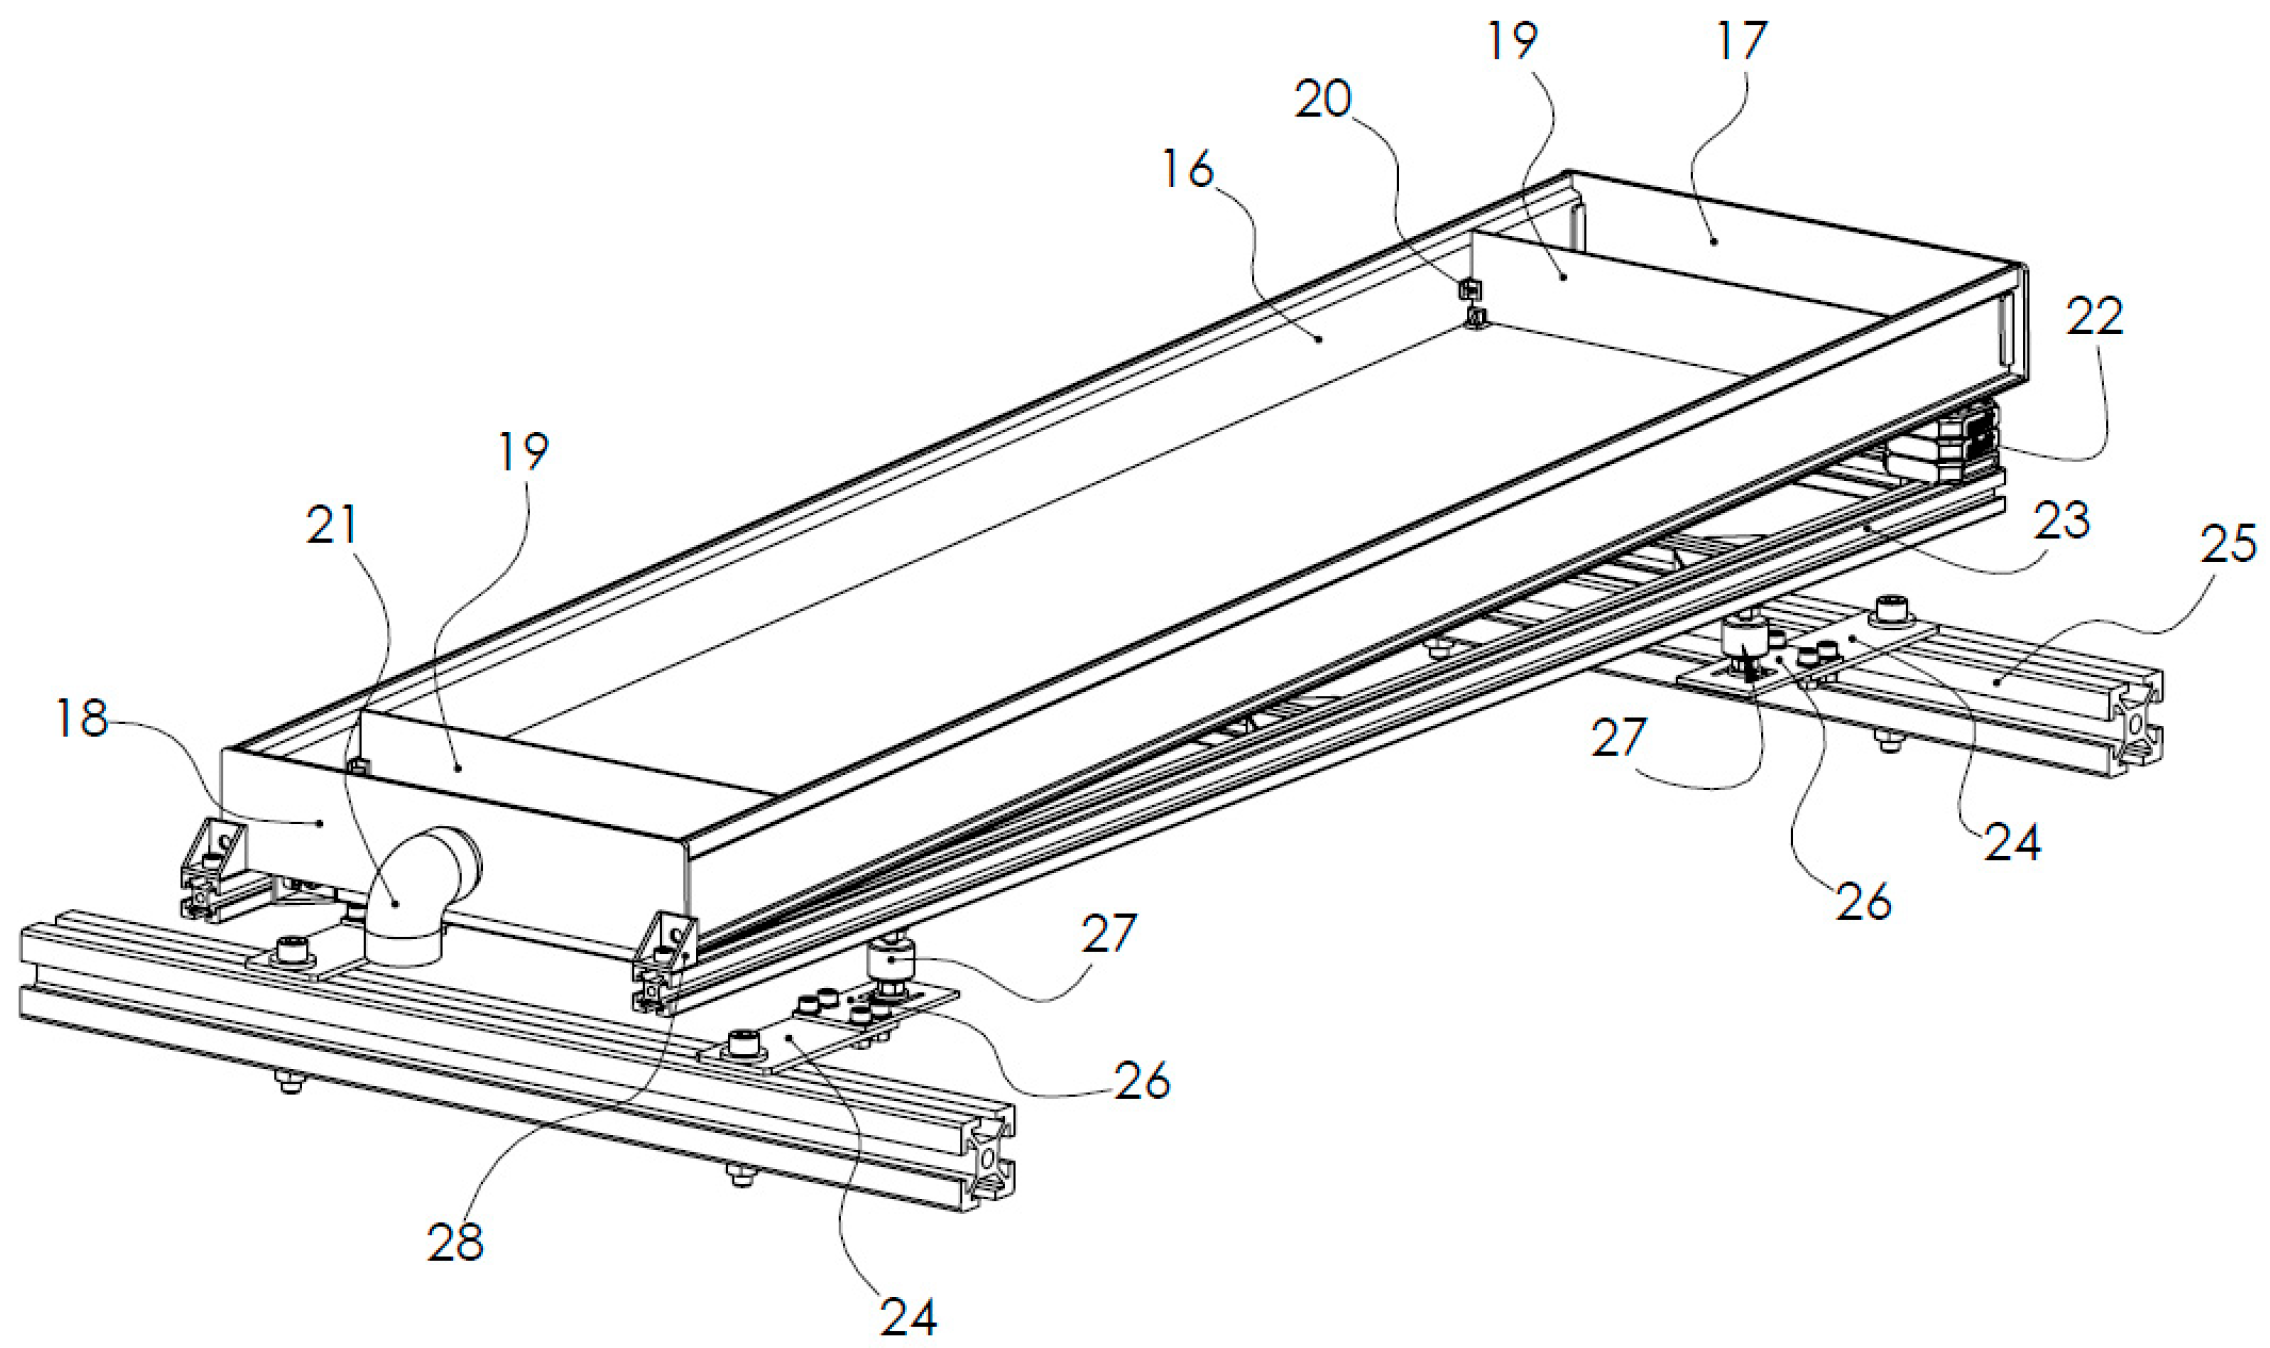
2.1. Preparation for Fodder Cultivation
2.2. Seeds and Their Preparation
2.3. Hydroponic Wheat Fodder Growth Conditions
2.3.1. Irrigation
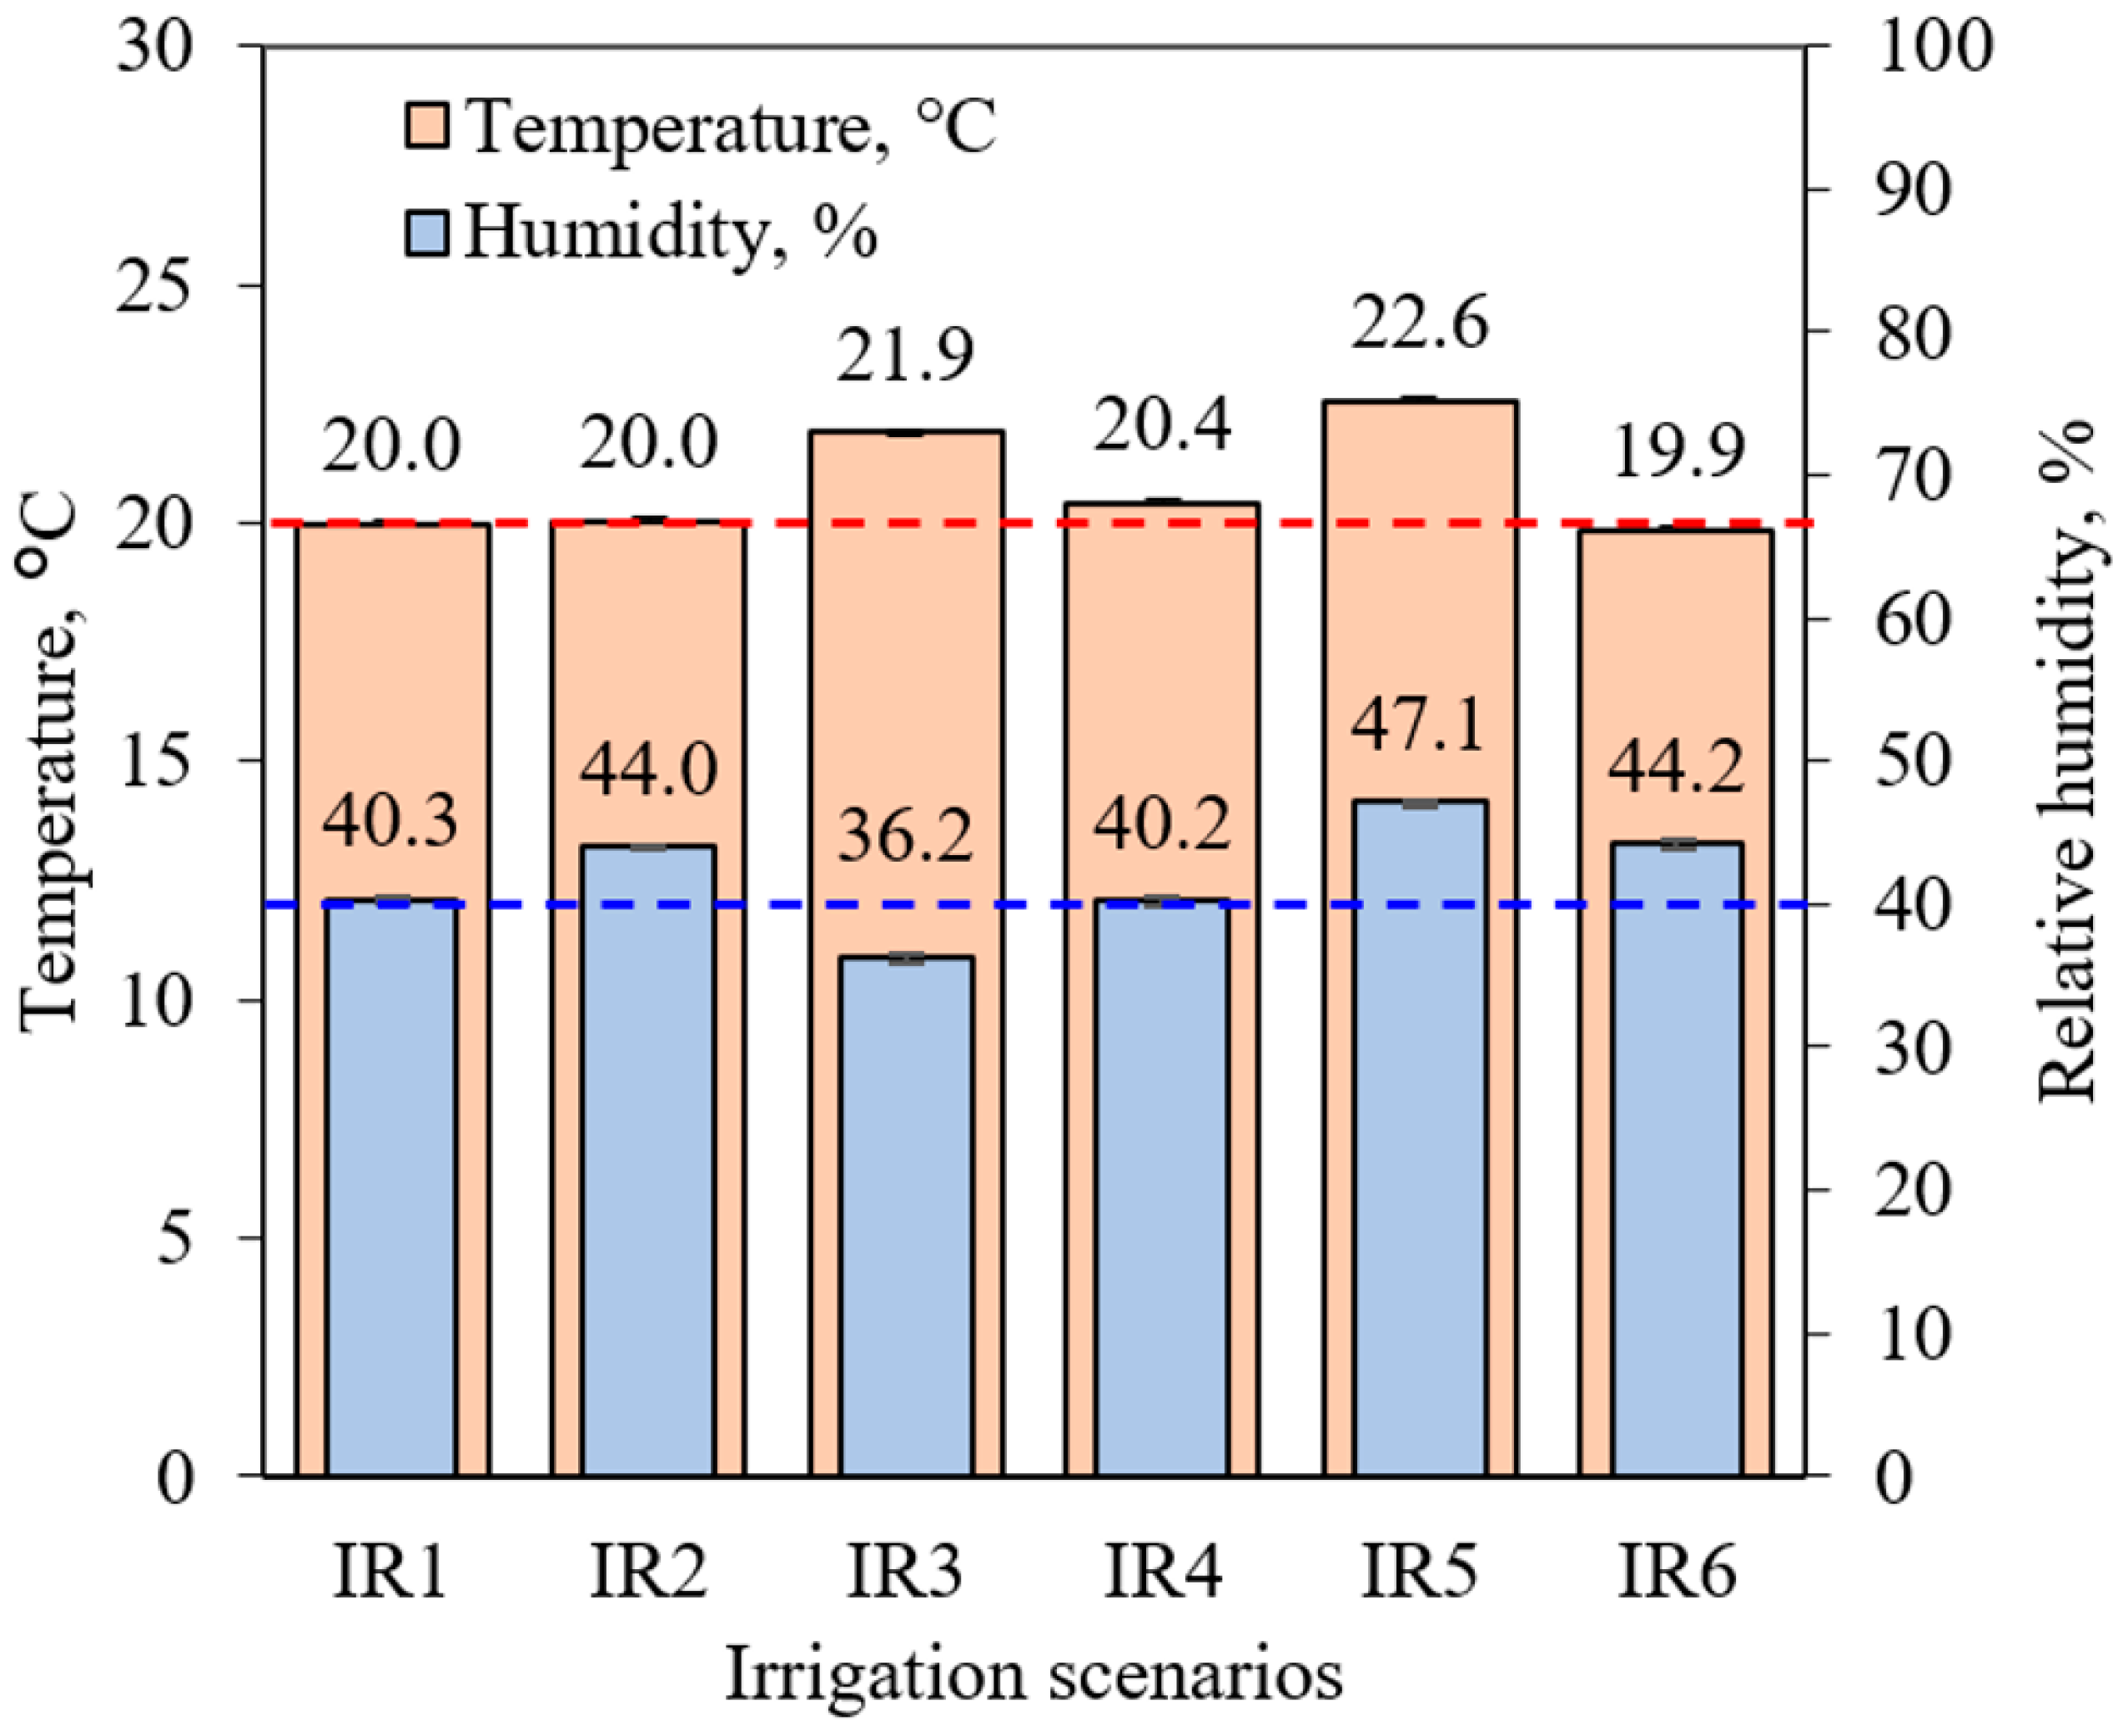
2.3.2. Microclimate
2.3.3. Evaluation Criteria
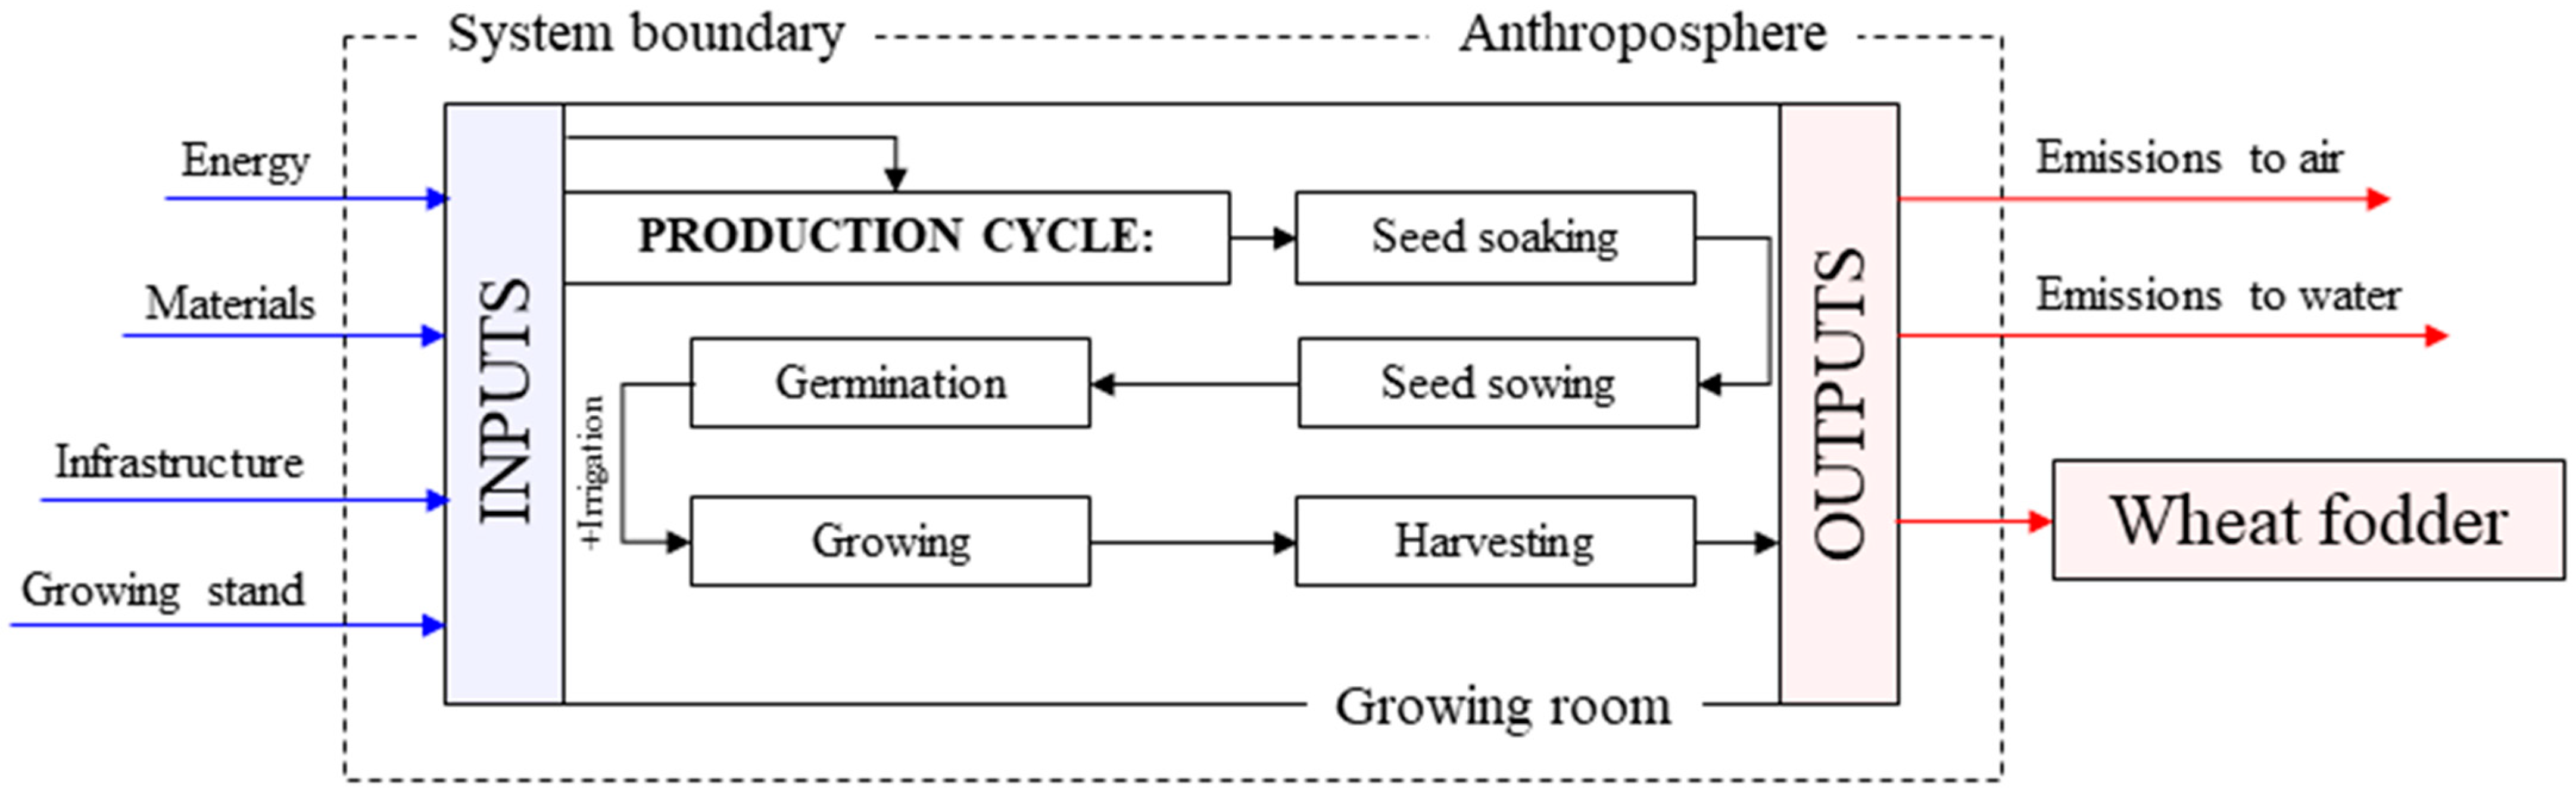
2.4. Life Cycle Assessment
Scope and System Boundaries
2.5. Statistical Analysis
3. Results and Discussion
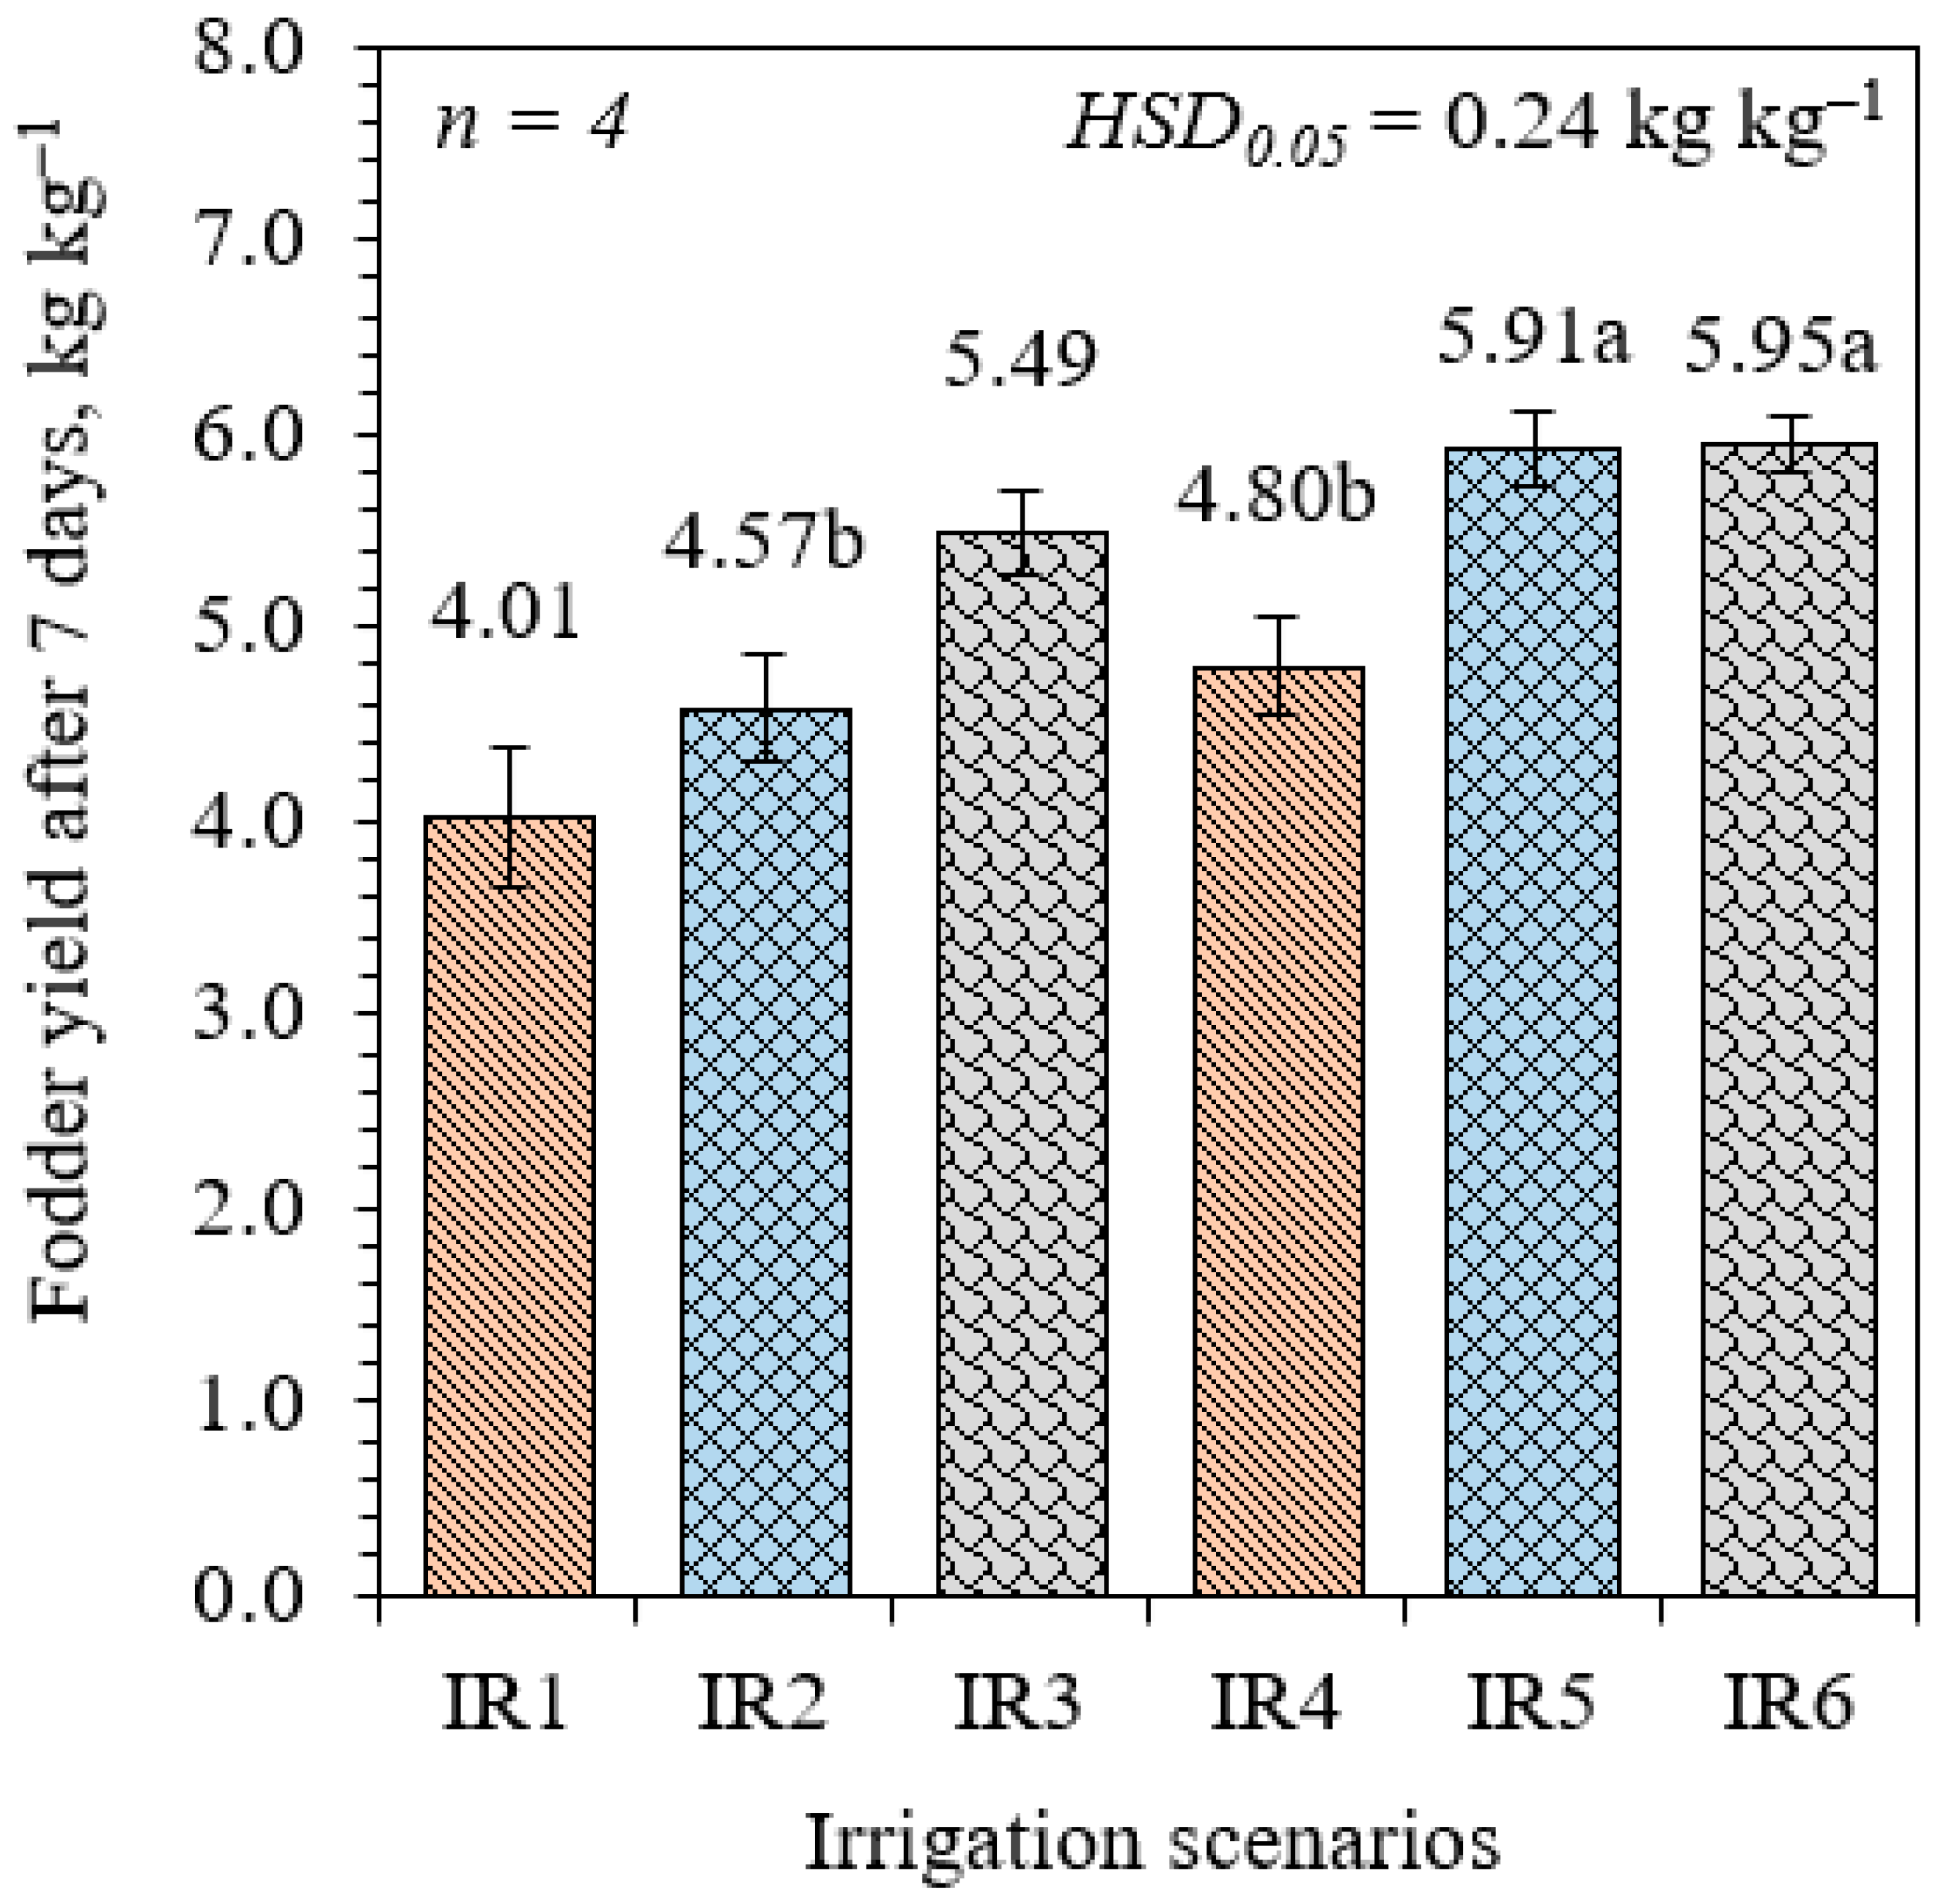
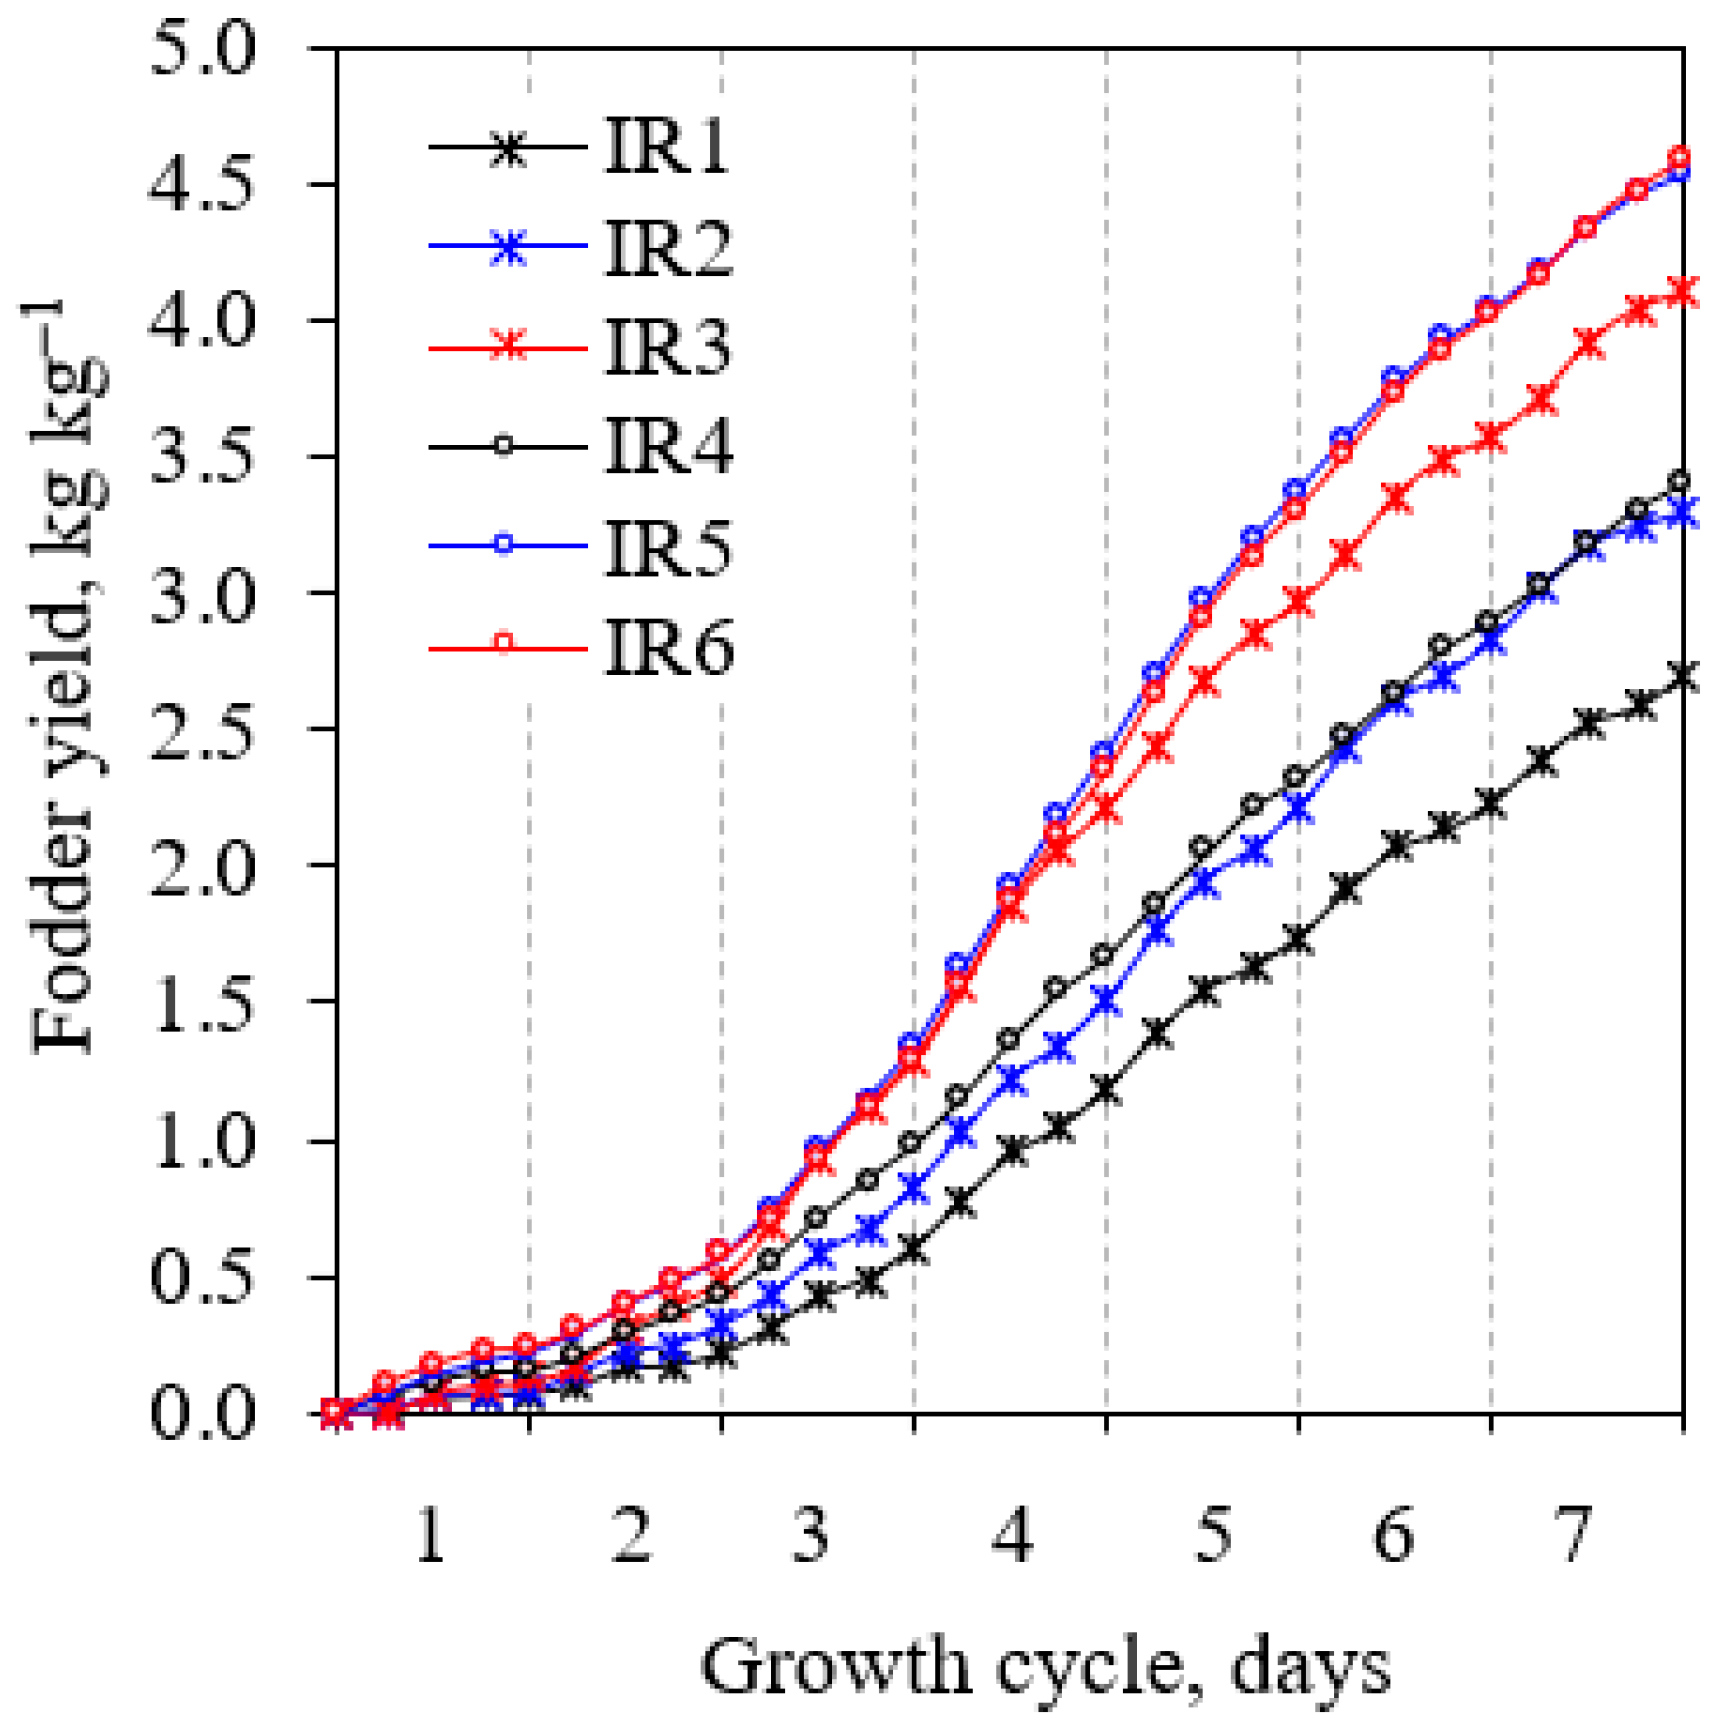
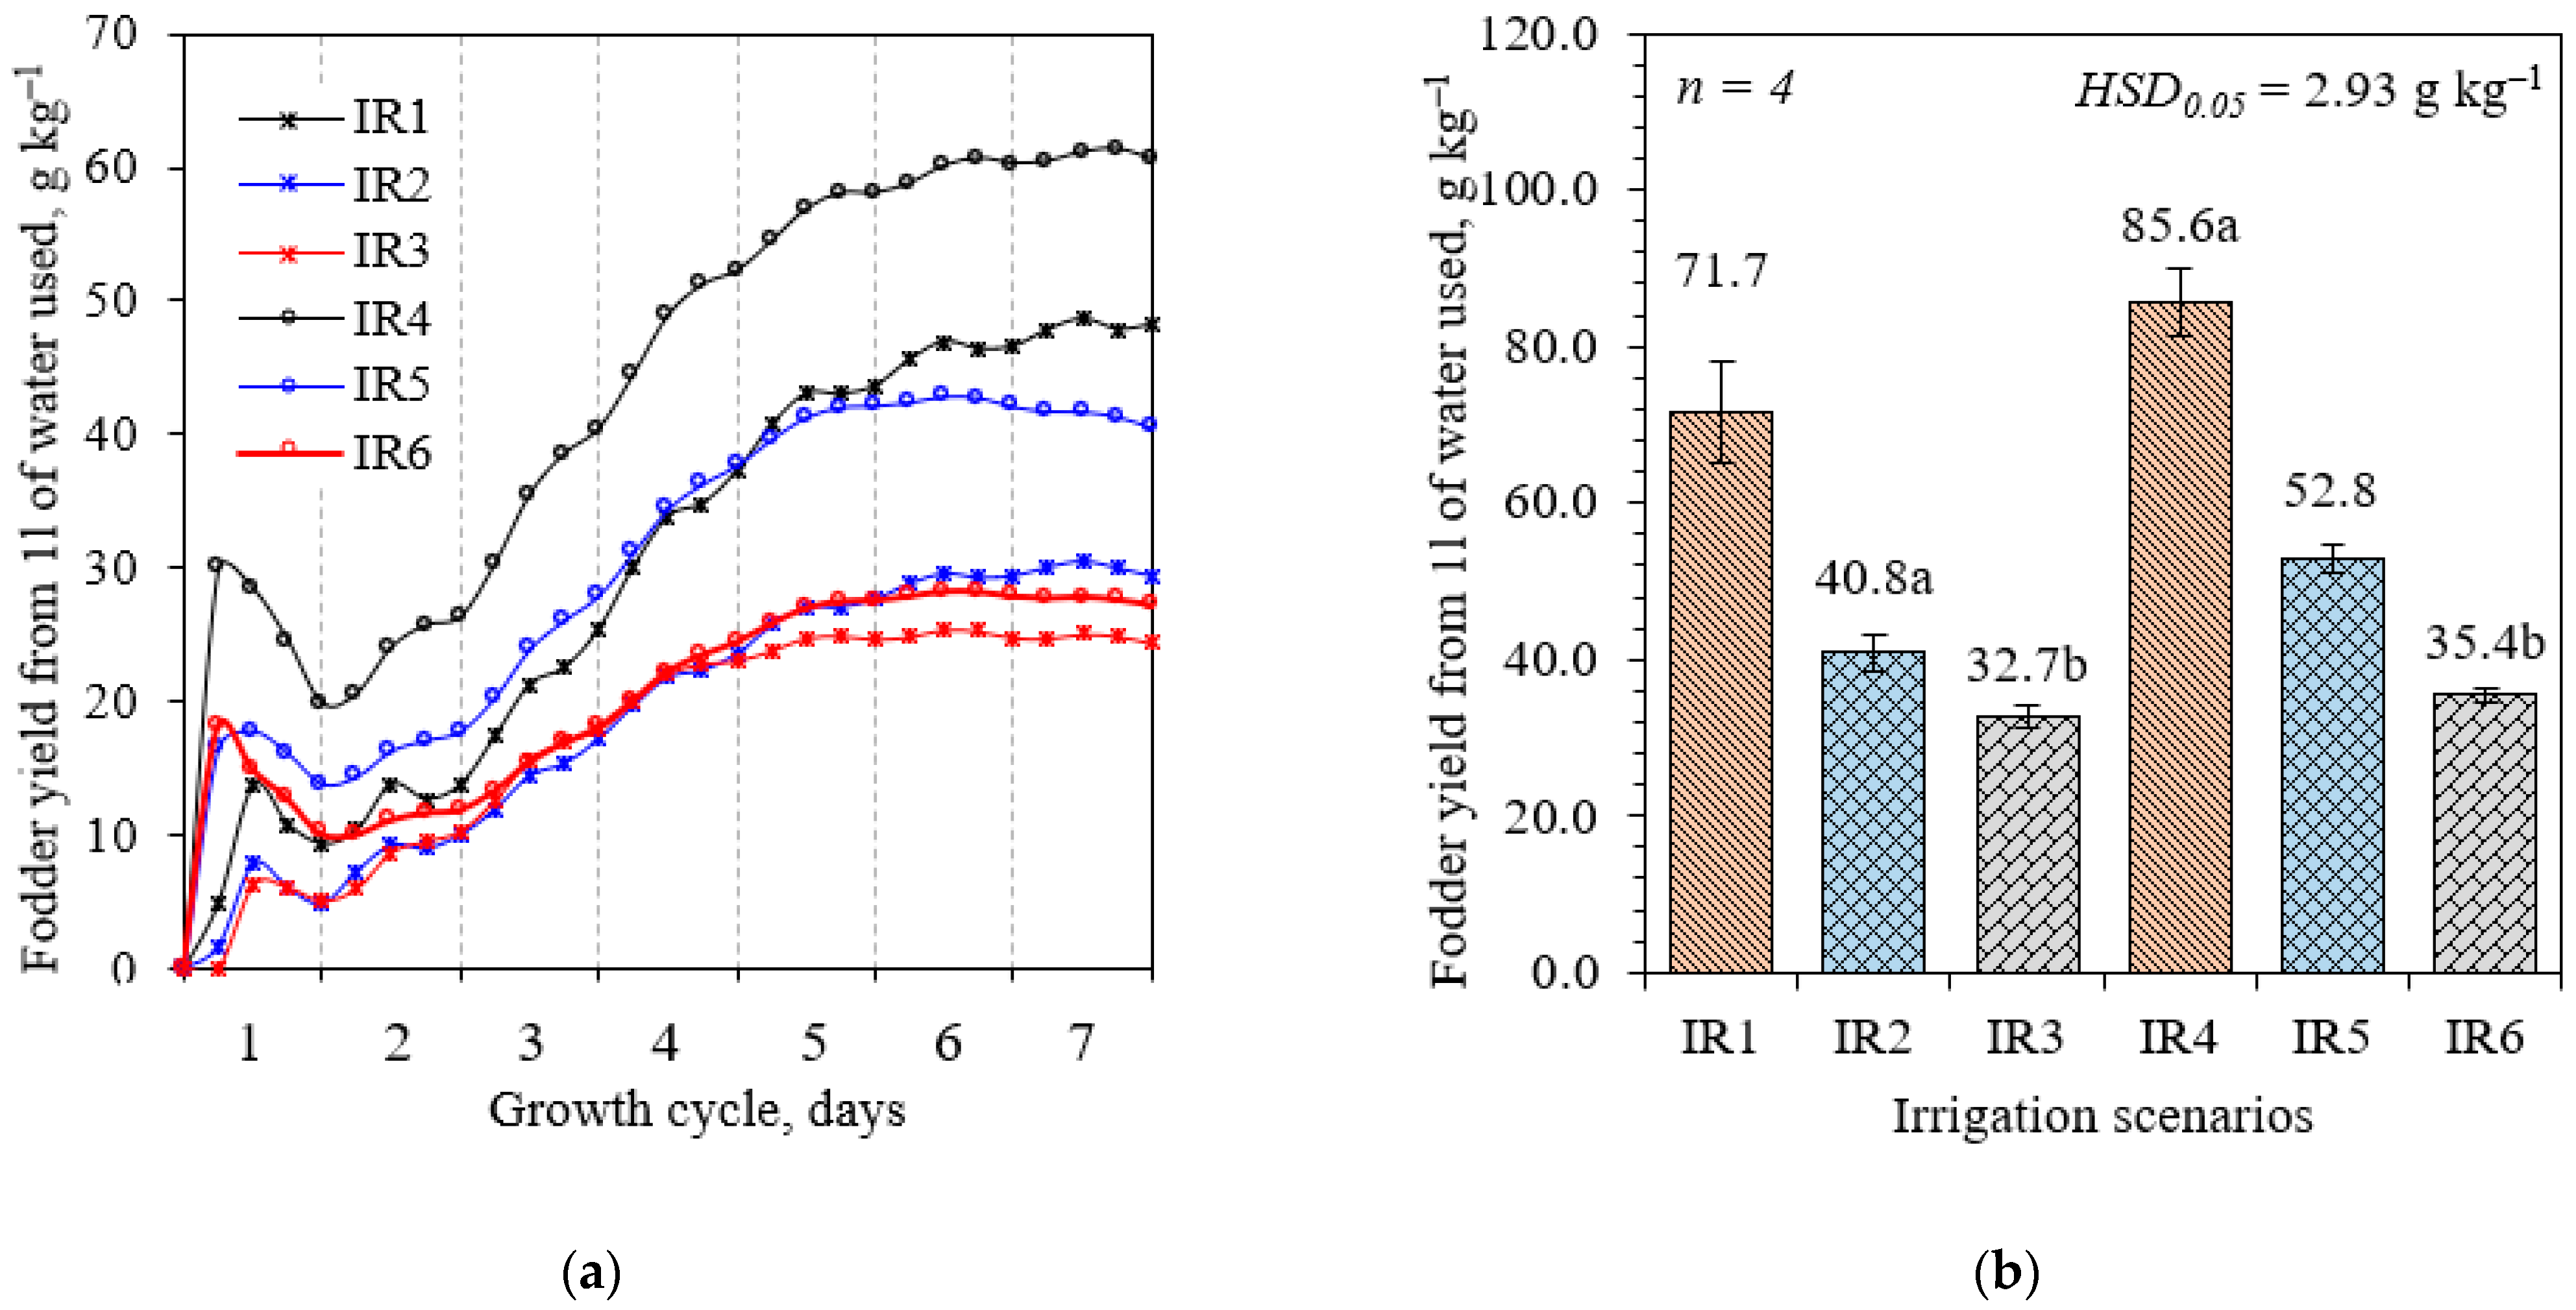
3.1. Wheat Fodder Yield Results
3.2. Environmental Assessment
4. Conclusions
Author Contributions
Funding
Data Availability Statement
Conflicts of Interest
References
- Foley, J.A.; Ramankutty, N.; Brauman, K.A.; Cassidy, E.S.; Gerber, J.S.; Johnston, M.; Mueller, N.D.; O’Connell, C.; Ray, D.K.; West, P.C.; et al. Solutions for a Cultivated Planet. Nature 2011, 478, 337–342. [Google Scholar] [CrossRef] [PubMed]
- Foley, J.A.; DeFries, R.; Asner, G.P.; Barford, C.; Bonan, G.; Carpenter, S.R.; Chapin, F.S.; Coe, M.T.; Daily, G.C.; Gibbs, H.K.; et al. Global Consequences of Land Use. Science (1979) 2005, 309, 570–574. [Google Scholar] [CrossRef] [PubMed]
- Fedoroff, N.V. Food in a Future of 10 Billion. Agric. Food Secur. 2015, 4, 11. [Google Scholar] [CrossRef]
- Molden, D.; Oweis, T.; Steduto, P.; Bindraban, P.; Hanjra, M.A.; Kijne, J. Improving Agricultural Water Productivity: Between Optimism and Caution. Agric. Water Manag. 2010, 97, 528–535. [Google Scholar] [CrossRef]
- Opio, C.; Gerber, P.; Steinfeld, H. Livestock and the Environment: Addressing the Consequences of Livestock Sector Growth. Adv. Anim. Biosci. 2011, 2, 601–607. [Google Scholar] [CrossRef]
- Al-Karaki, G.N.; Al-Hashimi, M. Green Fodder Production and Water Use Efficiency of Some Forage Crops under Hydroponic Conditions. ISRN Agron. 2012, 2012, 1–5. [Google Scholar] [CrossRef]
- Lorenz, K.; Lal, R. Chapter Three—Environmental Impact of Organic Agriculture. In Advances in Agronomy; Sparks, D.L., Ed.; Academic Press: Cambridge, MA, USA, 2016; Volume 139, pp. 99–152. [Google Scholar]
- Putra, P.A.; Yuliando, H. Soilless Culture System to Support Water Use Efficiency and Product Quality: A Review. Agric. Agric. Sci. Procedia 2015, 3, 283–288. [Google Scholar] [CrossRef]
- Grigas, A.; Kemzūraitė, A.; Steponavičius, D. Hydroponic Devices for Green Fodder Production: A Review. Rural. Dev. 2019 2020, 2019, 21–27. [Google Scholar] [CrossRef]
- Ajmi, A.; Salih, A.; Kadim, I.; Othman, Y. Yield and Water Use Efficiency of Barley Fodder Produced under Hydroponic System in GCC Countries Using Tertiary Treated Sewage Effluents. J. Phytol. 2009, 1, 5. [Google Scholar]
- Girma, F.; Gebremariam, B. Review on Hydroponic Feed Value to Livestock Production. J. Sci. Innov. Res. 2018, 7, 106–109. [Google Scholar] [CrossRef]
- Grigas, A.; Kemzūraitė, A.; Steponavičius, D.; Steponavičienė, A.; Domeika, R. Impact of Slope of Growing Trays on Productivity of Wheat Green Fodder by a Nutrient Film Technique System. Water (Basel) 2020, 12, 3009. [Google Scholar] [CrossRef]
- Francis, J.M.; Apgar, G.A.; Crandell, K.G.; Handlos, G.C.; Perry, E.B. The Effects of Hydroponic Wheat Fodder on Fecal Metabolites in Equines. J. Equine Veter Sci. 2018, 70, 84–90. [Google Scholar] [CrossRef]
- Ali, H.S.; Miah, A.G.; Sabuz, S.H.; Asaduzzaman, M.; Salma, U. Dietary Effects of Hydroponic Wheat Sprouted Fodder on Growth Performance of Turkey. Res. Agric. Livest. Fish. 2019, 6, 101–110. [Google Scholar] [CrossRef]
- Sánchez-Del Castillo, F.; Moreno-Pérez, E.D.C.; Contreras Magaña, E.; Morales Gómez, J. Hydroponic Wheat and Barley Fodder Yields and Their Effect on Weight Gain in Sheep. Rev. Chapingo Ser. Hortic. 2013, 19, 35–43. [Google Scholar] [CrossRef]
- Fazaeli, H.; Golmohammadi, H.A.; Shoayee, A.A.; Montajebi, N.; Mosharraf, S.H. Performance of Feedlot Calves Fed Hydroponics Fodder Barley. J. Agric. Sci. Technol 2011, 13, 367–375. [Google Scholar]
- Kide, W.; Desai, B.; Dhekale, J. Feeding Effects of Maize and Barley Hydroponic Fodder on Dry Matter Intake, Nutrient Digestibility and Body Weight Gain of Konkan Kanyal Goats. Life Sci. Int. Res. J. 2015, 2, 96–101. [Google Scholar]
- Adeyemi, T.A.; Adeoye, S.A.; Ogunyemi, T.J.; Adedeji, E.A.; Oluyemi, B.; Ojo, V.O.A. Comparisons of Nutrient Solutions from Organic and Chemical Fertilizer Sources on Herbage Yield and Quality of Hydroponically Produced Maize Fodder. J. Plant Nutr. 2021, 44, 1258–1267. [Google Scholar] [CrossRef]
- Schröder, F.-G.; Lieth, J.H. Irrigation Control in Hydroponics. Hydroponic Prod. Veg. Ornam. 2002, 263–298. [Google Scholar]
- Serraj, R.; Sinclair, T.R. Osmolyte Accumulation: Can It Really Help Increase Crop Yield under Drought Conditions? Plant Cell Environ. 2002, 25, 333–341. [Google Scholar] [CrossRef]
- Haj Sghaier, A.; Tarnawa, Á.; Khaeim, H.; Kovács, G.P.; Gyuricza, C.; Kende, Z. The Effects of Temperature and Water on the Seed Germination and Seedling Development of Rapeseed (Brassica Napus L.). Plants 2022, 11, 2819. [Google Scholar] [CrossRef]
- Khaeim, H.; Kende, Z.; Jolánkai, M.; Kovács, G.P.; Gyuricza, C.; Tarnawa, Á. Impact of Temperature and Water on Seed Germination and Seedling Growth of Maize (Zea Mays L.). Agronomy 2022, 12, 397. [Google Scholar] [CrossRef]
- Karimmojeni, H.; Rahimian, H.; Alizadeh, H.; Yousefi, A.R.; Gonzalez-Andujar, J.L.; Sweeney, E.; Mastinu, A. Competitive Ability Effects of Datura Stramonium L. and Xanthium Strumarium L. on the Development of Maize (Zea Mays) Seeds. Plants 2021, 10, 1922. [Google Scholar] [CrossRef] [PubMed]
- Abido, W.A.E.; Zsombik, L. Effect of Water Stress on Germination of Some Hungarian Wheat Landraces Varieties. Acta Ecol. Sin. 2018, 38, 422–428. [Google Scholar] [CrossRef]
- Hailu, G.; Tesfaye, T.; Ayalkibet, R. Effect of Watering Frequency on Germination and Early Growth of Maize (Zea Mays) Seed. Int. J. Agric. Sci. Food Technol. 2021, 7, 48–52. [Google Scholar]
- Khaeim, H.; Kende, Z.; Balla, I.; Gyuricza, C.; Eser, A.; Tarnawa, Á. The Effect of Temperature and Water Stresses on Seed Germination and Seedling Growth of Wheat (Triticum Aestivum L.). Sustainability 2022, 14, 3887. [Google Scholar] [CrossRef]
- Zeng, Y.J.; Qi, X.N.; Li, Y.Z.; Wang, Y.Q.; Wang, Y.R. Optimising the Preparation Method of Seeds of Agriophyllum Squarrosum Prior to Staining in Tetrazolium Solution. Seed Sci. Technol. 2014, 42, 300–306. [Google Scholar] [CrossRef]
- Saleem, M.S.; Sajid, M.; Ahmed, Z.; Ahmed, S.; Ahmed, N.; Islam, S.U. Effect of Seed Soaking on Seed Germination and Growth of Bitter Gourd Cultivars. J. Agric. Vet. Sci. 2014, 6, 7–11. [Google Scholar] [CrossRef]
- Malakauskas, M.; Kasnauskytė, N.; Kudirkienė, E.; Šernienė, L.; Malakauskas, A.; Stimbirys, A.; Milius, J. Microbiological Evaluation of Drinking Water from Centralized and Small Community Supply Systems in Kaunas Region, Lithuania. Vet. Ir Zootech. 2007, 38, 60. [Google Scholar]
- Roy, P.; Nei, D.; Orikasa, T.; Xu, Q.; Okadome, H.; Nakamura, N.; Shiina, T. A Review of Life Cycle Assessment (LCA) on Some Food Products. J. Food Eng. 2009, 90, 1–10. [Google Scholar] [CrossRef]
- Skowrońska, M.; Filipek, T. Life Cycle Assessment of Fertilizers: A Review. Int. Agrophys 2014, 28, 101–110. [Google Scholar] [CrossRef]
- Finnveden, G.; Hauschild, M.Z.; Ekvall, T.; Guinée, J.; Heijungs, R.; Hellweg, S.; Koehler, A.; Pennington, D.; Suh, S. Recent Developments in Life Cycle Assessment. J. Environ Manag. 2009, 91, 1–21. [Google Scholar] [CrossRef] [PubMed]
- Arvanitoyannis, I.S. ISO 14040: Life Cycle Assessment (LCA)–Principles and Guidelines. Waste Manag. Food Ind. 2008, 97–132. [Google Scholar]
- Finkbeiner, M.; Inaba, A.; Tan, R.; Christiansen, K.; Klüppel, H.-J. The New International Standards for Life Cycle Assessment: ISO 14040 and ISO 14044. Int. J. Life Cycle Assess 2006, 11, 80–85. [Google Scholar] [CrossRef]
- Wernet, G.; Bauer, C.; Steubing, B.; Reinhard, J.; Moreno-Ruiz, E.; Weidema, B. The Ecoinvent Database Version 3 (Part I): Overview and Methodology. Int. J. Life Cycle Assess 2016, 21, 1218–1230. [Google Scholar] [CrossRef]
- Olsson, U.; Engstrand, U.; Rupšys, P. Statistical Methods SAS and MINITAB; LŽŪU Press Center: Akademija, Lithuania, 2000. (In Lithuanian) [Google Scholar]
- Brouwer, R. Distribution of Dry Matter in the Plant. Neth. J. Agric. Sci. 1962, 10, 361–376. [Google Scholar] [CrossRef]
- Raviv, M.; Blom, T.J. The Effect of Water Availability and Quality on Photosynthesis and Productivity of Soilless-Grown Cut Roses. Sci. Hortic. 2001, 88, 257–276. [Google Scholar] [CrossRef]
- Ferrante, A.; Mariani, L. Agronomic Management for Enhancing Plant Tolerance to Abiotic Stresses: High and Low Values of Temperature, Light Intensity, and Relative Humidity. Horticulturae 2018, 4, 21. [Google Scholar] [CrossRef]
- Suazo-López, F.; Zepeda-Bautista, R.; Castillo, F.; Martínez-Hernández, J.; Virgen-Vargas, J.; Tijerina-Chávez, L. Growth and Yield of Tomato (Solanum Lycopersicum L.) as Affected by Hydroponics, Greenhouse and Irrigation Regimes. Annu. Res. Rev. Biol. 2014, 4, 4246–4258. [Google Scholar] [CrossRef]
- Savvas, D.; Stamati, E.; Tsirogiannis, I.L.; Mantzos, N.; Barouchas, P.E.; Katsoulas, N.; Kittas, C. Interactions between Salinity and Irrigation Frequency in Greenhouse Pepper Grown in Closed-Cycle Hydroponic Systems. Agric. Water Manag. 2007, 91, 102–111. [Google Scholar] [CrossRef]
- Katsoulas, N.; Kittas, C.; Dimokas, G.; Lykas, C. Effect of Irrigation Frequency on Rose Flower Production and Quality. Biosyst. Eng. 2006, 93, 237–244. [Google Scholar] [CrossRef]
- Loreti, E.; Perata, P. The Many Facets of Hypoxia in Plants. Plants 2020, 9, 745. [Google Scholar] [CrossRef] [PubMed]
- Armstrong, W.; Drew, M.C. Root Growth and Metabolism under Oxygen Deficiency. In Plant Roots; CRC Press: Boca Raton, FL, USA, 2002; pp. 1139–1187. ISBN 0429221851. [Google Scholar]
- Al-Tawaha, A.R.; Al-Karaki, G.; Al-Tawaha, A.R.; Sirajuddin, S.N.; Makhadmeh, I.; Wahab, P.E.M.; Youssef, R.A.; al Sultan, W.; Massadeh, A. Effect of Water Flow Rate on Quantity and Quality of Lettuce (Lactuca Sativa L.) in Nutrient Film Technique (NFT) under Hydroponics Conditions. Bulg. J. Agric. Sci. 2018, 24, 791–798. [Google Scholar]
- A Ali, E.-S.G.K.A.S. Effect of Flow Rate and Length of Gully on Lettuce Plants in Aquaponic and Hydroponic Systems. J. Aquac. Res. Dev. 2015, 6, 318. [Google Scholar] [CrossRef]
- Genuncio, G.D.C.; Gomes, M.; Ferrari, A.C.; Majerowicz, N.; Zonta, E. Hydroponic Lettuce Production in Different Concentrations and Flow Rates of Nutrient Solution. Hortic. Bras. 2012, 30, 526–530. [Google Scholar] [CrossRef]
- Baiyin, B.; Tagawa, K.; Yamada, M.; Wang, X.; Yamada, S.; Shao, Y.; An, P.; Yamamoto, S.; Ibaraki, Y. Effect of Nutrient Solution Flow Rate on Hydroponic Plant Growth and Root Morphology. Plants 2021, 10, 1840. [Google Scholar] [CrossRef] [PubMed]
- Endut, A.; Jusoh, A.; Ali, N.; Wan Nik, W.N.S.; Hassan, A. Effect of Flow Rate on Water Quality Parameters and Plant Growth of Water Spinach (Ipomoea Aquatica) in an Aquaponic Recirculating System. Desalination Water Treat. 2009, 5, 19–28. [Google Scholar] [CrossRef]
- Soares, H.R.E.; Silva, F.D.F.E.; Da Silva, G.F.; Cruz, A.; Júnior, J.A.S.; Rolim, M.M. Salinity and Flow Rates of Nutrient Solution on Cauliflower Biometrics in NFT Hydroponic System. Rev. Bras. De Eng. Agrícola E Ambient. 2020, 24, 258–265. [Google Scholar] [CrossRef]
- Al-Karaki, G.N.; Al-Momani, N. Evaluation of Some Barley Cultivars for Green Fodder Production and Water Use Efficiency under Hydroponic Conditions. Jordan J. Agric. Sci. 2011, 7, 448–457. [Google Scholar]
- Steponavicius, D.; Raila, A.; Steponaviciene, A.; Lugauskas, A.; Kemzuraite, A. Preventive Measures Reducing Superficial Mycobiotic Contamination of Grain. Ann. Agric. Environ. Med. 2012, 19, 193–201. [Google Scholar]
- McDonnell, G. The Use of Hydrogen Peroxide for Disinfection and Sterilization Applications. In PATAI’S Chemistry of Functional Groups; John Wiley & Sons, Ltd.: Chichester, UK, 2014; pp. 1–34. [Google Scholar]
- Piernas, V.; Guiraud, J.P. Disinfection of Rice Seeds Prior to Sprouting. J. Food Sci. 1997, 62, 611–615. [Google Scholar] [CrossRef]
- Vinci, G.; Rapa, M. Hydroponic Cultivation: Life Cycle Assessment of Substrate Choice. Br. Food J. 2019, 121, 1801–1812. [Google Scholar] [CrossRef]
- Chen, P.; Zhu, G.; Kim, H.-J.; Brown, P.B.; Huang, J.-Y. Comparative Life Cycle Assessment of Aquaponics and Hydroponics in the Midwestern United States. J. Clean Prod. 2020, 275, 122888. [Google Scholar] [CrossRef]
- Raadal, H.L.; Gagnon, L.; Modahl, I.S.; Hanssen, O.J. Life Cycle Greenhouse Gas (GHG) Emissions from the Generation of Wind and Hydro Power. Renew. Sustain. Energy Rev. 2011, 15, 3417–3422. [Google Scholar] [CrossRef]
- Romeo, D.; Vea, E.B.; Thomsen, M. Environmental Impacts of Urban Hydroponics in Europe: A Case Study in Lyon. Procedia CIRP 2018, 69, 540–545. [Google Scholar] [CrossRef]
- Espinosa, N.; García-Valverde, R.; Urbina, A.; Krebs, F.C. A Life Cycle Analysis of Polymer Solar Cell Modules Prepared Using Roll-to-Roll Methods under Ambient Conditions. Sol. Energy Mater. Sol. Cells 2011, 95, 1293–1302. [Google Scholar] [CrossRef]


| Parameters | IR1 | IR2 | IR3 | IR4 | IR5 | IR6 |
|---|---|---|---|---|---|---|
| Irrigation frequency, times day−1 | 4 | 4 | 4 | 8 | 8 | 8 |
| Flow rate, l min−1 | 1 | 2 | 3 | 1 | 2 | 3 |
| Irrigation duration, s | 120 | 120 | 120 | 60 | 60 | 60 |
| Water amount per day, l | 8 | 16 | 24 | 8 | 16 | 24 |
| Impact Category | Abbreviation | Unit |
|---|---|---|
| Marine aquatic ecotoxicity | MAE | kg 1,4-DBeq |
| Abiotic depletion (fossil fuels) | ADf | MJ |
| Global warming | GWP | kg CO2eq |
| Freshwater aquatic ecotoxicity | FWAe | kg 1,4-DBeq |
| Human toxicity | HT | kg 1,4-DBeq |
| Terrestrial ecotoxicity | TE | kg 1,4-DBeq |
| Eutrophication | ET | eq |
| Acidification | ACD | kg SO2eq |
| Photochemical oxidation | PO | kg C2H4eq |
| Abiotic depletion | and | kg Sbeq |
| Ozone layer depletion | ODP | kg CFC-11eq |
| Items | IR1 | IR2 | IR3 | IR4 | IR5 | IR6 | ||||||
|---|---|---|---|---|---|---|---|---|---|---|---|---|
| Total | Per FU | Total | Per FU | Total | Per FU | Total | Per FU | Total | Per FU | Total | Per FU | |
| Tap water | ||||||||||||
| Seed soaking, m3 | 1.2 | 0.082 | 1.2 | 0.072 | 1.2 | 0.062 | 1.2 | 0.071 | 1.2 | 0.057 | 1.2 | 0.057 |
| Irrigation, m3 | 48.0 | 3.3 | 96.0 | 5.8 | 144.0 | 7.4 | 48.0 | 2.8 | 96.0 | 4.6 | 144.0 | 6.9 |
| Electricity | ||||||||||||
| Heating, kWh | 1416.0 | 97.2 | 1416.0 | 85.2 | 1416.0 | 73.0 | 1416.0 | 83.6 | 1416.0 | 67.8 | 1416.0 | 67.4 |
| Lighting, kWh | 2160.0 | 148.2 | 2160.0 | 129.9 | 2160.0 | 111.4 | 2160.0 | 127.5 | 2160.0 | 103.5 | 2160.0 | 102.8 |
| Air movement, kWh | 54.0 | 3.7 | 54.0 | 3.2 | 54.0 | 2.8 | 54.0 | 3.2 | 54.0 | 2.6 | 54.0 | 2.6 |
| Dehumidifier, kWh | 144.0 | 9.9 | 144.0 | 8.7 | 144.0 | 7.4 | 144.0 | 8.5 | 144.0 | 6.9 | 144.0 | 6.9 |
| Irrigation, kWh | 8.4 | 0.6 | 8.4 | 0.5 | 8.4 | 0.4 | 8.4 | 0.5 | 8.4 | 0.4 | 8.4 | 0.4 |
| Raw materials | ||||||||||||
| Wheat seeds, kg | 3531.43 | 242.4 | 3531.43 | 212.4 | 3531.43 | 182.2 | 3531.43 | 208.5 | 3531.43 | 169.2 | 3531.43 | 168.1 |
| Sodium hypochlorite, kg | 49.98 | 3.4 | 49.98 | 3.0 | 49.98 | 2.6 | 49.98 | 3.0 | 49.98 | 2.4 | 49.98 | 2.4 |
| Transportation | ||||||||||||
| Seeds, km | 1.2 | 0.1 | 1.2 | 0.1 | 1.2 | 0.1 | 1.2 | 0.1 | 1.2 | 0.1 | 1.2 | 0.1 |
| Construction a | ||||||||||||
| Growing stands | ||||||||||||
| Aluminium, kg | 1.64 | 0.11 | 1.64 | 0.10 | 1.64 | 0.08 | 1.64 | 0.10 | 1.64 | 0.08 | 1.64 | 0.08 |
| Polyvinyl chloride PVC, kg | 19.56 | 1.34 | 19.56 | 1.18 | 19.56 | 1.01 | 19.56 | 1.15 | 19.56 | 0.94 | 19.56 | 0.93 |
| Lighting | ||||||||||||
| Alluminium cast alloy, kg | 1.2 × 10⁻¹ | 8.4 × 10⁻³ | 1.2 × 10⁻¹ | 7.4 × 10⁻³ | 1.2 × 10⁻¹ | 6.3 × 10⁻³ | 1.2 × 10⁻¹ | 7.2 × 10⁻³ | 1.2 × 10⁻¹ | 5.9 × 10⁻³ | 1.2 × 10⁻¹ | 5.8 × 10⁻³ |
| Steel, kg | 2.6 × 10⁻³ | 1.8 × 10⁻⁴ | 2.6 × 10⁻³ | 1.5 × 10⁻⁴ | 2.6 × 10⁻³ | 1.3 × 10⁻⁴ | 2.6 × 10⁻³ | 1.5 × 10⁻⁴ | 2.6 × 10⁻³ | 1.2 × 10⁻⁴ | 2.6 × 10⁻³ | 1.2 × 10⁻⁴ |
| Copper, kg | 2.4 × 10⁻⁴ | 1.6 × 10⁻⁵ | 2.4 × 10⁻⁴ | 1.4 × 10⁻⁵ | 2.4 × 10⁻⁴ | 1.2 × 10⁻⁵ | 2.4 × 10⁻⁴ | 1.4 × 10⁻⁵ | 2.4 × 10⁻⁴ | 1.1 × 10⁻⁵ | 2.4 × 10⁻⁴ | 1.1 × 10⁻⁵ |
| Polyvinyl chloride PVC, kg | 9.5 × 10⁻³ | 6.5 × 10⁻⁴ | 9.5 × 10⁻³ | 5.7 × 10⁻⁴ | 9.5 × 10⁻³ | 4.9 × 10⁻⁴ | 9.5 × 10⁻³ | 5.6 × 10⁻⁴ | 9.5 × 10⁻³ | 4.5 × 10⁻⁴ | 9.5 × 10⁻³ | 4.5 × 10⁻⁴ |
| Glass, kg | 9.4 × 10⁻³ | 6.4 × 10⁻⁴ | 9.4 × 10⁻³ | 5.6 × 10⁻⁴ | 9.4 × 10⁻³ | 4.8 × 10⁻⁴ | 9.4 × 10⁻³ | 5.5 × 10⁻⁴ | 9.4 × 10⁻³ | 4.5 × 10⁻⁴ | 9.4 × 10⁻³ | 4.5 × 10⁻⁴ |
| Irrigation | ||||||||||||
| Polyvinyl chloride PVC, kg | 2.7 × 10⁻¹ | 1.8 × 10⁻² | 2.7 × 10⁻¹ | 1.6 × 10⁻² | 2.7 × 10⁻¹ | 1.4 × 10⁻² | 2.7 × 10⁻¹ | 1.6 × 10⁻² | 2.7 × 10⁻¹ | 1.3 × 10⁻² | 2.7 × 10⁻¹ | 1.3 × 10⁻² |
| Cast iron, kg | 1.2 × 10⁻¹ | 8.4 × 10⁻³ | 1.2 × 10⁻¹ | 7.4 × 10⁻³ | 1.2 × 10⁻¹ | 6.3 × 10⁻³ | 1.2 × 10⁻¹ | 7.2 × 10⁻³ | 1.2 × 10⁻¹ | 5.9 × 10⁻³ | 1.2 × 10⁻¹ | 5.8 × 10⁻³ |
| El. Motor 2,4 kW, piece | 1.6 × 10⁻² | 1.1 × 10⁻³ | 1.6 × 10⁻² | 9.8 × 10⁻⁴ | 1.6 × 10⁻² | 8.4 × 10⁻⁴ | 1.6 × 10⁻² | 9.7 × 10⁻⁴ | 1.6 × 10⁻² | 7.8 × 10⁻⁴ | 1.6 × 10⁻² | 7.8 × 10⁻⁴ |
| Outputs | ||||||||||||
| Wheat fodder, t | 14.57 | 16.63 | 19.39 | 16.94 | 20.88 | 21.01 | ||||||
| Impact Category | Unit | IR1 | IR2 | IR3 | IR4 | IR5 | IR6 |
|---|---|---|---|---|---|---|---|
| MAE | kg 1,4-DBeq | 44,032.5 | 40,219.7 | 35,902.8 | 37,872.1 | 32,033.2 | 33,134.4 |
| ADf | MJ | 1372.9 | 1213.8 | 1050.4 | 1180.8 | 966.7 | 969.4 |
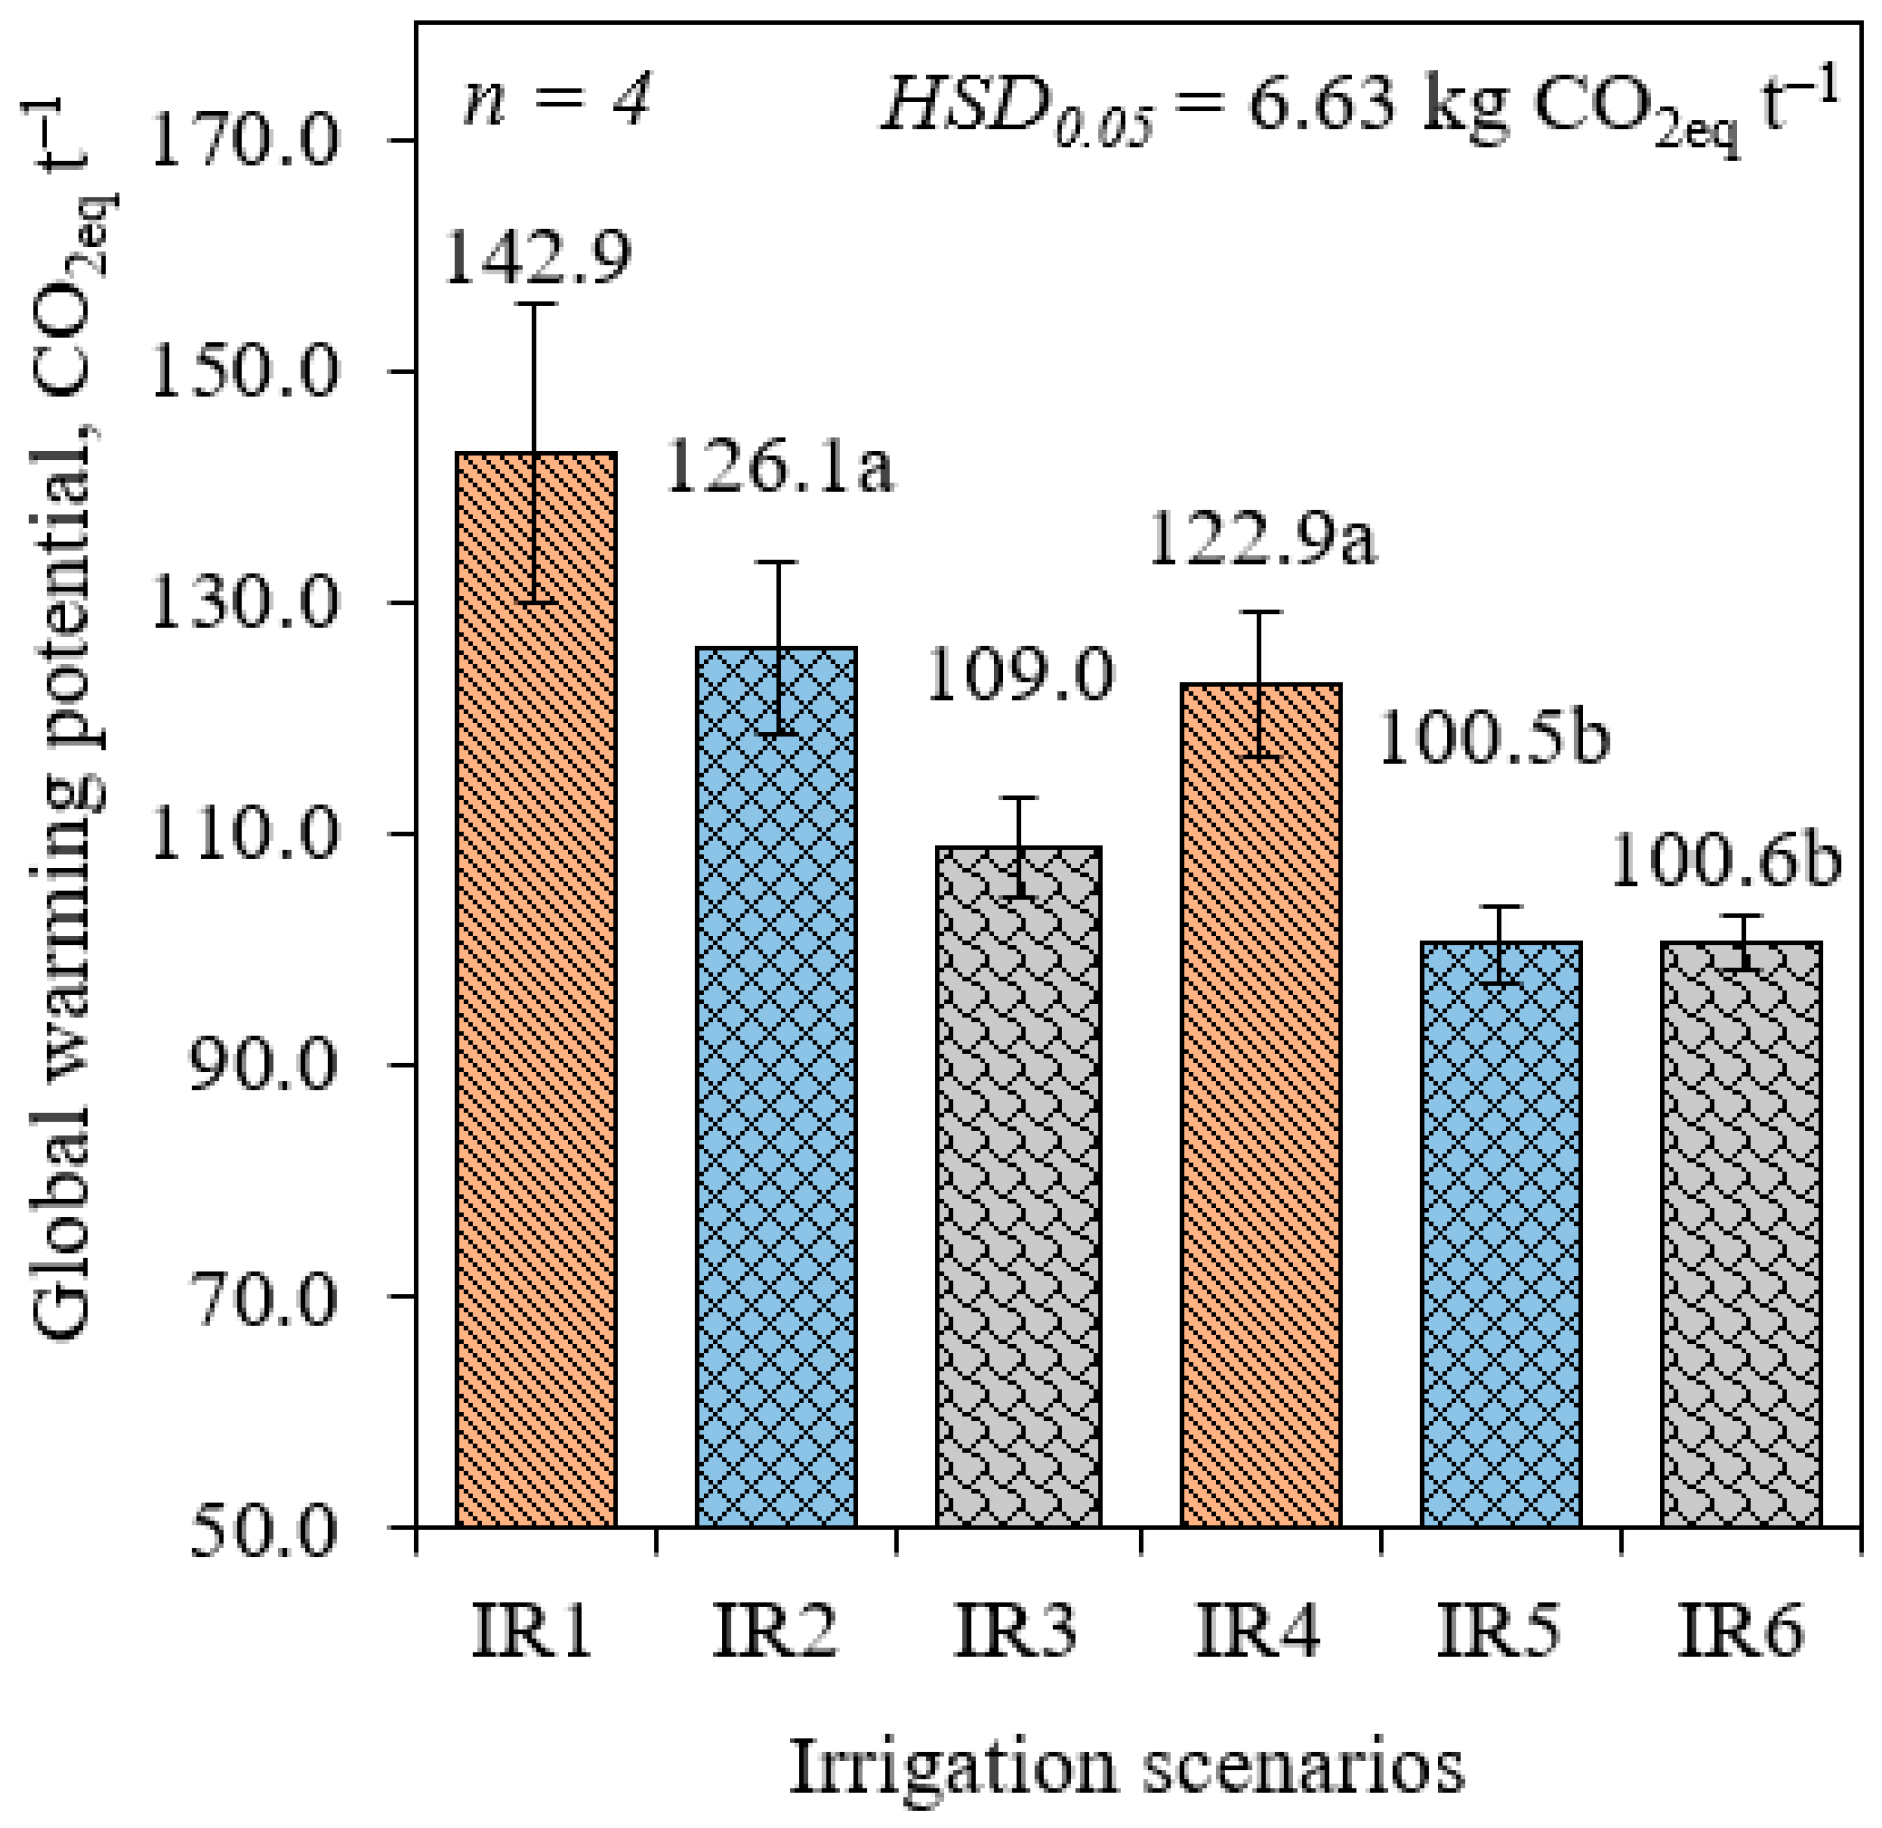
| GWP | kg CO2eq | 142.8 | 126.1 | 109.0 | 122.8 | 100.4 | 100.6 |
| FWAe | kg 1,4-DBeq | 33.6 | 30.1 | 26.4 | 28.8 | 24.0 | 24.4 |
| HT | kg 1,4-DBeq | 26.8 | 24.2 | 21.3 | 23.0 | 19.2 | 19.6 |
| TE | kg 1,4-DBeq | 1.5 | 1.3 | 1.1 | 1.3 | 1.0 | 1.0 |
| ET | kg PO4−eq | 1.0 | 0.9 | 0.7 | 0.9 | 0.7 | 0.7 |
| ACD | kg SO2eq | 0.8 | 0.7 | 0.6 | 0.7 | 0.6 | 0.6 |
| PO | kg C2H4eq | 6.3 × 10⁻³ | 5.8 × 10⁻³ | 5.2 × 10⁻³ | 5.4 × 10⁻³ | 4.6 × 10⁻³ | 4.8 × 10⁻³ |
| ADn | kg Sbeq | 9.6 × 10⁻⁵ | 8.9 × 10⁻⁵ | 8.0 × 10⁻⁵ | 8.2 × 10⁻⁵ | 7.0 × 10⁻⁵ | 7.4 × 10⁻⁵ |
| ODP | kg CFC-11eq | 4.8 × 10⁻⁶ | 4.3 × 10⁻⁶ | 3.7 × 10⁻⁶ | 4.1 × 10⁻⁶ | 3.4 × 10⁻⁶ | 3.4 × 10⁻⁶ |
Disclaimer/Publisher’s Note: The statements, opinions and data contained in all publications are solely those of the individual author(s) and contributor(s) and not of MDPI and/or the editor(s). MDPI and/or the editor(s) disclaim responsibility for any injury to people or property resulting from any ideas, methods, instructions or products referred to in the content. |
© 2023 by the authors. Licensee MDPI, Basel, Switzerland. This article is an open access article distributed under the terms and conditions of the Creative Commons Attribution (CC BY) license (https://creativecommons.org/licenses/by/4.0/).
Share and Cite
Grigas, A.; Savickas, D.; Steponavičius, D.; Niekis, Ž.; Balčiūnas, J. The Influence of Different Irrigation Scenarios on the Yield and Sustainability of Wheat Fodder under Hydroponic Conditions. Agronomy 2023, 13, 860. https://doi.org/10.3390/agronomy13030860
Grigas A, Savickas D, Steponavičius D, Niekis Ž, Balčiūnas J. The Influence of Different Irrigation Scenarios on the Yield and Sustainability of Wheat Fodder under Hydroponic Conditions. Agronomy. 2023; 13(3):860. https://doi.org/10.3390/agronomy13030860
Chicago/Turabian StyleGrigas, Andrius, Dainius Savickas, Dainius Steponavičius, Žygimantas Niekis, and Jonas Balčiūnas. 2023. "The Influence of Different Irrigation Scenarios on the Yield and Sustainability of Wheat Fodder under Hydroponic Conditions" Agronomy 13, no. 3: 860. https://doi.org/10.3390/agronomy13030860