Article

Relationship between Phosphorus and Nitrogen Concentrations of Flax

1
Crop Research Institute, Gansu Academy of Agricultural Sciences (GASS), Lanzhou 730070, China
2
College of Agronomy, Gansu Agricultural University (GSAU), Lanzhou 730070, China
3
State Key Laboratory of Aridland Crop Science, Gansu Agricultural University (GSAU), Lanzhou 730070, China
4
Key Laboratory of Hexi Corridor Resources Utilization of Gansu, Hexi University, Zhangye 734000, China
5
College of Mechanical and Electrical Engineering, Gansu Agricultural University (GSAU), Lanzhou 730070, China
6
Zhangye Water-Saving Agricultural Experimental Station, Gansu Academy of Agricultural Sciences (GAAS), Zhangye 734000, China
*
Author to whom correspondence should be addressed.
Agronomy 2023, 13(3), 856; https://doi.org/10.3390/agronomy13030856
Submission received: 29 January 2023 / Revised: 9 March 2023 / Accepted: 13 March 2023 / Published: 15 March 2023

Abstract

:
Tools quantifying phosphorus (P) status in plants help to achieve efficient management and to optimize crop yield. The objectives of this study were to establish the relationship between P and nitrogen (N) concentrations of flax (Linum usitatissimum L.) during the growth season to determine the critical P concentration for diagnosing P deficiency. Field experiments were arranged as split plots based on a randomized complete block design. Phosphorus levels (0, 40, 80, 120, and 160 kgP2O5 ha−1) were assigned to the main plots, and cultivars (Dingya 22, Lunxuan 2, Longyaza 1, Zhangya 2, and Longya 14) were allocated to the subplots. Shoot biomass (SB) and P and N concentrations were determined at 47, 65, 74, 98, and 115 days after emergence. Shoot biomass increased, while P and N concentrations and the N:P ratio declined with time in each year. The P concentration in respect of N concentration was described using a liner relationship (P = 0.05, N + 1.68, R2 = 0.76, p < 0.01) under non-limiting P conditions, in which the concentrations are expressed in g kg−1 dry matter (DM). The N:P ratio was fitted to a second-order polynomial equation (N:P = 11.56 × SB−0.1, R2 = 0.71, p = 0.03), based on the SB of flax. This research first developed a predictive model for critical P concentration in flax, as a function of N concentration in shoots of flax. The critical P concentration can be used as a promising alternative tool to quantify the degree of P deficiency of flax during the current growing season.

1. Introduction

Rock phosphate reserves are finite, non-renewable, and rapidly shrinking due to use in phosphorus (P) fertilizers [1]. Further, with the growing human population, the oversupply of P fertilizers in agriculture to maximize crop yield has resulted in a series of environmental, ecological, and human health issues [2,3]. Therefore, diagnosing P nutrient status and optimizing P fertilizer management have become important topics in agriculture production.
Flax (Linum usitatissimum L.) is an important oil crop and is used as an industrial material [4,5]. Many studies have shown that improving the productivity of flax to meet growing demands is worth investigating as flaxseed has functional nutritional ingredients for human health [4,5], flax oil is used in biodiesel production [6,7,8,9], and flax shives are used as a biosorbent and biochar after processing of fiber [10,11]. Thereafter, precise management of P fertilization of flax has become a core area of research [12].
A method to diagnose P nutrition, based on the relationship between P and N concentrations during growth, was proposed earlier on the basis of the relationship between P and N concentrations during growth [13]. A number of researchers have documented that N and P concentrations decrease with increasing plant biomass during crop growth [14,15,16]. With the dilution of N and P in plant biomass, P concentrations decrease when N is limiting [17]. The positive relationship between P and N concentrations was proposed by Kamprath [18] and reflects the dilution of both elements with increasing shoot biomass as well as indicating the effect of crop N status on P absorption in plants. The relationship between shoot N and P concentrations has also been reported in wheat [19,20,21], maize [22], rapeseed [23], and forage grasses [15,24]. The coupling of P and N is carried out through different mechanisms, such as N availability in accelerating P cycling [25], the availability of P on N cycling [26,27] and the control of biological N fixation [28]. Furthermore, P regulates N uptake and translocation, and vice versa [14,17,29]. Given the close balance and synergy of N and P in crops [14,30], it is crucial to assess the level of N deficiency and estimate the critical P concentration. At the same time, due to the decrease in N and P concentrations with increasing shoot biomass, use of the N:P ratio was also proposed for diagnostic purposes [13]. Use of the N:P ratio to detect the nature of nutrient limitations was also proposed by Koerselman and Meuleman [31] on natural ecosystems and by Sinclair et al. [32] on cut white clover/ryegrass swards. Moreover, Güsewell [14] and Greenwood et al. [33] reported that the N to P ratio decreases as plants grow larger. This could be because the relative decline in P concentration is lower compared to that in N concentration [24,33]. The necessity of a multi-element integrated approach to nutrition in crops is highlighted by the interaction between N and P in crops [16]. However, this relationship between P and N concentrations in shoots of flax under different P fertilization levels and the application of this the relationship in evaluating the critical P concentration have not been extensively studied in flax.
The objectives of this study were to elucidate the relationship between P and N concentrations of flax using data from experiments with five P rates, and with various flax cultivars grown under non-limiting P conditions. Specifically, we wanted to determine the critical P concentration using the relationship for shoot growth, which could be used to diagnose and quantify P deficiency in flax.

2. Materials and Methods

2.1. Site Description, Experimental Design and Treatments

Field experiments 1 and 2 were conducted at Dingxi Academy of Agricultural Science (34.26° N, 103.52° E, and altitude 2060 m) in 2017 and 2018 in Gansu, China; experiments 3 and 4 were carried out at Yongdeng (36°02′ N, 103°40′ E, altitude 2149 m) in 2018 and 2019, in Gansu, China. The two sites have a continental climate. The soil type is Arenosols [19]. Wheat was the previous crop for the four experiments.
Monthly mean temperatures over the growing season, from March to August, ranged from −4 to 26 °C at Dingxi and from −5 to 26 °C at Yongdeng. The lowest temperature was recorded in March and the highest value in July for the four-year sites. The monthly mean temperatures each year was close to the long-term average (30 yr). In brief, total precipitation over the growing season in March to August was from 264 to 259 mm at Dingxi and from 275 to 262 mm at Yongdeng.
The experiments were arranged as split plots based on a randomized complete block design with three replicates, with a plot size of 5.0 m × 4.0 m. Five P rates (0, 40, 80, 120, and 160 kg P2O5 ha−1) were assigned to the main plots, with five cultivars (Dingxi: Lunxuan 2 and Dingya 22; and Yongdeng: Longyaza 1, Zhangya 2, and Longya 14, respectively) allocated to the subplots. Urea, calcium superphosphate, and potassium sulfate were incorporated into the top 30 cm of soil prior to sowing. The K rate was 52.5 kg K2O ha−1, and the N rate was 80 kg N ha−1 to flax. All of the P and K was used as the base fertilizer for flax while 75% of N was applied as the base fertilizer before sowing, and 25% as topdressing at the budding stage. The crop was only irrigated once, prior to flowering, and each plot received 40 mm of irrigation with pipes of 13 cm in diameter. A water meter installed at the discharging end of the pipes measured and recorded the amount of irrigation. Other crop management procedures followed along local agricultural practices to ensure maximum potential productivity.

2.2. Preplant Soil Sampling and Analysis

The soil samples were collected from a depth of 0–30 cm before the application of P fertilizer and were air dried. Soil pH was determined using the solution of 10 g soil: 10 mL water [34]. The analysis of available P was determined using the Colorimetric Molybdenum-Blue method according to Olsen et al. [35]. The micro-Kjeldahl method was used to quantify total N concentration [36]. Available K was measured by flame emission spectroscopy [36]. In brief, the basic information of soil in Dingxi of 2017 plots contains an organic matter of 10.2 g kg−1, alkali-hydrolyzable N of 48.9 mg kg−1, available P of 11.7 mg kg−1 and available K of 122.5 mg kg−1 and pH of 7.9. The soil in Dingxi of 2018 contains an organic matter of 11.0 g kg−1, alkali-hydrolyzable N of 50.6 mg kg−1, available P of 12.6 mg kg−1 and available K of 135.4 mg kg−1 and pH of 8.1. Additionally, the soil at Yongdeng was described as follows: an organic matter of 9.8 and 7.6 g kg−1, alkali-hydrolyzable N of 53.9 and 48.2 mg kg−1, available P of 8.0 and 8.7 mg kg−1 and available K of 178.3 and 141.6 mg kg−1, pH of 7.5 and 8.2 in 2018 and 2019, respectively. When P concentration is below 10 mg kg–1, it is considered low; the optimum soil P concentration is considered to be above 20 mg kg−1 [37].

2.3. Plant Sampling and Analysis

Each year growth period, 30 plants per plot were gathered to measure shoot biomass (SB) (namely, shoot dry matter), the P concentration and N concentration in shoot at 47, 65, 74, 98, and 115 days after emergence (DAE). At each year-site sampling date, 30 plants was randomly selected from the two central rows of a plot then separated above ground parts and roots. For chemical analysis, all above ground parts were rinsed with deionized water, then samples were oven-dried at 105 °C for half an hour, and then at 80 °C until they reached a constant weight and shoot biomass was weighed. The dry matter (DM) of shoot was ground to pass a 1 mm sieve for measuring P and N concentrations. The P and N concentrations were determined by the H2SO4-H2O2 digestion method, then P and N concentrations were quantified using the Colorimetric Molybdenum-Blue method [35] and the micro-Kjeldahl method [36], respectively.
Seed yield was measured in each plot by harvesting manually with a sickle.

2.4. Data Analysis

All data were subjected to analysis of variance (ANOVA) to compare differences between all studied parameters caused by the variation in P levels and cultivar, using the SPSS (version 19, Inc., Chicago, IL, USA) at a probability level of 5%. The differences among the treatments were calculated using the least significant difference (LSD) test at the 95% confidence level. Different P levels and cultivars were investigated as fixed impacts when present in all experiments. The relationship between P and N concentrations under nonlimiting conditions was described by linear regressions of SPSS by a combined analysis. A non-P-limiting treatment was defined as one in which P application did not lead to an increase in shoot biomass; however, there was a significant increment in shoot P concentration (SPC). The critical P concentration, which is defined as the lowest P concentration required to obtained highest shoot growth [12].
The P nutrition index (PNI) was determined by dividing the P concentration in shoot by the critical P concentration, similar to an approach previously used on flax [12]. The relative shoot biomass (RSB) and relative seed yield (RY) were the rates of shoot biomass and seed yield gained for a given P level to their respective peak values observed at a specific year [12]. The coefficients of determination (R2) were calculated using SPSS 20.0.

3. Results

3.1. Shoot Biomass at Different P Levels

Phosphorus fertilization significantly improved the SB of flax in all years-sites excluded at 47 DAE (Table 1 and Table 2). Moreover, the SB of flax were not significant difference among P80, P120, and P160 treatments. Moreover, the SB increased gradually, as plants grew from 47 to 115 DAE. Over the two years, the average SB of Luanxuan 2 ranged in between 0.82 to 7.18 t ha−1 and Dingya 22 ranged within 0.92 to 7.22 t ha−1, while in case of Longyaza 1 ranged in between 0.82 and 7.26 t ha−1, Zhangya 2 ranged from 0.87 to 7.21 t ha−1, and Longya 14 varied from 0.91 to 7.38 t ha−1, respectively (data not shown).
The SB was affected by cultivar, the SB of Dingya 22 was greater than that of Lunxuan 2 at 98 DAE of 2017 and at 65 DAE of 2018 in Dingxi (Table 1), and Longya 14 had highest SB, moreover, there were significant difference among three cultivars at 98 DAE in Yongdeng of 2019 (Table 2). In addition, the interaction between cultivar and P influenced the SB. The relationship between SB and P rate over two cultivars at 65 DAE in Dingxi of 2018 can be described through the linear functions: SB = 0.398Prate + 1.054 (R2 = 0.90, p < 0.01) in Dingxi of 2017 and SB = 0.360Prate + 1.075 (R2 = 0.88, p < 0.01). Additionally, the SB was affected by the interaction between cultivar and P rate at 115 DAE in Yongdeng of 2018, the relationship between SB and P rate over three cultivars can be described using the linear functions: SB = 0.595Prate + 4.615 (R2 = 0.86, p < 0.01).

3.2. Shoot P Concentration at Different P Levels

With the exception of sampling date at 47 DAE in each site-year and at 74 DAE in Dingxi of 2017, P fertilizer significantly influenced shoot P concentration of flax (Table 3 and Table 4). Nevertheless, there were no differences in shoot P concentration between P120 and P160 treatments in Dingxi and no differences in shoot P concentration among P80, P120, and P160 treatments in Yongdeng. In general, shoot P concentration increased with P levels, increasing at the same sampling date and the same cultivar. Averaged over the P40, P80, P120, and P160 treatments, the fertilized flax increased the P concentration in the shoot by 18, 18, 17, and 15% in Dingxi of 2017 and 2018, in Yongdeng of 2018 and 2019, respectively, compared with the zero P control. Furthermore, P concentration decreased with time from 47 DAE to 115 DAE. Across sampling dates and site years, P concentration ranged from 1.77 to 5.36 g kg−1 DM (data not shown).
The shoot P concentration was affected by cultivar, the P concentration of Dingya 22 was greater than that of Lunxuan 2 at 74 DAE of 2017 and at 65 DAE of 2018 in Dingxi (Table 3); and Zhangya 2 was observed the lowest P concentration at 65 DAE of 2018 and at 74 DAE of 2019 in Yongdeng (Table 4). Furthermore, cultivar and P interaction significantly affected the P concentration was at 74 DAE in Dingxi 2017, at 47 and 115 DAE of 2018 and at 65 DAE of 2019 in Yongdeng. The relationship between P concentration and P rate at 74 DAE over two cultivars can be described through the linear functions: Pconcentration = 0.213Prate + 2.097 (R2 = 0.79, p < 0.01) in Dingxi of 2017, and the relationship between P concentration and P rate over three cultivars can be described through the linear functions: Pconcentration = 0.187Prate + 4.261 (R2 = 0.88, p < 0.01), Pconcentration = 0.206Prate + 1.775 (R2 = 0.89, p < 0.01), and Pconcentration = 0.142Prate + 3.164 (R2 = 0.83, p < 0.01), at 47 and 115 DAE in 2018 and at 65 DAE of 2019 in Yongdeng, respectively.

3.3. Shoot N Concentration at Different P Levels

Shoot N concentration was significantly affected by P fertilization apart from at 47 DAE in each site-year and at 65 DAE in Yongdeng of 2019 (Table 5 and Table 6). Averaged over the P40, P80, P120, and P160 treatments, the fertilized flax increased the N concentration in shoot. Similar to shoot P concentration, shoot N concentration also decreased with plant growth from 47 to 115 DAE. In the study, over sampling dates all years, N concentration varied between 16.77 and 54.78 g kg−1 DM (Table 5 and Table 6).
The shoot N concentration was affected by cultivar at 74 DAE in Dingxi of 2017 (Table 5). In Yongdeng, N concentration was affected by cultivar at 74 DAE of 2019, Longyaza 1 exhibited the maximum value, followed by Longya 14 and Zhangya 2 (Table 6). Moreover, the interaction between cultivar and P rate impacted the N concentration at 98 DAE in Dingxi of 2018 and at 74 DAE in Yongdeng of 2019 (Table 5 and Table 6). The relationship between N concentration and P rate over two cultivars at 98 DAE of 2018 can be described through the linear functions: Nconcentration = 0.871Prate + 21.498 (R2 = 0.71, p < 0.01), and the relationship between N concentration and P rate over three cultivars at 74 DAE of 2019 can be described by the linear functions: Nconcentration = 0.782Prate + 27.053 (R2 = 0.76, p < 0.01).

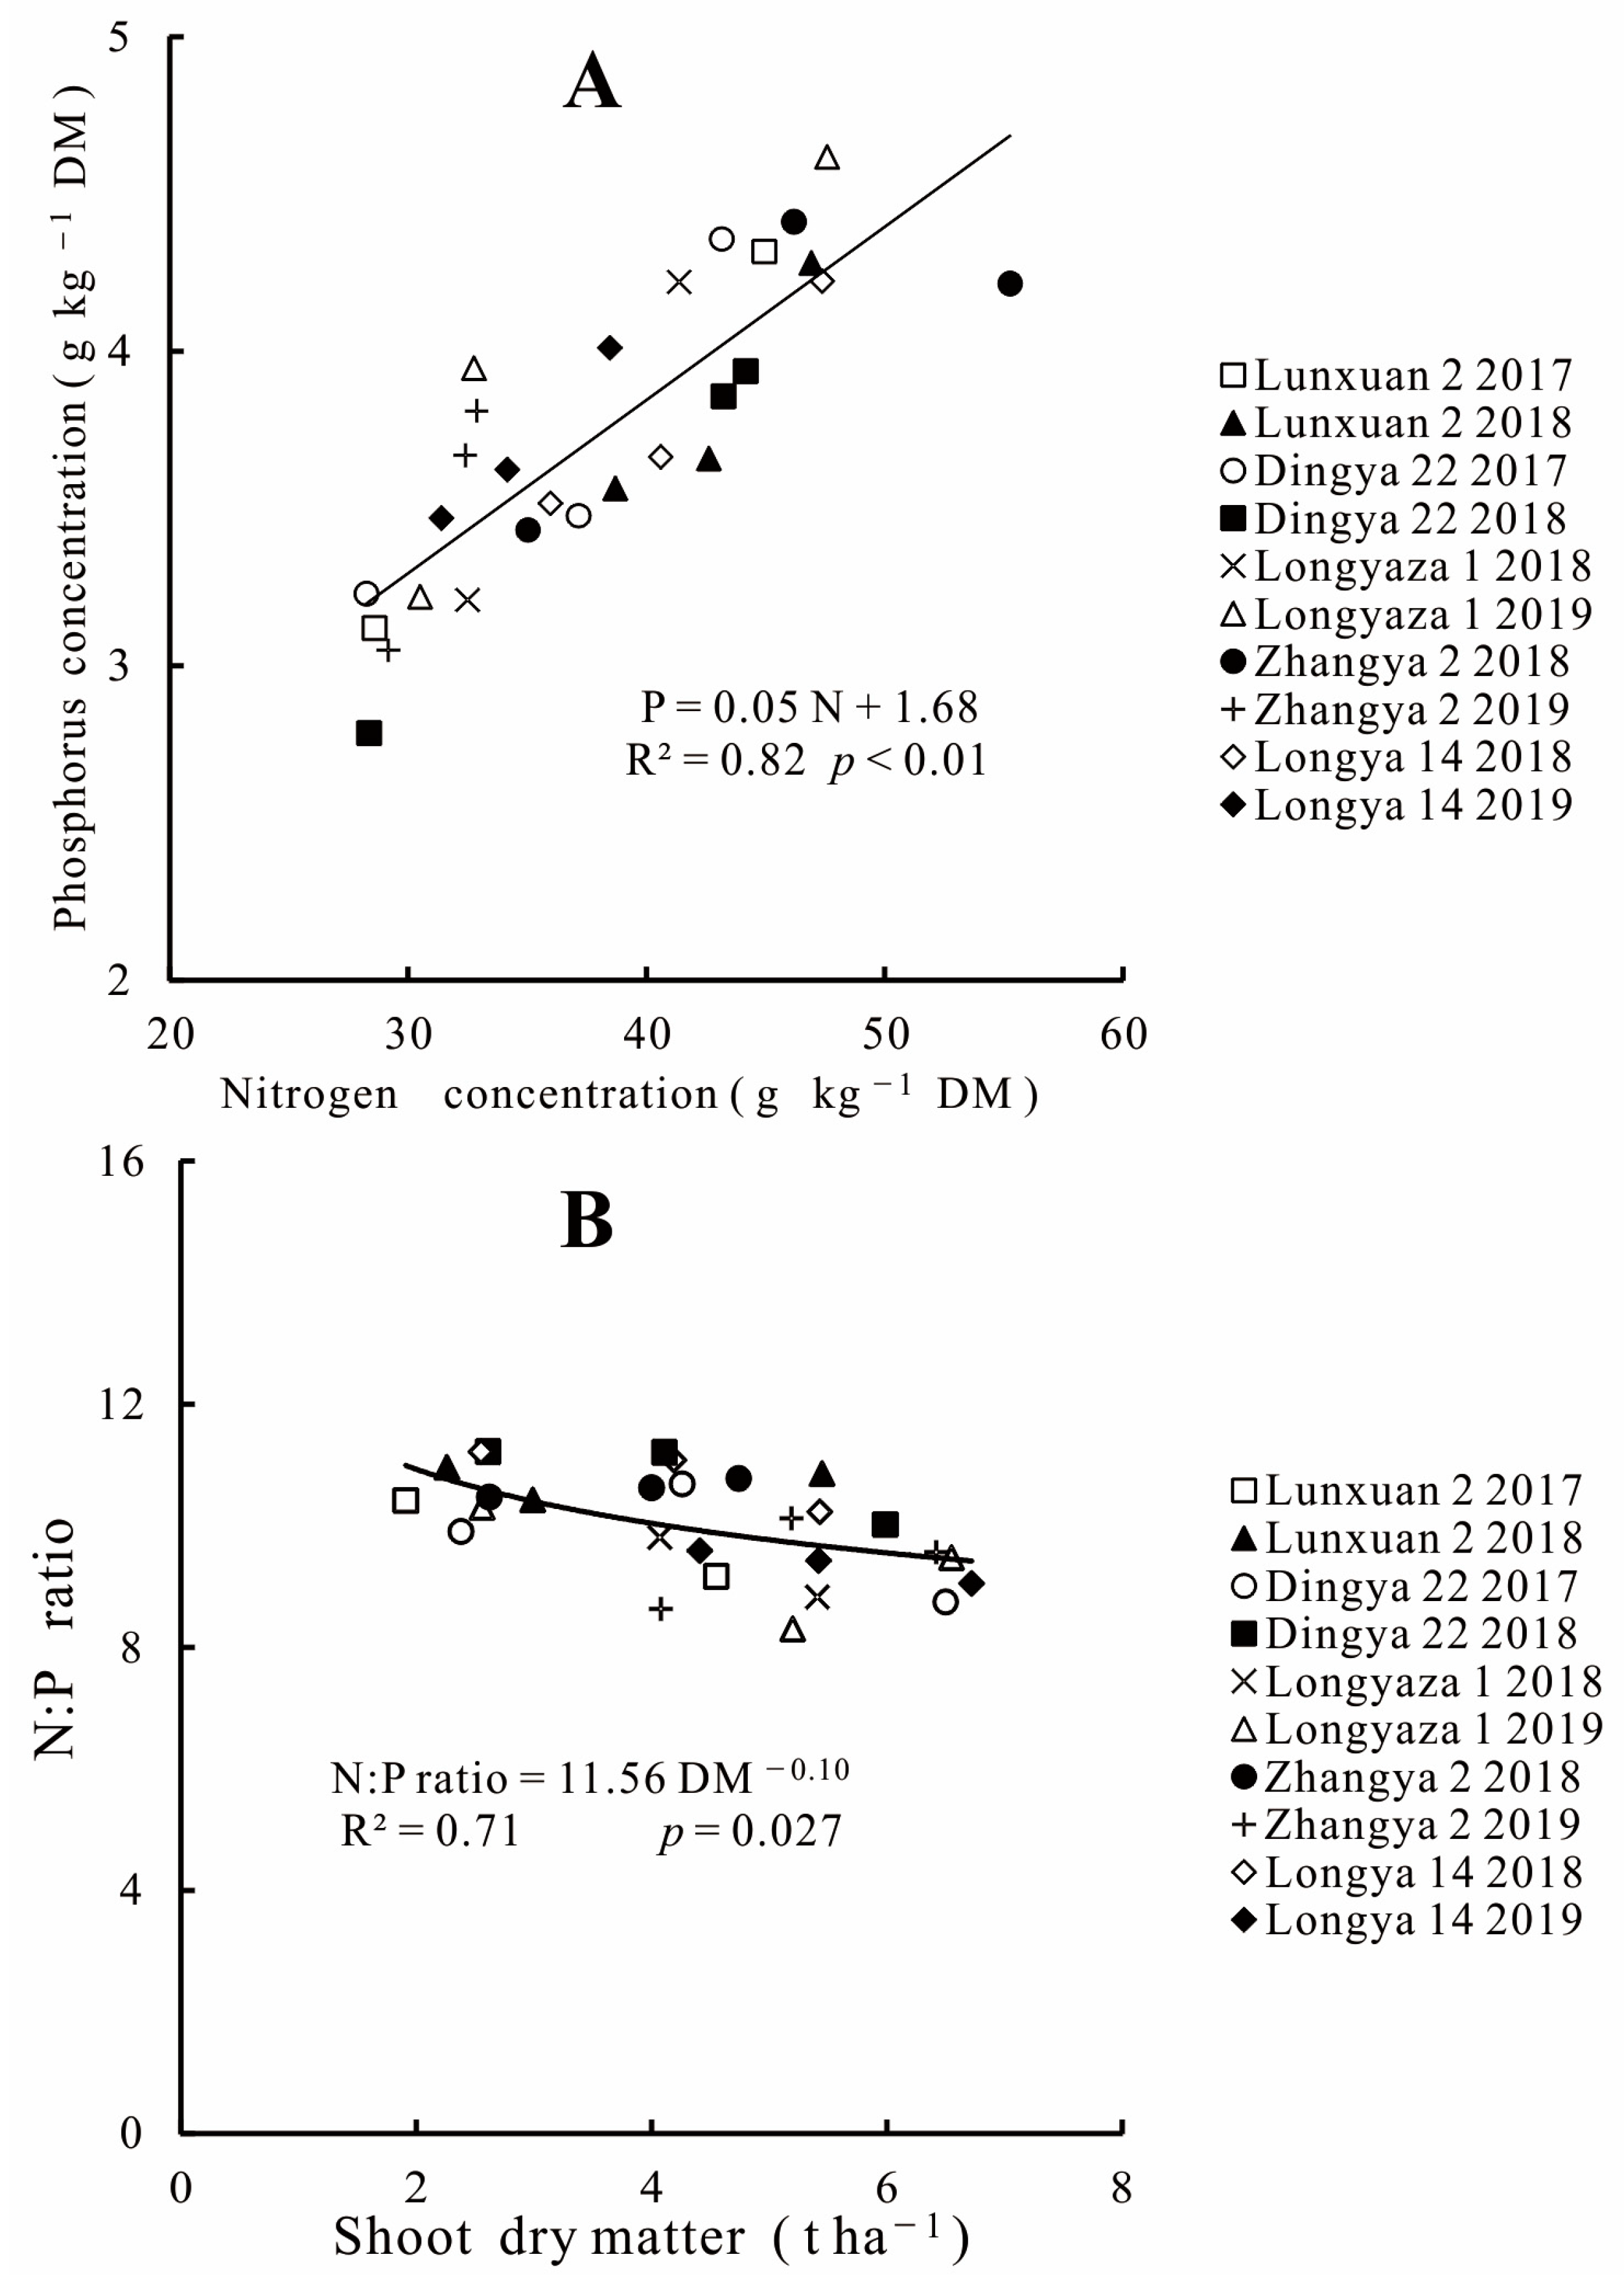
3.4. Phosphorus and N Concentration Relationships in Shoot

This study was to elucidate the relationship between P and N concentrations of flax throughout the growing period, namely from 47 to 115 DAE under non-limiting P conditions. Hence, the data from the experiments conducted in Dingxi of 2017 and 2018 under non-limiting P conditions were pooled with data obtained under non-limiting P conditions in Yongdeng of 2018 and 2019. In the current, shoot N concentration increased with increasing P concentration at four sites-years. Obviously, the relationship between N and P concentrations in shoot under non-limiting P conditions can be described through the linear function: P = 0.05N + 1.68 (R2 = 0.82, p < 0.01) (Figure 1A), in which both concentrations are expressed in g kg−1 DM. This relationship approximates the critical P concentration under non-limiting P conditions that is, the minimum P concentration needed when attained the highest shoot growth.

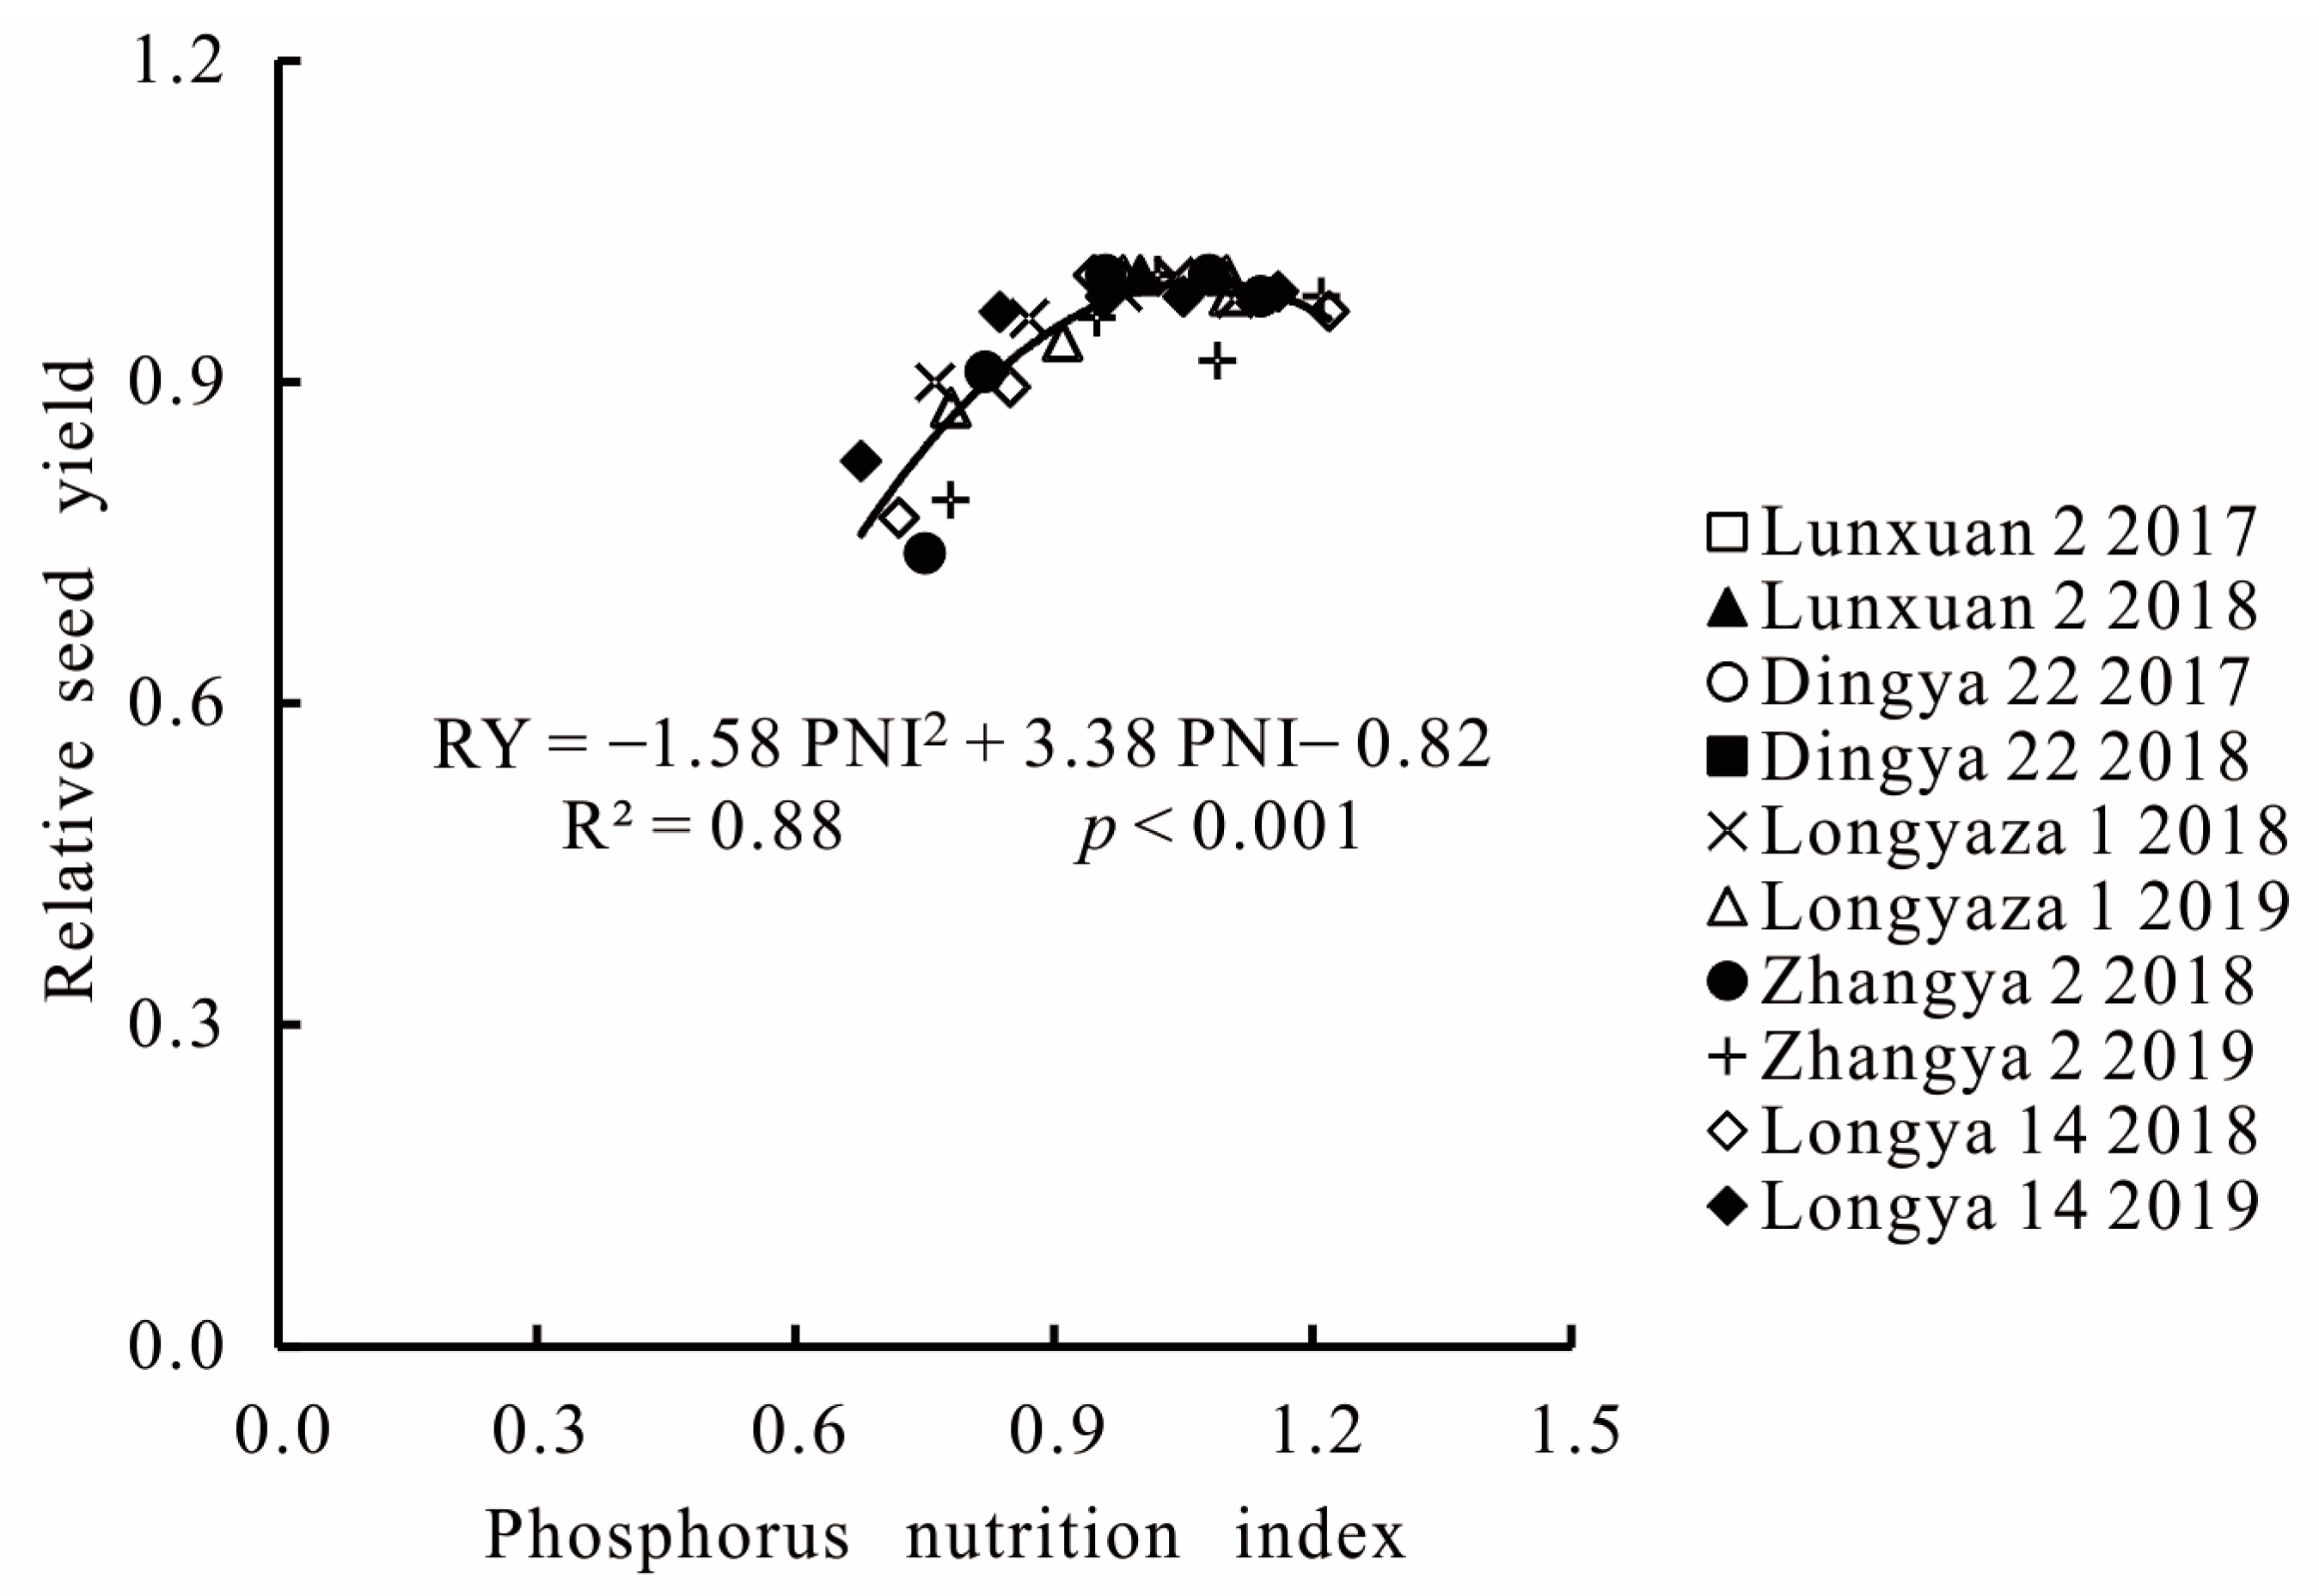
3.5. Implications for P Diagnostic in Flax

The rate of N:P has also been suggested to diagnose purposes. In the present study, the N:P ratio declined with increasing biomass (R2 = 0.71, p = 0.027) (Figure 1B), similar to the changes trend of N and P concentrations. The N:P ratio was 11.56, corresponding to 1 t ha−1 DM, within the range of 10:20 (mass basis) reported to be optimal by Güsewell [14]. Moreover, the dilution coefficient of the N:P curve was 0.10.
To diagnose P nutrition status, the PNI and relative seed yield (RY) was applied for all sampling dates. The values of PNI < 1, P deficiency, while values > 1, P excess, and PNI was 1, P optimal. Our results showed that the relationship between the PNI and RY was well fitted using a second-order polynomial equation (RY = −1.58 PNI2 + 3.38 PNI − 0.82) (R2 = 0.88, p < 0.001) (Figure 2). Value PNI = 1, the RY was near 1.0, while PNI > 1 or PNI < 1, the RY reduced on the basis of those relationships. Those indicate that inadequate and excessive of P application both lower the RY, while the optimal P rate leads to the maximum RY.

4. Discussion

This study first suggests the notion of the critical P concentration through the relationship between P and N concentrations in shoot of flax to quantify the degree of P deficiency during the current growing season. This diagnostic model based on this relationship between P and N concentrations can be used to guide agricultural field production.

4.1. Shoot Dry Matter, Phosphorus and Nitrogen Concentrations

The values of shoot biomass on flax in the current study are lower than those reported by Flénet et al. [38] in a study conducted in northern France with four levels of fertilizer N. The growing season in Gansu, China, has cold and dry conditions. However, the water holding capacities of soils are great due to the cool and humid climate of northern France. Hence, there is little risk of water deficit. Irrigation was triggered when the soil water content of the 0–30 cm layer was below half of the soil water availability. Lower biomass in our study (ranged from 1 to 7 t ha−1) compared to those conducted in northern France (1 to 10 t ha−1) could be correlated with differences in water availability, cultivars, and fertilizer type.
Our results observed that P concentration in shoot varied from 1.77–5.36 g kg−1 DM from 47 to 115 DAE, namely seedling to maturity, which a wider range than those in C3 crops reported by Bélanger et al. [20] on wheat (1.6–4.6 g kg−1 DM) from vegetative to late heading stages of development in Canada and by Cadot et al. [39] of rapeseed (5.38–6.52 g kg−1 DM) between inflorescence emergence and ripening and of wheat (3.84–4.53 g kg−1 DM) between tillering and joint stage in Switzerland. This probably due to the following: (i) sampling dates were at different stages of growth and development among them, which might have caused the different the capability of uptake P; (ii) the difference may be correlated to species, of which organ weight ratios and P concentration of organs were significant different; and (iii) the difference could be correlated to environments, especial soils properties and soil microbial phosphorus. Further research is required to do for exploring the cause.
Shoot N concentration in flax ranged between 16.12 g kg−1 DM and 55.70 g kg−1 DM in our study, which a wider range than that reported on linseed in northern France [38], and others C3 crops, such as winter wheat in Canada (14.4–43.4 g kg−1 DM), in Finland (17.3–49.8 g kg−1 DM), and in China (17.3–32.6 g kg−1 DM) [20]. The difference among crops was probably explained with diversity in P and N absorption and utilization among different species with various organ weight ratios and N concentration of organs, and significant differences existing in N concentrations under the environment’s conditions.
In addition, the effect of cultivar and the interaction between cultivar and P doses on SB, N, and P concentrations were few, with a sampling date from 47 to 115 DAE. However, this study intended to elucidate the relationship between P and N concentrations of flax throughout the growing period under within a range of P levels, hence, we concentrated on analysis of the effect of P doses on SB, N, and P concentrations.

4.2. Diagnosis of Phosphorus Nutrition Status

Our results exhibited that the N and P concentrations in shoot of flax existed a significant positive correlation. This confirms the powerful inter-dependence between N and P in crops [40], as observed in previous studies on grasses [13,24], wheat leaves [19,22], grassland swards [15], and canola [20]. Additionally, in the present study, the value of N:P ratio is in the extent of reported previously in terrestrial plants (10–20) [14] and oilseed crops (1.5–20) [40]. These strongly supported the results of the present study.
In 2008, Greenwood et al. [33] established the unifying N:P dilution curve for several crops, in which assumed non-limiting nutrient availability. The N:P dilution curve in our study was higher than those developed by Greenwood et al. [33]. This is possibly due to differences in N and P requirements between flax and the others crop species. The N:P ratios in shoot of flax (11.56) are close to the value of 11.83 for growth-related tissues, identifying that the interpretation of the N:P ratio for diagnosis of N and P sufficiency must be closely connected to the biomass [15,33,37].
According to the opinion of Güsewell [14] there is a ‘critical N:P ratio’ below which growth is limited only by N and above which growth is limited only by P. In the current study, the N:P ratios in shoot were in the range of 10–20, which validates that N and P were in sufficiency for the data set used to develop the critical P concentration curve.
Our results clearly showed that there were significant quadratic relationships between PNI and relative seed yield. The quadratic relationships correlated to seed yield increased with the P fertilizer up to 120 kg P2O5 ha−1 and then declined with further P application rate. The positive effect of appropriate P application on seed yield may be a consequence of improving photosynthesis [41] and increasing photosynthesis efficiency [42]. Value of relative seed yield was 1, PNI was 1, and the seed yield reached the peak, P optimal; PNI > 1 or PNI < 1, P excess or deficiency, those production decreased. Obviously, P nutrition status can be estimated by sampling biomass of shoot and this would represent a fast and cost effective option. Therefore, our results showed that the relationship between the P and N concentrations provided tools to evaluate the critical P concentration, in turn, to assess P status of flax during growing season.

5. Conclusions

Effective management of P fertilizer is critical to crop production and environment. In the current study, the N and P concentrations as well as N:P ratio of shoot all declined with increasing shoot biomass. The positive relationship between P and N concentrations under non-limiting P conditions for shoot growth identified in the strong stoichiometry between P and N in flax. Moreover, studies showed that the relationship between P and N concentrations and the N:P ratio in shoot are potential indices of P nutrition sufficiency, however, considering in relation to shoot biomass amount. When PNI was 1, the maximum seed yield obtained. Therefore, the current study provides diagnosis tool by the relationship between P and N concentrations to estimate the critical P concentration for quantifying the degree of P deficiency in flax production. This tool can be used to adjust P fertilization in the following growing seasons for the species-specific condition at the pH approximately to 8 of soil.

Author Contributions

Conceptualization, Writing—original draft, review and editing, Y.X. and J.Z.; Methodology, W.L.; Software, L.W., X.Z. and X.W. (Xingzhen Wang); Validation, Investigation, K.D., L.L., Z.D., Y.Q., X.W. (Xingrong Wang), Y.Z. (Yanjun Zhang), Y.Z. (Yangchen Zhou), L.S., G.W. and W.Z. All authors have read and agreed to the published version of the manuscript.

Funding

This research was funded by the Key Research and Development Projects of Gansu Academy of Agricultural Sciences (2021GAAS20), the National Natural Science Programs of China (31660368), the Major Special Projects of Gansu Province (21ZD4NA022-02), Gansu Intellectual Property Program (21ZSCQ026), and China Agriculture Research System of MOF and MARA (CARS-17-GW-04).

Data Availability Statement

The datasets used and/or analyzed during the current study are available from the corresponding author upon reasonable request.

Acknowledgments

We gratefully thank the journal’s editors and two anonymous reviewers for offering some excellent, constructive suggestions for further improvement our manuscript. We also appreciate the support and help from Junyi Niu.

Conflicts of Interest

The authors declare no conflict of interest.

References

  1. Elser, J.; Bennett, E. Phosphorus cycle: A broken biogeochemical cycle. Nature 2011, 478, 29–31. [Google Scholar] [CrossRef]
  2. MacDonald, G.K.; Bennett, E.M.; Potter, P.A.; Ramankutty, N. Agronomic phosphorus imbalances across the world’s croplands. Proc. Natl. Acad. Sci. USA 2011, 108, 3086–3091. [Google Scholar] [CrossRef] [Green Version]
  3. Li, B.; Boiarkina, I.; Yu, W.; Ming, H.; Munir, T.; Qian, G.; Young, B.R. Phosphorous recovery through struvite crystallization: Challenges for future design. Sci. Total Environ. 2019, 648, 1244–1256. [Google Scholar] [CrossRef] [PubMed]
  4. Mueed, A.; Shibli, S.; Jahangir, M.; Jabbar, S.; Deng, Z.Y. A comprehensive review of flaxseed (Linum usitatissimum L.): Health-affecting compounds, mechanism of toxicity, detoxification, anticancer and potential risk. Crit. Rev. Food Sci. Nutr. 2022, 1–24. [Google Scholar] [CrossRef]
  5. Parikh, M.; Maddaford, T.G.; Austria, J.A.; Aliani, M.; Netticadan, T.; Pierce, G.N. Dietary flaxseed as a strategy for improving human health. Nutrients 2019, 11, 1171. [Google Scholar] [CrossRef] [PubMed] [Green Version]
  6. Dixit, S.; Kanakraj, S.; Rehman, A. Linseed oil as a potential resource for bio-diesel: A review. Renew. Sust. Energy Rev. 2012, 16, 4415–4421. [Google Scholar] [CrossRef]
  7. Bacenetti, J.; Restuccia, A.; Schillaci, G.; Failla, S. Biodiesel production from unconventional oilseed crops (Linum usitatissimum L. and Camelina sativa L.) in Mediterranean conditions: Environmental sustainability assessment. Renew. Energy 2017, 112, 444–456. [Google Scholar] [CrossRef]
  8. Ahmad, T.; Danish, M.; Kale, P.; Geremew, B.; Adeloju, S.B.; Nizami, M.; Ayoub, M. Optimization of process variables for biodiesel production by transesterification of flaxseed oil and produced biodiesel characterizations. Renew. Energy 2019, 139, 1272–1280. [Google Scholar] [CrossRef]
  9. Danish, M.; Kale, P.; Ahmad, T.; Ayoub, M.; Geremew, B.; Adeloju, S. Conversion of flaxseed oil into biodiesel using KOH catalyst: Optimization and characterization dataset. Data Brief 2020, 29, 105225. [Google Scholar] [CrossRef]
  10. Dey, P.; Mahapatra, B.S.; Juyal, V.K.; Pramanick, B.; Negi, M.S.; Paul, J.; Singh, S.P. Flax processing waste -A low-cost, potential biosorbent for treatment of heavy metal, dye and organic matter contaminated industrial wastewater. Ind. Crop. Prod. 2021, 174, 114195. [Google Scholar] [CrossRef]
  11. Khiari, B.; Amel, I.; Azzaz, A.; Jellali, S.; Limousy, L.; Jeguirim, M. Thermal conversion of flax shives through slow pyrolysis process: In-depth biochar characterization and future potential use. Biomass Convers. Bior. 2021, 11, 325–337. [Google Scholar] [CrossRef]
  12. Xie, Y.P.; Li, Y.; Wang, L.M.; Nizamani, M.M.; Lv, Z.C.; Dang, Z.; Li, W.J.; Qi, Y.N.; Zhao, W.; Zhang, J.P.; et al. Determination of Critical Phosphorus Dilution Curve Based on Capsule Dry Matter for Flax in Northwest China. Agronomy 2022, 12, 2819. [Google Scholar] [CrossRef]
  13. Bélanger, G.; Richards, J.E. Relationships between P and N concentrations in timothy. Can. J. Plant Sci. 1999, 79, 65–70. [Google Scholar] [CrossRef]
  14. Güsewell, S. N:P ratios in terrestrial plants: Variation and functional significance. New Phytol. 2004, 164, 243–266. [Google Scholar] [CrossRef]
  15. Bélanger, G.; Ziadi, N.; Lajeunesse, J.; Jouany, C.; Virkajarvi, P.; Sinaj, S.; Nyiraneza, J. Shoot growth and phosphorus-nitrogen relationship of grassland swards in response to mineral phosphorus fertilization. Field Crop. Res. 2017, 204, 31–41. [Google Scholar] [CrossRef]
  16. Lemaire, G.; Sinclair, T.; Sadras, V.; Bélanger, G. Allometric approach to crop nutrition and implications for crops diagnosis and phenotyping. A review. Agron. Sust. Dev. 2019, 39, 27. [Google Scholar] [CrossRef] [Green Version]
  17. Duru, M.; Ducrocq, H. A nitrogen and phosphorus herbage index as a tool for assessing the effect of N and P supply on the dry matter yield of permanent pastures. Nutr. Cycl. Agroecosyt. 1997, 47, 56–69. [Google Scholar] [CrossRef]
  18. Kamprath, E.J. Enhanced Phosphorus Status of Maize Resulting from Nitrogen Fertilization of High Phosphorus Soils. Soil Sci. Soc. Am. J. 1987, 51, 1522–1526. [Google Scholar] [CrossRef]
  19. Ziadi, N.; Belanger, G.; Cambouris, A.N.; Tremblay, N.; Nolin, M.C.; Claessens, A. Relationship between phosphorus and nitrogen concentrations in spring wheat. Agron. J. 2008, 100, 80–86. [Google Scholar] [CrossRef]
  20. Bélanger, G.; Ziadi, N.; Pageau, D.; Grant, C.; Högnäsbacka, M.; Virkajärvi, P.; Hu, Z.; Lu, J.; Lafond, J.; Nyiraneza, J. A model of critical phosphorus concentration in the shoot biomass of wheat. Agron. J. 2015, 107, 963–970. [Google Scholar] [CrossRef]
  21. Fontana, M.; Bélanger, G.; Hirte, J.; Ziadi, N.; Elfouki, S.; Bragazza, L.; Liebisch, F.; Sinaj, S. Critical plant phosphorus for winter wheat assessed from long-term field experiments. Eur. J. Agron. 2021, 126, 126263. [Google Scholar] [CrossRef]
  22. Ziadi, N.; Bélanger, G.; Cambouris, A.N.; Tremblay, N.; Nolin, M.C.; Claessens, A. Relationship between P and N concentrations in corn. Agron. J. 2007, 99, 833–841. [Google Scholar] [CrossRef]
  23. Bélanger, G.; Ziadi, N.; Pageau, D.; Grant, C.; Lafond, J.; Nyiraneza, J. Shoot growth, phosphorus–nitrogen relationships, and yield of canola in response to mineral phosphorus fertilization. Agron. J. 2015, 107, 1458–1464. [Google Scholar] [CrossRef]
  24. Bélanger, G.; Ziadi, N. Phosphorus and Nitrogen Relationships during Spring Growth of an Aging Timothy Sward. Agron. J. 2008, 100, 1757–1762. [Google Scholar] [CrossRef] [Green Version]
  25. Marklein, A.R.; Houlton, B.Z. Nitrogen inputs accelerate phosphorus cycling rates across a wide variety of terrestrial ecosystem. New Phytol. 2012, 193, 696–704. [Google Scholar] [CrossRef] [PubMed]
  26. Rufty, T.W., Jr.; MacKown, C.T.; Israel, D.W. Phosphorus stress effects on assimilation of nitrate. Plant Physiol. 1990, 94, 328–333. Available online: https://www.jstor.org/stable/4273089 (accessed on 24 May 2016). [CrossRef]
  27. Rufty, T.W., Jr.; Israel, D.W.; Volk, R.J.; Qiu, J.; Sa, T. Phosphate regulation of nitrate assimilation in soybean. J. Exp. Bot. 1993, 44, 879–891. [Google Scholar] [CrossRef]
  28. Crews, T.E. Phosphorus regulation of nitrogen fixation in a traditional Mexican agroecosystems. Biogeochem 1993, 21, 141–166. [Google Scholar] [CrossRef]
  29. Güsewell, S.; Bollens, V.; Ryser, P.; Klötzli, F. Contrasting effects of nitrogen, phosphorus and water regime on first year and second year growth of 16 wetland plant species. Funct. Ecol. 2003, 11, 754–765. [Google Scholar] [CrossRef]
  30. Briat, J.F.; Gojon, A.; Plassard, C.; Rouached, H. Reappraisal of the central of soil nutrient availability in nutrient management in light of recent advances in plant nutrition at crop and molecular levels. Eur. J. Agron. 2020, 116, 126069. [Google Scholar] [CrossRef]
  31. Koerselman, W.; Meuleman, A.F.M. The vegetation N:P ratio: A new tool to detect the nature of nutrient limitation. J. Appl. Ecol. 1996, 33, 1441–1450. [Google Scholar] [CrossRef]
  32. Sinclair, A.G.; Morrison, J.D.; Smith, L.C.; Dodds, K.G. Effects and interactions of phosphorus and sulphur on a mown white clover/ryegrass sward. New Zeal. J. Agr. Res. 1997, 39, 421–433. [Google Scholar] [CrossRef] [Green Version]
  33. Greenwood, D.J.; Karpinets, T.V.; Zhang, K.; Bosh-Serra, A.; Boldrini, A.; Karawulova, L. A unifying concept for the dependence of whole-crop N:P ratio on biomass: Theory and experiment. Ann. Bot. 2008, 102, 967–977. [Google Scholar] [CrossRef]
  34. Hendershot, W.H.; Lalande, H.; Duquette, M. Soil reaction and exchangeable acidity. In Soil Sampling and Methods of Analysis, 2nd ed.; Carter, M.R., Ed.; Taylor and Francis: Boca Raton, FL, USA, 2008; pp. 173–178. [Google Scholar]
  35. Olsen, S.R.; Cole, C.V.; Watanabe, F.B.; Dean, L.A. Estimation of Soil Available Phosphorus in Soils by Extraction with Sodium Bicarbonate; US Department of Agriculture, Circular: Washington, DC, USA, 1954; p. 939.
  36. Lithourgidis, A.S.; Matsi, T.; Barbayiannis, N.; Dordas, C.A. Effect of liquid cattle manure on corn yield, composition, and soil properties. Agron. J. 2007, 99, 1041–1047. [Google Scholar] [CrossRef]
  37. Ozturk, L.; Eker, S.; Torun, B.; Cakmak, I. Variation in phosphorus efficiency among 73 bread and durum wheat genotypes grown in a phosphorus-deficient calcareous soil. Plant Soil 2005, 269, 69–80. [Google Scholar] [CrossRef]
  38. Flénet, F.; Gúerif, M.; Boiffin, J.; Dorvillez, D.; Champolivier, L. The critical N dilution curve for linseed (Linum usitatissimum L.) is different from other C3 species. Eur. J. Agron. 2006, 24, 367–373. [Google Scholar] [CrossRef]
  39. Cadot, S.; Bélanger, G.; Ziadi, N.; Morel, C.; Sinaj, S. Critical plant and soil phosphorus for wheat, maize, and rapeseed after 44 years of P fertilization. Nutr. Cycl. Agroecosyst. 2018, 112, 417–433. [Google Scholar] [CrossRef] [Green Version]
  40. Sadras, V.O. The N: P stoichiometry of cereal, grain legume and oilseed crops. Field Crop. Res. 2006, 95, 13–29. [Google Scholar] [CrossRef]
  41. Taliman, N.A.; Dong, Q.; Echigo, K.; Raboy, V.; Saneoka, H. Effect of Phosphorus Fertilization on the Growth, Photosynthesis, Nitrogen Fixation, Mineral Accumulation, Seed Yield, and Seed Quality of a Soybean Low-Phytate Line. Plants 2019, 8, 119. [Google Scholar] [CrossRef] [Green Version]
  42. Li, P.; Yu, J.; Feng, N.; Weng, J.; Rehman, A.; Huang, J.; Tu, S.; Niu, Q.L. Physiological and Transcriptomic Analyses Uncover the Reason for the Inhibition of Photosynthesis by Phosphate Deficiency in Cucumis melo L. Int. J. Mol. Sci. 2022, 23, 12073. [Google Scholar] [CrossRef]
Figure 1. Relationship between P and N concentrations in shoot (A) and between the ration N concentration to P concentration in shoot of flax under non-limiting P conditions (B). P, phosphorus; N, nitrogen; SB, shoot biomass.
Agronomy 13 00856 g001
Figure 2. Relationship between relative seed yield (RY) and phosphorus nutrition index (PNI) with five flax cultivars. The PNI data were averaged over three years and two sites.
Agronomy 13 00856 g002
Table 1. Shoot biomass (t ha−1) at Dingxi in 2017 and 2018 with two cultivars flax and five phosphorus rates.
YearTreatmentDAE 47DAE 65DAE 74DAE 98DAE 115
Cultivar
2017Lunxuan 21.222.033.564.68 b6.19
Dingya 221.302.463.624.94 a6.33
2018Lunxuan 21.132.00 b3.504.666.15
Dingya 221.232.31 a3.594.746.21
P rate
P00.891.30 c2.33 c3.41 c4.51 c
P401.201.82 b3.11 b4.43 b5.51 b
2017P801.342.57 ab4.21 a5.40 a6.94 a
P1201.432.72 a4.08 a5.42 a7.09 a
P1601.472.83 a4.25 a5.40 a7.26 a
P00.851.30 c2.39 c3.214.49 c
P401.171.70 b2.96 b3.965.47 b
2018P801.282.52 a4.15 a5.446.79 a
P1201.312.61 a4.12 a5.467.01 a
P1601.292.65 a4.12 a5.447.14 a
Source of variance (SOV)
C0.31420.52760.54410.00320.2183
2017P0.50510.00420.03130.01130.0372
C × P0.90110.01920.74650.76980.3521
C0.83260.01200.47980.52660.7145
2018P0.1425<0.00010.02440.01580.0116
C × P0.37640.01970.52180.26710.6899
C, cultivar. P, phosphorus. DAE, days after emergence. Means (n = 3) with a different letter in each column are significantly different at the 5% probability level according to the least significant difference test. P0, P40, P80, P120, and P160 represent 0, 40, 80, 120, and 160 kg P2O5 ha−1, respectively.
Table 2. Shoot biomass (t ha−1) at Yongdeng in 2018 and 2019 with three cultivars flax and five phosphorus rates.
YearTreatmentDAE 47DAE 65DAE 74DAE 98DAE 115
Cultivar
Longyaza 11.222.463.554.68 6.48
2018Zhangya 21.142.463.384.68 6.35
Longya 141.272.603.574.63 6.55
Longyaza 11.182.443.514.48 c6.38
2019Zhangya 21.222.513.494.66 b6.38
Longya 141.172.493.744.83 a6.41
P rate
P00.871.48 c2.38 c3.08 c4.87 c
P401.091.97 b2.75 b4.06 b5.78 b
2018P801.352.95 ab4.09 a5.34 a7.10 ab
P1201.353.05 a4.12 a5.41 a7.24 a
P1601.403.07 a4.16 a5.44 a7.31 a
P00.851.41 c2.43 b3.35 c4.79 c
P401.082.02 b2.95 b4.01 b5.62 b
2019P801.292.93 ab4.17 a5.29 a7.12 a
P1201.343.01 a4.12 a5.35 a7.17 a
P1601.393.03 a4.23 a5.28 a7.26 a
Source of variance (SOV)
C0.34810.56640.06020.07220.1233
2018P0.527<0.00010.02470.01960.0416
C × P0.6440.41520.08090.10090.0208
C0.2410.08150.09410.02470.2258
2019P0.089<0.00010.0125<0.00010.0200
C × P0.5290.08640.21450.09920.7431
C, cultivar. P, phosphorus. DAE, days after emergence. Means (n = 3) with different letters in each column are significantly different at the 5% probability level according to the least significant difference test. P0, P40, P80, P120, and P160 represent 0, 40, 80, 120, and 160 kg P2O5 ha−1, respectively.
Table 3. Shoot P concentration (g kg−1 DM) at Dingxi in 2017 and 2018 with two cultivars flax and five phosphorus rates.
YearTreatmentDAE 47DAE 65DAE 74DAE 98DAE 115
Cultivar
2017Lunxuan 25.113.472.58 b2.492.14
Dingya 225.063.452.89 a2.292.06
2018Lunxuan 25.023.31 b3.012.702.40
Dingya 225.073.52 a3.142.592.16
P rate
P04.793.01 b2.31 1.88 c1.78 b
P404.973.15 b2.58 2.03 bc1.86 b
2017P805.183.46 a2.68 2.39 b1.98 ab
P1205.203.78 a2.89 2.75 a2.35 a
P1605.313.92 a3.22 2.91 a2.55 a
P04.803.08 b2.58 c2.11 c1.86 b
P404.983.22 b2.83 b2.35 bc1.98 b
2018P805.033.41 ab3.03 b2.67 b2.25 ab
P1205.173.49 a3.43 a2.98 a2.59 a
P1605.253.88 a3.51 a3.13 a2.73 a
Source of variance (SOV)
C0.52770.064310.01280.34400.0812
2017P0.09760.01290.0906<0.00010.0215
C × P0.12540.46850.03420.74110.4125
C0.07080.03660.71640.49620.3588
2018P0.09240.02180.0324<0.00010.0400
C × P0.14570.25860.34570.25680.6215
P, phosphorus. DM, dry matter. C, cultivar. DAE, days after emergence. Means (n = 3) with different letters in each column are significantly different at the 5% probability level according to the least significant difference test. P0, P40, P80, P120, and P160 represent 0, 40, 80, 120, and 160 kg P2O5 ha−1, respectively.
Table 4. Shoot P concentration (g kg−1 DM) at Yongdeng in 2018 and 2019 with three cultivars flax and five phosphorus rates.
YearTreatmentDAE 47DAE 65DAE 74DAE 98DAE 115
Cultivar
Longyaza 14.843.68 a3.102.542.16
2018Zhangya 24.923.39 b3.182.712.14
Longya 144.713.66 a3.292.782.37
Longyaza 14.833.513.21 a2.742.33
2019Zhangya 24.793.762.69 b2.522.35
Longya 144.863.503.19 a2.692.51
P rate
P04.443.14 c2.79 c2.24 c1.90 b
P404.603.41 b2.96 b2.37 bc2.14 b
2018P804.853.55 ab3.18 a2.60 ab2.18 ab
P1205.083.72 a3.35 a3.02 a2.40 a
P1605.134.05 a3.65 a3.13 a2.51 a
P04.533.37 b2.73 c2.16 b1.94 b
P404.703.42 b2.91 b2.36 b2.20 b
2019P804.733.51 ab2.96 ab2.70 ab2.45 a
P1205.043.70 a3.13 ab2.93 a2.62 a
P1605.123.95 a3.42 a3.11 a2.76 a
Source of variance (SOV)
C0.41880.02590.09120.24380.6257
2018P0.09540.0329<0.00010.02410.0115
C × P0.03250.25490.47520.38920.2567
C0.12300.42580.03440.06150.1281
2019P0.47850.0329<0.00010.02740.0315
C × P0.63520.01740.75480.63510.5322
P, phosphorus. DM, dry matter. C, cultivar. DAE, days after emergence. Means (n = 3) with different letters in each column are significantly different at the 5% probability level according to the least significant difference test. P0, P40, P80, P120, and P160 represent 0, 40, 80, 120, and 160 kg P2O5 ha−1, respectively.
Table 5. Shoot N concentration (g kg−1 DM) at Dingxi in 2017 and 2018 with two cultivars flax and five phosphorus rates.
YearTreatmentDAE 47DAE 65DAE 74DAE 98DAE 115
Cultivar
2017Lunxuan 253.8335.7125.40 b21.7318.22
Dingya 2253.4234.6527.59 a21.8318.51
2018Lunxuan 254.9336.5130.43 23.3919.97
Dingya 2253.3135.7631.03 24.8320.16
P rate
P053.4032.93 b24.61 c19.10 c16.77 b
P4053.5533.83 b25.93 b20.30 b17.66 b
2017P8053.6834.82 ab26.21 ab22.60 ab17.88 ab
P12053.7736.99 a26.90 a23.18 a19.48 a
P16053.7437.36 a28.83 a23.73 a20.06 a
P052.9633.93 c27.50 c21.92 c18.86 b
P4054.1634.81 b29.90 b23.40 b18.99 b
2018P8054.3036.44 ab30.55 ab24.60 a20.44 a
P12054.4337.50 a 32.69 a25.34 a20.50 a
P16054.7838.00 a33.02 a25.31 a21.53 a
Source of variance (SOV)
C0.09420.74150.01950.45780.6942
2017P0.20430.0125<0.00010.00050.0200
C × P0.41080.42560.32890.34520.0981
C0.09220.65000.06720.12800.3211
2018P0.12880.02480.03240.02880.0109
C × P0.31450.09040.25840.01270.0992
N, nitrogen. DM, dry matter. P, phosphorus. C, cultivar. DAE, days after emergence. Means (n = 3) with different letters in each column are significantly different at the 5% probability level according to the least significant difference test. P0, P40, P80, P120, and P160 represent 0, 40, 80, 120, and 160 kg P2O5 ha−1, respectively.
Table 6. Shoot N concentration (g kg−1 DM) at Yongdeng in 2018 and 2019 with three cultivars flax and five phosphorus rates.
YearTreatmentDAE 47DAE 65DAE 74DAE 98DAE 115
Cultivar
Longyaza 154.6639.9732.9924.8420.15
2018Zhangya 252.3635.8032.7126.8920.96
Longya 1454.8838.3233.2326.7621.90
Longyaza 153.7439.1633.94 a26.2221.87
2019Zhangya 251.9735.7424.64 c23.1120.26
Longya 1454.1037.4829.62 b23.8122.47
P rate
P054.1637.18 b31.43 b24.38 b19.79 b
P4053.8637.53 b32.15 b24.73 b20.27 b
2018P8053.5938.34 ab33.15 a25.69 ab20.82 ab
P12054.3238.41 a33.74 a27.81 a21.42 a
P16053.9139.89 a34.42 a28.20 a22.03 a
P052.8436.60 28.30 b21.73 c18.95 c
P4052.9536.74 28.51 b22.38 c20.02 b
2019P8052.9737.25 29.04 ab24.97 b21.94 b
P12053.7638.03 29.38 ab25.83 a23.06 a
P16053.8238.69 31.78 a26.99 a23.67 a
Source of variance (SOV)
C0.08150.27080.08150.06790.4352
2018P0.24310.01420.04030.02790.0183
C×P0.16880.42150.08550.21440.3216
C0.06210.2789<0.00010.07400.1259
2019P0.32190.15280.02240.01650.0411
C×P0.14520.05780.02980.09110.2016
N, nitrogen. DM, dry matter. P, phosphorus. C, cultivar. DAE, days after emergence. Means (n = 3) with different letters in each column are significantly different at the 5% probability level according to the least significant difference test. P0, P40, P80, P120, and P160 represent 0, 40, 80, 120, and 160 kg P2O5 ha−1, respectively.
Disclaimer/Publisher’s Note: The statements, opinions and data contained in all publications are solely those of the individual author(s) and contributor(s) and not of MDPI and/or the editor(s). MDPI and/or the editor(s) disclaim responsibility for any injury to people or property resulting from any ideas, methods, instructions or products referred to in the content.

