Article

The Influence of the Multi-Component Mineral-Organic Concentrate on the Bonitation Value of Turfgrass

1
Department of Agroecology and Plant Production, University of Agriculture in Krakow, Mickiewicza 21, 31-120 Krakow, Poland
2
Department of Cattle Breeding, National Research Institute of Animal Production, Krakowska 1, 32-083 Balice, Poland
3
Department of Agroecology and Plant Production, Wroclaw University of Environmental and Life Sciences, Grunwaldzki 24A, 50-363 Wroclaw, Poland
4
Department of Genetics, Wroclaw University of Environmental and Life Sciences, Grunwaldzki 24A, 50-363 Wroclaw, Poland
5
Research Centre for Cultivar Testing, Slupia Wielka 34, 63-022 Slupia Wielka, Poland
6
Department of Computer Engineering, Wroclaw University of Science and Technology, Wyb. Wyspiańskiego 27, 50-370 Wrocław, Poland
*
Author to whom correspondence should be addressed.
Agronomy 2023, 13(3), 855; https://doi.org/10.3390/agronomy13030855
Submission received: 23 February 2023 / Revised: 10 March 2023 / Accepted: 13 March 2023 / Published: 15 March 2023
(This article belongs to the Special Issue Turfgrass Simulation for Increased Performance in Changing Climate)

Abstract

:
Multi-component fertilization has been found to have effects on grass metabolism, such as the stimulation of life processes and the reduction of adverse environmental conditions and pathogens. The research aimed to determine the bonitation value (assessment of the value in use) of turfgrass under the influence of using a multi-ingredient fertilizer. The experiment was carried out at the Experimental Station of the University of Agriculture in Krakow (Poland). The solution was applied through foliar application at three rates: 1.0, 2.0, and 3.0 L·ha−1. This fertilizer contains essential minerals and growth stimulants. An increase in the concentration of the test fertilizer used for spraying was associated with increased effectiveness. The plants with the highest dose of the multi-component fertilizer (treatment III) were characterized by the highest aesthetic values. The use of the concentrate reduced the occurrence of fungal plant diseases. Compared to control plants, 13% less snow mold infection and 25% fewer brown leaf spots were found. Satisfactory effects were also obtained on objects where mineral-organic concentrate was applied at a dose of 2.0 L·ha−1 (treatment II). Plants that received Treatment II and III resulted in 9% less snow mold and 15% less brown leaf spot compared to controls. In the object with the highest concentration dose (treatment III), the green index (NDVI) was also higher by 8% and the leaf greenness index (SPAD) by 7% compared to the plants from the control objects.

1. Introduction

Sodded areas, including lawns, play an important role in aesthetics, landscapes and recreation. By promoting various types of physical activity, lawns contribute to maintaining the body and mind, thereby improving society’s health [1]. However, to fulfil these functions, they need an appropriate quality. Heavy-duty grasses require special attention and must be properly fertilized. Due to these high requirements and environmental concerns, the use of growth stimulants can be a solution to reducing the use of agents that negatively affect the natural environment and ensure adequate nutrition for plants. According to the guidelines of the European Union [2], chemical and mineral plant protection products should be replaced by natural preservatives. Consequently, biopreparations that enhance the efficiency of the use of nutrients and support plant physiological processes are increasingly popular [3]. The main purpose of biostimulators is to stimulate plant growth and/or reduce the adverse effects of stress factors such as salt, drought, temperature fluctuations, and pathogens [4,5]. Due to their use, damage is quickly repaired [6]. Hormones and biostimulators improve plant metabolic processes without directly altering their natural pathways [3]. The most commonly used growth biostimulators include enzymes, proteins, amino acids, microelements, and natural stimulants such as phenols, salicylic acids, humic acids, fulvins, and protein hydrolases [7,8].
Recent studies and reviews in the literature have confirmed that non-protein structural amino acids such as glutamate, histidine, proline, betaine, and glycine are used to protect plants from environmental influences and activate metabolic pathways [9,10]. Several nonprotein amino acids have also been shown to play an important role in plant defense mechanisms [11]. Amination-based preparations in leaves and soils have been found to increase nitrogen and iron metabolism, nutrient absorption [12,13,14,15,16] and the absorption of water and macro and micronutrients [17,18].
Humic substances are natural components of organic matter derived from the decomposition of plants, animals, microorganisms, and the activity of terrestrial organisms [5]. In the soil, they form humic and fulvic acids and humins, humic acid was the most active [7]. Studies have shown positive effects on the appearance, cultivation, root systems, and overall biomass of plants, so humic substances are currently used in many commercial preparations for horticulture. Zhang et al. [15] and Mueller et al. [17] analyses of the impact of commercial biostimulants on turf quality found that the evaluation of visual parameters such as color and turf cover improved significantly, but they did not analyze the general aspects. Beneficial effects on the quality characteristics of ryegrass prairie attribute the effects of plant hormones related to the content of plant growth hormones [17].
Many researchers consider the use of biostimulators to be the most promising method to support plant production and environmental protection [11,13,18]. The lack of complete characteristics of plant processes and responses to certain biomaterials and their ingredients has led scientists to investigate this problem. Therefore, the objective of the study was to assess the effect of organic mineral concentrates on the aesthetics of well-used lawn flora.

2. Materials and Methods

2.1. Study Site

The experiment was conducted between the years 2020 and 2022 at the experimental station of the University of Agriculture of Cracow (50°07′ N, 20°05′ E—moderate warm transitional climate) on degraded chernozems (in Haplic Phaeozems (Siltic) soils) produced from loess). The chemical properties of soils are shown in Table 1. These elements were evaluated using the techniques described in [19].

2.2. Experiment Design and Pratotechnical Description

This experiment was conducted in accordance with agrotechnical recommendations for the establishment of turf. The experiment was conducted using a combination of grasses called Super Trawnik (Planta Sp.z.o.o., Tarnów, Poland) (Table 2).
In a 10 m2 area plot, the grass mixture was sown to 260.0 g m−2. The sowing date was 4 April 2020. The fertilizer used 65 kg N∙ha−1, 33 kg P∙ha−1, 124.5 kg K∙ha−1 during the sowing year, 190 kg N∙ha−1, 34,9 kg P∙ha−1, 124,5 kg K∙ha−1 during the entire sowing year. Nitrogen fertilizers are used in the form of 34 percent (N) ammonium nitrates (Ammonium Nitrate, The Azoty Group “Puławy”, Poland), phosphate fertilizers—superphosphate enriched (17.4% P) (Superfosfat enriched, Fosfory Group Gdańsk, Poland) and potassium fertilizers in the form of potassium salt (49.8% K) (Potassium chloride, Luvena, Poland). During the growth period (April to September), the average mowing time is twice a month to 4 cm. The plants are mowed after reaching 8 cm in height. The amount and height of mowing were consistent with the standards of the COBORU (Research Centre for Cultivar Testing) for “recreative” mixtures [20,21].

2.3. Experimental Factor

Experimental factors include spraying minerals and organic concentrates in the form of QULTIVO fertilizers at three doses: 1, 2 and 3 Lha−1. The evaluated concentrates include organic carbon, salt, amino acids, minerals, macroelements, and microelements. The detailed composition is as follows: total nitrogen (N) content: 5.0%; total phosphorus, expressed as phosphorus pentoxide (P2O5): 2.0%; total potassium, calculated as potassium oxide (K2O): 3.5%; total calcium, expressed as calcium oxide (CaO): 0.22%, total magnesium, expressed as magnesium oxide (MgO): 0.02%, total sulfur, calculated as sulfur trioxide (SO3): 1.5%; total boron (B): 1.15%; total copper (Cu): 0.7%; total iron (Fe): 0.6%; total manganese (Mn): 1.3%; total molybdenum (Mo): 0.05%; total zinc (Zn): 0.5%; total titanium (Ti): 0.008%; dry matter (d.m.) content: 55.4%; organic matter: 53.0% d.m.; humic acids: 2.8%; fulvic acids: 1.2%; amino acid content: 2.2% d.m.
The evaluated mineral-organic concentrate is produced by QULTIVO sp. z o.o. in Wielka Wieś (Poland: Szkolna 2 Street, 32-089 Wielka Wieś). During April, June and August, fertilizer was applied three times during the growing season. Only water-sprayed plants (which are also a solvent for biostimulants) serve as controls. Spray solutions are prepared by dissolving sufficient amounts of biostimulants into water to create a spray liquid with a volume of 0.3 m3∙ha−1.

2.4. Weather Conditions

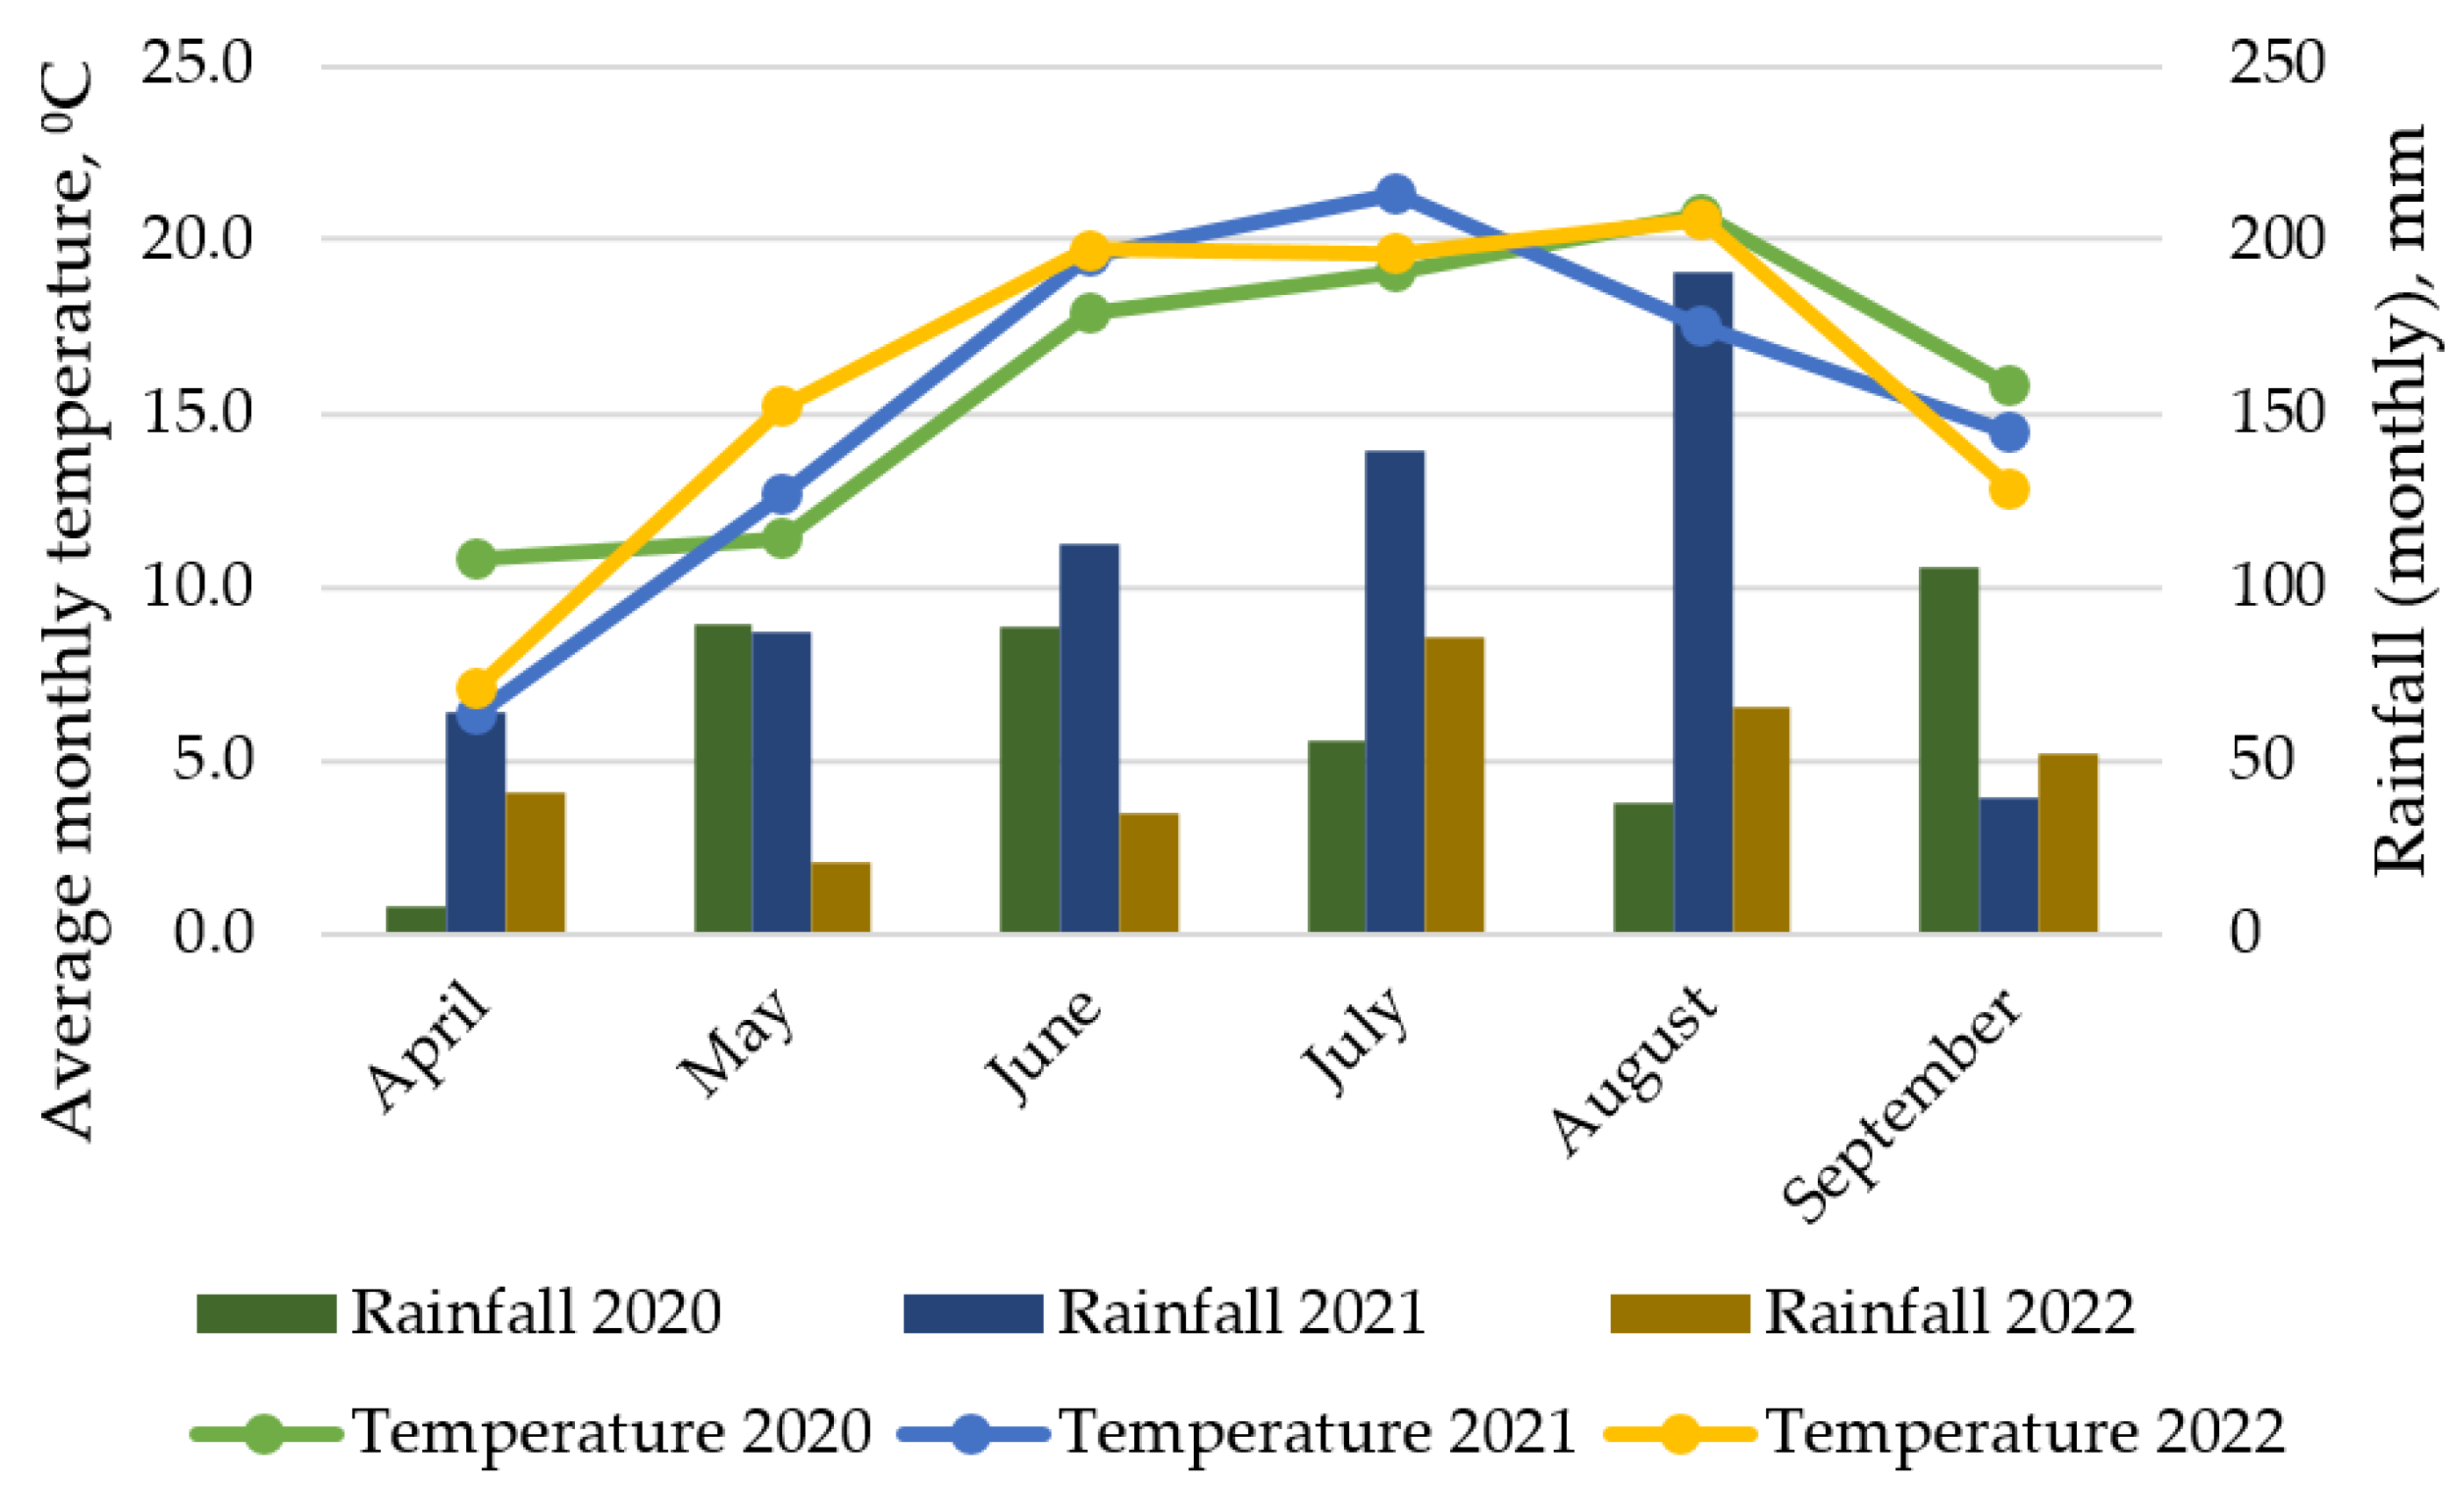
During the vegetation period (April-September), total precipitation in 2020 was 385.2 mm, 633.0 mm in 2021, and 299.6 mm in 2022 (Figure 1). During the study period, average air temperatures were 16.5 °C (2020), 15.3 °C (2021) and 15.8 °C (2022). In longer drought periods, irrigation (watering) was systematically applied at intervals of three days in about 10 Lm2 (10 mm rain) at a time.

2.5. Bonitations Assessments of Turfgrass

The value of the grass was based on the evaluation methods of Domański [20] and Turgeon (visual and functional methods) [22]. An improvement assessment consists of an evaluation of the utility value of grasses, including an analysis of some selected characteristics that allows it to classify its utility on a nine-point scale. The following properties were used to calculate the value: overall aspect (OA), turf density (D), color (K), winter hardiness (O), susceptibility to diseases (SD) and leaf structure (LS). Grass keys and visual scales were used to determine grass disease (Table 3). The results of the observations are characterized by a nine-point scale, with each number representing the typical intensity of a specific activity in the first decade of May, July and October, and three times during the growing season. Number 9 represents the largest, while number 1 represents the worst [20]. For winter durability, number 9 means no plant infection, and number 1 means total plant infection.
Over the years of the experiment, the effect of multi-component mineral-organic concentration foliar fertilization on the content of plant indexes was examined. The plant index is determined using the following devices: Minolta SPAD 502DL (leaf green index), Delta-T’s Sunscan System (leaf area index—LAI), and N-tech’s GreenSeeker—NDVI (normalized difference vegetation index).
The relative content of chlorophenol in the SPAD unit is calculated as follows [23]:
M = k l o g 10 I 0 650 I 940 I 650 I 0 940
where: k is a proportionality factor (40 for SPAD 502 DL); I0(650) and I0(940) are the amounts of monochromatic light reaching the leaf at wavelengths of 650 and 940 nm, I(650) and I(940) are the amounts of light transmission at the wavelengths of 650 and 940 nm.
NDVI was calculated according to Equation (2) below [24].
NDVI = N I R R N I R + R
where NIR is the amount of radiation reflection in the near-infrared range (780 nm for the GreenSeeker device), and R is the amount of reflection of red light (670 nm). The NDVI index for the areas covered with vegetation usually ranges between 0.1 and 0.7 (maximum 1).
The mineral content was determined by Weeden methods [19]. Table 4 shows the individual standards of specific elements. The mass of plants above ground was analyzed.

2.6. Statistical Analysis

Firstly, the normal distribution was tested with the Shapiro-Wilk test. A one-way variable analysis using Tukey’s posthoc test was performed for parameters that were not statistically significantly different from normal distributions. Kruskal-Wallis ANOVA was performed for parameters that show statistically significantly different values from normal values. The test was performed at a mean level of p = 0.05 in Statista 13.0 Software (Statsoft-DELL Software, Round Rock, TX, USA).

3. Results

The overall aspect, i.e., the appearance of the turfgrass and its attractiveness, depending on the applied dose of fertilization and the year of research, ranged from 4.86 to 9.0 (Table 5). The applied fertilization significantly influenced the aesthetic value of the turfgrass already in the first year of the study. In the first year of research, the values were 5.1–8.5. In the second year of use, 4.9–9.0, and in the third, 5.1–9.0. In terms of the seasons, the highest values were noted in autumn (7.4 on average for three years), slightly lower in spring (7.0), and the lowest in summer (5.8). The applied fertilization treatments significantly differentiated the overall aspect. The average value for three years of research for the control object was 6.1, for the first treatment (1 L∙ha−1) 6.0, for the second (2 L∙ha−1) 6.7, and the third treatment was (3 L∙ha−1) 8.0. Another analyzed feature was the sod cover (turf density), which covered the substrate with leaf blades during the vegetation period. The more leaf blades cover the soil, the higher the score. This feature ranged from 6.0 to 9.0. In the control sample, the average score for the study period was 6.7, in the first treatment 6.4, in the second 6.9, and in the third 8.1.
Winter hardiness ranged from 5.7 to 9.0. The average score from the years of research for the control object was 6.4, for the first treatment 5.8, for the second 6.2, and the third 9.0. Leaf color, the highest value, was observed in treatment III; the three-year average was 7.7, while the lowest value was 5.5 in the control object (Table 6). Another feature analyzed was the structure of the leaf. In terms of this characteristic, values from 5.3 to 7.1 were observed, the highest value was recorded in treatment III (3 L·ha−1). In terms of susceptibility to snow mold (Microdochium nivale), the objects varied from 6.7 to 9.0. A similar tendency was revealed in susceptibility to brown leaf blotch caused by Drechslera siccans. Treatments ranged from 6.6 to 9.0. The highest value in both cases was marked in treatment III.
The Leaf Area Index ranged from 2.27 to 2.40. Depending on the treatment and the years of research, these differences were not statistically confirmed. However, Treatment III was characterized by a larger assimilation area of the turfs. The green index (NDVI) showed a slight differentiation within the examined objects and ranged from 0.631 to 0.750. Treatment III was characterized by a significantly higher value of this index (than Treatment I and control). The average values of the leaf greenness index (SPAD) in individual study dates ranged from 30.23 to 35.6 (Table 7). In the object with the highest dose of fertilizer, on average for the study period, a 7% higher value of this indicator was found compared to the plants of the control object. No differences were found in the average values of this indicator for treatments I and II.
Table 8 presents the effect of applied foliar fertilization on the content of macroelements in plants. In the case of phosphorus (P), the content of this element in plants was in the range of 1.98–2.35 g∙kg−1 d.m. A statistically significant increase in the component’s content was observed after applying treatment III fertilization. A similar situation was observed in the case of potassium, the content of which was observed at the level of 29.53–32.77 g∙kg−1 d.m., and magnesium (the content of 1.87–2.65 g∙kg−1 d.m.), were also the dose of 3 L∙ha−1 caused a statistically significant increase in the content of these elements. In turn, foliar fertilization with mineral-organic multicomponent fertilizer did not have a statistically significant effect on the content of calcium (Ca) and sodium (Na), the content of which was in the range: of 3.72–4.25 g∙kg−1 d.m. and 0.07–0.12 g∙kg−1 d.m., respectively.
Table 9 presents the effect of applied foliar fertilization on plants’ microelements content. In two cases, zinc and copper, it was observed that fertilization did not cause a statistically significant effect on the content of these elements in plant biomass. The content of these elements in plants ranged from 40.71 mg∙kg−1 d.m. to 65.48 mg∙kg−1 d.m. and 6.99 mg∙kg−1 d.m. to 12.48 mg∙kg−1 d.m., respectively. In the case of manganese, fertilization in the amount of 2 L∙ha−1 and 3 L∙ha−1 resulted in statistically higher amounts of this element compared to the control. The range of this element was 203.92 mg∙kg−1 d.m.—262.51 mg∙kg−1 d.m. In turn, the amount of iron in plants increased from 108.47 mg∙kg−1 d.m. to 149.64 mg∙kg−1 d.m., increasing the fertilization dose to 3 L∙ha−1 resulted in a statistically significant increase in the content of this element.

4. Discussion

The experimental factor used is a multicomponent mineral-organic concentrate characterized by the presence in its chemical composition of substances classified as growth stimulants, such as titanium, humic acid, fulvic acid and amino acid.
In the experiment, it was observed that the application of a mineral-organic multi-component fertilizer positively affects the assessment of parameters that make up the visual and functional characteristics of turfs. However, statistically significant increases in the values of the given parameters were recorded using the highest dose of the experimental factor (3 L/ha). The positive effect of the fertilizer used may be due to its diverse and comprehensive composition. The formulation contains humic compounds, natural components of soil organic matter formed by the decomposition of plant, animal, and microbiological leftovers, and the metabolic activity of soil microbes using these resources [6] showing a positive effect on plant growth.
A unique role in this process could probably be played by the humic acids present in the fertilizer, the application of which on turfgrass results in an increase in the chlorophyll content, an improvement in photochemical efficiency, an improvement in oxidant and hormones, and an increase in plant tolerance to abiotic stresses [15,25,26,27,28].
It is essential to use this agent in grasslands because it significantly reduces chemicals and intensive fertilizer usage [29]. Consequently, plant biostimulators are increasingly used to improve the use of grassland [30,31,32].
It is necessary to emphasize that amino acids (in general), present in multicomponent mineral organ fertilizer, affect several physiological processes, such as plant growth and development, regulation of intracellular pH, production of metabolic energy, and increasing plant resistance to abiotic and biotic stress [33,34,35]. The research confirmed that the application of amino acids to turfgrasses, at the appropriate dose, allows for obtaining a shaped turf with a higher functional value, darker color, better overall appearance, denser turf compaction, and better spring greenup [36]. Since this effect is independent of the method of application of fertilizers (to soil or foliar) containing amino acids, after their application, it is possible to increase the metabolism of various elements, enhance the uptake of macro- and microelements and the efficiency of their use [37,38,39,40], which was also confirmed in this experiment.
Additionally, it was highly probable to obtain a synergistic effect by combining biologically active ingredients with macro and microelements in fertilizer. For example, the combination of iron application with humic acids could result in increased chlorophyll biosynthesis, resulting in a more attractive turf color, as it correlates with a darker turf color, as indicated by statistically significant higher SPAD and NDVI [41,42,43,44]. Colla et al. [45] observed a similar observation of an increase in chlorophyll concentration (the SPAD index) after the use of a biostimulator [45]. Foliar application of humic acids generally has a highly beneficial effect on plants and turfgrasses. In the past, it has been reported that supporting plants with this type of compound can improve the efficiency of photosynthesis, positively affect root morphology, or improve seed germination ability and characteristics of seed germination [32,37,46].
According to De Pascale et al. [7], plant biostimulators, including humic substances and seaweed extracts, can improve the absorption of nutrients uptake by plants. Kumar et al. [47], reported that biostimulants improved the uptake of Ca, Mg, and K, thus reducing soil pH, soil electrical conductivity, and soil Na availability. Ali et al. [48] showed that the foliar application of the moringa leaf extracts significantly improved the content of N, P, K and Mg in geranium leaves (Pelargonium graveolens L.). In some studies, the use of a mixture of biostimulants as an alternative or partial replacement for chemical fertilizers is recommended [49] Consequently, in addition to the biostimulator used in this study, biofertilizers are composed of minerals (macro and micronutrients in chelated form) and have a positive effect on plant content.
Rouphael and Colla [50] in their research strongly demonstrated the synergistic effect of biostimulating. They believe that research on the potential synergistic effects of biostimulation can be the basis of future research to address global food security issues and complement sustainable and optimal use of nutrients by designing the next generation of plant biostimulants for sustainable agriculture.

5. Conclusions

Using a mineral-organic compound fertilizer allowed for maximizing the functional and visual characteristics of the turfgrass. However, in most cases (evaluated parameters), statistically significant differences from the control were obtained for the highest dose of fertilizer. Plants treated with treatment III fertilization (the highest dose) were not only characterized by the highest aesthetic values but also less susceptible to fungal diseases. Compared to the control plots, there was 13% less snow mold infestation and 25% fewer brown spots on the leaves. For some parameters (especially turf density, overall aspect), satisfactory results were also obtained on objects where mineral-organic concentrate was applied at a dose of 2.0 L·ha−1 (treatment II).
It is also worth noting that in plants, as a result of the use of a multicomponent biostimulator on the object with the highest concentration dose (treatment III), NDVI was also higher by 8% and SPAD by 7% compared to plants from the control objects. It was also noted that foliar application of the concentrate allows for a higher concentration of macroelements and microelements in plants. According to research conducted, the application of biostimulators in lawn fertilization in the form of minerals in chelated form has had measurable effects in the form of higher quality and visual characteristics. Therefore, it is recommended that biofertilizers containing organic and mineral components are applied at higher concentrations for agricultural practice. A significant limitation in the work was the possibility of examining only the synergistic effect of mineral-organic compounds; hence future work should focus on examining the effect of specific compounds on turfgrass systems or evaluating the combined effect of a smaller number of isolated compounds.

Author Contributions

Conceptualization, A.R. and I.R.; methodology, A.R., K.W. and H.B.; software, H.B.; validation, Ł.J. and H.B.; formal analysis, A.R. and I.R.; investigation, A.R., I.R., K.W. and Ł.J.; resources, A.R. and I.R.; data curation, A.R. and I.R.; writing—original draft fertilizer, A.R. and I.R.; writing—review and editing, I.R., A.R. and Ł.J; visualization, A.R., K.W. and Ł.J.; supervision, Ł.J.; project administration, A.R., I.R. and Ł.J.; funding acquisition, H.B. All authors have read and agreed to the published version of the manuscript.

Funding

This research received no external funding.

Institutional Review Board Statement

Not applicable.

Informed Consent Statement

Not applicable.

Data Availability Statement

Not applicable.

Acknowledgments

Authors would like to acknowledge the QULTIVO LLC from Charsznica for the assistance in conducting this experiment, particularly Grzegorz Raczkiewicz, the company co-owner.

Conflicts of Interest

The authors declare no conflict of interest.

References

  1. Pomohaci, M.; Sopa, I.S. Leisure Sport Activities and Their Importance in Living a Healthy Physical and Psycho-Social Lifestyle. Sci. Bull. 2018, 23, 36–42. [Google Scholar] [CrossRef] [Green Version]
  2. Marchand, P.A. EU Chemical Plant Protection Products in 2023: Current State and Perspectives. Agrochemicals 2023, 2, 106–117. [Google Scholar] [CrossRef]
  3. Singh, S.P.; Ekanem, E.P.; Wakefield, T.; Comer, S.; Singh, S.P.; Ekanem, E.P.; Wakefield, T.; Comer, S. Emerging importance of bio-based products and bio-energy in the U.S. economy: Information dissemination and training of students. Int. Food Agribus. Manag. Rev. 2003, 5, 1–15. [Google Scholar] [CrossRef]
  4. Gugała, M.; Sikorska, A.; Zarzecka, K.; Krasnodębska, E.; Kapela, K.; Mystkowska, I. Profitability of application biostimulators in winter rape crop. Ann. PAAAE 2017, 19, 92–96. [Google Scholar] [CrossRef] [Green Version]
  5. Brown, P.H.; Saa, S. Biostimulants in Agriculture. Front. Plant Sci. 2015, 6, 671. [Google Scholar] [CrossRef] [PubMed] [Green Version]
  6. du Jardin, P. Plant Biostimulants: Definition, Concept, Main Categories and Regulation. Sci. Hortic. 2015, 196, 3–14. [Google Scholar] [CrossRef] [Green Version]
  7. De Pascale, S.; Rouphael, Y.; Colla, G. Plant Biostimulants: Innovative Tool for Enhancing Plant Nutrition in Organic Farming. Eur. J. Hortic. Sci. 2018, 82, 277–285. [Google Scholar] [CrossRef]
  8. Posmyk, M.M.; Szafrańska, K. Biostimulators: A New Trend towards Solving an Old Problem. Front. Plant Sci. 2016, 7, 748. [Google Scholar] [CrossRef] [Green Version]
  9. Calvo, P.; Nelson, L.; Kloepper, J.W. Agricultural Uses of Plant Biostimulants. Plant Soil 2014, 383, 3–41. [Google Scholar] [CrossRef] [Green Version]
  10. Gawronska, H.; Przybysz, A. Bistymulatory: Mechanizmy Działania i Przykłady Zastosowań; Warszawa, Poland, 2021; pp. 7–13. [Google Scholar]
  11. Talar-Krasa, M.; Wolski, K.; Biernacik, M. Biostimulants and Possibilities of Their Usage in Grassland. Grassl. Sci. 2019, 65, 205–209. [Google Scholar] [CrossRef]
  12. Rodríguez-Lucena, P.; Hernández-Apaolaza, L.; Lucena, J.J. Comparison of iron chelates and complexes supplied as foliar sprays and in nutrient solution to correct iron chlorosis of soybean. J. Plant Nutr. Soil Sci. 2010, 173, 120–126. [Google Scholar] [CrossRef]
  13. Bulgari, R.; Cocetta, G.; Trivellini, A.; Vernieri, P.; Ferrante, A. Biostimulants and Crop Responses: A Review. Biol. Agric. Hortic. 2015, 31, 1–17. [Google Scholar] [CrossRef]
  14. Sharif, M.; Khattak, R.A.; Sarir, M.S. Effect of different levels of lignitic coal derived humic acid on growth of maize plants. Commun. Soil Sci. Plant Anal. 2002, 33, 3567–3580. [Google Scholar] [CrossRef]
  15. Zhang, X.; Ervin, E.H.; Schmidt, R.E. Physiological Effects of Liquid Applications of a Seaweed Extract and a Humic Acid on Creeping Bentgrass. J. Am. Soc. Hortic. Sci. 2003, 128, 492–496. [Google Scholar] [CrossRef] [Green Version]
  16. Rose, M.T.; Patti, A.F.; Little, K.R.; Brown, A.L.; Jackson, W.R.; Cavagnaro, T.R. A Meta-Analysis and Review of Plant-Growth Response to Humic Substances. In Advances in Agronomy; Elsevier: Amsterdam, The Netherlands, 2014; Volume 124, pp. 37–89. ISBN 978-0-12-800138-7. [Google Scholar]
  17. Mueller, S.R.; Kussow, W.R. Biostimulant Influences on Turfgrass Microbial Communities and Creeping Bentgrass Putting Green Quality. Hortscience 2005, 40, 1904–1910. [Google Scholar] [CrossRef] [Green Version]
  18. Chen, Y.; Clapp, C.; Magen, H. Mechanisms of Plant Growth Stimulation by Humic Substances: The Role of Organo-Iron Complexes. Soil Sci. Plant Nutr. 2004, 50, 1089–1095. [Google Scholar] [CrossRef]
  19. Horwitz, W.; Latimer, G.W. Association of Official Analytical Chemists International Official Methods of Analysis of AOAC International, 18th ed.; Horwitz, W., AOAC International, Eds.; AOAC International: Gaithersburg, MD, USA, 2006; ISBN 978-0-935584-77-6. [Google Scholar]
  20. Domański, P. System of Research and Evaluation of Varieties of Lawn Grasses in Poland. Biul. IHAR 1992, 183, 251–263. [Google Scholar]
  21. Domański, P. Metodyka Doświadczeń Odmianowych z Trawami Gazonowymi; Centralny Ośrodek Badania Odmian Roślin Uprawnych: Słupia Wielka, Poland, 1993. [Google Scholar]
  22. Turgeon, A.J. Turfgrass Management, 7th ed.; Pearson/Prentice Hall: Upper Saddle River, NJ, USA, 2005; ISBN 978-0-13-114000-4. [Google Scholar]
  23. Uddling, J.; Gelang-Alfredsson, J.; Piikki, K.; Pleijel, H. Evaluating the Relationship between Leaf Chlorophyll Concentration and SPAD-502 Chlorophyll Meter Readings. Photosynth. Res. 2007, 91, 37–46. [Google Scholar] [CrossRef] [PubMed]
  24. Rouse, J.W., Jr.; Haas, R.H.; Schell, J.A.; Deering, D.W. Monitoring Vegetation Systems in the Great Plains with Erts. NASA Spec. Publ. 1974, 351, 309. [Google Scholar]
  25. Zhang, X.; Ervin, E.H.; Schmidt, R.E. Seaweed Extract, Humic Acid, and Propiconazole Improve Tall Fescue Sod Heat Tolerance and Posttransplant Quality. Hortscience 2003, 38, 440–443. [Google Scholar] [CrossRef] [Green Version]
  26. Zhang, X.; Schmidt, R.E. Antioxidant Response to Harmone-Containing Product in Kentucky Bluegrass Subjected to Drought. Crop Sci. 1999, 39, 545–551. [Google Scholar] [CrossRef]
  27. Zhang, X.; Goatley, M. Evaluating Effects of Humic and Fulvic Acids for Improving Creeping Bentgrass Putting Green Quality and Root Growth during Summer Stress. Va. Turfgrass Counc. 2019, 1, 26–28. [Google Scholar]
  28. Zhang, X.; Ervin, E.H. Cytokinin-Containing Seaweed and Humic Acid Extracts Associated with Creeping Bentgrass Leaf Cytokinins and Drought Resistance. Crop Sci. 2004, 44, 1737–1745. [Google Scholar] [CrossRef]
  29. Van Dyke, A. Do Humic Substances Influence Moisture Retention and Phosphorusuptake in Putting Greens? Utah State University: Logan, UT, USA, 2008. [Google Scholar]
  30. Liu, C.; Cooper, R.J.; Bowman, D.C. Humic Acid Application Affects Photosynthesis, Root Development, and Nutrient Content of Creeping Bentgrass. Hortscience 1998, 33, 1023–1025. [Google Scholar] [CrossRef] [Green Version]
  31. Tejada, M.; Gonzalez, J.L. Influence of Foliar Fertilization with Amino Acids and Humic Acids on Productivity and Quality of Asparagus. Biol. Agric. Hortic. 2003, 21, 277–291. [Google Scholar] [CrossRef]
  32. Nikbakht, A.; Kafi, M.; Babalar, M.; Xia, Y.P.; Luo, A.; Etemadi, N.-A. Effect of Humic Acid on Plant Growth, Nutrient Uptake, and Postharvest Life of Gerbera. J. Plant Nutr. 2008, 31, 2155–2167. [Google Scholar] [CrossRef]
  33. Fagard, M.; Launay, A.; Clément, G.; Courtial, J.; Dellagi, A.; Farjad, M.; Krapp, A.; Soulié, M.-C.; Masclaux-Daubresse, C. Nitrogen Metabolism Meets Phytopathology. J. Exp. Bot. 2014, 65, 5643–5656. [Google Scholar] [CrossRef]
  34. Egalili, G.; Eavin-Wittenberg, T.; Eangelovici, R.; Fernie, A.R. The Role of Photosynthesis and Amino Acid Metabolism in the Energy Status during Seed Development. Front. Plant Sci. 2014, 5, 447. [Google Scholar] [CrossRef]
  35. Häusler, R.E.; Ludewig, F.; Krueger, S. Amino Acids—A Life between Metabolism and Signaling. Plant Sci. 2014, 229, 225–237. [Google Scholar] [CrossRef]
  36. Radkowski, A.; Radkowska, I.; Bocianowski, J.; Sladkovska, T.; Wolski, K. The Effect of Foliar Application of an Amino Acid-Based Biostimulant on Lawn Functional Value. Agronomy 2020, 10, 1656. [Google Scholar] [CrossRef]
  37. Halpern, M.; Bar-Tal, A.; Ofek, M.; Minz, D.; Muller, T.; Yermiyahu, U. The Use of Biostimulants for Enhancing Nutrient Uptake. In Advances in Agronomy; Academic Press: Cambridge, MA, USA, 2015; Volume 130, pp. 141–174. ISBN 978-0-12-802137-8. [Google Scholar]
  38. Cerdán, M.; Sanchez, A.S.; Oliver, M.; Juárez, M.; Sánchez-Andreu, J. Effect of foliar and root applications of amino acids on iron uptake by tomato plants. Acta Hortic. 2009, 830, 481–488. [Google Scholar] [CrossRef]
  39. Maini, P. The Experience of the First Biostimulant, Based on Aminoacids and Peptides: A Short Retrospective Review on the Laboratory Researches and the Practical Results. Fertil. Agrorum 2006, 1, 29–43. [Google Scholar]
  40. Garcia, A.L.; Madrid, R.; Gimeno, V.; Rodriguez-Ortega, W.M.; Nicolas, N.; Garcia-Sanchez, F. The Effects of Amino Acids Fertilization Incorporated to the Nutrient Solution on Mineral Composition and Growth in Tomato Seedlings. Span. J. Agric. Res. 2011, 9, 852. [Google Scholar] [CrossRef] [Green Version]
  41. Radkowski, A.; Radkowska, I.; Wolski, K.; Sobol, Ł.; Bujak, H. Lawn Bonitation Value as a Function of Glycine-Complexed Iron Formulation Application. Appl. Sci. 2022, 12, 12102. [Google Scholar] [CrossRef]
  42. Prokopiuk, K.; Żurek, G.; Rybka, K. Turf Covering for Sport Season Elongation Cause no Stress for Grass Species as Detected by Chl a Fluorescence. Urban For. Urban Green. 2019, 41, 14–22. [Google Scholar] [CrossRef]
  43. Paunov, M.; Koleva, L.; Vassilev, A.; Vangronsveld, J.; Goltsev, V. Effects of Different Metals on Photosynthesis: Cadmium and Zinc Affect Chlorophyll Fluorescence in Durum Wheat. Int. J. Mol. Sci. 2018, 19, 787. [Google Scholar] [CrossRef] [Green Version]
  44. Zhang, W.; Chen, G.; Wu, H.; Xie, C.; Wang, Z.; Song, X.; Wang, P.; Ruan, X.; Ding, L.; Zhang, Y.; et al. Evaluation of Lawn Color and Chlorophyll Concentration Using Hyperspectral Index. IOP Conf. Ser. Earth Environ. Sci. 2020, 615, 012127. [Google Scholar] [CrossRef]
  45. Colla, G.; Rouphael, Y.; Canaguier, R.; Svecova, E.; Cardarelli, M. Biostimulant Action of a Plant-Derived Protein Hydrolysate Produced through Enzymatic Hydrolysis. Front. Plant Sci. 2014, 5, 448. [Google Scholar] [CrossRef] [Green Version]
  46. Dorer, S.P.; Peacock, C.H. The Effect of Humate and Organic Fertilizer on Establishment and Nutrient of Creeping Bent Putting Greens. Int. Turfgrass Soc. 1997, 8, 437–443. [Google Scholar]
  47. Kumar, U.; Gulati, I.J.; Rathiya, G.R.; Singh, M.P. Effect of saline water irrigation, humic acid and salicylic acid on soil properties, yield attributes and yield of tomato (Lycopersicon esculentum). Environ. Ecol. 2017, 35, 449–453. [Google Scholar]
  48. Abou-Sreea, A.I.; Rady, M.M.; Roby, M.H.; Ahmed, S.M.; Majrashi, A.; Ali, E.F. Cattle manure and bio-nourishing royal jelly as alternatives to chemical fertilizers: Potential for sustainable production of organic Hibiscus sabdariffa L. J. Appl. Res. Med. Aromat. Plants 2021, 25, 100334. [Google Scholar] [CrossRef]
  49. Ali, E.; Hassan, F.; Elgimabi, M. Improving the growth, yield and volatile oil content of Pelargonium graveolens L. Herit by foliar application with moringa leaf extract through motivating physiological and biochemical parameters. S. Afr. J. Bot. 2018, 119, 383–389. [Google Scholar] [CrossRef]
  50. Rouphael, Y.; Colla, G. Synergistic Biostimulatory Action: Designing the Next Gen-eration of Plant Biostimulants for Sustainable Agriculture. Front. Plant Sci Sec. Crop Prod. Physiol. 2018, 9, 1655. [Google Scholar] [CrossRef] [PubMed] [Green Version]
Figure 1. Weather conditions during the experiment.
Agronomy 13 00855 g001
Table 1. Chemical properties of soil in the study site.
Parameter/ElementAmountLevel/Range
pHKCl7.6alkaline
N (total nitrogen)2.26 g∙kg−1 soil
P (available phosphorus)62.35 mg∙kg−1 soilmedium
K (available potassium)184.43 mg∙kg−1 soilmedium
Mg (magnesium)40.24 mg∙kg−1 soilhigh
Table 2. Composition of evaluated grass mixture.
Grass SpeciesVarietyShare in Grass Mixture
Perennial Ryegrass (Lolium perenne L.)Stadion12%
Perennial Ryegrass (Lolium perenne L.)Poppies30%
Tall Fescue (Festuca arundinacea Shreb.)Fawn20%
Red Fescue (Festuca rubra L.)Aniset25%
Red Fescue (Festuca rubra L.)Reverant13%
Table 3. Scale grades used for bonitation assessment of turf quality.
AssesmentOverall AspectTurf DensityColorWinter HardinessSusceptibility to DiseasesLeaf Structure
1bad (no plants)badyellow-greenvery badplants completely infestatedvery wide
2bad to poorbad to poorolive greenvery bad to badvery large to largevery wide to wide
3weakweakbright-greenbadlargewide
4weak to fairweak to fairgreen-graybad to averagelarge to mediumwide to intermediate
5sufficientsufficientjuicy greenaveragemediumintermediate
6sufficient to goodsufficient to goodgreenaverage to goodmedium to smallintermediate to slender
7goodgoodgrass greengoodsmallslender
8good to very goodgood to very gooddirty greengood to very goodsmall to very smallsubtle to very slender
9very goodvery goodemeraldvery goodno symptoms of infestationvery slender
Table 4. Methods to determine the content of specified elements in their phytomass.
Evaluated ElementsMethodStandard
Mineral Components, i.e., calcium, magnesium, potassium, sodium.Atomic Absorption spectrometry with FAAS atomization (Varian AA240FS Varian Inc., Palo Alto, CA, USA)PN-EN 15505:2009 standard
Iron, Manganese, ZincAtomic Absorption spectrometry with FAAS atomization (Varian AA240FS Varian Inc., Palo Alto, CA, USA)PN-EN 14084:2004 standard
CopperValidated method of atomic absorption spectrometry with electrothermal atomization, using ET-AAS graphite cuvette (Varian AA240Z Varian Inc., Palo Alto, CA, USA)PN-EN 14084: 2004 standard
NitrogenKjedahl method-
PhosphorusUV-VIS spectrophotometry and staining with ammonium monovanadate (V) and ammonium heptomolybdatePN–ISO 13730:1999 standard
Table 5. Overall aspect, turf density, and winter hardiness depending on the year and dose of mineral-organic multi-component fertilizer application.
DoseYearOverall AspectTurf DensityWinter Hardiness
SpringSummerAutumnSpringSummerAutumn
Control20206.44 ± 0.105.27 ± 0.106.83 ± 0.106.34 ± 0.106.73 ± 0.106.99 ± 0.15
20216.27 ± 0.105.05 ± 0.076.60 ± 0.076.18 ± 0.106.56 ± 0.106.81 ± 0.156.24 ± 0.05
20226.54 ± 0.105.35 ± 0.106.93 ± 0.106.44 ± 0.106.83 ± 0.107.10 ± 0.156.50 ± 0.06
Mean6.41 a ± 0.145.22 ab ± 0.156.79 ab ± 0.166.32 ab ± 0.146.71 ab ± 0.156.97 b ± 0.186.37 bc ± 0.15
Treatment I: 1 L∙ha−1 20206.62 ± 0.095.10 ± 0.096.62 ± 0.096.35 ± 0.096.53 ± 0.096.62 ± 0.09
20216.30 ± 0.094.86 ± 0.096.28 ± 0.066.05 ± 0.096.22 ± 0.096.30 ± 0.095.71 ± 0.09
20226.57 ± 0.095.06 ± 0.096.57 ± 0.096.30 ± 0.096.48 ± 0.096.57 ± 0.095.95 ± 0.09
Mean6.50 ab ± 0.175.00 a ± 0.166.49 a ± 0.176.23 a ± 0.166.40 a ± 0.166.50 a ± 0.175.83 a ± 0.15
Treatment II: 2 L∙ha−120206.94 ± 0.055.76 ± 0.097.06 ± 0.186.74 ± 0.096.74 ± 0.096.88 ± 0.05
20216.92 ± 0.055.74 ± 0.097.02 ± 0.156.71 ± 0.096.71 ± 0.096.86 ± 0.056.03 ± 0.05
20227.21 ± 0.055.98 ± 0.097.33 ± 0.196.99 ± 0.096.99 ± 0.097.15 ± 0.056.29 ± 0.05
Mean7.02 bc ± 0.155.83 bc ± 0.147.14 bc ± 0.216.81 bc ± 0.166.81 bc ± 0.166.96 ab ± 0.156.16 ab ± 0.15
Treatment III: 3 L∙ha−120207.39 ± 0.146.56 ± 0.098.47 ± 0.57.09 ± 0.097.18 ± 0.099.00 ± 0.00
20218.10 ± 0.157.19 ± 0.109.00 ± 0.007.77 ± 0.107.87 ± 0.109.00 ± 0.009.00 ± 0.00
20228.44 ± 0.157.49 ± 0.109.00 ± 0.008.10 ± 0.108.20 ± 0.109.00 ± 0.009.00 ± 0.00
Mean7.97 c ± 0.487.08 c ± 0.428.82 c ± 0.377.66 c ± 0.457.75 c ± 0.469.00 c ± 0.009.00 c ± 0.00
Year effect (p-value)0.28290.42840.48240.32840.22290.3721-
Dose effect (p-value)0.00000.00000.00000.00000.00000.00000.0001
Standard deviation0.680.850.940.630.570.991.29
Variation coefficient9.78%14.72%12.93%9.26%8.23%13.47%18.93%
The same markings (a, b, c) mean no statistically significant changes (p ≥ 0.05).
Table 6. Leaf color, leaf structure, and susceptibility to diseases depending on the year and dose of mineral-organic multi-component fertilizer application.
DoseYearLeaf Color in AutumnLeaf Structure (Fineness)Susceptibility to Diseases
Microdochium nivaleDrechslera siccans
Control20205.82 ± 0.155.88 ± 0.209.00 ± 0.007.25 ± 0.06
20215.22 ± 0.135.28 ± 0.186.68 ± 0.056.85 ± 0.25
20225.43 ± 0.145.49 ± 0.197.80 ± 0.057.07 ± 0.12
Mean5.49 a ± 0.295.55 a ± 0.317.83 a ± 1.007.06 a ± 0.22
Treatment I: 1 L∙ha−120206.43 ± 0.145.68 ± 0.059.00 ± 0.007.33 ± 0.05
20216.20 ± 0.135.48 ± 0.057.15 ± 0.057.07 ± 0.05
20226.45 ± 0.14 5.70 ± 0.058.77 ± 0.067.35 ± 0.05
Mean6.36 b ± 0.175.62 a ± 0.128.31 a ± 0.877.25 ab ± 0.15
Treatment II: 2 L∙ha−120207.04 ± 0.096.05 ± 0.059.00 ± 0.008.30 ± 0.05
20216.65 ± 0.095.72 ± 0.057.50 ± 0.057.93 ± 0.12
20226.94 ± 0.095.95 ± 0.059.00 ± 0.008.09 ± 0.02
Mean6.87 c ± 0.195.91 ab ± 0.158.50 a ± 0.758.11 bc ± 0.18
Treatment III: 3 L∙ha−120207.61 ± 0.156.87 ± 0.069.00 ± 0.009.00 ± 0.00
20217.54 ± 0.156.81 ± 0.058.43 ± 0.058.67 ± 0.29
20227.87 ± 0.137.09 ± 0.069.00 ± 0.008.83 ± 0.29
Mean7.67 d ± 0.196.93 b ± 0.148.81 a ± 0.298.83 c ± 0.25
Year effect (p-value)0.61020.12720.00000.3264
Dose effect (p-value)0.00000.00000.16140.0000
Standard deviation0.830.590.830.75
Variation coefficient12.57%9.80%9.89%9.54%
The same markings (a, b, c, d) mean no statistically significant changes (p ≥ 0.05).
Table 7. Normalized Difference Vegetation Index, Soil Plant Analysis Development and Leaf Area Index, depending on the year and dose of mineral-organic multi-component fertilizer application.
DoseYearNDVISPADLAI
Control20200.631 ± 0.01830.23 ± 0.102.27 ± 0.06
20210.652 ± 0.00530.70 ± 0.602.27 ± 0.06
20220.686 ± 0.02633.29 ± 0.062.30 ± 0.10
Mean0.657 a ± 0.02931.41 a ± 1.462.28 a ± 0.07
Treatment I: 1 L∙ha−120200.636 ± 0.00830.40 ± 1.012.30 ± 0.10
20210.663 ± 0.01131.17 ± 0.592.27 ± 0.06
20220.690 ± 0.03133.65 ± 0.062.33 ± 0.06
Mean0.663 a ± 0.02931.74 ab ± 1.582.30 a ± 0.07
Treatment II: 2 L∙ha−120200.661 ± 0.00431.70 ± 0.262.33 ± 0.06
20210.694 ± 0.02031.94 ± 0.142.33 ± 0.06
20220.729 ± 0.00334.63 ± 0.232.37 ± 0.06
Mean0.695 ab ± 0.03132.75 ab ± 1.422.34 a ± 0.05
Treatment III: 3 L∙ha−120200.672 ± 0.00232.33 ± 0.152.37 ± 0.06
20210.710 ± 0.00232.97 ± 0.112.33 ± 0.06
20220.750 ± 0.01535.60 ± 0.312.40 ± 0.10
Mean0.711 b ± 0.03533.64 b ± 1.512.37 a ± 0.07
Year effect (p-value)0.00000.00000.2438
Dose effect (p-value)0.00190.01390.0436
Standard deviation0.041.680.07
Variation coefficient5.48%5.20%3.11%
The same markings (a, b) mean no statistically significant changes (p ≥ 0.05).
Table 8. Effect of mineral-organic multi-component fertilizer application on the macroelement content in plants (g∙kg−1 d.m.).
DoseYearPKCaMgNa
Control20201.98 ± 0.0629.90 ± 2.023.72 ± 0.181.87 ± 0.210.07 ± 0.01
20212.10 ± 0.0630.07 ± 1.624.25 ± 0.692.03 ± 0.350.09 ± 0.03
20222.07 ± 0.0629.53 ± 1.994.09 ± 0.661.95 ± 0.340.09 ± 0.05
Mean2.05 a ± 0.0829.83 a ± 1.654.02 a ± 0.541.95 a ± 0.280.08 a ± 0.03
Treatment I: 1 L∙ha−120202.05 ± 0.0830.85 ± 0.703.81 ± 0.681.88 ± 0.060.08 ± 0.02
20212.18 ± 0.0831.66 ± 0.693.90 ± 0.702.00 ± 0.160.10 ± 0.03
20222.15 ± 0.0831.46 ± 0.323.76 ± 0.671.93 ± 0.150.10 ± 0.03
Mean2.13 a ± 0.0931.32 a ± 0.633.82 a ± 0.601.94 a ± 0.120.10 a ± 0.03
Treatment II: 2 L∙ha−120202.04 ± 0.0731.60 ± 0.953.98 ± 0.671.90 ± 0.070.10 ± 0.03
20212.17 ± 0.0831.73 ± 0.304.09 ± 0.681.95 ± 0.070.12 ± 0.02
20222.14 ± 0.0731.56 ± 0.043.94 ± 0.661.88 ± 0.060.11 ± 0.02
Mean2.12 a ± 0.0931.63 ab ± 0.504.00 a ± 0.581.91 a ± 0.070.11 a ± 0.02
Treatment III: 3 L∙ha−120202.21 ± 0.0532.29 ± 0.563.94 ± 0.262.58 ± 0.390.12 ± 0.02
20212.35 ± 0.0532.77 ± 0.044.04 ± 0.262.65 ± 0.410.07 ± 0.03
20222.32 ± 0.0531.88 ± 0.383.89 ± 0.252.55 ± 0.390.12 ± 0.02
Mean2.29 b ± 0.0732.31 b ± 0.513.96 a ± 0.232.59 b ± 0.350.10 a ± 0.03
Year effect (p-value)0.00000.40710.58520.57680.5967
Dose effect (p-value)0.00000.00290.84160.00040.1648
Standard deviation0.121.290.490.370.03
Variation coefficient5.56%4.14%12.50%12.43%27.61%
The same markings (a, b) mean no statistically significant changes (p ≥ 0.05).
Table 9. Effect of mineral-organic multi-component fertilizer application on the microelement content in plants (mg∙kg−1 d.m.).
DoseYearCuMnFeZn
Control20206.99 ± 0.97206.37 ± 15.75108.47 ± 12.1055.42 ± 8.28
20217.45 ± 2.45211.65 ± 16.15123.49 ± 20.2565.48 ± 28.99
20227.82 ± 3.22203.82 ± 15.56120.50 ± 24.4140.71 ± 21.09
Mean7.42 a ± 2.11207.28 a ± 14.13117.49 a ± 18.3253.87 a ± 21.33
Treatment I: 1 dm3∙ha−1 20208.79 ± 5.02215.03 ± 6.51115.34 ± 11.5041.60 ± 5.28
20218.12 ± 3.34220.53 ± 6.67137.10 ± 7.4342.66 ± 5.41
20228.68 ± 4.96212.37 ± 6.43126.22 ± 37.1741.09 ± 5.21
Mean8.53 a ± 3.91215.98 ab ± 6.71126.22 ab ± 21.93 41.78 a ± 4.64
Treatment II: 2 dm3∙ha−120209.51 ± 3.66223.56 ± 19.87123.19 ± 3.8744.46 ± 5.51
20218.81 ± 3.69242.65 ± 16.76133.18 ± 13.8545.60 ± 5.65
20229.99 ± 3.47252.79 ± 3.09128.26 ± 10.8252.73 ± 4.14
Mean9.44 a ± 3.17239.67 bc ± 18.35128.21 ab ± 9.9847.60 a ± 5.91
Treatment III: 3 dm3∙ha−1202010.59 ± 1.02255.95 ± 3.13138.14 ± 1.79 46.41 ± 12.26
20219.27 ± 2.21262.51 ± 3.21149.64 ± 2.4258.74 ± 16.93
202212.48 ± 1.74233.67 ± 16.14131.02 ± 5.2743.92 ± 5.44
Mean10.78 a ± 2.05250.71 c ± 15.54139.60 b ± 8.6946.36 a ± 11.00
Year effect (p-value)0.89480.38450.10320.6533
Dose effect (p-value)0.13780.00020.04480.1724
Standard deviation9.04 ± 3.05228.41 ± 22.43127.88 ± 17.0447.40 ± 12.80
Variation coefficient33.78%9.82%13.33%26.99%
The same markings (a, b, c) mean no statistically significant changes (p ≥ 0.05).
Disclaimer/Publisher’s Note: The statements, opinions and data contained in all publications are solely those of the individual author(s) and contributor(s) and not of MDPI and/or the editor(s). MDPI and/or the editor(s) disclaim responsibility for any injury to people or property resulting from any ideas, methods, instructions or products referred to in the content.

