Article

Improving Rice Yield by Promoting Pre-anathesis Growth in Subtropical Environments

1
Key Laboratory of Southwest Rice Biology and Genetic Breeding, Ministry of Agriculture, Rice and Sorghum Research Institute, Sichuan Academy of Agricultural Sciences, Deyang 618000, China
2
Crop Ecophysiology and Cultivation Key Laboratory of Sichuan Province, Chengdu 611130, China
*
Author to whom correspondence should be addressed.
These authors contributed equally to this work.
Agronomy 2023, 13(3), 820; https://doi.org/10.3390/agronomy13030820
Submission received: 3 February 2023 / Revised: 1 March 2023 / Accepted: 9 March 2023 / Published: 10 March 2023
(This article belongs to the Section Farming Sustainability)

Abstract

:
Rice yield is greatly influenced by climatic factors and soil fertility in the location where it is grown, but information about the individual effects of climatic factors and soil fertility variables is difficult to distinguish because they are often not independent. The objective of this study was to demonstrate the effect of climatic factors on grain yield when soil fertility was not a confounding factor for explaining yield differences across two subtropical environments. Field and pot experiments with six rice cultivars were conducted in Deyang and Luzhou, Sichuan Province, China. We found that rice yield was higher in Deyang than in Luzhou by 7.0–16.8% for field experiments and by 57.6–87.4% for pot experiments. Biomass production rather than harvest index was responsible for the yield difference. Maximum and minimum temperatures and cumulative solar radiation (CSR) before heading (HD) were higher in Deyang than in Luzhou, whereas after HD, maximum and minimum temperatures were lower in Deyang than in Luzhou. Rice yield was more closely related to maximum and minimum temperatures and CSR before HD than to these parameters after HD. There was no difference in yield between soil types from Deyang and Luzhou within the same ecological condition. Thus, the yield difference between the two subtropical environments was mainly caused by the difference in climatic factors. The differences in biomass between Deyang and Luzhou were mostly due to variations in pre-heading crop growth rate (pre-CGR) and pre-heading radiation use efficiency (pre-RUE), which were induced by varying temperatures and CSR. We concluded that lower yield in Luzhou was associated with lower pre-CGR and pre-RUE. Our study suggests that developing rice cultivars with high pre-CGR and pre-RUE through a breeding program may also be a feasible approach to achieve high yield in subtropical environments.

1. Introduction

Rice is one of the world’s most important crops and is a staple food for more than half of the world’s population [1]. Rice cultivation accounts for 25% of China’s total cultivated area [2] and contributes ~30% of global rice production [3]. Maintaining high rice productivity in China is of great significance to the world’s food security [4]. Approximately 114 million tons of additional milled rice will be required to meet the growing demand for food resulting from population growth by 2035 [5]. To achieve this goal, it is critically important to develop new, high-yielding rice varieties to further improve the average farm rice grain yields [6]. As of 2021, 135 rice varieties with great yield potential have been approved as ‘super rice’ varieties by the Ministry of Agriculture of China [7]. Some of these varieties have produced grain yields of more than 15.0 t ha−1 [8,9,10]. Nevertheless, rice yield depends not only on the genetic characteristics of the plant but also on environmental factors [11]. The yield potential of irrigated rice is largely influenced by environmental factors that include air temperature, solar radiation, and soil fertility [12,13,14,15], which are less easily controlled factors [16].
Recently, several field studies have shown that there are large differences in grain yields between tropical and subtropical environments at different latitudes and altitudes [11,17,18,19]. It is generally thought that favorable climatic conditions that include higher incident solar radiation, lower temperature, and higher solar radiation during the grain filling period [11,17], higher radiation use efficiency and crop growth rate, and lower maintenance respiration contribute to achieving higher rice yields [13,19]. Compared with tropical environments (International Rice Research Institute Research farm, Philippines), the grain yields of irrigated rice crops were 33–62% higher when grown in subtropical environments (Yunnan Province, China) mainly due to lower temperatures during the grain filling period that induced a longer growth duration and lower maintenance respiration [17]. In a comparison of rice yields between two subtropical environments (Yunnan and Jiangsu Province, China), Yunnan produced 83–97% higher rice yields than Jiangsu [20]. The higher solar radiation, lower temperature, and large diurnal temperature range are the three important climatic factors that together explain the yield gap between the two locations. Recently, a study was conducted to compare grain yields of irrigated rice among five Provinces in China (Guizhou, Hunan, Guangdong, Guangxi, and Hainan) [11]. Guizhou had 23–89% higher rice yields compared to the other four sites mainly due to the lower temperature and higher accumulative solar radiation during the grain filling period in Guizhou. However, most previous studies have neglected to address the effects of paddy field soil fertility on rice yield, and higher rice yields in hybrid rice do not depend on the nitrogen (N) application rate under moderate to high soil fertility conditions [21]. In fact, there were large differences in soil fertility (especially total N and organic matter) between the tropical and subtropical paddy fields in the earlier studies [11,17,20]. This means that the previous studies on the effects of climatic factors on rice yield do not exclude the effects of paddy field soil fertility at different latitudes and altitudes. It was difficult to distinguish the individual effects of climatic factors and soil fertility on the variations in grain yield.
The soil-based yield (yield in plots without added N) comprehensively reflects the climatic productivity and the paddy field soil fertility. Zou et al. [12] demonstrated that there is a significant positive linear relationship between the soil-based yield and the fertilized yield (yield in plots with added N), and the incremental yield increase in the plot with added N was tightly and negatively related with the soil-based yield contribution. The studies of Jiang et al. [11,22] reported that the soil-based yield varied greatly among five environments in five provinces (including Guizhou, Hunan, Guangdong, Guangxi, and Hainan) at different latitudes and altitudes. The soil-based yield was 17–136% higher in Guizhou than in the other four environments, while the differences in grain yields resulting from N applications in the five environments were relatively small. In that study, we could not determine the effects of climatic factors and soil fertility on the yield differences among the five environments because the higher soil-based yield was mainly associated with lower temperatures and higher accumulative solar radiation during the grain filling period and the higher soil fertility in Guizhou. Wang et al. [13] reported that grain yields in irrigated rice were 9–66% higher in the subtropics than in the tropics due to the lower temperatures in the subtropical environments. Again, the effects of soil fertility on the differences in yield between the subtropics and the tropics were not excluded in that study. Overall, the quantitative influences of climatic factors and soil fertility on biomass productivity and grain yield have not been fully evaluated for mid-season high-yielding rice grown under different ecological conditions. Characterizing the differences in climatic factors and soil fertility and how they relate to biomass production, yield formation, crop growth rate (CGR), and radiation use efficiency among rice genotypes under different ecological conditions may lead to a strategy for further improving the yield potential of high-yielding rice hybrids and varieties.
In the present study, we conducted field experiments and pot experiments with four rice hybrids and two inbred varieties at locations in Luzhou City and Deyang City, Sichuan Province, China, from 2018 to 2020. The objectives of this study were to (1) determine the primary yield components and the physiological traits responsible for the yield differences in the two environments at different latitudes and altitudes, (2) determine the effects of climatic factors on yield variation between two subtropical environments, and (3) clarify relationships between climatic factors and rice grain yield, biomass, crop growth rate, and radiation use efficiency.

2. Materials and Methods

2.1. Field Experiments

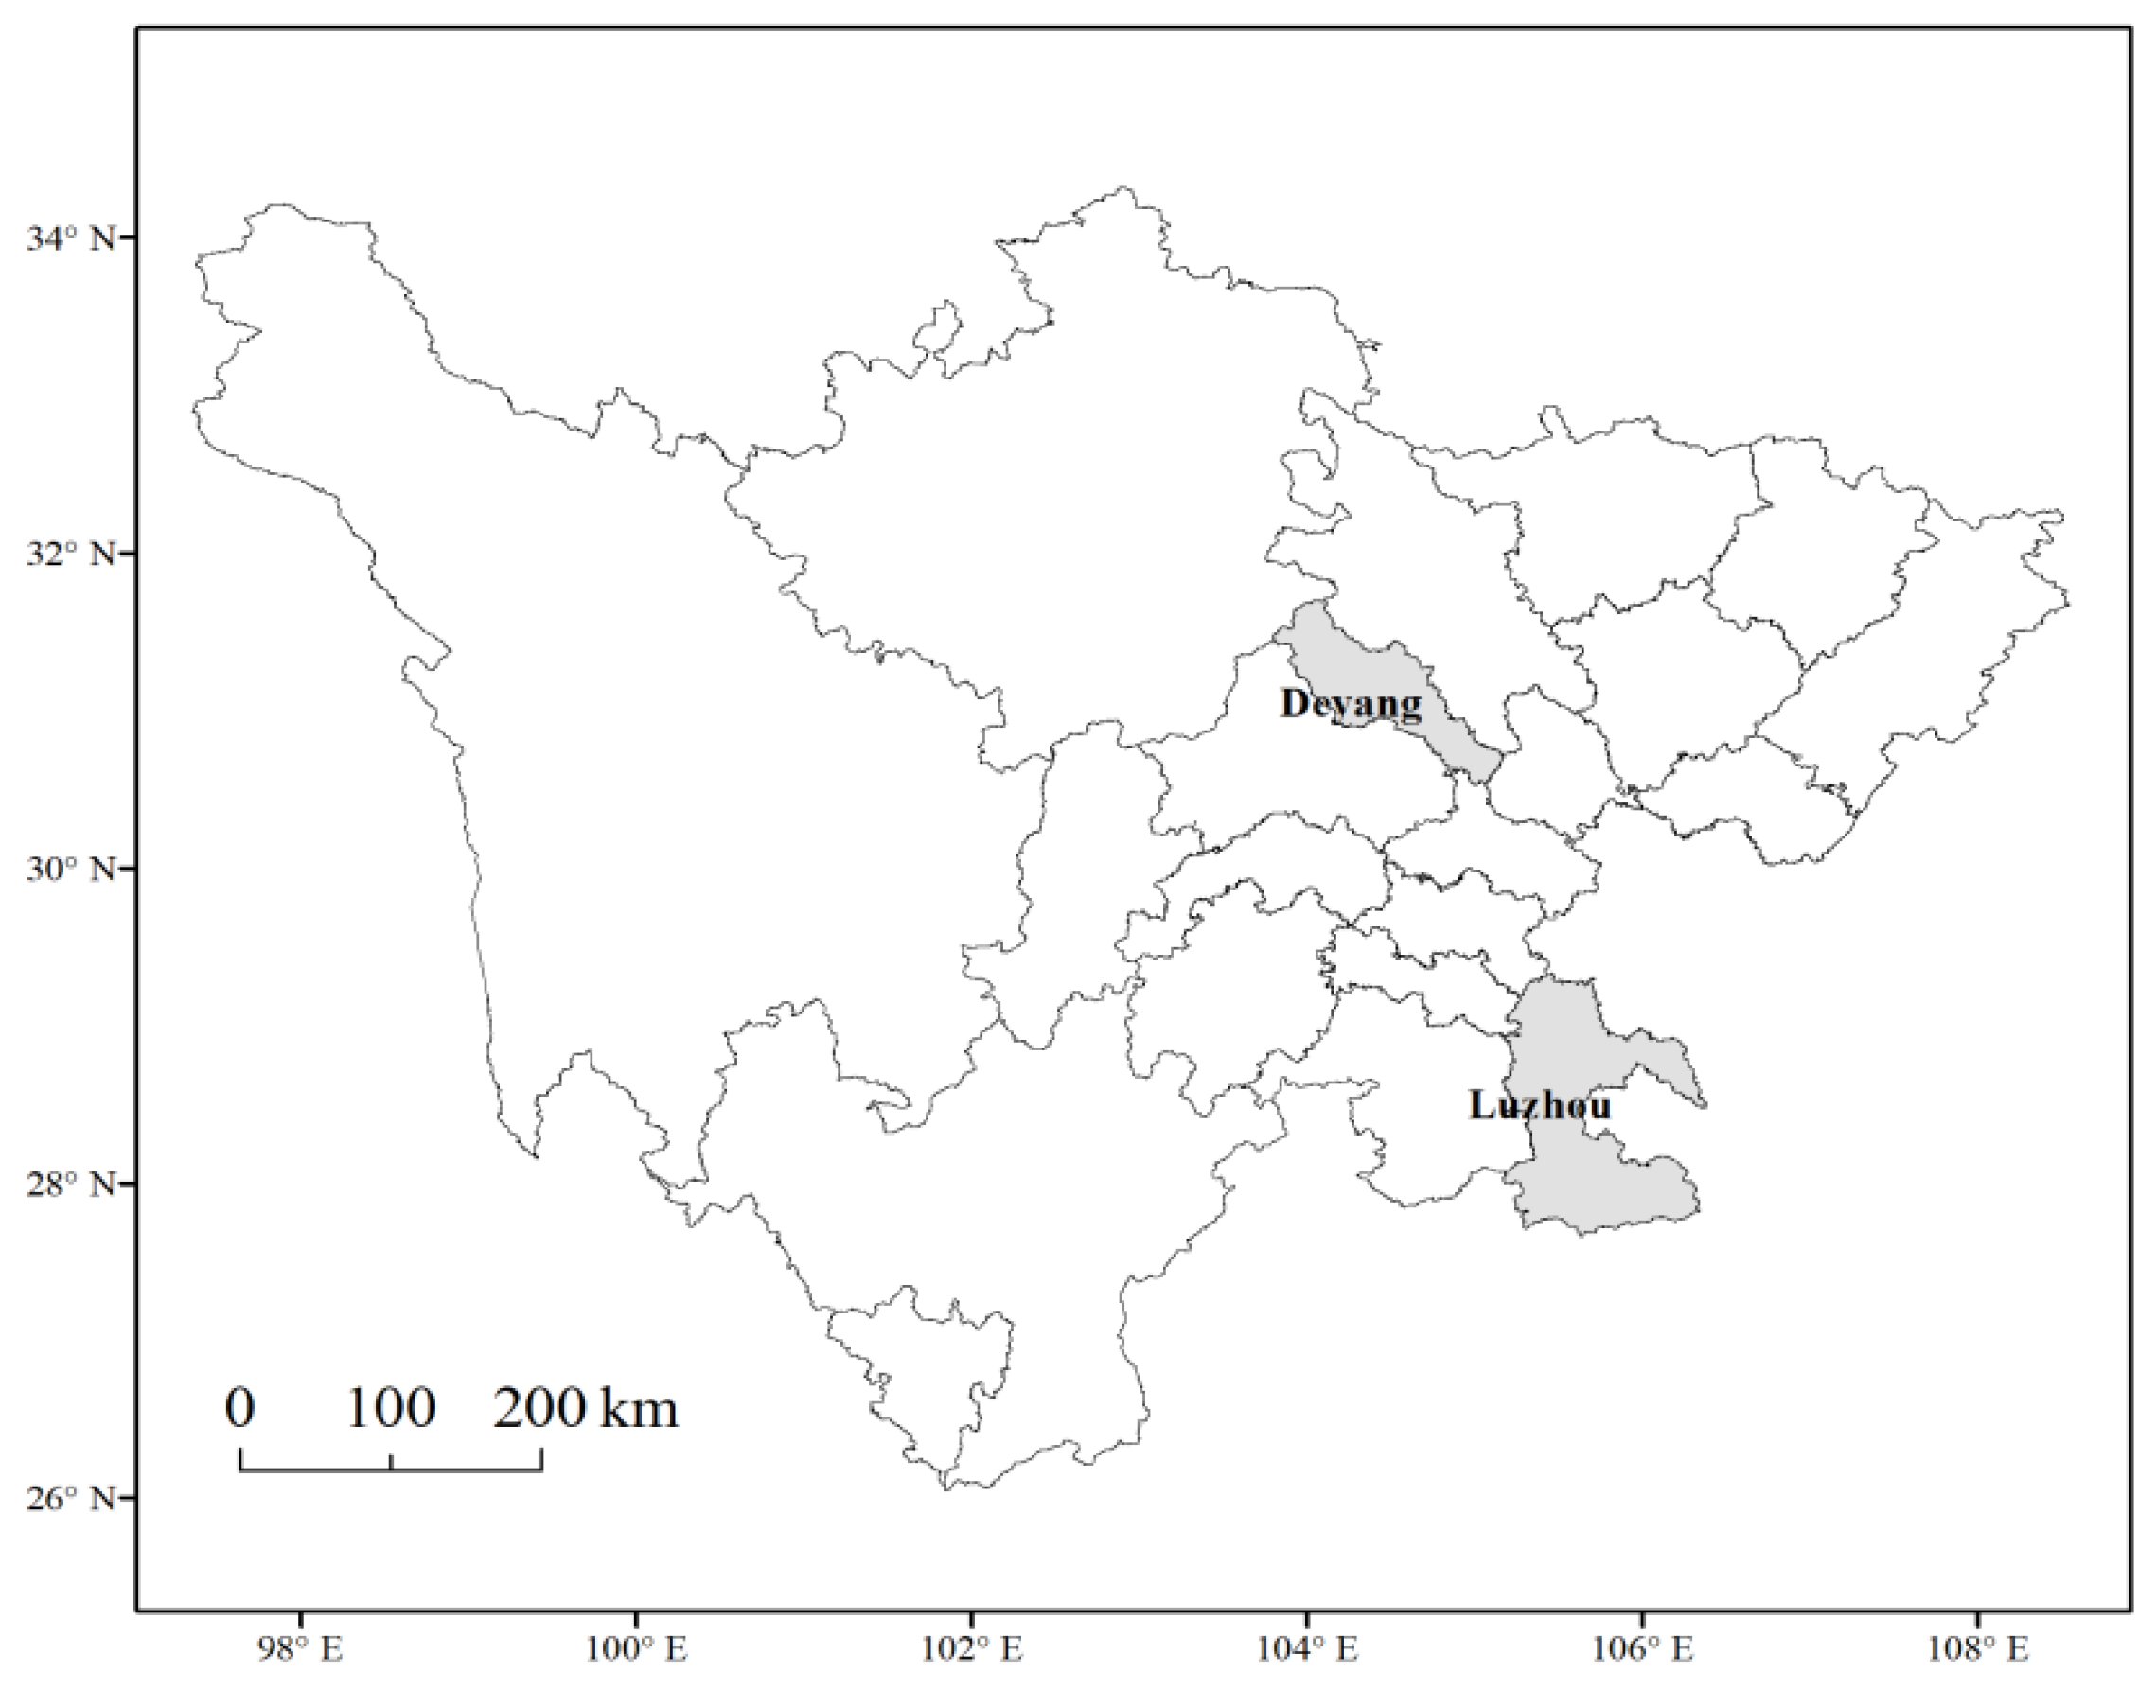
Field experiments were conducted in Deyang (Chengdu Plain, 31°14′ N, 104°16′ E, 490 m asl) and Luzhou (a hilly and mountainous area of Southeast Sichuan Province, 29°19′ N, 105°23′ E, 290 m asl), both of which located in Sichuan Province, from 2018 to 2020 (Figure 1). The properties of the experimental soil are presented in Table 1. Soil testing was performed on samples taken from the upper 20 cm layer of the soil before the rice seedlings were transplanted in 2018.
Each year, four indica hybrid rice cultivars (‘Deyou4727’, ‘Luyou727’, ‘Nei6you103’, and ‘Nei6you107’) and two indica elite inbred rice cultivars (‘Huanghuazhan’ and ‘Jinnongsimiao’) were planted at each site. The rice cultivars were arranged in a completely randomized block design with three replicates each. Pre-germinated seeds were sown in a seedbed on 1 April in Deyang and on 5 March in Luzhou from 2018 to 2020. The seedlings were transplanted at a spacing of 26.4 cm × 20 cm with two seedlings per hill. Seedling age at transplanting was 33–36 d in Deyang and 32–35 d in Luzhou. The fertilizers used were urea for N, single superphosphate for phosphorus (P), and potassium chloride for potassium (K) at doses of 180 kg N ha−1, 67.5 kg P2O5 ha−1, and 150 kg K2O ha−1, respectively. N was applied in three splits: 50% as basal, 20% at early tillering (seven days after transplanting), and 30% at panicle initiation. P was applied as basal. K was applied in two splits: 50% as basal and 50% at panicle initiation. In Deyang, the water management practice was in the sequence of flooding, midseason drainage, re-flooding, and moist intermittent irrigation. In Luzhou, the paddy fields were kept flooded for the entire growing season. Insects, diseases, and weeds were intensively controlled throughout the entire growing season to avoid yield losses.
The determination of yield components and biomass of rice followed the Chen’s method [23]. Six hills were sampled from each plot at full heading (about 80% of the panicles had emerged from the flag leaf sheath) and maturity in each year. In all sampling procedures, the three border lines were excluded to avoid border effects. Plant samples at HD were separated into stems, leaves, and panicles. Green leaf area was measured and expressed as leaf area index (LAI). Plant samples, taken at maturity after counting the panicle number, were hand-threshed and the filled grains were separated by submerging them in tap water. Three subsamples of 30 g filled grains and all unfilled spikelets were taken to count the number of spikelets. The dry weight of each plant organ was determined after oven-drying at 70 °C to a constant weight. Pre-heading, post-heading, total biomass production, biomass remobilization (i.e., pre-heading biomass translocated to the grains), harvest index, crop growth rate (CGR) during the pre- and post-heading periods, panicles per m2, spikelets per panicle, grain filling, and grain weight were calculated. The apparent radiation use efficiency (RUE) during the pre- and post-heading periods was calculated by dividing the pre- and post-heading biomass production by the cumulative solar radiation during the corresponding period. Grain yield was determined from a 5 m2 area in the middle of each plot and adjusted to a moisture content of 13.5%. The apparent radiation use efficiency was calculated according to the Chen’s method [23].

2.2. Pot Experiments

Pot experiments were also conducted in Deyang City (31°14′ N, 104°16′ E, 490 m asl) and Luzhou City (29°19′ N, 105°23′ E, 290 m asl) in the same paddy fields where we conducted the field experiments in Sichuan Province in 2019 and 2020. In each site, the soil used in the pot experiments was collected from the top 25 cm layer of the same paddy fields in Deyang and Luzhou where the field experiments were conducted.
Before filling the pots, the soil was air-dried, pulverized, and well mixed. Each pot was filled with 10 kg of air-dried soil. One day before transplanting, the pots were filled with tap water, and fertilizers were applied to the pots and mixed well. The rice cultivars and fertilizer application rates were the same as those used in the field experiments. Each rice cultivar was replicated three times with two pots per replication, and the pots were arranged in a completely randomized design. Each pot had four hills with two seedlings per hill. The distance between the pots was kept at 25 cm to avoid them shading each other. There were 72 pots in each site: 36 pots containing soil taken from the top 25 cm layer of the paddy field in Deyang, and another 36 pots containing soil taken from the top 25 cm layer of the paddy field in Luzhou. All the pots were kept flooded for the entire growing season. Insects, diseases, and weeds were intensively controlled throughout the growing season to avoid yield loss.
The plants were sampled at maturity and were hand-threshed after the panicles were counted. Filled spikelets were separated from unfilled spikelets by submerging them in tap water. Three subsamples consisting of 30 g of filled grains and all unfilled spikelets were taken to count the numbers of spikelets. The dry weight of each plant organ was determined after oven-drying at 70 °C to a constant weight. The numbers of panicles per hill and spikelets per panicle, the grain filling, the grain weight, the grain yield per hill, biomass production, and the harvest index were then calculated.

2.3. Statistical Analysis

Climatic data were obtained from the local meteorological bureaus. The Statistix 8 software package (Analytical Software, Tallahassee, FL, USA) was used to perform an analysis of variance (ANOVA). For the field experiments, the statistical model for ANOVA included replication, year (Y), location (L), cultivar (C), the two-factor interactions of Y × L, Y × C, and L × C, and the three-factor interaction of Y × L × C. For the pot experiments, the statistical model for ANOVA included replication, location (L), soil (S), cultivar (C), the two-factor interactions of L × S, L × C, and S × C, and the three-factor interaction of L × S × C. The criterion for statistical significance was set at the 0.05 probability level.

3. Results

3.1. Field Experiments

3.1.1. Growth Duration

The growth duration of rice cultivars from transplanting (TR) to heading (HD) was nearly the same in both the Deyang and Luzhou locations, but rice plants grown in Deyang had 4–7 d longer growth duration than rice plants in Luzhou from HD to maturity (MA) (Table 2). Longer growth duration was generally observed in the hybrid rice cultivars than in the inbred rice cultivars. On average, hybrid rice cultivars had a 4–6 d longer growth duration than the inbred rice cultivars from TR to HD, and the growth duration from HD to MA was 1–2 d longer in the hybrid rice cultivars than in the inbred rice cultivars.

3.1.2. Grain Yields and Yield Components in the Six Rice Cultivars

Grain yields differed significantly among cultivars (C), locations (L), and years (Y), and a significant interaction occurred between Y and L (Table 3). The interactive effects of Y × C, L × C, and Y × L × C were not significant for grain yield. On average, rice grown in Deyang had 7.0–16.8% higher grain yield than rice grown in Luzhou. Hybrid rice cultivars produced higher grain yields than the inbred rice cultivars by 18.7% in Luzhou and 14.8% in Deyang. Among the yield components, panicles per m2 and the percentage of filled grains explained most of the yield gap between the two locations (Table 3). Plants grown in Deyang had more panicles per m2 and a higher percentage of filled grains than plants grown in Luzhou by 8.8–22.9% and 5.5–11.2%, respectively. The number of spikelets per panicle was 1.8–10.3% higher in Deyang than in Luzhou in 2018 and 2019, while there were 4.2% fewer spikelets per panicle in plants grown in Deyang than in plants grown in Luzhou in 2020. The difference in grain weights between the two locations was relatively small. The inbred rice cultivar ‘Jinnongsimiao’ generally recorded the highest number of spikelets per panicle and the lowest number of panicles per m2. On average, hybrid rice cultivars produced more panicles per m2 and higher grain weight than the inbred rice cultivars by 8.9% and 37.7%, respectively; however, there were fewer spikelets per panicle and fewer filled grains in the hybrid rice cultivars than in the inbred rice cultivars by 23.3% and 1.0%, respectively.

3.1.3. Climatic Factors and Their Relationships with Grain Yield

The maximum temperatures (except from TR to HD in 2018) were 0.5–1.1 °C higher but 0.6–2.3 °C lower in Deyang compared to Luzhou from TR to HD and from HD to MA, respectively (Table 4). The minimum temperature was higher in Deyang than in Luzhou from TR to HD by 0.3–0.9 °C, whereas from HD to MA, the minimum temperature was lower in Deyang than in Luzhou by 1.6–2.6 °C. The cumulative solar radiation was higher in Deyang than in Luzhou by 14.2–106.6 MJ m−2 from TR to HD and 40.3–112.7 MJ m−2 from HD to MA. The hybrid rice cultivars experienced similar or slightly higher maximum and minimum temperatures from TR to HD and from HD to MA than the inbred rice cultivars. The average cumulative solar radiation was higher for hybrid rice cultivars than for inbred rice cultivars by 99.7 MJ m−2 from TR to HD and by 18.9 MJ m−2 from HD to MA.
Grain yield was positively correlated with the maximum and minimum temperatures from TR to HD, but grain yield was negatively correlated with the maximum and minimum temperatures from HD to MA, and grain yield was more closely correlated with the minimum temperature than the maximum temperature regardless of growth duration from TR to HD and from HD to MA (Figure 2a,b,d,e). There were positive relationships between grain yield and cumulative solar radiation from TR to HD and from HD to MA (Figure 2c,f), and grain yield was more closely correlated with cumulative solar radiation from TR to HD than from HD to MA. Approximately 91.3% and 60.8% of the variation in yield was explained by cumulative solar radiation from TR to HD and from HD to MA, respectively.

3.1.4. Biomass Production

Pre-heading biomass production was 9.3–46.0% higher in Deyang than in Luzhou, and the post-heading biomass production was similar or higher in Deyang than in Luzhou (Table 5). Consequently, total biomass production was 17.1–30.0% higher in Deyang compared to Luzhou. Deyang had 4.9% lower biomass remobilization than Luzhou in 2018, but biomass remobilization was 82.7–107.3% higher in Deyang than in Luzhou in 2019 and 2020. The harvest index was 2.7–6.4% higher in Deyang than in Luzhou. On average, pre- and post-heading biomass production, total biomass production, and biomass remobilization were 20.2%, 14.7%, 18.5%, and 16.4% higher in hybrid rice cultivars than in inbred cultivars, respectively, while the harvest index for hybrid rice cultivars was 2.5% lower than in inbred cultivars.
The relationships between grain yield and biomass production, during the pre- and post-heading periods, and total biomass were significant (Figure 3a–c), and grain yield correlated more closely with total biomass production than it did with biomass production during the pre- and post-heading periods. Biomass production was positively correlated with the maximum and minimum temperatures during the pre-heading period, but it was negatively correlated with maximum and minimum temperatures during the post-heading period (Figure 4a,b,d,e). Biomass production was significantly positively correlated with cumulative solar radiation during both the pre- and post-heading periods (Figure 4c,f).

3.1.5. Leaf Area Index (LAI), Crop Growth Rates, and Radiation Use Efficiency

Rice plants grown in Deyang had 30.0–68.1% higher LAI than plants grown in Luzhou at the full heading stage (Table 6). The average LAI of hybrid rice cultivars was 6.6, which was 31.0% higher than in inbred rice cultivars. The crop growth rate (CGR) was 6.8% and 58.9% higher during the pre- and post-heading periods in Deyang compared to Luzhou in 2018, respectively. CGR was 25.6–46.8% higher during the pre-heading period but 13.8–22.8% lower during the post-heading period in Deyang compared to Luzhou in 2019 and 2020. On average, hybrid rice cultivars had 12.3% and 9.5% higher CGR during the pre- and post-heading periods, respectively, compared to inbred rice cultivars. Apparent radiation use efficiency (RUE) was 8.9% and 67.3% higher during the pre- and post-heading periods, respectively, in Deyang than in Luzhou in 2018. RUE was 17.6–40.3% higher during the pre-heading period but 13.0–21.4% lower during the post-heading period in Deyang compared to Luzhou in 2019 and 2020. The average RUE of the hybrid rice cultivars during the pre- and post-heading periods was 0.82 and 0.92 g MJ−1, respectively, which was 12.4% and 9.9% higher than the RUE of inbred rice cultivars, respectively.
The relationships of grain yield with CGR and RUE were significant during the pre-heading period but not during the post-heading period (Figure 5a,b; Figure 6a,b). Significant positive relationships between CGR and maximum temperature, minimum temperature, and cumulative solar radiation were observed during the pre-heading period but not during the post-heading period (Figure 7a–f).

3.2. Pot Experiments

3.2.1. Grain Yield and Yield Components

Grain yield per hill was significantly affected by location (L) and cultivar (C), but not by soil (S), whereas the interactive effects of L × S, L × C, S × C, and L × S × C were not significant for grain yield per hill (except the interactive effects of L × S in 2020) (Table 7). Rice grain yield per hill was higher in Deyang than in Luzhou by 57.6–65.8% for the soil from Luzhou and by 58.5–87.4% for the soil from Deyang. Within the same ecological conditions (same location), the difference in grain yield per hill between the two soils was relatively small. The average grain yield per hill of the hybrid rice cultivars was 6.6% higher than inbred rice cultivars.
On average, plants grown in Deyang had more panicles per hill, more spikelets per panicle, better grain filling, and higher grain weight than plants grown in Luzhou by 54.1%, 0.4%, 8.2%, and 3.7%, respectively. Within the same ecological conditions (same location), the number of panicles per hill of soil from Deyang was 0.8–11.7% lower than in the soil from Luzhou, while there were 5.0–29.6% more spikelets per panicle in soil from Deyang than in soil from Luzhou. The differences in grain filling and grain weight between the two soils were relatively small. The inbred rice cultivar ‘Jinnongsimiao’ generally recorded the highest spikelet number per panicle and the fewest number of panicles per hill. On average, hybrid rice cultivars had more panicles per hill and higher grain weight than inbred rice cultivars by 12.1% and 38.2%, respectively, while there were 31.4% fewer spikelets per panicle and 1.5% fewer filled grains in the hybrid rice cultivars compared to the inbred rice cultivars.

3.2.2. Biomass Production and Harvest Index

Biomass production was significantly affected by location and cultivar, but not by soil type (Table 8). Biomass production was 58.8–123.0% higher in Deyang than in Luzhou, while the harvest index was 0.4–16.1% lower in Deyang than in Luzhou. On average, hybrid rice cultivars had 11.0% higher biomass production than inbred rice cultivars, while the harvest index was 3.9% lower for hybrid rice cultivars than for inbred rice cultivars. Within the same ecological conditions (same location), the differences in biomass production and harvest index between the two soil types were relatively small.

4. Discussion

Previous studies have reported that the grain yields of irrigated rice varied greatly depending on the environment in which the crop was grown [11,17,19,20]. In the present study, we compared the grain yield of irrigated rice grown in the field in Deyang with that grown in Luzhou and found that yield was 7.0–16.8% higher in Deyang than it was in Luzhou (Table 3). This agrees with the results of previous field studies that were performed in locations in the subtropics or both the subtropics and tropics [11,18,19]. Peng et al. [24] reported that rice yield declines by 10% for each 1 °C increase in the growing-season minimum temperature in the tropics. Previous field studies have also reported that high rice yields can be achieved in environments with intense solar radiation [19,20,
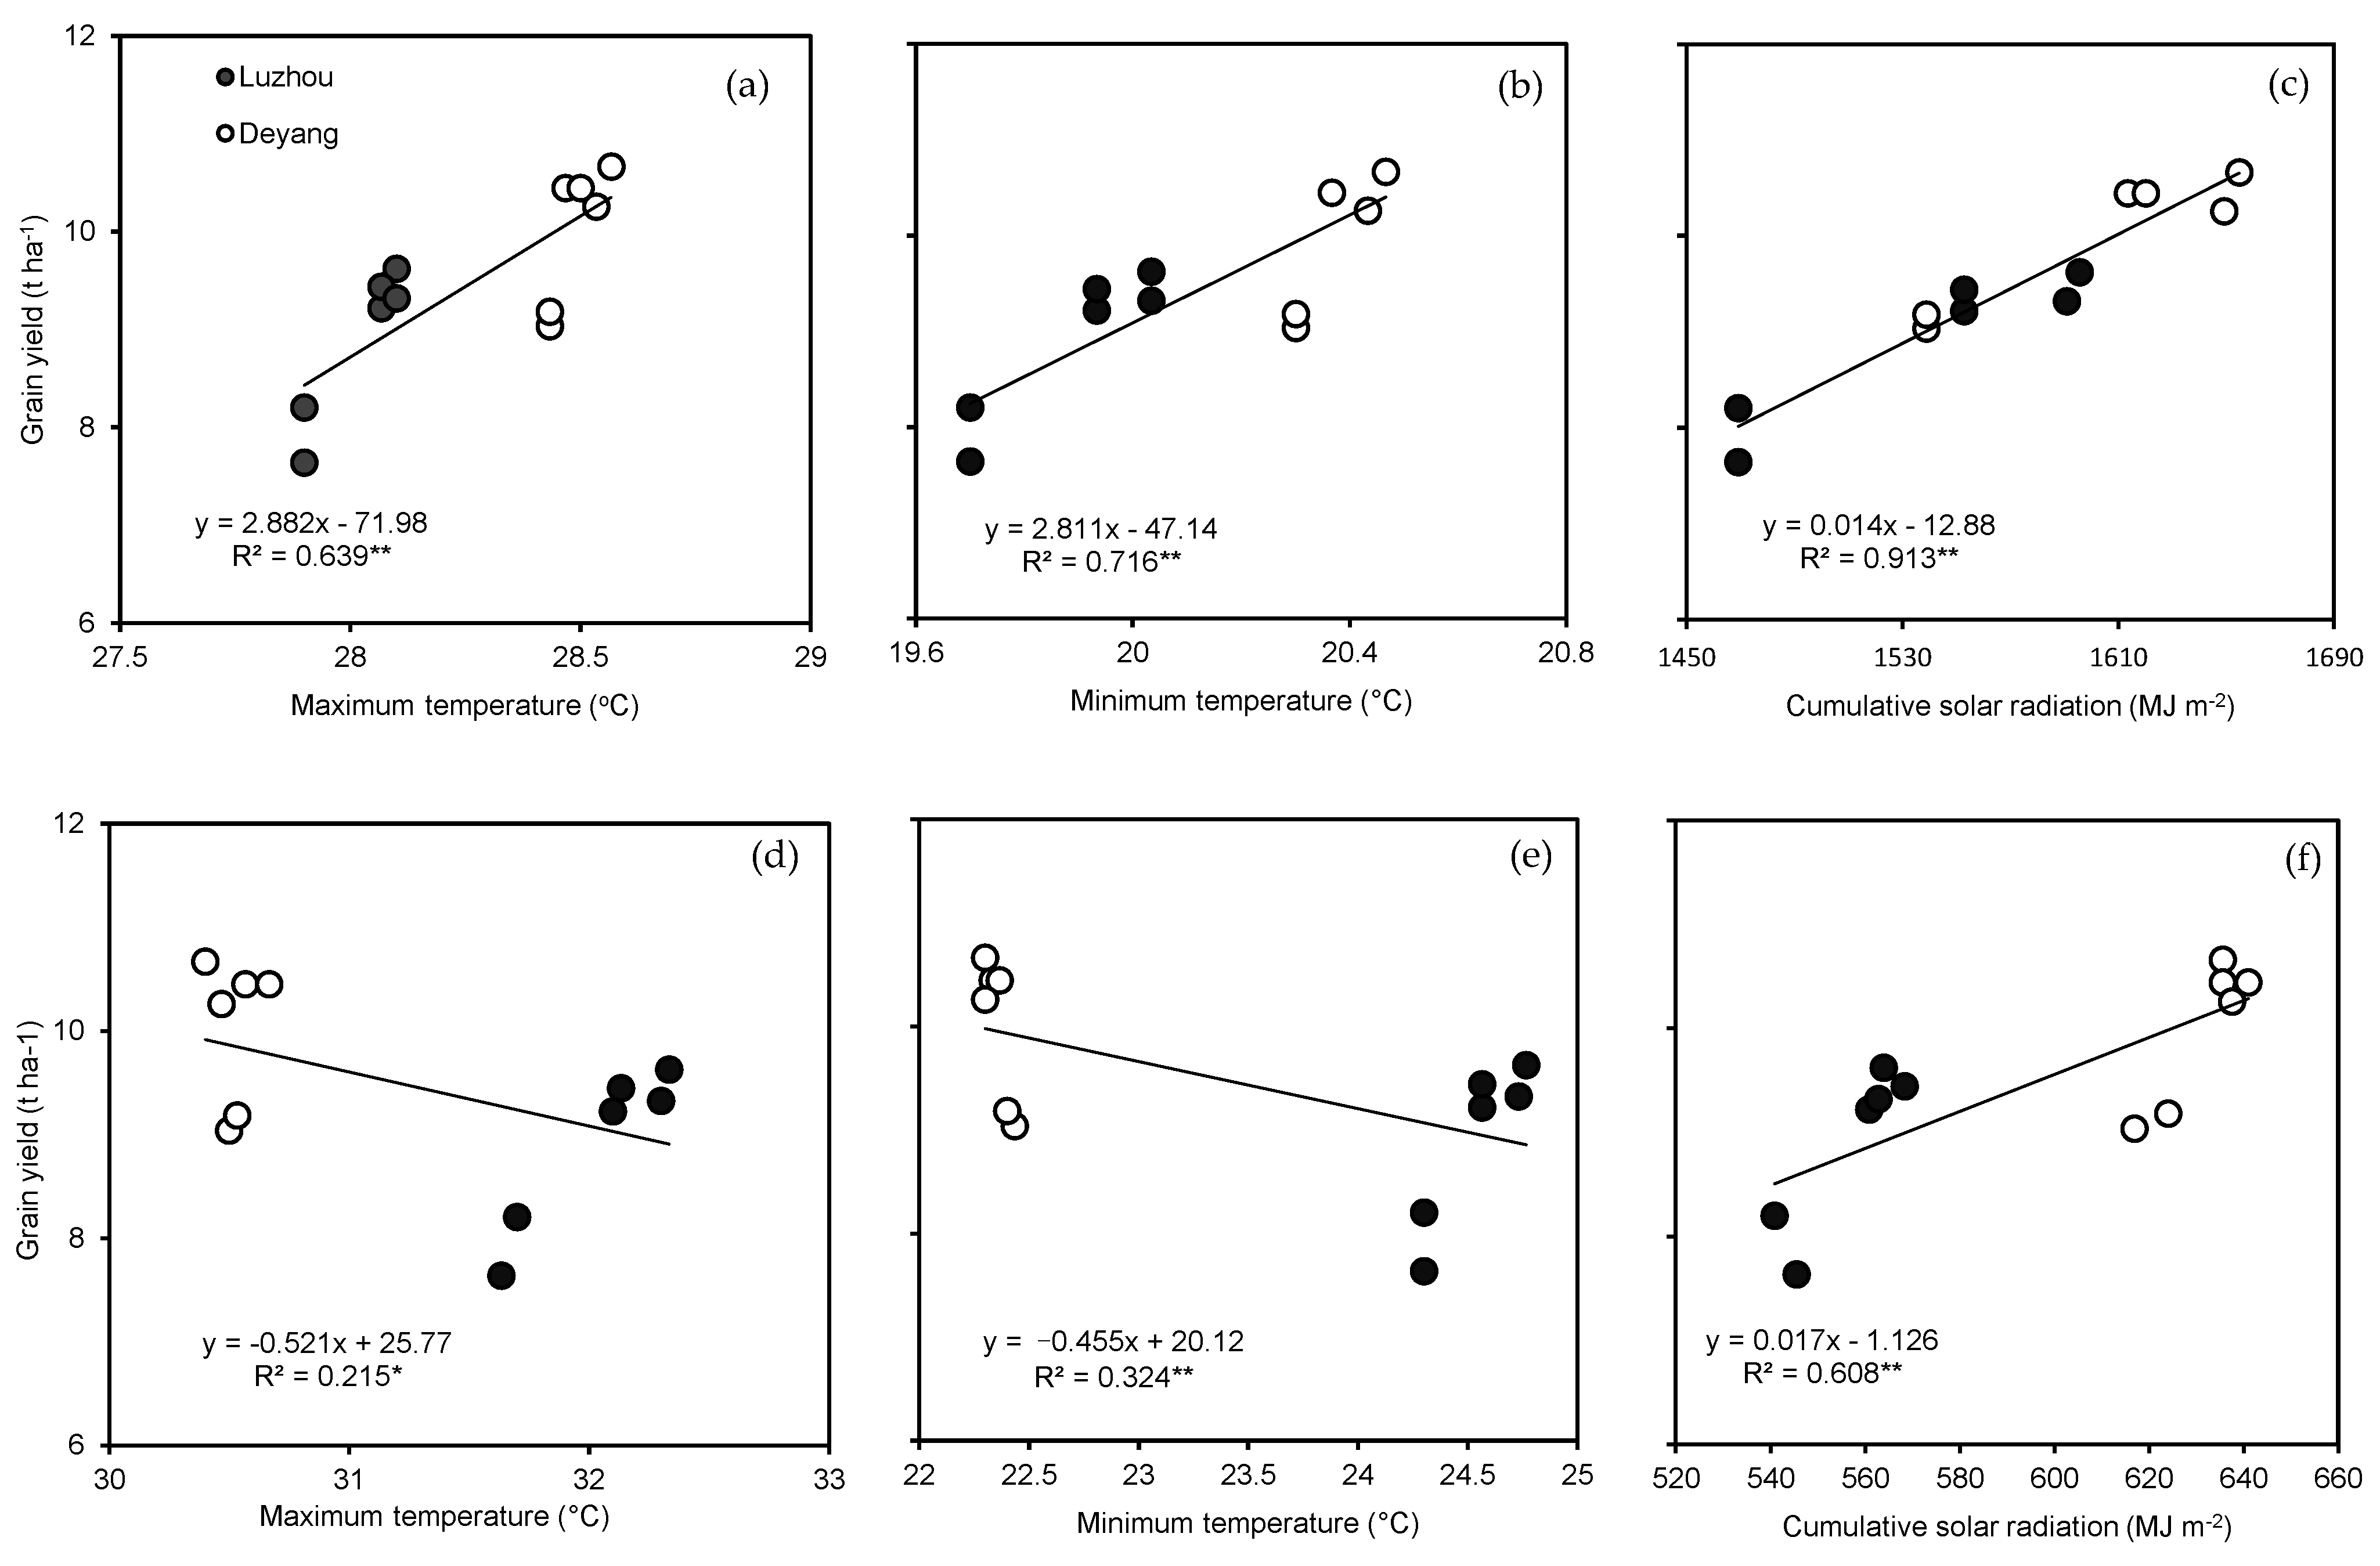
25], which indicates that solar radiation is an important climatic factor that limits grain yield in rice. In our study, the Deyang location experienced higher temperatures before HD and lower temperatures after HD than the Luzhou location. Furthermore, rice yield was significantly positively correlated with maximum and minimum temperatures before HD, while there was a significant negative relationship between grain yield and the maximum and minimum temperatures after HD (Figure 2a,b,d,e). The cumulative solar radiation was higher in the Deyang location than in Luzhou by 14.2–106.6 MJ m−2 before HD and by 40.3–112.7 MJ m−2 after HD (Table 4). Moreover, rice yield was significantly positively correlated with cumulative solar radiation before and after HD, and rice yield was correlated more closely with the cumulative solar radiation before HD than after HD (Figure 2c,f). This finding indicates that the temperatures and cumulative solar radiation can explain the yield gap between the two locations. When the comparison of rice yields was made for the pot experiments, rice yield was higher in Deyang than in Luzhou by 57.6–65.8% for plants grown in the soil from the Luzhou location and by 58.5–87.4% for plants grown in the soil from the Deyang location (Table 7). Within the same ecological conditions (same growth location), there was no significant difference in rice yield between the two soils from Deyang and Luzhou (
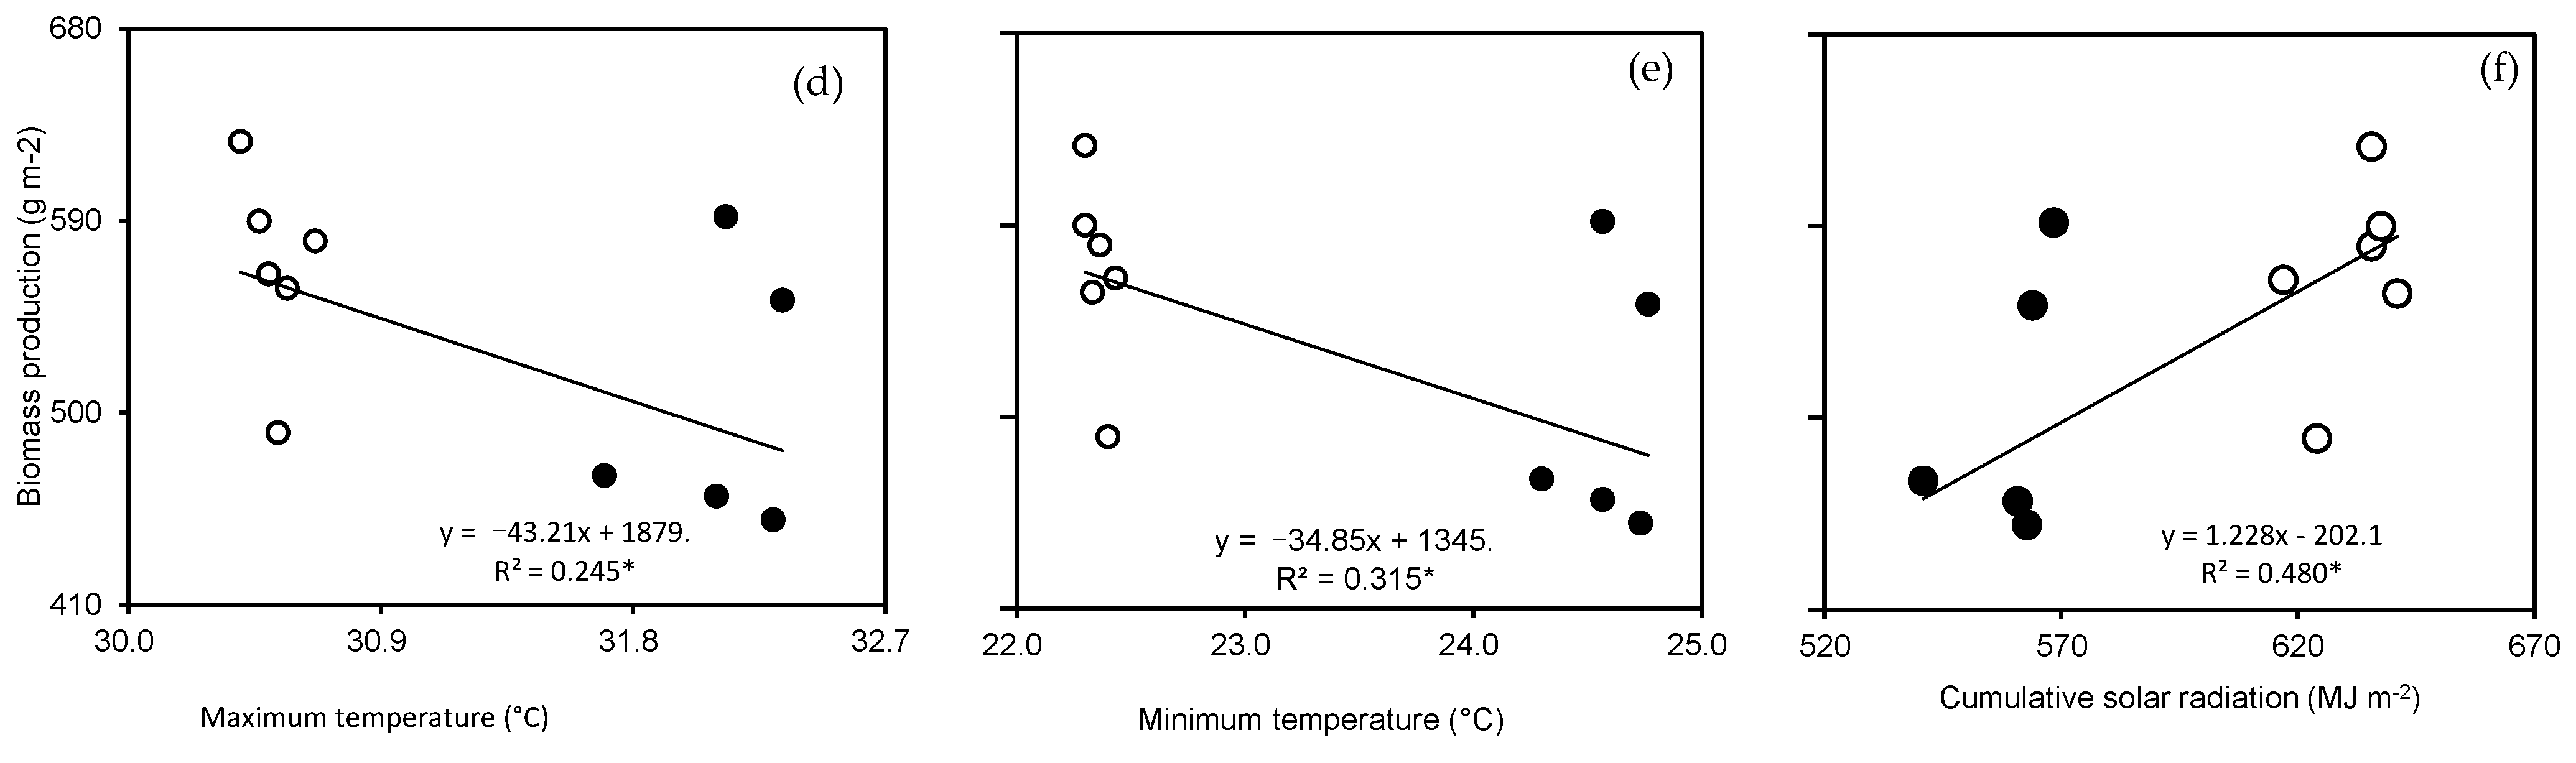
Table 7), although the soil fertility (except for available P) of the soil from Deyang was higher than that from Luzhou. This finding further indicates that large differences in rice yield are mainly caused by differences in climatic factors. Therefore, the field and pot experiments were combined to clarify the effects of climatic factors and soil fertility on the yields of irrigated rice grown under different ecological conditions. Based on the results of our study, we can state that the maximum and minimum temperatures and cumulative solar radiation are the important climatic factors that explain the yield gap between the Deyang location and the Luzhou location and that the effects of soil fertility on grain yield in irrigated rice are relatively small. Those results indicate that the maximum and minimum temperatures and cumulative solar radiation can explain the yield gap of single mid-season rice between Deyang and Luzhou without the confounding effects of paddy field soil fertility at the different latitudes and altitudes, and rice yield was more closely related to the maximum and minimum temperatures and the cumulative solar radiation before HD compared to the effects of these three parameters after HD.
The number of panicles m−2 and percentage of filled grains were higher in Deyang than in Luzhou during the field experiment, which resulted in higher grain yields in the Deyang location than in the Luzhou location. This is because the number of spikelets per panicle and grain weight in Deyang was slightly higher than or equal to the spikelet number and grain weight in Luzhou (Table 3). This finding is consistent with the results of previous studies [11,17,26]. These studies reported that irrigated rice produced more panicles m−2 in high-yielding locations, resulting in significantly higher rice yields compared to yields of irrigated rice grown in low- or medium-yielding locations. Tillering is an important agronomic trait in rice because it affects the number of panicles per unit of land area that ultimately determines grain yield. It is well known that climatic factors such as temperature and solar radiation have large effects on tillering in rice plants. Shading inhibits tillering and enhances tiller mortality [27,28]. During the tillering stage, high temperatures can promote tillering in rice [16]. In the present study, high maximum and minimum temperatures with more cumulative solar radiation before HD were mainly responsible for the differences in panicle numbers between the two locations (Table 4). High cumulative solar radiation before HD increases leaf photosynthesis and photochemical efficiency and, consequently, increases biomass accumulation and radiation use efficiency before HD. Furthermore, panicle number per unit of land area is positively correlated with the intensity of solar radiation [29]. High temperatures before HD enhance the growth of irrigated rice, leaf area expansion, and crop growth rate, thus increasing the number of tillers that results in more panicles m−2. The changes in panicle number between the Deyang location and the Luzhou location in the pot experiment showed a similar trend to that in the field experiment. Within the same location, the number of panicles per hill in soil from Deyang was slightly lower than in soil from Luzhou, suggesting that the effect of soil fertility on panicle number was relatively small, although soil fertility in Deyang was higher than in Luzhou. These findings illustrate the climatic mechanisms by which the number of panicles per m2 in Deyang was significantly increased over the number in Luzhou (Table 3 and Table 7). Our results suggest that high temperatures and more cumulative solar radiation before HD are the two key climatic factors that increase panicle number.
The percentage of filled grains was higher in Deyang than in Luzhou by 5.5–11.2% in the field experiment and by 4.4–10.7% in the pot experiment. It is probable that lower maximum and minimum temperatures with more accumulative solar radiation after HD in Deyang compared with Luzhou enhanced grain filling in the six rice cultivars (Table 4). On one hand, lower temperatures after HD could slow the rate of leaf senescence, prolong the growth duration, and reduce the respiration/photosynthesis ratio, resulting in a higher percentage of spikelet filling. The growth duration from HD to MA was 4–7 d longer in Deyang than in Luzhou. On the other hand, more cumulative solar radiation after HD enhanced leaf photosynthesis to produce more biomass for spikelet filling. Rice grown in Deyang had higher biomass accumulation after HD and more biomass remobilization than in Luzhou. Taken together, these findings indicate the climatic mechanisms by which rice yields and grain filling were significantly improved in the Deyang location compared to the Luzhou location (Table 3 and Table 7). Thus, higher maximum and minimum temperatures with more cumulative solar radiation before HD in Deyang compared to Luzhou contributed to significantly increased panicle numbers, whereas lower maximum and minimum temperatures with more cumulative solar radiation after HD in Deyang than in Luzhou contributed to significant increases in the percentage of filled grains.
Biomass production is the result of the accumulation and distribution of photosynthate in different organs of irrigated rice plants [30] and is significantly influenced by environmental conditions that included climatic factors and paddy field soil fertility [12,13,19,20]. Previous field studies have reported that the growth duration and biomass accumulation responses to climatic factors in irrigated rice varied with altitude [11,17,18]. In the present study, the Deyang location produced higher biomass at maturity than the Luzhou location in both field and pot experiments (Table 5 and 
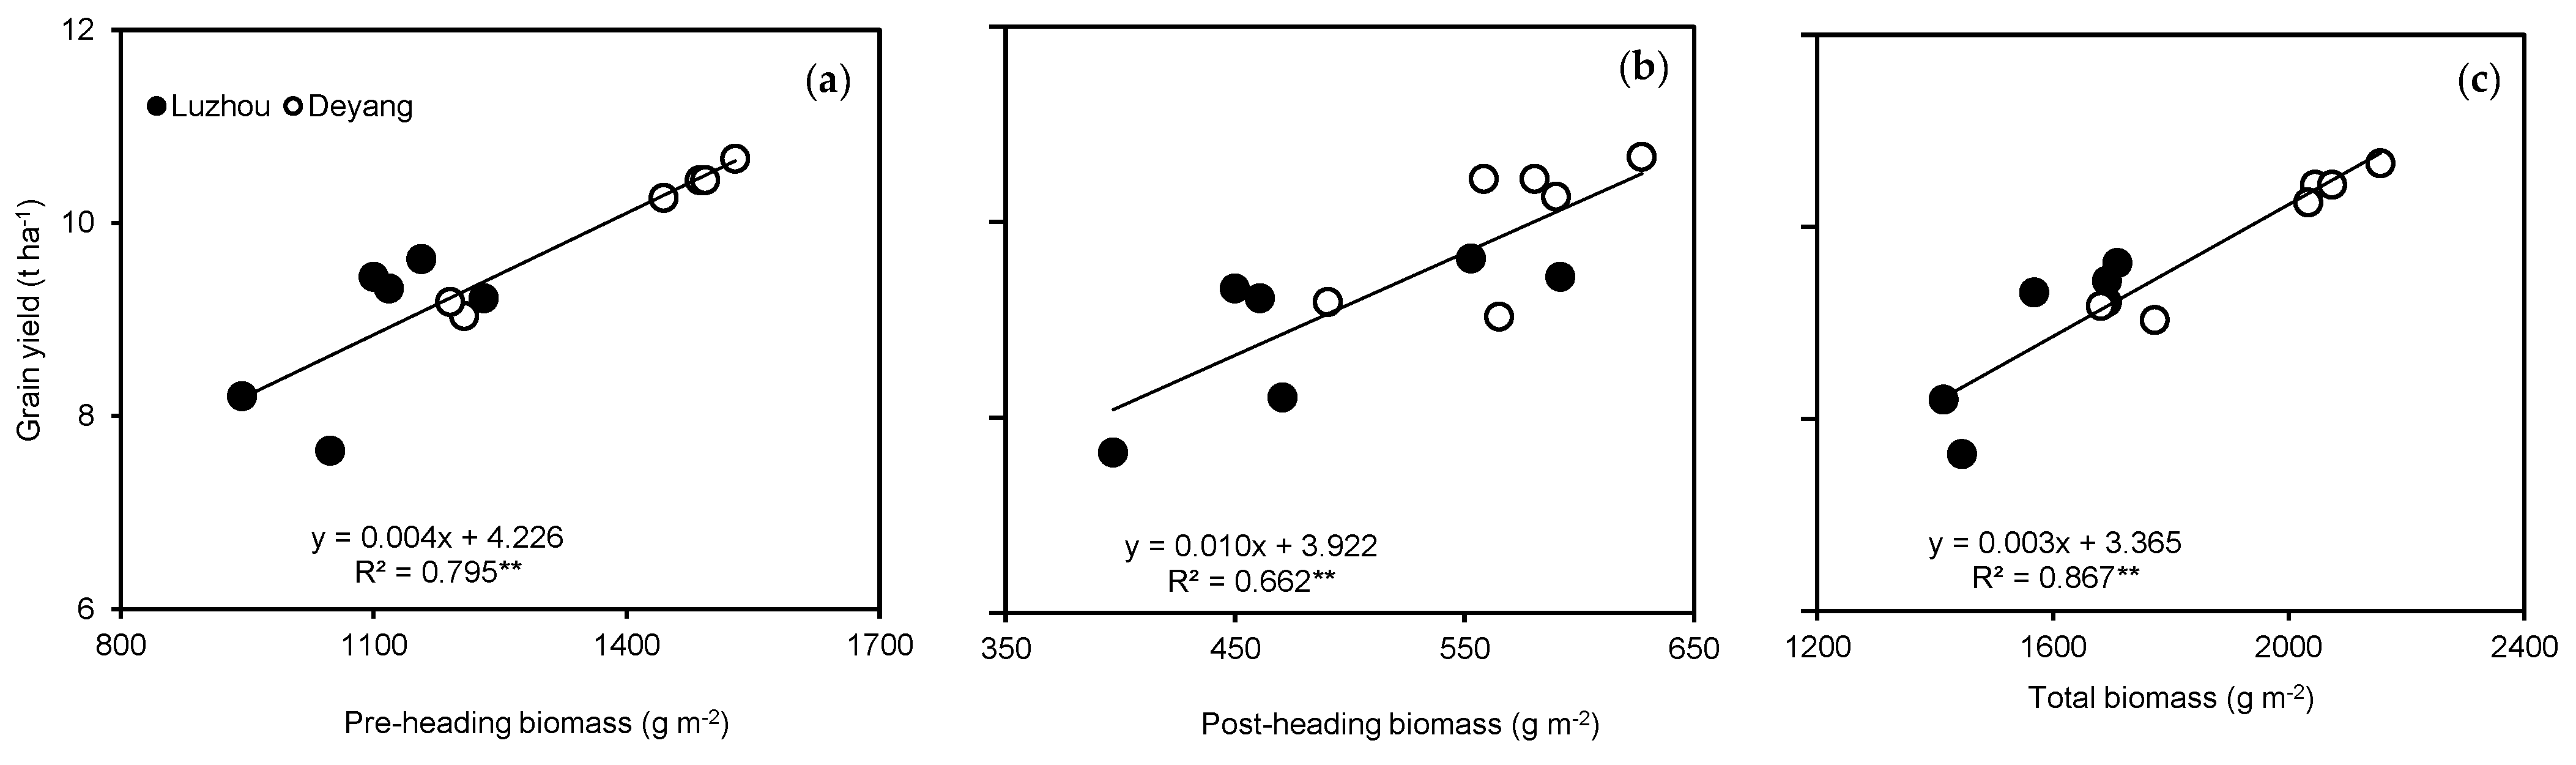
Table 8). Similarly, biomass production before and after HD was also higher in Deyang than in Luzhou in 2018 and 2019. Furthermore, rice yield showed a significant positive correlation with biomass before and after HD and total biomass, and rice yield was related more closely to before-HD biomass and total biomass production than to biomass production after HD (Figure 3a–c), suggesting that biomass production before HD is responsible for the yield differences between the two locations. This finding is consistent with the results of previous studies by Tao et al. [7] and Pan et al. [31], and a further improvement in rice grain yield in subtropical environments can be achieved by improving biomass production through promoting pre-heading crop growth rate (pre-CGR).
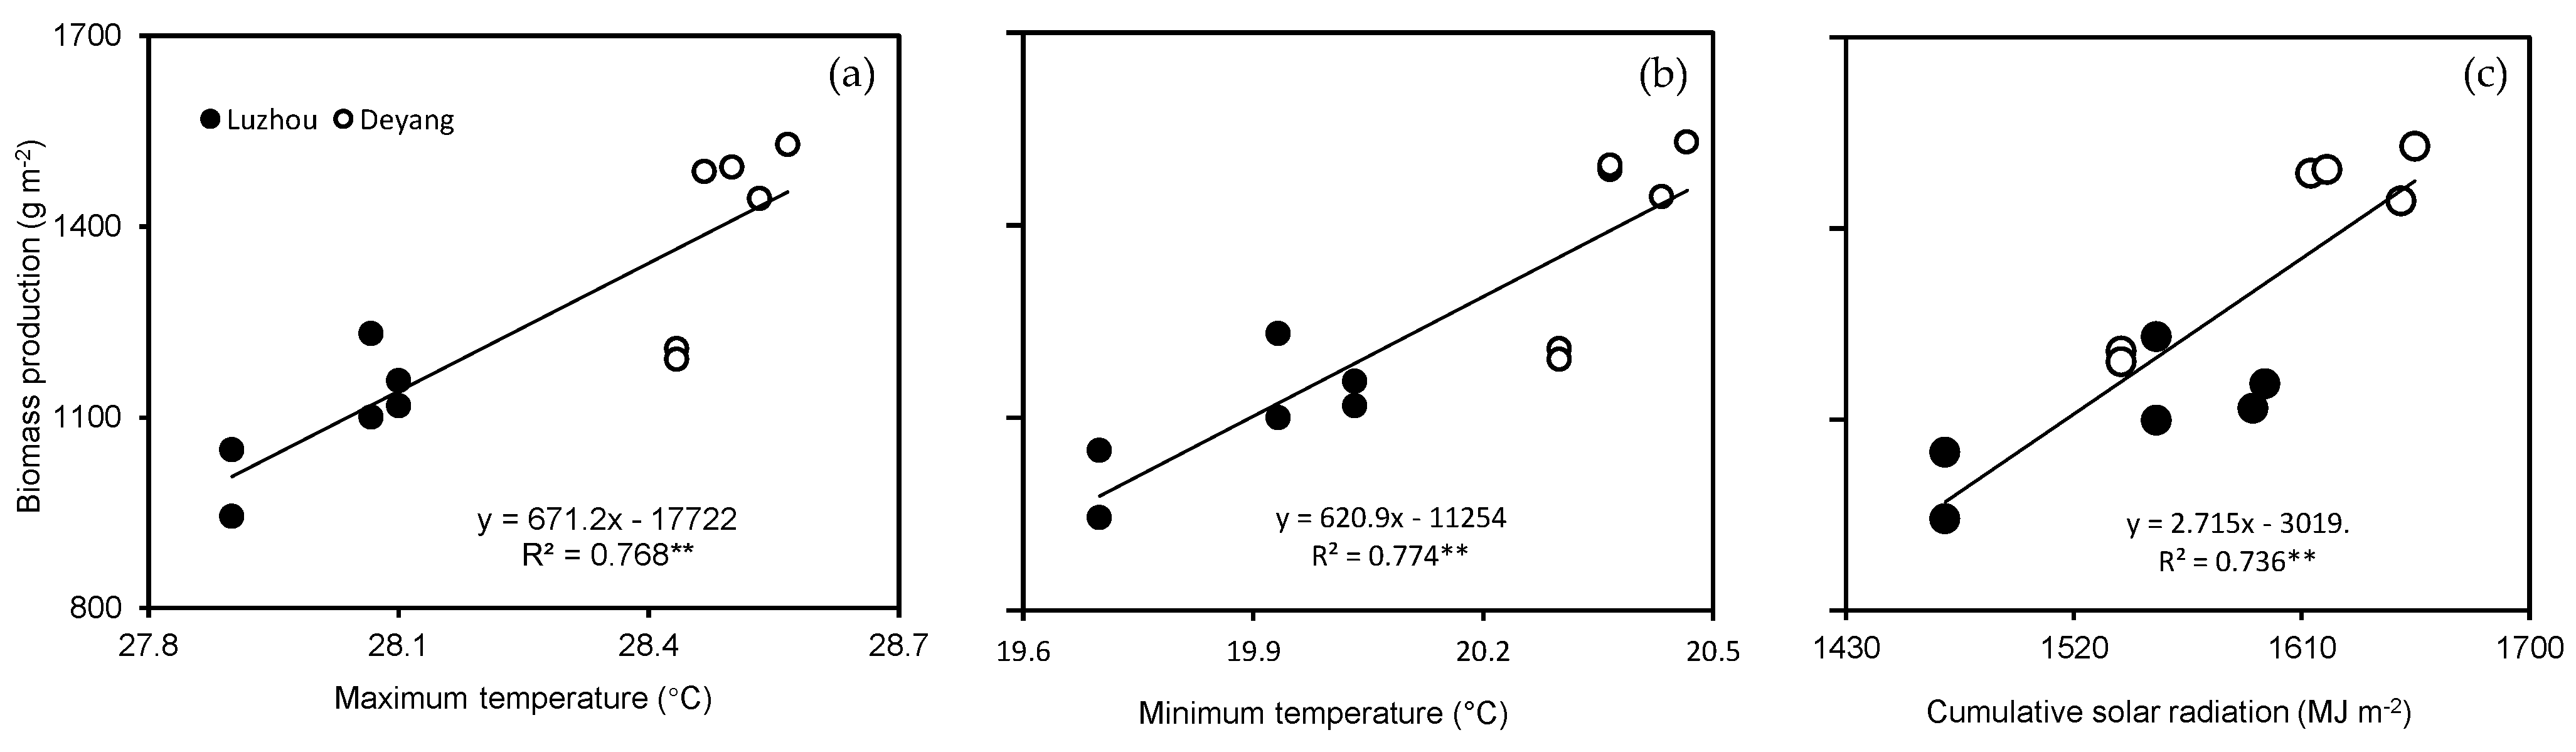
The favorable climatic factors that influenced biomass production in irrigated rice by varying the growth duration were responsible for higher biomass production in Deyang compared to Luzhou. The temperature and solar radiation requirements of the rice crop varied with the growth stages. Higher temperatures with more solar radiation before HD promoted leaf emergence and leaf area expansion, enhanced leaf photosynthesis and RUE, increased the crop growth rate, and produced more biomass. During the grain filling period, lower temperatures reduced the rate of leaf senescence, prolonged the grain filling period, and reduced the respiration/photosynthesis ratio, thus increasing the biomass for spikelet filling which contributed to a significant improvement in rice yield. Low solar radiation/shading during ripening reduced leaf photosynthesis, resulting in a reduction in biomass accumulation. In our study, the Deyang location experienced higher maximum and minimum temperatures before HD than the Luzhou location, whereas from HD to MA, the maximum and minimum temperatures were lower in Deyang than in Luzhou (Table 4). The Deyang location had more cumulative solar radiation before and after HD than the Luzhou location. Furthermore, the biomass production before HD was significantly positively correlated with the maximum and minimum temperatures (Figure 4a,b); however, the biomass production after HD was significantly negatively correlated with the mean maximum and minimum temperatures (Figure 4d,e). The before- and after-HD biomass accumulation were significantly positively correlated with cumulative solar radiation (Figure 4c,f). Additionally, at each location, there was no significant difference in biomass production at maturity for rice plants grown in soil from Deyang and soil from Luzhou (Table 8), suggesting that the large differences in biomass production for plants grown in soil from Deyang compared to the soil from Luzhou were mainly caused by the differences in climatic factors. Taken together, these results reveal that the variation in biomass production between Deyang and Luzhou was mainly influenced by temperatures and cumulative solar radiation, and that biomass production was more related to the maximum and minimum temperatures and cumulative solar radiation before HD rather than to the temperatures and solar radiation after HD.
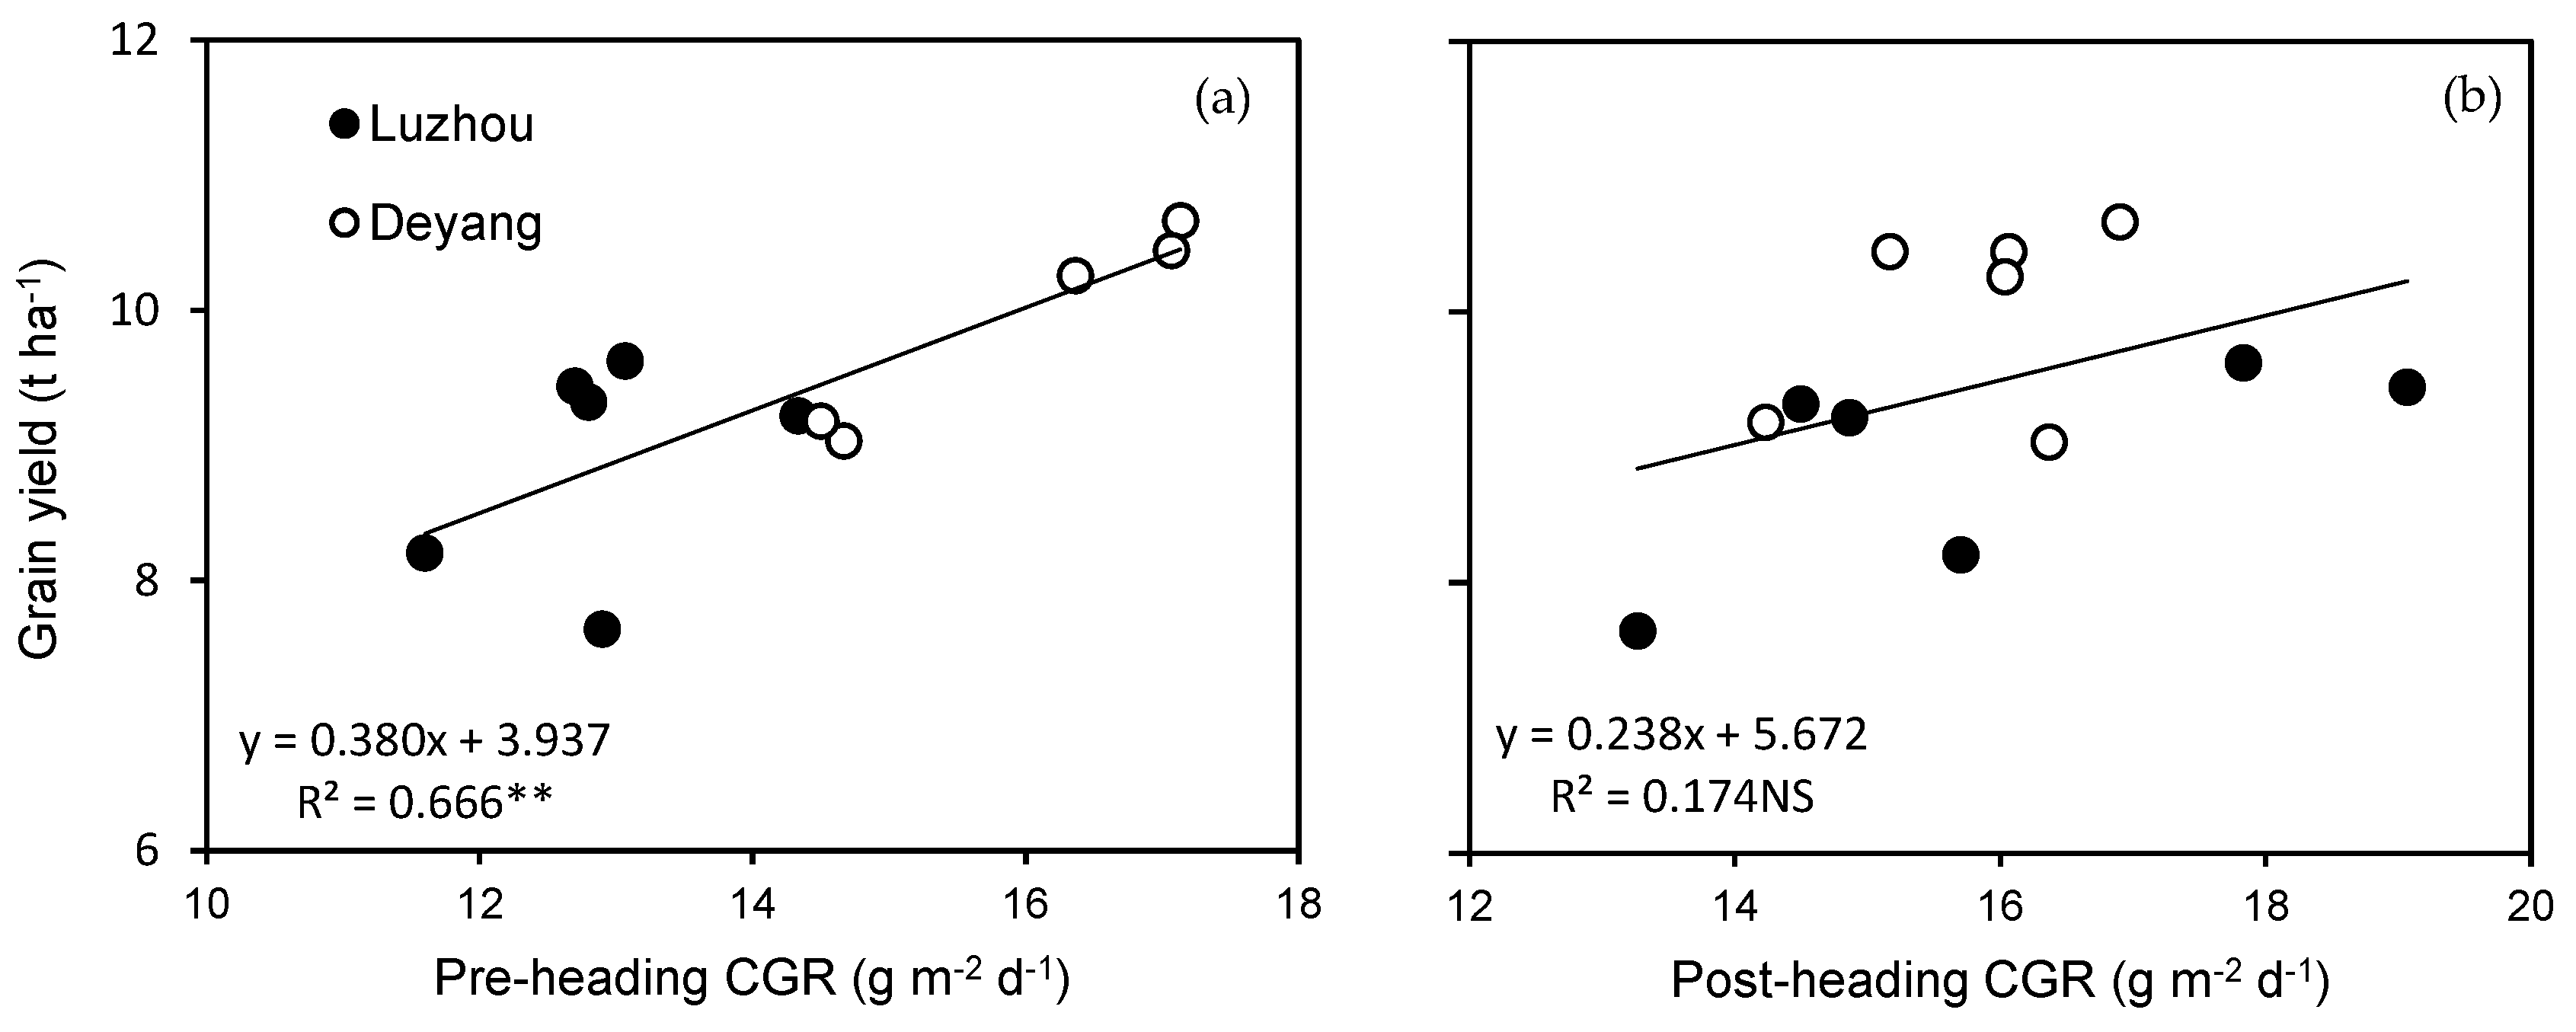
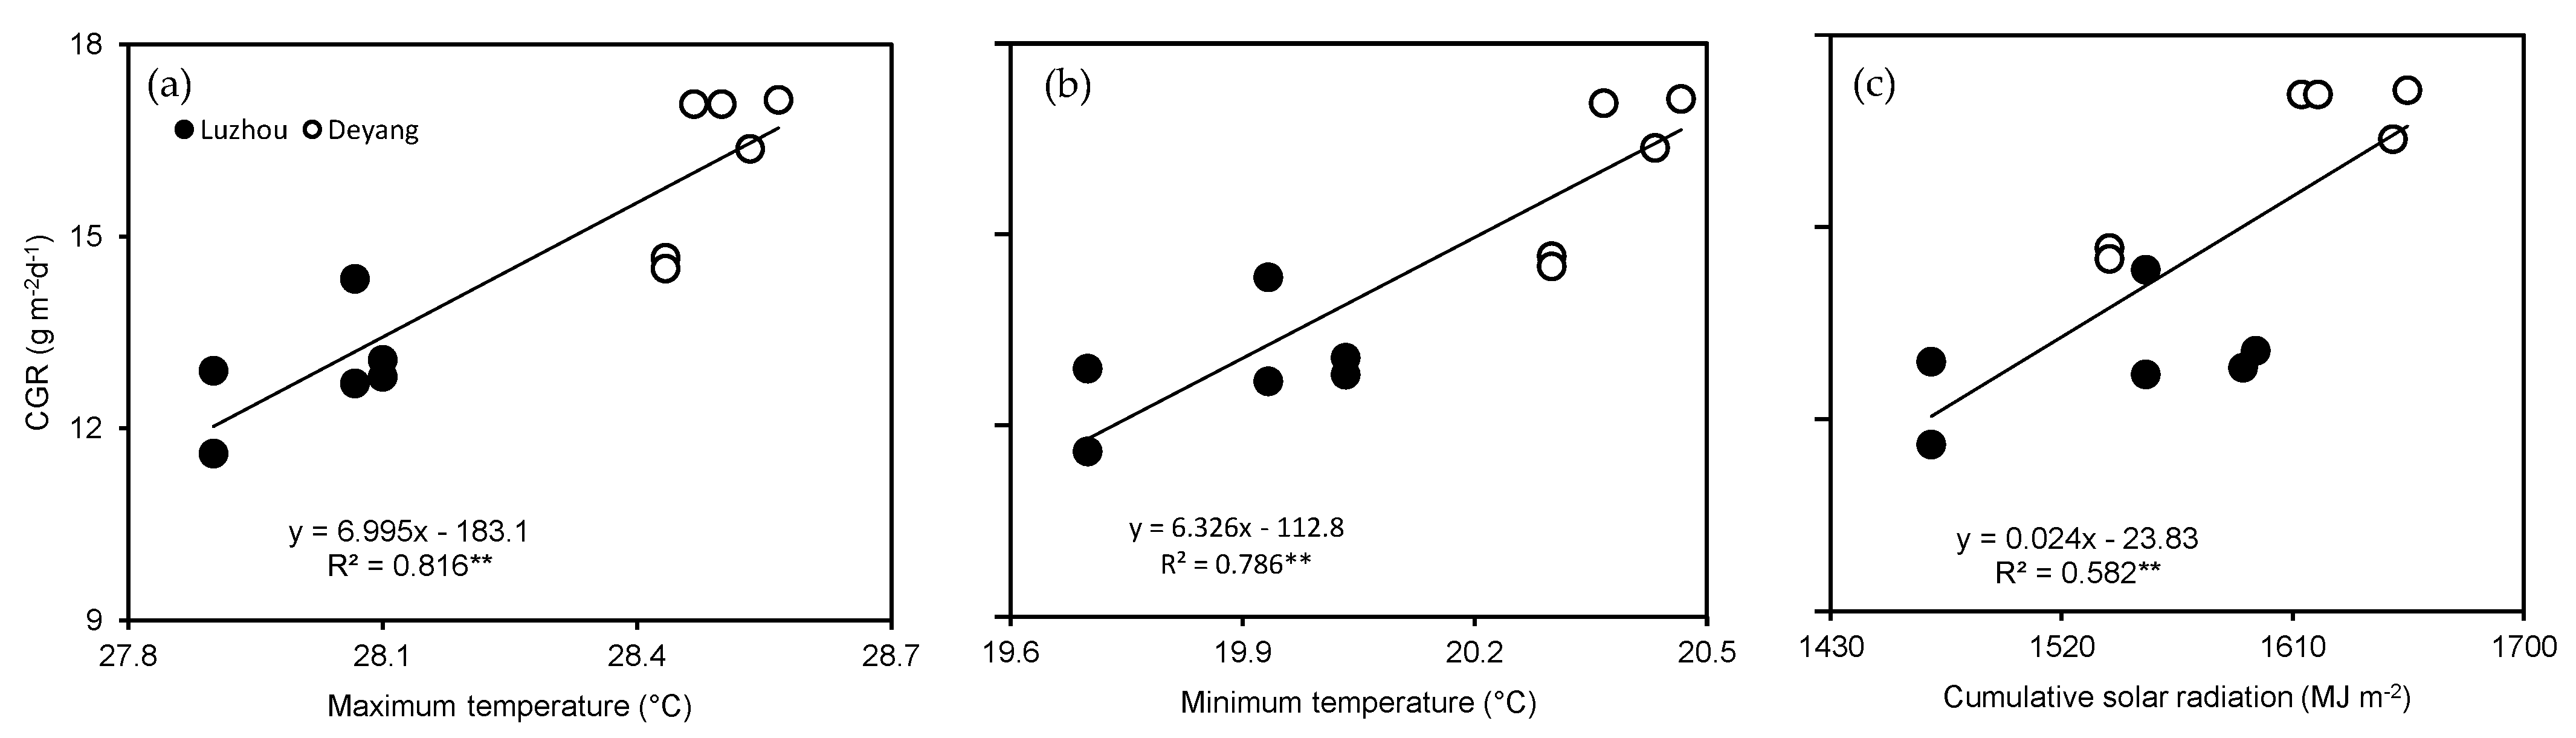
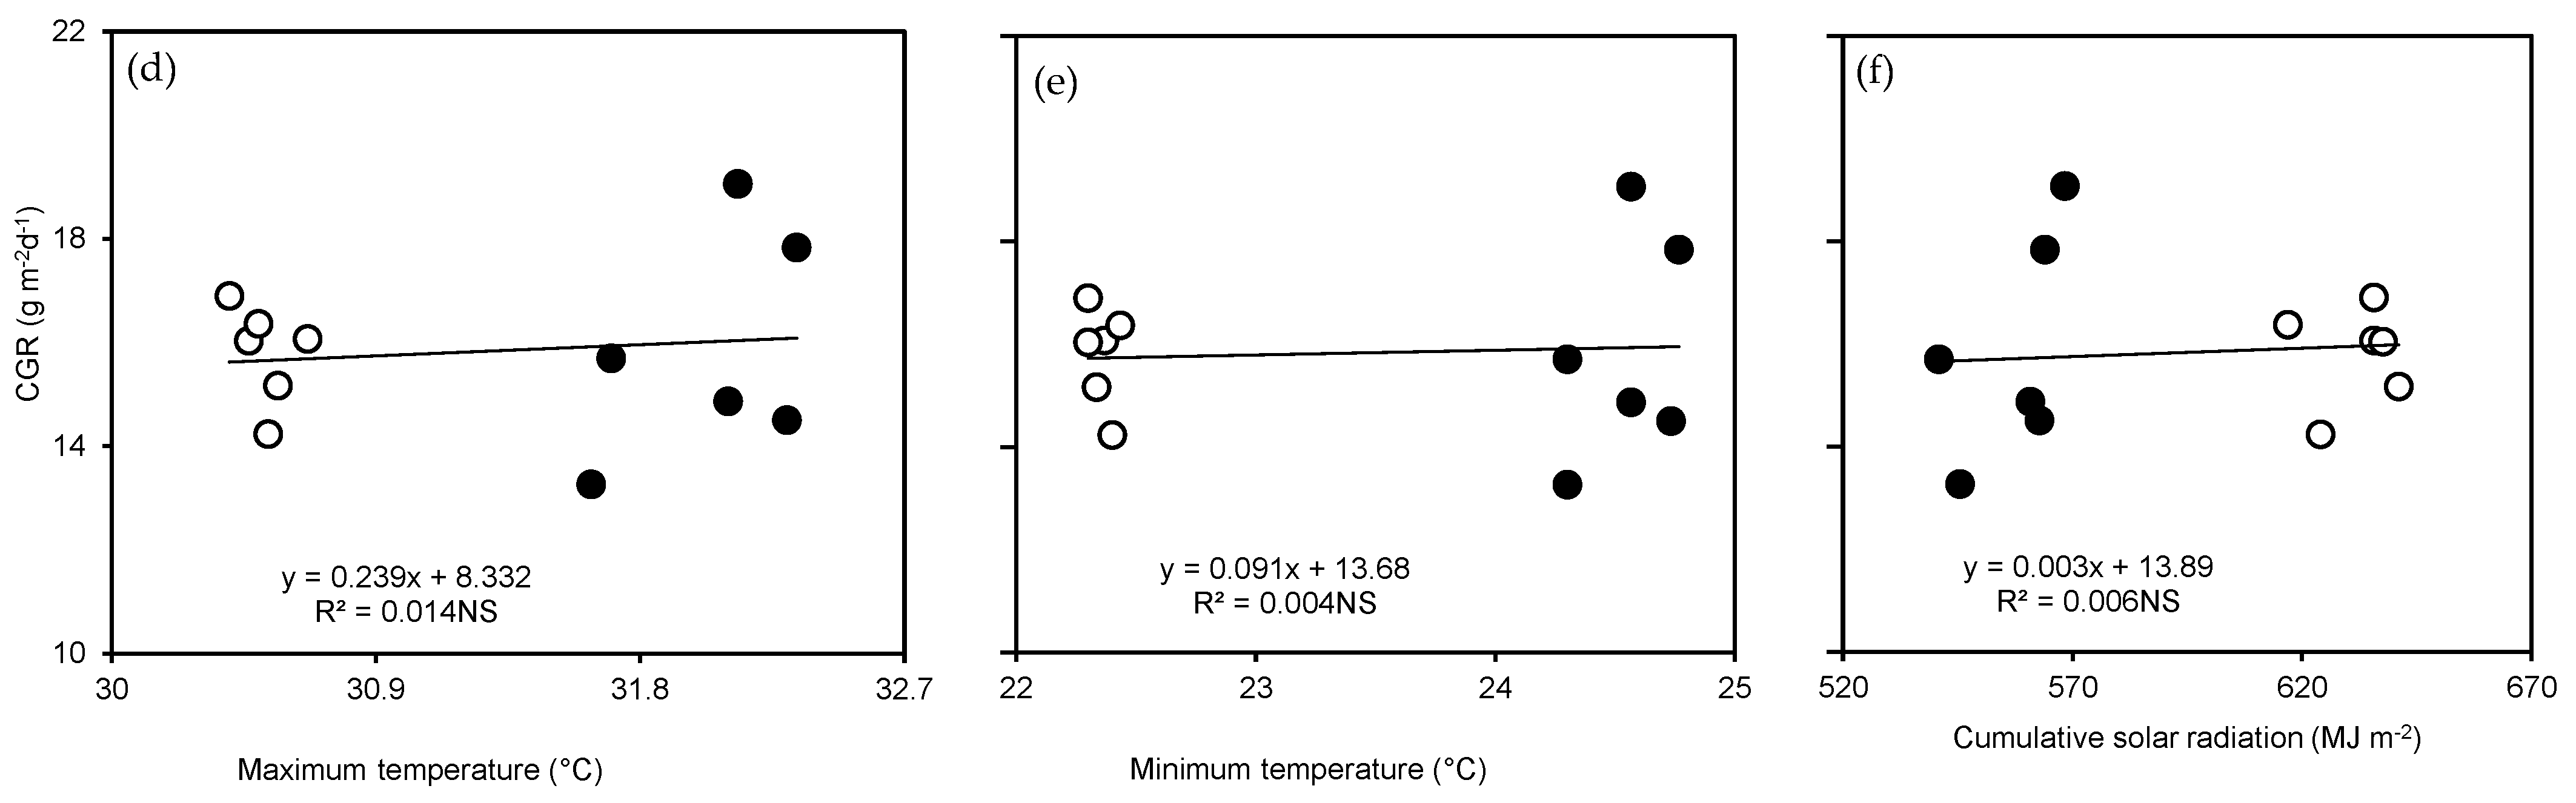
The higher biomass accumulation before HD in Deyang than in Luzhou was mainly due to the higher crop growth rate during the pre-heading stage (pre-CGR) in Deyang compared to Luzhou, because the difference in growth duration from TR to HD between the two locations was relatively small (Table 4). CGR is a function of gross canopy photosynthesis and crop respiration [32], both of which are affected by temperatures and solar radiation [33]. In our study, we found that the LAI at HD was much higher in Deyang than in Luzhou (Table 6), indicating that the canopy photosynthesis capacity was higher in the period before maturity in Deyang compared to Luzhou. Furthermore, rice yield was significantly positively correlated with pre-CGR, but was not correlated with post-CGR (Figure 5a,b). The higher pre-CGR in Deyang compared to Luzhou was associated with that location’s higher canopy photosynthesis, which was caused by the higher temperatures in Deyang. Moreover, the pre-CGR was significantly positively correlated with maximum and minimum temperatures and cumulative solar radiation from TR to HD (Figure 7a–c). The lower temperatures prolonged the grain filling period and reduced respiration loss. Although post-CGR was lower in Deyang than in Luzhou, the biomass accumulation after HD in Deyang was equal to or higher than in Luzhou. There was no significant relationship between post-CGR and the maximum and minimum temperatures during the grain filling period (Figure 7d,e). This finding indicated that large differences in rice yield are mainly caused by differences in pre-CGR.
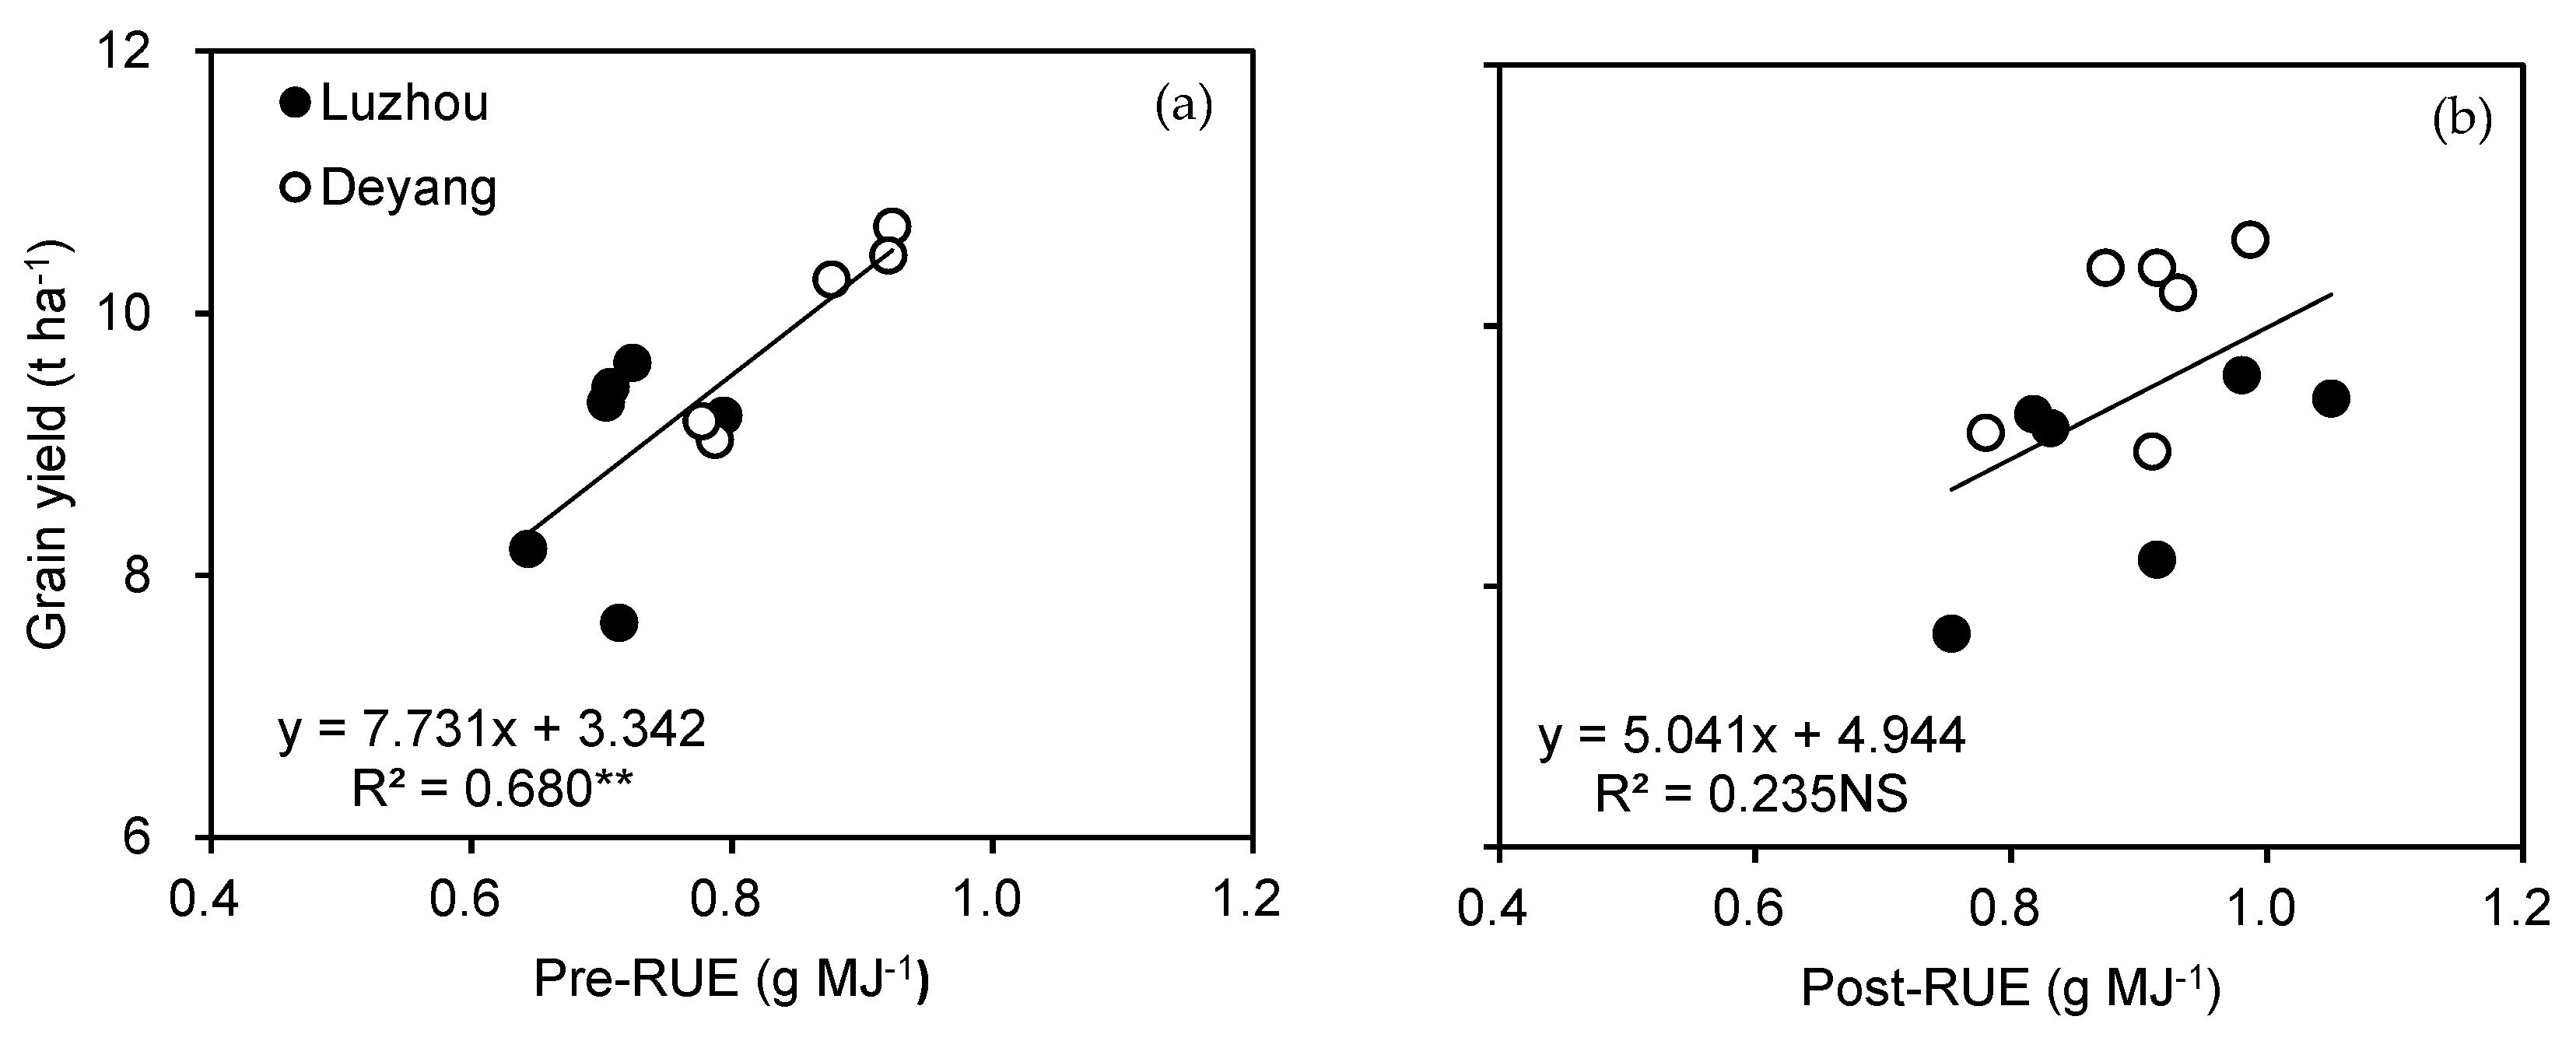
Biomass production is a function of cumulative solar radiation and RUE [34], and the RUE can be affected by the rice cultivar, crop management practices, and climatic conditions [35,36]. In our study, we clarified the effects of climatic factors on the differences in grain yield by using both field and pot experiments with the same rice cultivars and experimental scheme under different ecological conditions to exclude the effects of rice cultivars, crop management practices, soil fertility on yield, and apparent RUE. Our findings show that plants grown in Deyang had higher apparent radiation use efficiency at pre-heading (pre-RUE) than plants grown in Luzhou in the field, whereas the apparent radiation use efficiency during the post-heading phase (post-RUE) was lower in Deyang than in Luzhou, except in 2018. However, biomass accumulation before and after HD was higher in Deyang than in Luzhou, except for biomass accumulation after HD in 2020. The higher biomass accumulation at maturity in Deyang was mainly contributed by the higher biomass accumulation before HD that resulted from higher pre-RUE. The lower maximum and minimum temperatures during the grain filling period were partially responsible for the higher biomass accumulation after HD in Deyang since lower temperatures reduce crop respiration and prolong the growth duration. Furthermore, rice yield was significantly positively correlated with pre-RUE (Figure 6a), but not with the post-RUE (Figure 6b). Taken together, the differences in rice yields between the two locations were mainly associated with the difference in pre-RUE.
Grain yields were higher for hybrid rice than for inbred rice by 16.5% in the field experiment and by 6.6% in the pot experiment. The high grain yields of the hybrid rice cultivars were attributed to high panicle numbers, grain weight, and biomass production. The differences in biomass production between the hybrid and inbred rice cultivars were mostly due to variations in pre-CGR, post-CGR, pre-RUE, and post-RUE induced by varying the accumulative solar radiation. The significantly higher panicle number, grain weight, biomass, crop growth rate, and high radiation use efficiency in hybrid rice compared to inbred rice suggest that these traits are decisive factors in hybrid rice productivity.

5. Conclusions

Rice grain yields were higher in the Deyang location compared to the Luzhou location by 7.0–16.8% in the field experiment. The higher grain yield in Deyang was associated with a higher number of panicles per m2, percentage of filled grains, pre-heading and total biomass production, and harvest index. The differences in biomass production between Deyang and Luzhou were mostly due to variations in pre-heading CGR and pre-heading RUE induced by varying the maximum and minimum temperatures and accumulative solar radiation. In the pot experiment, rice yield was significantly affected by year, location, and cultivar, but not by soil fertility. Rice yield was higher in Deyang than in Luzhou regardless of whether the soil was collected from the Deyang location or the Luzhou location. In addition, although the soil fertility in Deyang was higher than in Luzhou, there were no significant differences in rice yield between the two soils within the same ecological conditions. Taken together, the maximum and minimum temperatures and the cumulative solar radiation can explain the differences in yield of high-yielding mid-season rice between the Deyang and Luzhou locations without the confounding effects of paddy field soil fertility. Furthermore, rice grain yield was more closely related to the maximum and minimum temperatures and the cumulative solar radiation before HD than to these parameters after HD. We concluded that lower yield in Luzhou was associated with lower pre-CGR and pre-RUE. Our study suggests that developing rice cultivars with high pre-CGR and pre-RUE through a breeding program may also be a feasible approach to achieve high yield in subtropical environments.

Author Contributions

P.J., X.Z. and F.X. designed the experiment; X.Z., M.L., X.G., Y.Z., J.L. (Juntao Luo)., L.C. and J.L. (Jie Liu). performed the experiment; P.J., L.Z. and H.X. analyzed the data; P.J. wrote the manuscript. All authors have read and agreed to the published version of the manuscript.

Funding

This research was funded by the National Natural Science Foundation of China (31971844), the earmarked fund for China Agriculture Research System (CARS–01–25), the Foundation of Youth Science Program of Sichuan Agricultural Sciences Academy (2019QNJJ-020), and the Ten Thousand Talents Program of Sichuan Province.

Data Availability Statement

Data available from the author.

Conflicts of Interest

The authors declare no conflict of interest.

References

  1. Sun, T.; Yang, X.; Tan, X.L.; Han, K.F.; Tang, S.; Tong, W.M.; Zhu, S.Y.; Hu, Z.P.; Wu, L.H. Comparison of agronomy performance between Japonica/Indica hybrid rice and Japonica cultivars of rice based on different nitrogen rates. Agronomy 2020, 10, 171. [Google Scholar] [CrossRef] [Green Version]
  2. Xu, M.G.; Li, D.C.; Li, J.M.; Qin, D.Z.; Hosen, Y.; Shen, H.P.; Cong, R.H.; He, X.H. Polyolefin-coated urea decreases ammonia volatilization in a double rice system of southern China. Agron. J. 2013, 105, 277–284. [Google Scholar] [CrossRef]
  3. Xiong, W.; Holman, I.; Conway, D.; Lin, E.; Li, Y. A crop model cross calibration for use in regional climate impacts studies. Ecol. Model. 2008, 213, 365–380. [Google Scholar] [CrossRef]
  4. Tu, D.B.; Jiang, Y.; Liu, M.; Zhang, L.J.; Cao, C.G.; Cai, M.; Ling, X.; Zhan, M.; Li, C.; Wang, J. Improvement and stabilization of rice production by delaying sowing date in irrigated rice system in central China. J. Sci. Food Agric. 2019, 100, 595–606. [Google Scholar] [CrossRef]
  5. Kumar, V.; Ladha, J.K. Direct seeding of rice: Recent developments and future research needs. Adv. Agron. 2011, 111, 297–413. [Google Scholar]
  6. Peng, S.B.; Khush, G.S.; Virk, P.; Tang, Q.Y.; Zou, Y.B. Progress in ideotype breeding to increase rice yield potential. Field Crops Res. 2008, 108, 32–38. [Google Scholar] [CrossRef]
  7. Tao, Z.; Zhang, R.C.; Chen, J.N.; Cao, F.B.; Liu, L.S.; Zhang, M.; Huang, M. Changes in grain yield and yield attributes due to cultivar development in indica inbred rice in China. Agronomy 2022, 12, 2541. [Google Scholar] [CrossRef]
  8. Yuan, L.P. Progress in breeding of super hybrid rice. J. Agric. 2018, 8, 80–82. [Google Scholar] [CrossRef]
  9. Zhu, D.F.; Yang, C.D.; Xiang, J.; Chen, H.Z.; Zhang, Y.P.; Chen, Y.P.; Wang, Y.J.; Wang, Y.L.; Zhang, Y.K. Analysis of yield potential of rice varieties for 15.0 ton per hectare. China Rice 2020, 26, 7–9. [Google Scholar]
  10. Zhan, C.S.; Zhang, X.F.; Zhou, C.N. High yield cultivation techniques for Yongyou12 as single cropping late rice with yield of 15 t ha-1. China Rice 2020, 3, 64–65. [Google Scholar]
  11. Jiang, P.; Xie, X.B.; Huang, M.; Zhou, X.F.; Zhang, R.C.; Chen, J.N.; Wu, D.D.; Xia, B.; Xiong, H.; Xu, F.X.; et al. Potential yield increase of hybrid rice at five locations in southern China. Rice 2016, 9, 11. [Google Scholar] [CrossRef] [Green Version]
  12. Zou, Y.B.; Xia, B.; Jiang, P.; Xie, X.B.; Huang, M. Discussion on the theory and methods for determining the target yield in rice production. Sci. Agric. Sin. 2015, 48, 4021–4032. [Google Scholar]
  13. Wang, D.P.; Laza, M.R.C.; Cassman, K.G.; Huang, J.L.; Peng, S.B.; Ling, X.; Centeno, G.S.; Cui, K.H.; Wang, F.; Li, Y. Temperature explains the yield difference of double-season rice between tropical and subtropical environments. Field Crops Res. 2016, 198, 303–311. [Google Scholar] [CrossRef] [Green Version]
  14. Hou, W.F.; Khan, M.R.; Zhang, J.L.; Lu, J.W.; Ren, T.; Con, R.H.; Li, X.K. Nitrogen rate and plant density interaction enhances radiation interception, yield and nitrogen use efficiency of mechanically transplanted rice. Agric. Ecosyst. Environ. 2019, 269, 183–192. [Google Scholar] [CrossRef]
  15. Ding, Y.M.; Wang, W.G.; Zhuang, Q.L.; Luo, Y.F. Adaptation of paddy rice in China to climate change: The effects of shifting sowing date on yield and irrigation water requirement. Agric. Water Manag. 2020, 228, 105890. [Google Scholar] [CrossRef]
  16. Yoshida, S. Fundamentals of Rice Crop Science; International Rice Research Institute: Manila, Philippines, 1981; pp. 64–90. [Google Scholar]
  17. Ying, J.F.; Peng, S.B.; He, Q.R.; Yang, H.; Yang, C.D.; Visperas, R.M.; Cassman, K.G. Comparison of high-yielding rice in tropical and subtropical environments I. Determinants of grain and dry matter yields. Field Crops Res. 1998, 57, 71–84. [Google Scholar] [CrossRef]
  18. Katsura, K.; Maeda, S.; Lubis, I.; Horie, T.; Cao, W.X.; Shiraiwa, T. The high yield of irrigated rice in Yunnan, China ‘Across-location analysis’. Field Crops Res. 2008, 107, 1–11. [Google Scholar] [CrossRef]
  19. Zhong, X.Y.; Li, Q.P.; Yang, F.; Chen, D.; He, L.H.; Yang, Z.P.; Wu, Z.Y.; Lu, H.; Li, Z.Z.; Zeng, Y.L.; et al. Higher solar radiation and lower temperature enhance biomass production and grain yield of rice under high-altitude condition. Arch. Agron. Soil Sci. 2021, 68, 1664–1680. [Google Scholar] [CrossRef]
  20. Li, G.H.; Xue, L.H.; Gu, W.; Yang, C.D.; Wang, S.H.; Ling, Q.H.; Qin, X.; Ding, Y.F. Comparison of yield components and plant type characteristics of high-yield rice between Taoyuan, a special ‘eco-site’ and Nanjing, China. Field Crops Res. 2009, 112, 214–221. [Google Scholar] [CrossRef]
  21. Huang, M.; Jiang, P.; Shan, S.L.; Gao, W.; Ma, G.H.; Zou, Y.B.; Uphoff, N.; Yuan, L.P. Higher yields of hybrid rice do not depend on nitrogen fertilization under moderate to high soil fertility conditions. Rice 2017, 10, 43. [Google Scholar] [CrossRef] [Green Version]
  22. Jiang, P.; Xie, X.B.; Huang, M.; Zhou, X.F.; Zhang, R.C.; Chen, J.N.; Wu, D.D.; Xia, B.; Xiong, H.; Xu, F.X.; et al. Characterizing N uptake and use efficiency in rice as influenced by environments. Plant Prod. Sci. 2016, 19, 96–104. [Google Scholar] [CrossRef] [Green Version]
  23. Chen, J.N.; Zhang, R.C.; Cao, F.B.; Yin, X.H.; Zou, Y.B.; Huang, M.; Abou-Elwafa, S.F. Evaluation of late-season short- and long-duration rice cultivars for potential yield under mechanical transplanting conditions. Agronomy 2020, 10, 1307. [Google Scholar] [CrossRef]
  24. Peng, S.B.; Huang, J.L.; Sheehy, J.E.; Laza, R.C.; Visperas, R.M.; Zhong, X.H.; Centeno, G.S.; Khush, G.S.; Cassman, K.G. Rice yields decline with higher night temperature from global warming. Proc. Natl. Acad. Sci. USA 2004, 101, 9971–9975. [Google Scholar] [CrossRef] [PubMed] [Green Version]
  25. Horie, T.; Ohnishi, M.; Angus, J.F.; Lewin, L.G.; Tsukaguchi, T.; Matano, T. Physiological characteristics of high-yielding rice inferred from cross-location experiments. Field Crops Res. 1997, 52, 55–67. [Google Scholar] [CrossRef]
  26. Zhong, X.L.; Zhao, B.B.; Huang, M.Y.; Huassain, H.A.; Hussain, S.; Cai, L.J.; Yun, H.; He, G.H.; Zhang, C.W. Comparison of growth and yield characteristics of mid-season hybrid rice under different yield level. Agronomy 2020, 10, 1876. [Google Scholar] [CrossRef]
  27. Yamamoto, Y.; Kurokawa, H.; Nitta, Y.; Yoshida, T. Varietal differences of tillering response to shading and nitrogen levels in rice plant: Comparison between high tillering semi dwarf indica and low tillering japonica. Jpn. J. Crop Sci. 1995, 64, 227–234. [Google Scholar] [CrossRef] [Green Version]
  28. Caton, B.P.; Forin, T.C.; Hill, J.E. Mechanisms of competition for light between rice (Oryza sativa) and redstem (Ammannia spp.). Weed Sci. 1997, 45, 269–275. [Google Scholar] [CrossRef]
  29. Suzuki, M.; Nakamur, K. Effect of climatic factors on rice yield and yield components in the warmer regions of Japan. Jpn. J. Crop Sci. 1978, 47, 529–535. [Google Scholar] [CrossRef] [Green Version]
  30. Qiao, J.; Yang, L.Z.; Yan, T.M.; Xue, F.; Zhao, D. Rice dry matter and nitrogen accumulation, soil mineral N around root and N leaching, with increasing application rates of fertilizer. Eur. J. Agron. 2013, 49, 93–103. [Google Scholar] [CrossRef]
  31. Pan, Y.H.; Gao, S.; Xie, K.J.; Lu, Z.F.; Meng, X.S.; Wang, S.Y.; Lu, J.W.; Guo, S.W. Higher radiation use efficiency produces greater biomass before heading and grain yield in super hybrid rice. Agronomy 2020, 10, 209. [Google Scholar] [CrossRef] [Green Version]
  32. Evans, L.T. Crop Evolution, Adaptation and Yield; Cambridge Univ. Press: Cambridge, UK, 1993; p. 500. [Google Scholar]
  33. Akita, S. Respiration: Variation and potential for manipulation. In International Crop Science I; Buxton, D.R., Shibles, R., Forsberg, R.A., Blad, B.L., Asay, K.H., Paulsen, G.M., Wilson, R.F., Eds.; Crop Science Society of America: Madison, WI, USA, 1993; pp. 799–805. [Google Scholar]
  34. Monteith, J.L. Climate and the efficiency of crop production in Britain. Philos. Trans. R. Soc. Lond. B Sci. 1977, 281, 277–294. [Google Scholar]
  35. Katsura, K.; Maeda, S.; Horie, T.; Shiraiwa, T. Analysis of yield attributes and crop physiological traits of Liangyoupeijiu: A hybrid rice recently bred in China. Field Crops Res. 2007, 103, 170–177. [Google Scholar] [CrossRef]
  36. Zhu, X.; Long, S.P.; Ort, D.R. What is the maximum efficiency with which photosynthesis can convert solar energy into biomass? Curr. Opin. Biotech. 2008, 19, 153–159. [Google Scholar] [CrossRef] [PubMed]
Figure 1. The two field experimental sites located in Deyang and Luzhou, Sichuan Province, China.
Agronomy 13 00820 g001
Figure 2. The relationships between grain yield and maximum temperature (a), minimum temperature (c), and cumulative solar radiation (e) from transplanting to heading, and maximum temperature (b), minimum temperature (d), and cumulative solar radiation (f) from heading to maturity of six rice cultivars at two locations from 2018 to 2020. Data are averaged across the three years of the field experiment. ‘*’ and ‘**’ denote significant relationships at the 0.05 and 0.01 probability levels, respectively.
Agronomy 13 00820 g002
Figure 3. Relationships between grain yield and pre-heading biomass (a), post-heading biomass (b), and total biomass (c) in six rice cultivars grown at two locations from 2018 to 2020. Data are averaged across three years. ‘**’ denotes a significant relationship at the 0.01 probability level.
Agronomy 13 00820 g003
Figure 4. Relationships between biomass production and maximum temperature (a), minimum temperature (b), and solar radiation (c) during the pre-heading periods and between biomass production and maximum temperature (d), minimum temperature (e), and solar radiation (f) during the post-heading periods for six rice cultivars over three years. ‘* ‘and ‘**’ denote significant relationships at the 0.05 and 0.01 probability levels, respectively.
Agronomy 13 00820 g004aAgronomy 13 00820 g004b
Figure 5. Relationships between grain yield and crop growth rate (CGR, g m−2 d−1) during the pre- and post-heading periods for six rice cultivars grown in two locations from 2018 to 2020. Data are averaged across three years. (a,b) represent the crop growth rate (CGR, g m−2 d−1) during the pre- and post-heading periods of six rice cultivars, respectively. ‘**’ denotes a significant relationship at the 0.01 probability level. NS denotes a non-significant relationship at the 0.05 probability level.
Agronomy 13 00820 g005
Figure 6. Relationships between grain yield and apparent radiation use efficiency (RUE) during the pre- and post-heading periods of six rice cultivars grown in two locations from 2018 to 2020. Data are averaged across three years. (a,b) represent the apparent radiation use efficiency during the pre- and post-heading periods of the six rice cultivars, respectively. ‘**’ denotes a significant relationship at the 0.01 probability level. ‘NS’ denotes a non-significant relationship at the 0.05 probability level.
Agronomy 13 00820 g006
Figure 7. Relationships between crop growth rate (CGR, g m−2 d−1) and maximum temperature (a), minimum temperature (b), and solar radiation (c) during the pre-heading periods and between crop growth rate (CGR, g m−2 d−1) and maximum temperature (d), minimum temperature (e), and solar radiation (f) during the post-heading periods for the six rice cultivars over three years. ‘**’ denotes a significant relationship at the 0.01 probability level. ‘NS’ denotes a non-significant relationship at the 0.05 probability level.
Agronomy 13 00820 g007aAgronomy 13 00820 g007b
Table 1. Soil properties of the experimental fields.
Soil ParameterDeyangLuzhou
pH7.15.5
Organic matter (g kg−1)42.840.4
Total N (g kg−1)2.31.6
Total P (g kg−1)1.30.8
Total K (g kg-1)17.0 15.6
Available N (mg kg−1)132.0 112.0
Available P (mg kg−1)15.0 100.0
Available K (mg kg−1)135.0 129.1
Table 2. Growth duration of six rice cultivars grown in Deyang and Luzhou, Sichuan Province, China, from 2018 to 2020.
YearCultivarDeyangLuzhou
TR-HD (d)HD-MA (d)TR-MA (d)TR-HD (d)HD-MA (d)TR-MA (d)
2018Deyou472787361238431115
Luyou72789351248731118
Nei6you10387351228431115
Nei6you10788351238631117
Jinnongsimiao81331148130111
Huanghuazhan81331148130111
Mean86351218431115
2019Deyou472787371248731118
Luyou72792361289131122
Nei6you10387361238731118
Nei6you10791361279131122
Jinnongsimiao85351208230112
Huanghuazhan85351208230112
Mean88 36 124 8731118
2020Deyou472787381258731117
Luyou72787401278831118
Nei6you10387381258731117
Nei6you10787401278831118
Jinnongsimiao81361178730110
Huanghuazhan81361178730110
Mean85381238531115
Note: TR-HD—period from transplanting to heading; HD-MA—period from heading to maturity; TR-MA—period from transplanting to maturity.
Table 3. Grain yield and yield components of six rice cultivars grown under two different ecological conditions in a field experiment from 2018 to 2020.
YearLocationCultivarPanicles m−2Spikelet per PanicleGrain Filling (%)Thousand Grain Weight (g)Grain Yield (t ha−1)
2018LuzhouDeyou4727218.1 ab148.1 d88.9 ab29.5 a8.36 b
Luyou727204.0 bc203.4 b86.4 b26.0 b9.45 a
Nei6you103250.0 a134.0 d91.9 a29.9 a8.97 ab
Nei6you107201.5 bc149.2 d88.0 b29.2 a8.94 ab
Jinnongsimiao178.6 c254.2 a82.6 c20.0 d7.21 c
Huanghuazhan213.0 bc183.8 c86.7 b22.5 c7.71 c
Mean210.9 178.8 87.4 26.2 8.44
DeyangDeyou4727246.2 b160.3 c93.3 a29.8 a10.30 a
Luyou727277.8 a175.8 bc88.5 b26.2 b10.34 a
Nei6you103282.8 a140.0 d92.9 a29.6 a10.15 a
Nei6you107241.2 b160.8 c94.2 a29.4 a10.11 a
Jinnongsimiao202.0 c264.7 a91.0 ab19.8 d9.02 b
Huanghuazhan267.7 ab190.3 b93.0 a21.4 c9.25 b
Mean252.9 182.0 92.2 26.1 9.86
2019LuzhouDeyou4727251.2 ab139.5 de85.5 b31.1 a10.02 a
Luyou727242.3 ab186.2 b79.7 c24.2 d9.97 a
Nei6you103264.0 a130.4 e91.1 a29.5 b10.18 a
Nei6you107234.7 bc157.7 cd84.9 b28.0 c9.97 a
Jinnongsimiao205.4 c230.3 a84.7 b20.3 f8.05 c
Huanghuazhan260.2 ab166.2 bc90.7 a21.7 e8.96 b
Mean243.0 168.4 86.1 25.8 9.53
DeyangDeyou4727247.4 cd179.6 bc89.0 c28.2 b10.97 a
Luyou727269.1 bc190.3 b90.7 b24.8 c11.42 a
Nei6you103293.3 ab146.9 d91.5 ab28.7 a11.22 a
Nei6you107255.1 c171.4 c90.9 ab28.1 b11.00 a
Jinnongsimiao220.7 d247.6 a92.0 a19.8 e9.98 b
Huanghuazhan301.0 a178.9 bc91.3 ab21.1 d10.08 b
Mean264.4 185.8 90.9 25.1 10.78
2020LuzhouDeyou4727212.6 b155.1 c83.6 bcd29.7 a9.27 a
Luyou727235.7 a171.9 b81.2 d26.0 b9.45 a
Nei6you103232.5 a133.4 d85.7 b29.5 a9.17 a
Nei6you107229.4 ab139.4 d82.1 cd28.8 a9.05 a
Jinnongsimiao182.0 c213.1 a85.5 bc19.7 d7.66 b
Huanghuazhan226.2 ab168.8 b89.3 a21.5 c7.94 b
Mean219.7163.684.625.98.76
DeyangDeyou4727248.3 c151.0 bc94.4 ab31.0 a10.06 a
Luyou727300.9 a164.4 b92.6 b26.3 c10.23 a
Nei6you103282.0 b135.5 d94.6 ab30.1 b9.96 a
Nei6you107287.2 ab136.7 cd92.3 b29.7 b9.66 a
Jinnongsimiao227.3 d193.4 a95.0 ab19.8 d8.10 b
Huanghuazhan274.6 b159.7 b95.9 a20.5 d8.21 b
Mean270.1 156.8 94.1 26.2 9.37
Variance of analysis
Year (Y)**********
Location (L)*****ns**
Cultivar (C)**********
Y × L**********
Y × C********ns
L × C********ns
Y × L × Cnsns****ns
Within the column for each location, the means of cultivars followed by the same letters are not significantly different according to LSD at p = 0.05. ‘*’ and ‘**’ denote significant differences at the 0.05 and 0.01 probability levels, respectively, as determined using ANOVA. ‘ns’ denotes non-significance based on ANOVA.
Table 4. Climatic conditions during the growing season of six rice cultivars grown in Deyang and Luzhou, Sichuan Province, China, from 2018 to 2020.
YearLocationCultivarMaximum Temperature (°C)Minimum Temperature (°C)Cumulative Solar Radiation (MJ m−2)
TR-HDHD-MATR-HDHD-MATR-HDHD-MA
2018LuzhouDeyou472728.634.120.225.51544.9601.6
Luyou72728.634.420.325.61590.0612.7
Nei6you10328.634.120.225.51544.9601.6
Nei6you10728.634.320.325.51575.6609.1
Jinnongsimiao28.434.120.025.71488.3579.3
Huanghuazhan28.434.120.025.71488.3579.3
Mean28.534.220.225.61538.6597.3
DeyangDeyou472728.331.920.523.21569.4644.3
Luyou72728.432.120.623.21602.8644.9
Nei6you10328.432.020.523.21588.9642.0
Nei6you10728.432.120.623.21602.8644.9
Jinnongsimiao28.131.620.423.11476.4614.2
Huanghuazhan28.131.720.423.11476.4635.4
Mean28.331.920.523.21552.8637.6
2019LuzhouDeyou472727.231.219.723.91505.6554.8
Luyou72727.331.319.824.21574.7549.3
Nei6you10327.231.319.723.91505.6577.4
Nei6you10727.331.319.824.21574.7549.3
Jinnongsimiao27.130.219.523.21414.6549.4
Huanghuazhan27.130.419.523.21414.6535.4
Mean27.230.919.723.81498.3552.6
DeyangDeyou472727.730.219.922.11588.6642.7
Luyou72727.929.720.122.01678.9600.5
Nei6you10327.730.419.922.21588.6628.8
Nei6you10727.829.920.022.01662.3606.3
Jinnongsimiao27.730.919.922.41555.5631.7
Huanghuazhan27.730.919.922.41555.5631.7
Mean27.730.320.022.21604.9623.6
2020LuzhouDeyou472728.431.019.924.31607.8526.2
Luyou72728.431.320.024.51622.3530.1
Nei6you10328.431.019.924.31607.8526.2
Nei6you10728.431.320.024.51622.3530.1
Jinnongsimiao28.230.619.624.01504.7508.0
Huanghuazhan28.230.619.624.01504.7508.0
Mean28.330.919.824.31578.2521.5
DeyangDeyou472729.429.620.721.71682.8636.1
Luyou72729.429.420.721.71682.8661.6
Nei6you10329.429.620.721.71682.8636.1
Nei6you10729.429.420.721.71682.8661.6
Jinnongsimiao29.529.020.621.81584.5605.0
Huanghuazhan29.529.020.621.71584.5605.0
Mean29.429.320.721.71650.0634.2
Note: TR-HD—period from transplanting to heading; HD-MA—period from heading to maturity; TR-MA—period from transplanting to maturity.
Table 5. Biomass production, biomass remobilization, and harvest index of six rice cultivars grown under two different ecological conditions in a field experiment from 2018 to 2020.
YearLocationCultivarBiomass Production (g m−2)Biomass Remobilization
(g m−2)
Harvest Index (%)
TR-HDHD-MATotal
2018LuzhouDeyou47271283.7 a369.6 ab1653.2 a473.2 ab51.0 b
Luyou7271161.9 a589.2 a1751.1 a342.6 b53.3 b
Nei6you1031296.7 a396.6 ab1693.3 a517.9 ab54.0 ab
Nei6you1071233.1 a226.7 bc1459.8 b545.0 ab52.9 b
Jinnongsimiao1233.5 a104.1 c1337.7 c656.1 a56.8 a
Huanghuazhan1113.9 a290.8 bc1404.7 bc459.9 ab53.5 ab
Mean1220.5 329.5 1550.0 499.1 53.6
DeyangDeyou47271304.4 c647.6 a1952.0 c450.1 b56.2 ab
Luyou7271508.3 a586.1 ab2094.4 a545.2 a54.0 c
Nei6you1031401.6 b622.0 ab2023.6 b465.4 ab53.8 c
Nei6you1071372.0 bc590.0 ab1962.0 c478.1 ab54.4 bc
Jinnongsimiao1210.4 d567.2 bc1777.6 d446.5 b57.0 a
Huanghuazhan1205.1 d500.6 c1705.7 e463.5 ab56.5 ab
Mean1333.6 585.6 1919.2 474.8 55.3
2019LuzhouDeyou47271223.9 a510.1 b1733.9 a417.9 a53.6 a
Luyou7271075.9 b565.4 ab1641.3 ab303.4 ab53.0 a
Nei6you103985.5 bc751.3 a1736.8 a168.1 b53.0 a
Nei6you1071003.6 b657.0 ab1660.7 a229.1 ab53.4 a
Jinnongsimiao967.6 bc568.9 ab1536.5 bc272.3 ab54.8 a
Huanghuazhan855.9 c674.5 ab1530.3 c132.3 b52.8 a
Mean1018.7 621.2 1639.9 253.9 53.4
DeyangDeyou47271457.1 ab527.5 c1984.6 ab583.4 a56.0 ab
Luyou7271479.9 a584.0 bc2064 a566.1 a55.7 b
Nei6you1031367.7 b593.5 bc1961.2 b538.5 a57.7 ab
Nei6you1071376.9 b626.1 abc2003.0 ab490.4 a55.8 b
Jinnongsimiao1066.7 c732.5 a1799.2 c300.2 b57.4 ab
Huanghuazhan1020.5 c690.6 ab1711.1 c305.4 b58.2 a
Mean1294.8 625.7 1920.5 464.0 56.8
2020LuzhouDeyou47271184.0 a503.3 b1687.4 ab314.5 ab48.5 bc
Luyou7271232.0 a503.8 b1735.8 a351.4 a49.3 ab
Nei6you1031016.1 bc627.4 a1643.5 b154.9 c47.6 c
Nei6you1071116.1 ab466.2 b1582.3 c288.3 ab47.7 c
Jinnongsimiao944.1 cd517.7 ab1461.8 d212.3 bc49.9 a
Huanghuazhan861.8 d446.7 b1308.6 e206.4 bc49.9 a
Mean1059.0 510.9 1569.9 254.6 48.8
DeyangDeyou47271697.6 a500.1 bc2197.7 b594.8 a49.8 ab
Luyou7271598.0 b711.7 a2309.7 a490.2 ab52.0 a
Nei6you1031708.8 a526.5 bc2235.2 ab560.3 ab48.6 b
Nei6you1071582.3 b553.8 b2136.1 b515.4 ab50.1 ab
Jinnongsimiao1344.3 c395.4 cd1739.6 c462.3 b49.3 ab
Huanghuazhan1346.1 c280.6 d1626.7 d543.8 ab50.7 ab
Mean1546.2 494.7 2040.8 527.8 50.1
Variance of analysis
Year (Y)**********
Location (L)**********
Cultivar (C)**********
Y × L*********
Y × C*******ns
L × C*******ns
Y × L × C******ns
Within the column for each location, the means of cultivars followed by the same letters are not significantly different according to LSD at p = 0.05. ‘*’ and ‘**’ denote significant differences at the 0.05 and 0.01 probability levels, respectively, as determined using ANOVA. ‘ns’ denotes non-significance based on ANOVA.
Table 6. Leaf area index (LAI) at the heading stage, crop growth rate (CGR, g m−2 d−1), and apparent radiation use efficiency (RUE) from transplanting (TR) to heading (HD) and HD to maturity (MA) of six rice cultivars grown under two different ecological conditions in a field experiment from 2018 to 2020.
YearLocationCultivarLAICGR (g m−2d−1)RUE (g MJ−1)
TR-HDHD-MATR-HDHD-MA
2018LuzhouDeyou47275.4 a15.3 a11.9 ab0.83 a0.61 ab
Luyou7274.6 a13.4 a19.0 a0.73 a0.96 a
Nei6you1035.0 a15.1 a12.8 ab0.84 a0.66 ab
Nei6you1075.5 a14.7 a7.3 bc0.78 a0.37 bc
Jinnongsimiao4.2 a15.2 a3.5 c0.83 a0.18 c
Huanghuazhan4.9 a13.8 a9.7 bc0.75 a0.50 bc
Mean4.9 14.6 10.7 0.79 0.55
DeyangDeyou47277.2 b15.0 bc18.0 a0.83 bc1.01 a
Luyou7278.4 a16.9 a16.7 ab0.94 a0.91 a
Nei6you1037.1 bc15.9 b17.8 a0.88 b0.97 a
Nei6you1077.1 bc15.8 bc16.9 ab0.86 bc0.92 a
Jinnongsimiao6.2 c14.9 c17.2 ab0.82 c0.92 a
Huanghuazhan6.9 bc14.9 c15.2 b0.82 c0.79 b
Mean7.2 15.6 17.0 0.86 0.92
2019LuzhouDeyou47276.0 a14.1 a16.5 b0.81 a0.92 b
Luyou7275.8 a11.8 b18.2 ab0.68 b1.03 ab
Nei6you1034.7 b11.3 b24.2 a0.65 b1.30 a
Nei6you1075.0 ab11.0 b21.2 ab0.64 b1.20 ab
Jinnongsimiao4.2 b11.8 b19.0 ab0.68 b1.06 ab
Huanghuazhan4.4 b10.4 b22.5 ab0.61 b1.36 a
Mean5.0 11.7 20.3 0.68 1.15
DeyangDeyou47277.6 ab16.7 a14.3 c0.92 a0.82 c
Luyou7278.0 a16.1 ab16.2 c0.88 ab0.97 abc
Nei6you1037.2 b15.7 ab16.5 bc0.86 ab0.94 bc
Nei6you1076.6 c15.1 b17.4 bc0.83 b1.03 ab
Jinnongsimiao4.5 e12.5 c20.9 a0.69 c1.16 a
Huanghuazhan5.3 d12.0 c19.7 ab0.66 c1.09 ab
Mean6.5 14.7 17.5 0.80 1.00
2020LuzhouDeyou47275.2 b13.6 a16.2 b0.74 a0.96 b
Luyou7276.7 a14.0 a16.3 b0.76 a0.95 b
Nei6you1033.8 c11.7 bc20.2 a0.63 bc1.19 a
Nei6you1074.7 b12.7 ab15.0 b0.69 ab0.88 b
Jinnongsimiao4.0 c11.7 bc17.3 ab0.63 bc1.02 ab
Huanghuazhan3.8 c10.6 c14.9 b0.57 c0.88 b
Mean4.7 12.4 16.7 0.67 0.98
DeyangDeyou47278.8 a19.5 a13.2 b1.01 a0.79 b
Luyou7278.8 a18.4 b17.8 a0.95 b1.08 a
Nei6you1039.5 a19.6 a13.9 b1.02 a0.83 b
Nei6you1078.8 a18.2 b13.8 b0.94 b0.84 b
Jinnongsimiao5.7 b16.6 c11.0 bc0.85 c0.65 bc
Huanghuazhan6.0 b16.6 c7.8 c0.85 c0.46 c
Mean7.9 18.2 12.9 0.94 0.77
Variance of analysis
Year (Y)**********
Location (L)****ns**ns
Cultivar (C)**********
Y × L**********
Y × C********
L × C********
Y × L × C********
Within the column for each location, the means of cultivars followed by the same letters are not significantly different according to LSD at p = 0.05. ‘*’ and ‘**’ denote significant differences at the 0.05 and 0.01 probability levels, respectively, as determined using ANOVA. ‘ns’ denotes non-significance based on ANOVA.
Table 7. Grain yield and yield components of six rice cultivars grown under two different ecological conditions in a pot experiment from 2019 to 2020.
LocationSoil #CultivarPanicles per HillSpikelet per PanicleGrain Filling (%)Thousand Grain Weight (g)Grain Yield (g per Hill)
2019202020192020201920202019202020192020
LuzhouLuzhouDeyou47277.8 b8.2 a104.6 cd97.3 d90.8 a90.4 b29.6 a30.0 a22.8 ab21.7 a
Luyou7278.2 b8.0 ab137.6 b115.2 c87.4 b87.4 c25.7 b25.8 c25.4 ab20.8 ab
Nei6you1039.7 a8.6 a99.8 d98.8 d92.5 a91.3 b29.3 a28.0 b26.3 a21.8 a
Nei6you1078.0 b7.1 bc112.3 c105.8 cd91.6 a87.3 c29.6 a27.8 b24.3 ab18.1 b
Jinnongsimiao7.0 b6.5 c177.6 a159.9 a90.1 ab93.8 a19.5 d19.7 e21.9 b19.2 ab
Huanghuazhan7.8 b7.1 bc142.8 b136.3 b91.9 a92.7 ab22.1 c21.9 d22.4 ab19.5 ab
Mean8.17.6129.1118.990.790.52625.523.820.2
DeyangDeyou47278.3 a7.0 ab118.5 c119.8 c87.1 ab89.8 ab28.5 ab30.0 a24.4 a22.5 a
Luyou7278.2 a7.5 a156.8 b138.0 b75.2 c86.6 bc23.5 c25.8 c22.7 a22.8 a
Nei6you1038.5 a6.9 ab116 c98.4 d89.4 a90.7 a28.9 a28.7 ab25.5 a17.5 b
Nei6you1077.9 a7.4 a131.5 c102.1 d83.2 b85.3 c27.8 b27.4 bc24.1 a17.6 b
Jinnongsimiao6.5 b5.7 b224.4 a186.3 a90.9 a87.2 abc19.2 e19.1 d25.4 a17.6 b
Huanghuazhan7.8 a7.0 ab157.1 b138.1 b90 a84.4 c20.5 d20.1 d22.5 a16.4 b
Mean7.96.9150.7130.48687.324.725.224.119
DeyangLuzhouDeyou472711.6 ab15.6 ab111.3 c82.0 bc95.6 ab93.0 c30.3 a30.1 a37.3 ab35.7 a
Luyou72713.2 a14.7 b121.3 c96.3 bc92.9 c93.9 bc27.1 c27.2 c40.0 a36.0 a
Nei6you10311.9 ab14.5 bc115.9 c79.5 c97.1 a95.0 b29.2 b28.9 b39.2 a31.6 a
Nei6you10712.1 a13.3 cd117.6 c85.7 bc93.1 bc93.9 bc29.4 b29.9 a38.6 ab32.0 a
Jinnongsimiao10 b12.6 d176.6 a143.0 a94.6 abc94.1 bc20.3 e19.4 e34.1 b32.6 a
Huanghuazhan12.1 a16.5 a134.8 b98.0 b96.9 a96.9 a22.8 d21.3 d35.9 ab33.3 a
Mean11.814.5129.697.49594.526.526.137.533.5
DeyangDeyou472712.1 ab14.3 a112.9 cd88.8 d96 ab91.8 a29.6 a29.4 a38.7 ab34.2 b
Luyou72713.1 a12.3 a128 c125.4 bc95.4 b94.0 a26.3 b26.7 b42.0 a38.7 a
Nei6you10312.3 ab14.1 a105.1 d93.0 d98.5 a91.5 a29.8 a29.3 a38.0 ab34.7 b
Nei6you10711.6 b13.1 a117.4 cd102.8 cd97.3 ab89.2 a29.5 a28.2 ab39.0 ab33.9 b
Jinnongsimiao9.2 c10.0 b207.3 a202.1 a95.5 b91.1 a19.7 d20.0 c35.8 b36.2 ab
Huanghuazhan11.8 b12.7 a146 b145.0 b97.2 ab92.6 a21.5 c21.2 c35.7 b36.1 ab
Mean11.712.8136.1126.296.791.726.125.838.235.6
Variance of analysis
Location (L)********************
Soil (S)ns*************nsns
Cultivar (C)********************
L × Sns********ns**nsns**
L × C*****ns******nsnsns
S × Cnsns**********nsnsns
L × S × Cns*ns****ns*nsnsns
Within the column for each soil, the means of cultivars followed by the same letters are not significantly different according to LSD at p = 0.05. * and ** denote significant differences at the 0.05 and 0.01 probability levels, respectively, as determined using ANOVA. ns denotes non-significance based on ANOVA. # The soil used in the pot experiments was collected from the top 25 cm layer of fields at the experimental stations of Deyang City and Luzhou City, Sichuan Province.
Table 8. Biomass production and harvest index of six rice cultivars grown under two different ecological conditions in a pot experiment from 2019 to 2020.
LocationSoil #CultivarBiomass Production (g per Hill)Harvest Index (%)
2019202020192020
LuzhouLuzhouDeyou472745.4 ab43.8 ab50.2 d49.4 b
Luyou72747.6 a41.8 ab53.4 bcd49.8 b
Nei6you10346.7 a45.3 a56.3 ab48.1 b
Nei6you10744.4 ab38.0 bc54.8 abc47.7 b
Jinnongsimiao41.9 ab38.0 bc52.1 cd50.3 b
Huanghuazhan39.0 b34.3 c57.5 a56.8 a
Mean44.2 40.2 54.0 50.4
DeyangDeyou472745.6 a39.1 ab53.6 c57.4 a
Luyou72747.5 a44.3 a47.8 d51.4 d
Nei6you10344.9 a32.7 c56.5 abc53.5 cd
Nei6you10744.5 a33.9 bc54.2 bc51.9 d
Jinnongsimiao43.6 a31.9 c58.3 a55.2 bc
Huanghuazhan38.8 b29.2 c57.8 ab56.0 ab
Mean44.2 35.2 54.7 54.2
DeyangLuzhouDeyou472773.4 a86.0 a51.0 b41.5 b
Luyou72772.7 a76.7 bc55.1 a47.0 a
Nei6you10372.6 a78.5 ab54 ab40.2 b
Nei6you10772.7 a75.8 bc53.1 ab42.2 b
Jinnongsimiao64.2 a69.5 c53 ab46.9 a
Huanghuazhan67.5 a71.3 bc53.3 ab46.7 a
Mean70.5 76.3 53.2 44.1
DeyangDeyou472774.4 a78.4 a52.0 c43.7 ab
Luyou72775.9 a80.9 a55.3 ab47.8 a
Nei6you10370.5 ab79.1 a53.9 bc44.0 ab
Nei6you10772.2 a80.4 a54 abc42.1 b
Jinnongsimiao64.4 bc75.9 a55.5 ab47.8 a
Huanghuazhan63.4 c76.2 a56.3 a47.4 a
Mean70.2 78.5 54.5 45.5
Variance of analysis
Location (L)****ns**
Soil (S)nsns***
Cultivar (C)********
L × Sns**ns**
L × Cnsns****
S × Cns*****
L × S × Cnsns**
Within the column for each soil, the means of cultivars followed by the same letters are not significantly different according to LSD at p = 0.05. * and ** denote significant differences at the 0.05 and 0.01 probability levels, respectively, as determined using ANOVA. ns denotes non-significance based on ANOVA. # The soil used in the pot experiments was collected from the top 25 cm layer of fields at the experimental stations of Deyang City and Luzhou City, Sichuan Province.
Disclaimer/Publisher’s Note: The statements, opinions and data contained in all publications are solely those of the individual author(s) and contributor(s) and not of MDPI and/or the editor(s). MDPI and/or the editor(s) disclaim responsibility for any injury to people or property resulting from any ideas, methods, instructions or products referred to in the content.

