Article

Biochar Mitigates Combined Effects of Soil Salinity and Saltwater Intrusion on Rice (Oryza sativa L.) by Regulating Ion Uptake

by
Napasawan Sudratt
1 and
Bualuang Faiyue
2,3,*
1
Interdisciplinary Program of Environmental Science, Graduate School, Chulalongkorn University, Bangkok 10330, Thailand
2
Environmental Research Institute, Chulalongkorn University, Bangkok 10330, Thailand
3
Center of Excellence on BCG towards Sustainable Development, Chulalongkorn University, Bangkok 10330, Thailand
*
Author to whom correspondence should be addressed.
Agronomy 2023, 13(3), 815; https://doi.org/10.3390/agronomy13030815
Submission received: 20 February 2023 / Revised: 2 March 2023 / Accepted: 8 March 2023 / Published: 10 March 2023
(This article belongs to the Special Issue Adaptation and Mitigation of Environmental Stress on Crops)

Abstract

:
Salinity intrusion is a significant threat to crop productivity and food security worldwide. The aims of the current study were to evaluate the effects of rice husk biochar amendment on the growth and yield of rice grown in saline soil with saltwater intrusion at the seedling stage and to investigate the mechanism by which biochar mitigates the harmful effects of salinity intrusion on rice. Phitsanulok 2 rice was grown in pots containing saline soil amended with 0%, 10%, 20%, and 30% (w/w) rice husk biochar. Pots were put in a pond and 6 dS/m of NaCl was applied for 28 days. The results showed that biochar application significantly increased the survival, shoot height, shoot dry weight, yield, and yield components of rice. Biochar addition significantly decreased shoot Na+ contents and increased the shoot K+/Na+ ratio. By using a Fourier-transform infrared spectrometer and a scanning electron microscope equipped with an energy-dispersive X-ray spectrometer, it was found that the negative surface charge of rice husk biochar was due to carboxyl and hydroxyl groups, and Na+ was detected on the surface of the biochar. We concluded that rice husk biochar amendment at a rate of 30% (w/w) could mitigate the negative effects of salt stress by absorbing Na+ in the saline soil, reducing Na+ uptake to the shoot, and increasing the shoot K+/Na+ ratio. Therefore, rice husk biochar amendment is a potential strategy for enhancing rice productivity in salt-affected soils with saltwater intrusion.

1. Introduction

Rice (Oryza sativa L.) is a staple food for more than half of the world’s population [1,2,3,4]. It is a salt-sensitive cereal crop, as the uptake of sodium ions (Na+) from salt-affected soils to the root xylem cannot be controlled, leading to toxic Na+ accumulation in the shoot [5,6]. The seedling-stage rice is sensitive to salinity, and salt stress significantly affects growth and yield [5,7,8]. For example, 7 day old seedlings of IR 2153 rice completely died within 20 days when treated with 50 mM NaCl [9]. The 14 day old rice genotype IR 55178 could survive only 90 days after exposure to 50 mM NaCl [6]. Similarly, about 50% of 25 day old rice of the genotypes IKP, T67, and IR 31785 survived after 14 days of salt stress at 20–50 mM NaCl [10]. The shoot dry weight of the rice cultivar M-202 was significantly reduced by 30% after salt-stressed exposure to 6 dS/m for 20 days [11]. Furthermore, reductions in shoot dry weight of approximately 18–37% were found in rice cvs. KDML 105 and IR 29 after salinizing 14 day old seedlings with 12 dS/m for 7 days [12]. The shoot height of NERICA 1 and RD6 rice was reduced by 23–25% when they were grown in soil supplemented with NaCl of 5–9 dS/m [13,14].
Soil salinity already affects 20% of agricultural areas, and this figure is expected to increase to up to 50% by the year 2050 with the acceleration of climate change [15,16,17,18]. Thus, soil salinity is one of the most important environmental problems adversely affecting sustainability and food security worldwide [19,20,21]. Increases in air temperature and in concentrations of atmospheric greenhouse gases cause the melting of glaciers and ice sheets, leading to sea level rise and seawater intrusion in the paddy fields of rice-producing countries, such as Bangladesh, Indonesia, Vietnam, and Thailand [18,22,23,24,25,26]. For example, rice yield losses due to saltwater intrusion in the Vietnamese Mekong Delta were estimated at about 18–30% per hectare per year [27]. Phan and Kamoshita [26] found that the yield of rice cultivated in coastal paddy fields in the Red River Delta in Vietnam was 641 g/m2 with water salinity of 0.5%, and it decreased to 472 g/m2 with 0.85% salinity water. Similarly, Sembiring et al. [28] reported that the yield of Sidenuk rice was significantly reduced by 17.5–74.0% when cultivated in saline paddy fields affected by seawater intrusion of 7–10 dS/m in West Java, Indonesia. Therefore, it is important to mitigate the effects of salt stress and seawater intrusion on the growth and productivity of rice.
One well-recognized approach for salinity mitigation is the use of biochar, a biomass residue pyrolyzed under limited oxygen conditions, as a soil amendment [29,30,31]. Application of rice husk biochar to salt-affected soils increased the biomass of the rice variety OM 6162 [32]. Similarly, addition of peanut shell biochar increased the growth and yield of the rice varieties G9 and Changbai-9 in saline-sodic soil [33,34]. Furthermore, a combination of rice husk biochar and corn stalk biochar increased the yield of Sakha 105 rice in salt-stressed soil [19]. Likewise, addition of wood biochar increased the shoot and spike dry weights of Jinyuan 85 rice under salt stress [35]. Biochar amendment has been found to effectively reduce salinity stress on plants by increasing the soil cation exchange capacity (CEC), total porosity, soluble and exchangeable K+, and fertilities [21,32]; decreasing soil electrical conductivity, soluble Na+ and Cl contents, exchangeable Na+ and Cl, and water evaporation [2,31,35,36]; reducing the shoot Na+ accumulation, Na+/K+ ratio, and relative electrical leakage; increasing the shoot K+ accumulation, improving leaf water status, increasing chlorophyll content, and increasing N use efficiency [2,33,34,37,38]; and regulating soil bacterial abundance and community structure [35]. Although biochar has been recommended for remediating salt stress in rice, there is a limited number of studies focusing on the beneficial effects of rice husk biochar on the growth and yield of rice in saline paddy soil with saltwater intrusion at the seedling stage. Rice husks are the major by-product of rice production and are separated from rice grains during the milling process. They account for 20% of the weight of paddy rice [39,40,41], and they are one of the main types of agricultural waste in many countries, such as China, India, Indonesia, Bangladesh, Vietnam, Myanmar, Australia, and Thailand [40,41]. The annual global production of rice husks is approximately 150 million tons [40,42]. They are partially used as bioenergy [40,41,43]. However, rice husks are usually burned in the fields, causing environmental problems [43,44,45]. Thus, turning rice husks into biochar is an effective solution for rice waste management and a potential approach for sustainable rice production [43]. Therefore, the objectives of this research were to: (1) investigate the effects of rice husk biochar amendment on the growth and yield of rice in saline paddy soil with saltwater intrusion at the seedling stage and (2) investigate the possible mechanisms by which rice husk biochar alleviates the harmful effects of saltwater intrusion on rice.

2. Materials and Methods

2.1. Experimental Site and Biochar

The experiment was conducted in a greenhouse with natural light and temperature at the Environmental Research Institute, Chulalongkorn University, Bangkok, Thailand. The average values for the temperature, relative humidity, and photosynthetically active radiation were 32.1 °C, 66%, and 588 µmol m−2 s−1, respectively.
Biochar was produced from rice husks through slow pyrolysis at 400 °C. The physicochemical properties of the biochar were determined according to the method described by Phetmak et al. [46]. Its characteristics were as follows: pH—7.55, organic matter (OM)—16.0%, CEC—26.8 cmol/kg, total N—0.68%, total P—0.62%, total K—1.03%, total Na—766 mg/kg, and EC—1.36 dS/m.

2.2. Plant Materials and Experimental Design

A total of 100 kg of soil was randomly collected from 0–15 cm depths in paddy fields invaded by seawater located in Bang Kha, Chachoengsao, Thailand (46′09.0″ N, 101°13′38.0″ E). Soil samples were air-dried, ground, passed through a 2 mm sieve, and analyzed for physicochemical properties based on the standard procedure from a soil survey laboratory methods manual [47,48]. The soil texture was clay and it contained 2.5% OM, 1.34 g/kg N, 0.21 g/kg P, and 9.2 g/kg K. The pH value was 4.14, the electrical conductivity of a saturated soil extract (ECe) was 5.09 dS/m, and the CEC was 28.4 cmol/kg.
Four plastic pots (25 cm in diameter and 21 cm in height) with five holes at the bottom of each pot covered with nylon mesh were filled with 3.5 kg of saline paddy soil per pot. Rice husk biochar was added to pots at rates of 0% (control), 10%, 20%, and 30% (w/w). Then, the saline soil and biochar in the pots were thoroughly mixed, and the pots were filled with water and left to incubate for 14 days. Our preliminary results showed that the 1–5% (w/w) biochar amendment rates were not enough to increase the survival of the rice seedlings.
Oryza sativa L. cv. Phitsanulok 2, a moderately salt-tolerant cultivar, was used in this experiment, as it is widely cultivated in the area of study and a famous cultivar in Thailand [49]. It is a non-photosensitive and high-amylose cultivar with an average yield of 5043 kg/ha [49]. Rice seeds were soaked in water for 24 h and incubated in wet tissue papers for 24 h. Then, 20 germinated seeds were selected and planted in each pot. After that, plastic pots were randomly put into a pond (60 cm in length, 60 cm in width, 30 cm in depth) with a polyethylene plastic liner filled with Yoshida solution [50] (EC 1.15 dS/m, pH 5.0) to prepare for salt stress at the seedling stage.

2.3. Effect of Saltwater Intrusion at Seedling Stage

Fourteen days after sowing (115 DAS), the solution in the pond was replaced with 6 dS/m of Yoshida solution mixed with NaCl and kept constant at 6 dS/m for 28 days to simulate seawater intrusion at the rice seedling stage. The EC of 6 dS/m was the same as that of the saltwater intrusion in the rice fields of farmers in Bang Kha, Chachoengsao, Thailand. The saline solution was changed every week to prevent nutrient depletion. After the saltwater-stressed period, the rice plants in each pot were counted to quantify survival and their heights were measured, then several were randomly harvested and oven-dried at 80 °C to assess shoot dry weight and for ion accumulation analysis. Finally, the solution in the pond was changed to Yoshida solution without NaCl until the yield was harvested.

2.4. Measurements of Yield and Yield Components

At the maturity stage (115 DAS), the shoot height was measured. The number of tillers per clump was counted. Then, the rice plants were harvested and oven-dried at 80 °C for 3 days. The grain yield and yield components were analyzed in terms of the active tiller percentage, panicle length, grain number per panicle, grain filling percentage, 1000 grain weight, and grain weight per pot.

2.5. Determination of Na+ and K+

The shoots or flag leaves of rice were put in a test tube filled with 100 mM HNO3, and incubated in a digital heat block at 90 °C for 2 h [9]. The Na+ and K+ in the extract solutions were determined using an atomic absorption spectrometer (ZEEnit 700 P, Analytik Jena, Jena, Germany).

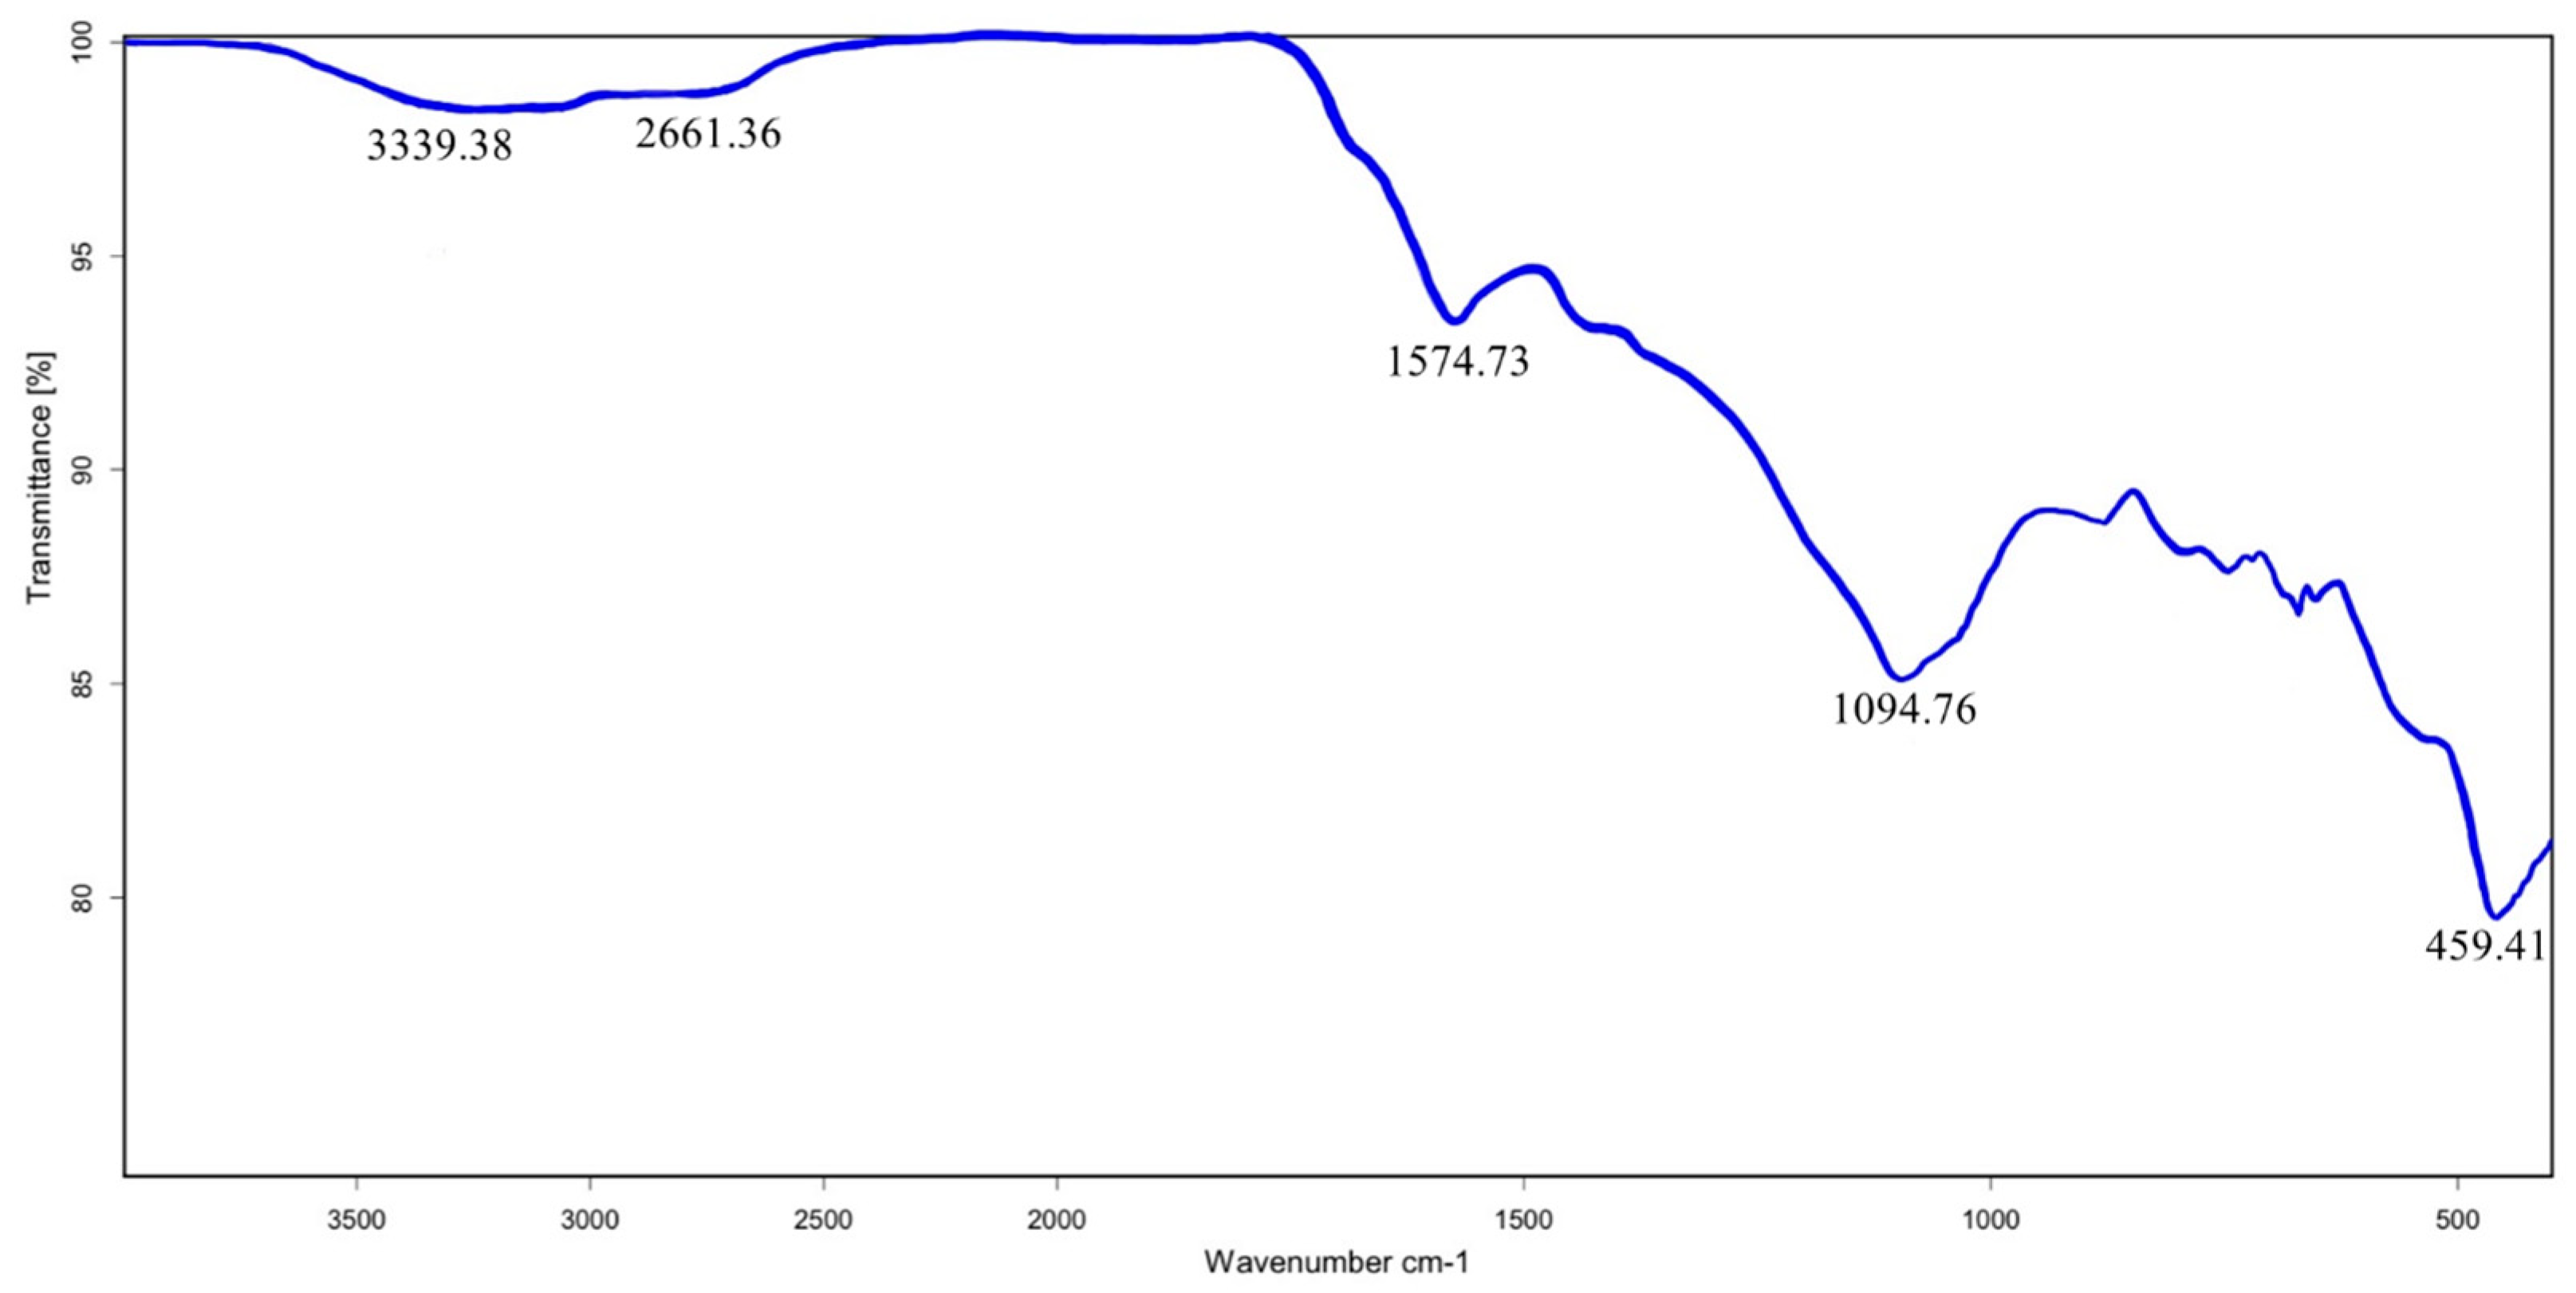
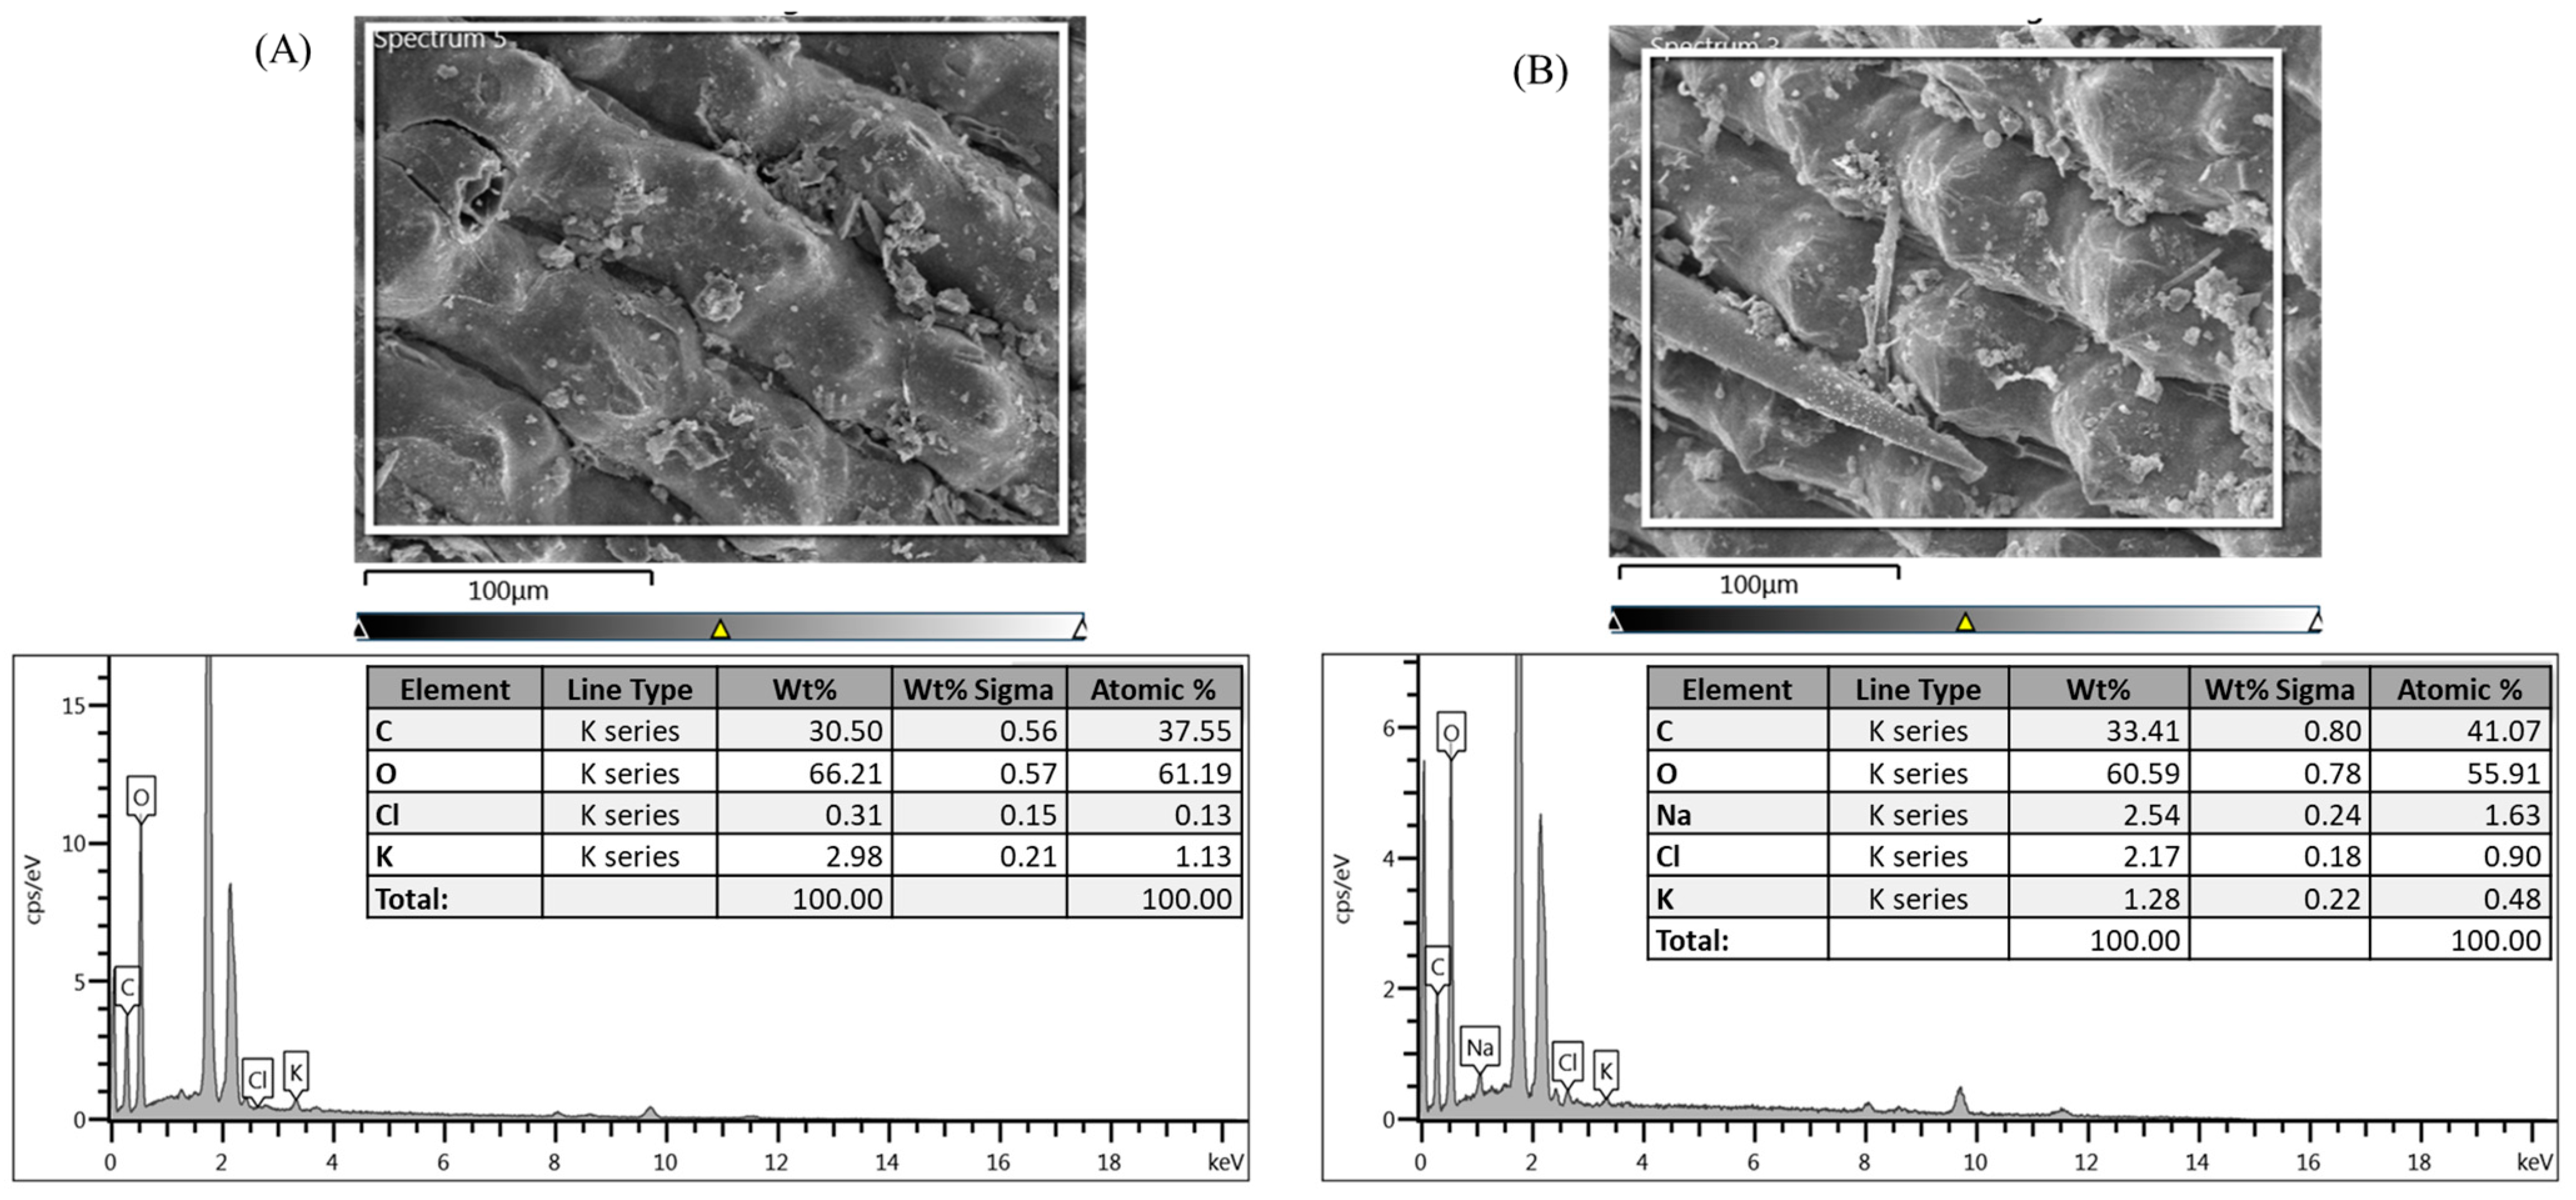
2.6. SEM and FTIR Analysis of Biochar

The rice husk biochar and the samples collected from the saline soil in pots were held on a 1 cm diameter aluminum stub with adhesive tape followed by a sputter coating with gold [51] and examined for element compositions using a scanning electron microscope equipped with an energy-dispersive X-ray spectrometer (SEM-EDX, JEOL, JSM-IT500HR, Tokyo, Japan) with an accelerating voltage of 15 kV. The functional groups on the biochar surface were analyzed with a Fourier-transform infrared (FTIR) spectrometer (PERKIN ELMER Spectrum One, Branford, CT, USA) in the wavenumber range of 400–4000 cm−1.

2.7. Data Analysis

The experiment was arranged according to a completely randomized design with three replicates [36]. Data were expressed as the mean and the standard error of the mean (SE). The significant difference was assessed with one-way analysis of variance using Duncan’s multiple range test (DMRT) at the 5% level with SPSS software (v16.0).

3. Results

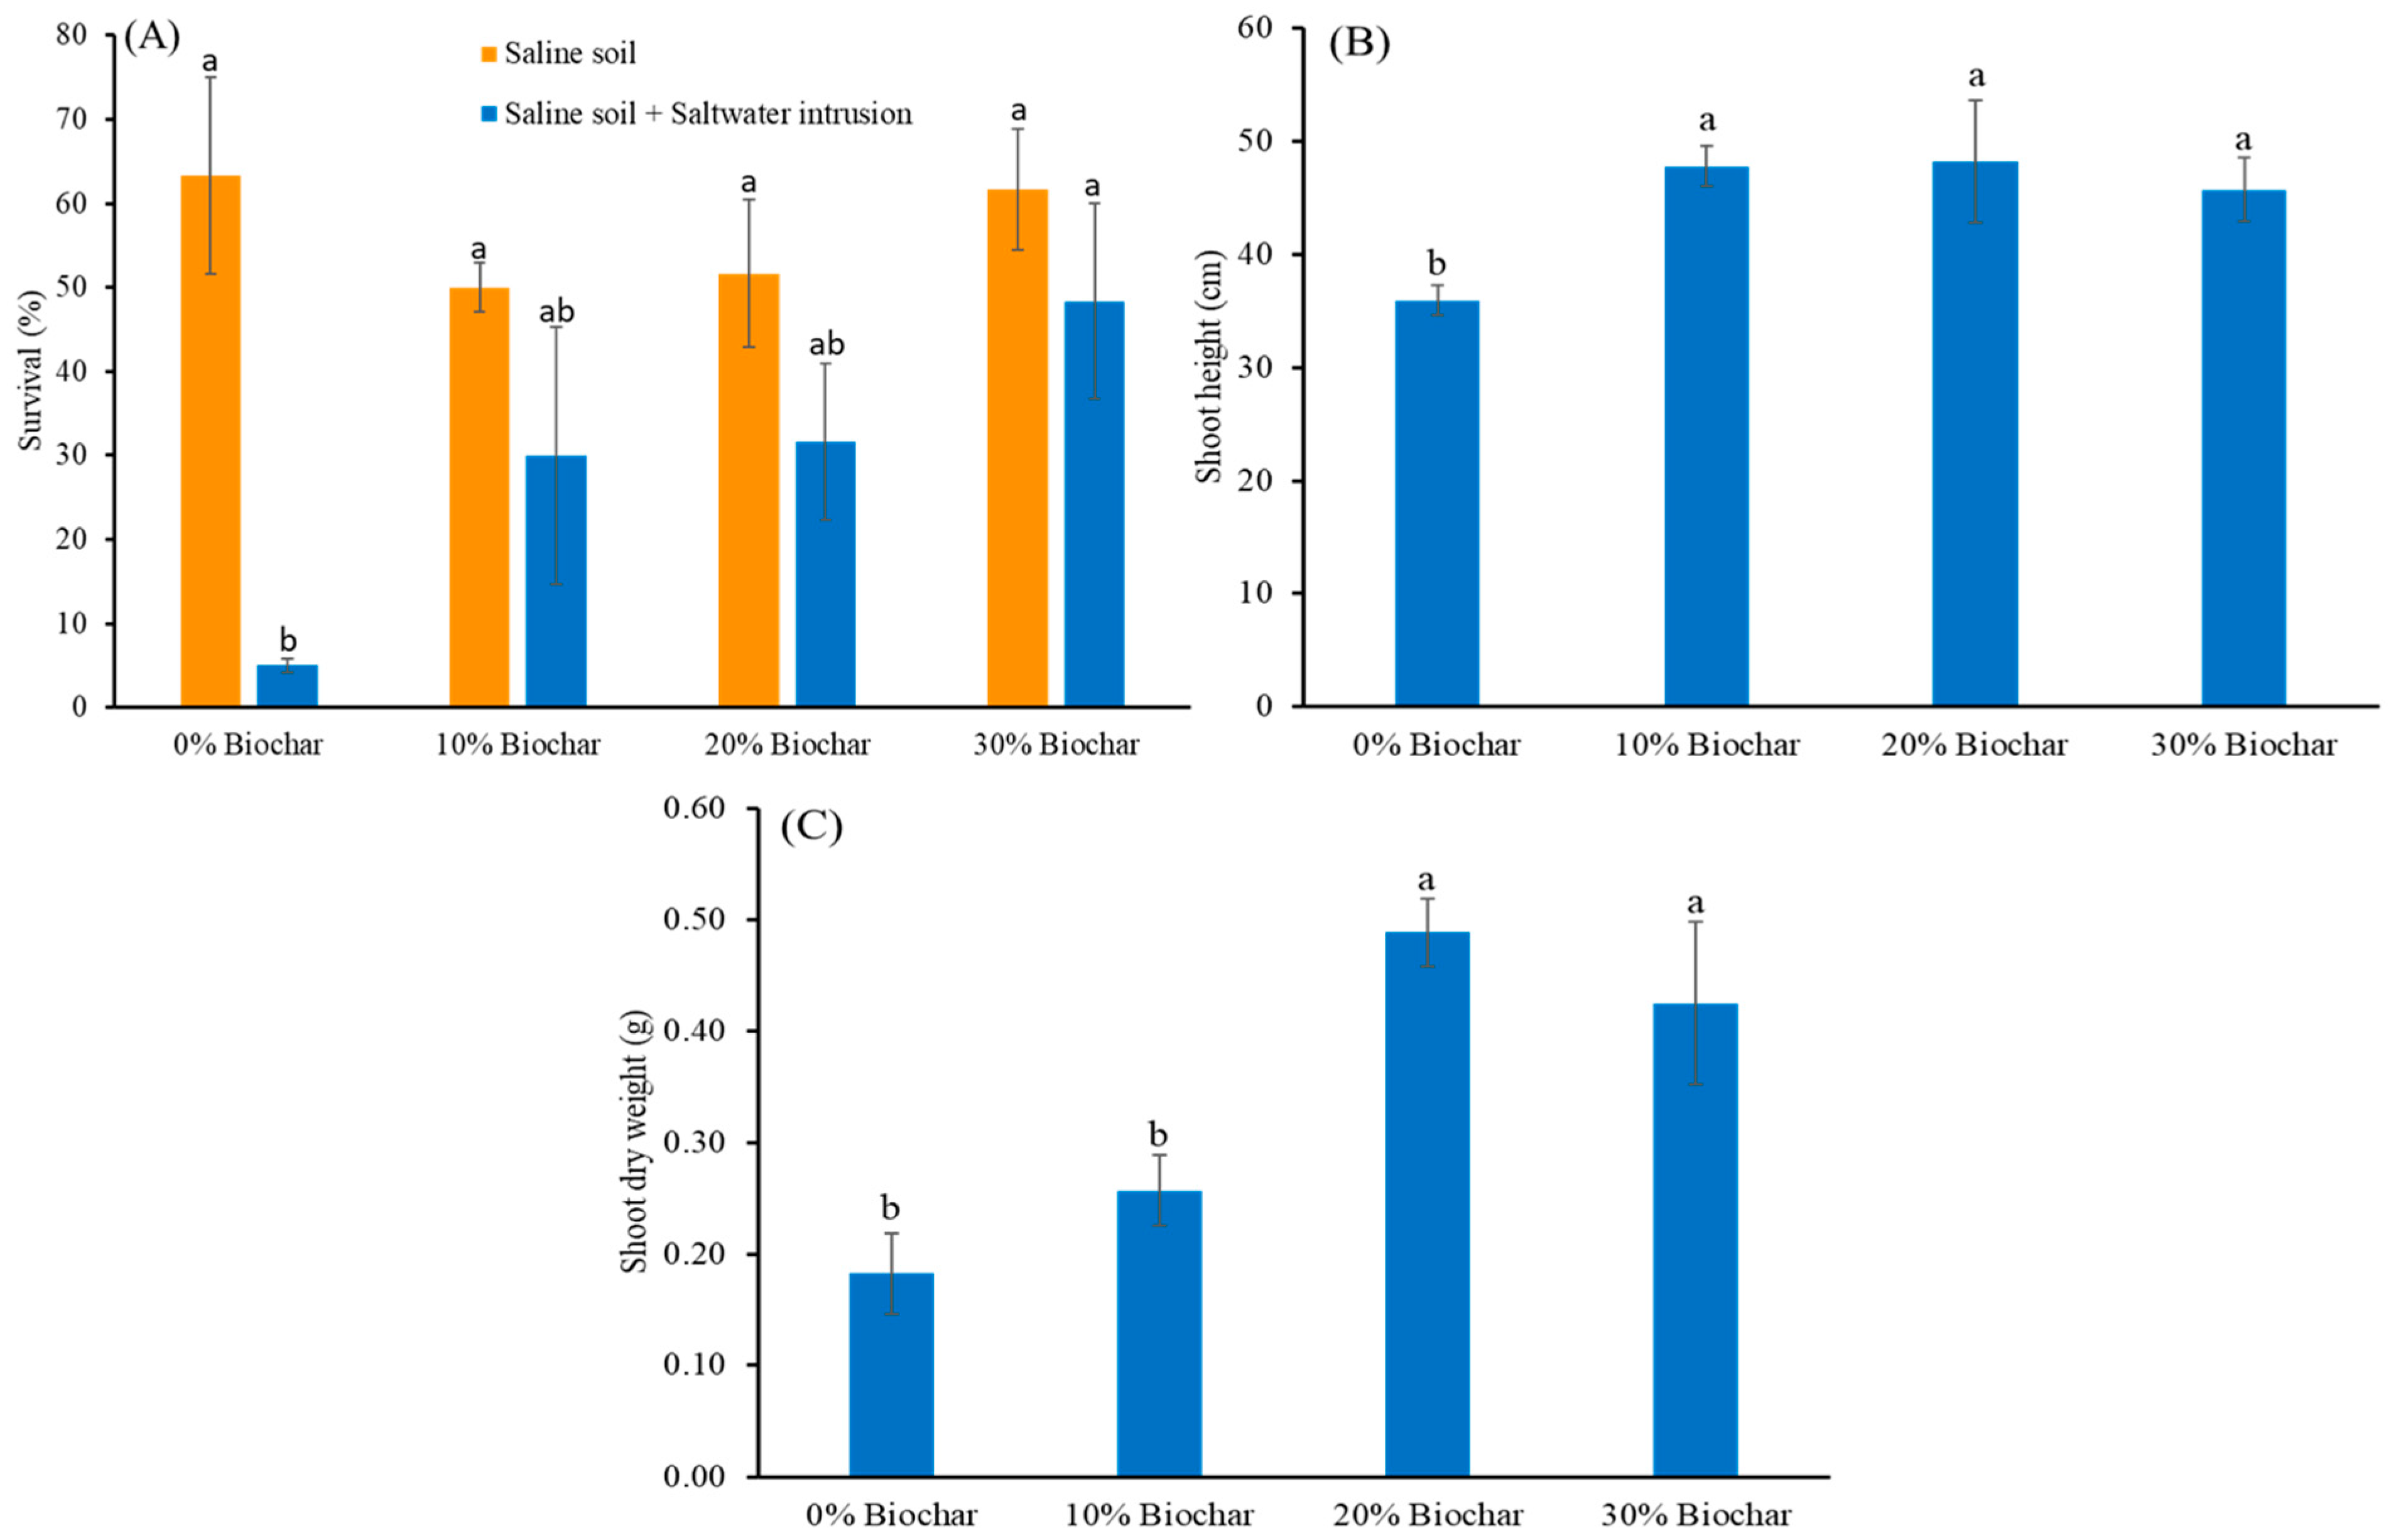
3.1. Survival and Growth of Rice after Saltwater Intrusion at the Seedling Stage

Approximately 63% of the Phitsanulok 2 rice seedlings grown in salt-affected paddy soil for 14 days without the addition of biochar survived (Figure 1A). The proportion of seedlings in saline soil without biochar that survived significantly decreased to 5% when the rice plants were treated with saltwater for 28 days (Figure 1A), whereas the survival of the seedlings with biochar added was not significantly affected by saltwater (Figure 1A). Among the biochar application rates, 30% (w/w) significantly increased survival up to 50% compared to no biochar addition (Figure 1A). The shoot height of the rice grown in saline soil with saltwater intrusion but without biochar was about 36 cm, and it significantly increased to an average of 48 cm when 10–30% (w/w) biochar was added to the soil (Figure 1B). The shoot dry weight of the rice grown in saline soil with saltwater intrusion was about 0.2 g, and it increased significantly to an average of 0.5 g when 20–30% (w/w) biochar was added to the saline soil (Figure 1C).

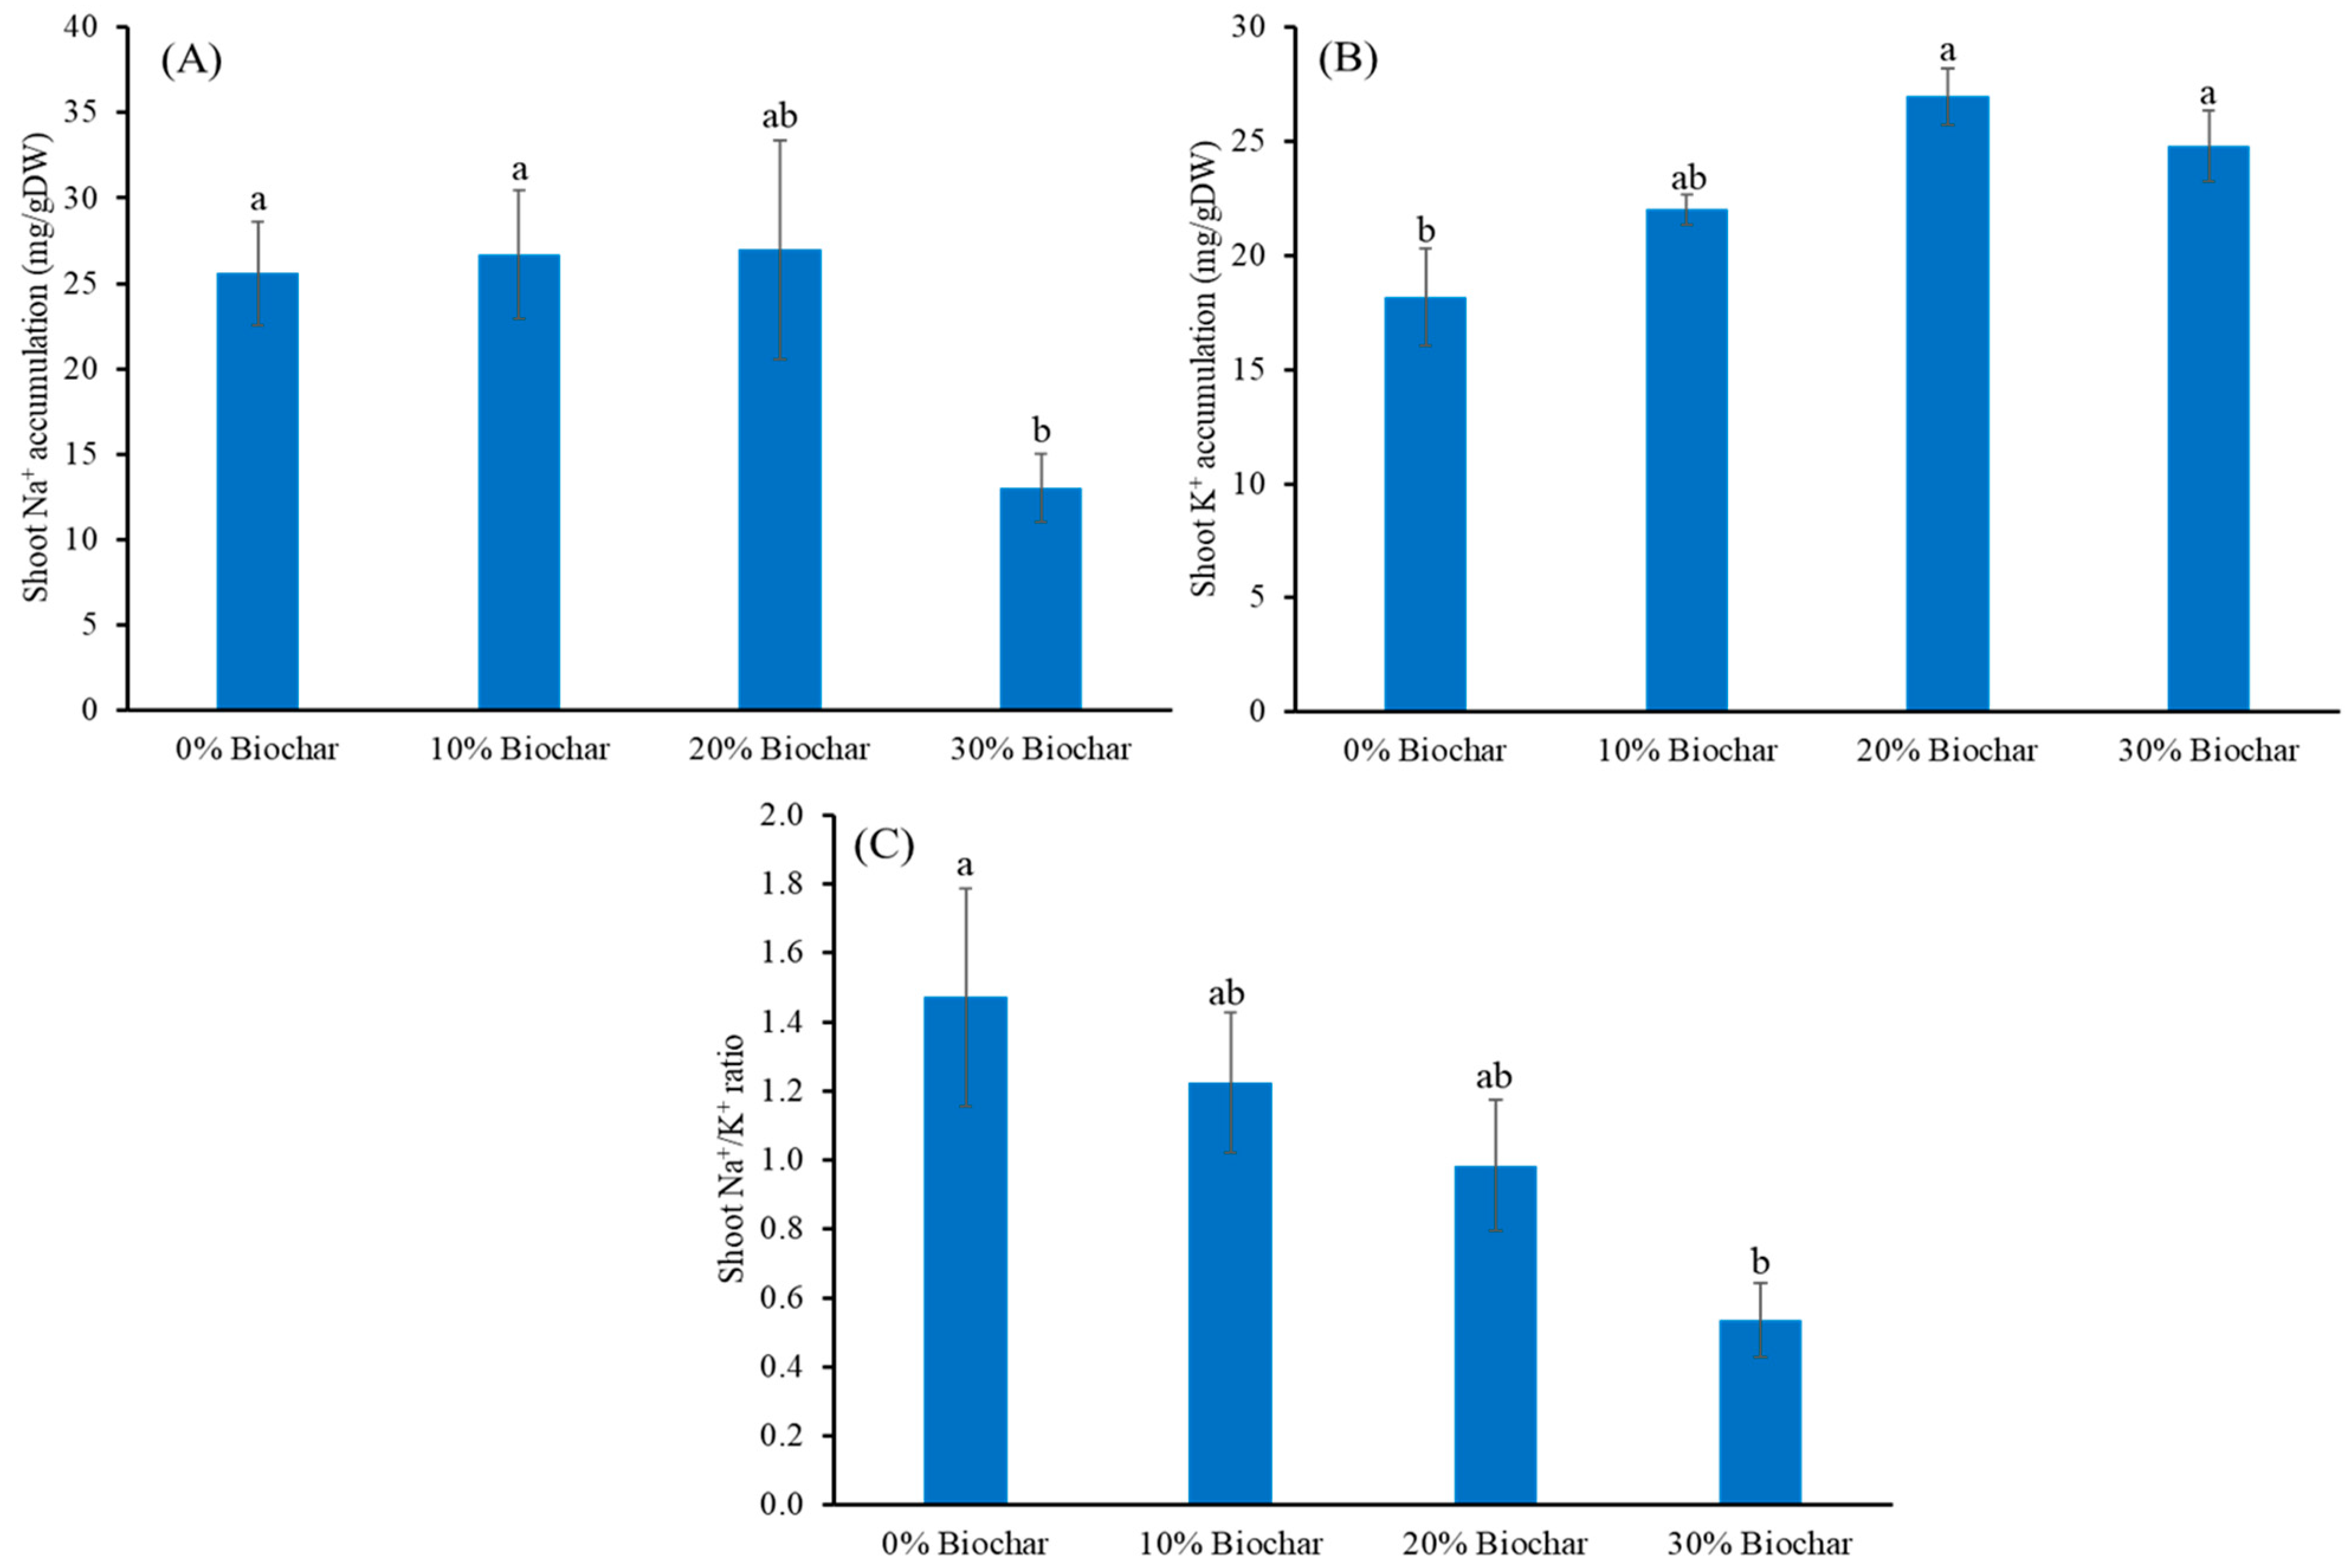
3.2. Ion Accumulation in Shoots of Rice after Saltwater Intrusion at the Seedling Stage

Na+ concentrations in the shoots of rice grown in salt-stressed soil with saltwater intrusion for 28 days were 25.6, 26.7, and 27.0 mg/gDW for the treatments with 0, 10, and 20% (w/w) biochar amendments, respectively (Figure 2A). The shoot Na+ concentration was significantly decreased to 13 mg/gDW when 30% (w/w) biochar was added to the soil (Figure 2A). The K+ concentration in the shoots was 18.2 mg/gDW for the controlled rice seedlings, and it significantly increased to 27.0 and 24.8 mg/gDW with 20% and 30% (w/w) biochar application rates, respectively (Figure 2B). The shoot Na+/K+ ratio for rice under salt stress without biochar was about 1.5 (Figure 2C). Biochar application at rates of 10% and 20% (w/w) did not significantly change the shoot Na+/K+ ratio, whereas 30% (w/w) biochar amendment significantly decreased the Na+/K+ ratio compared to the control to 0.5 (Figure 2C).

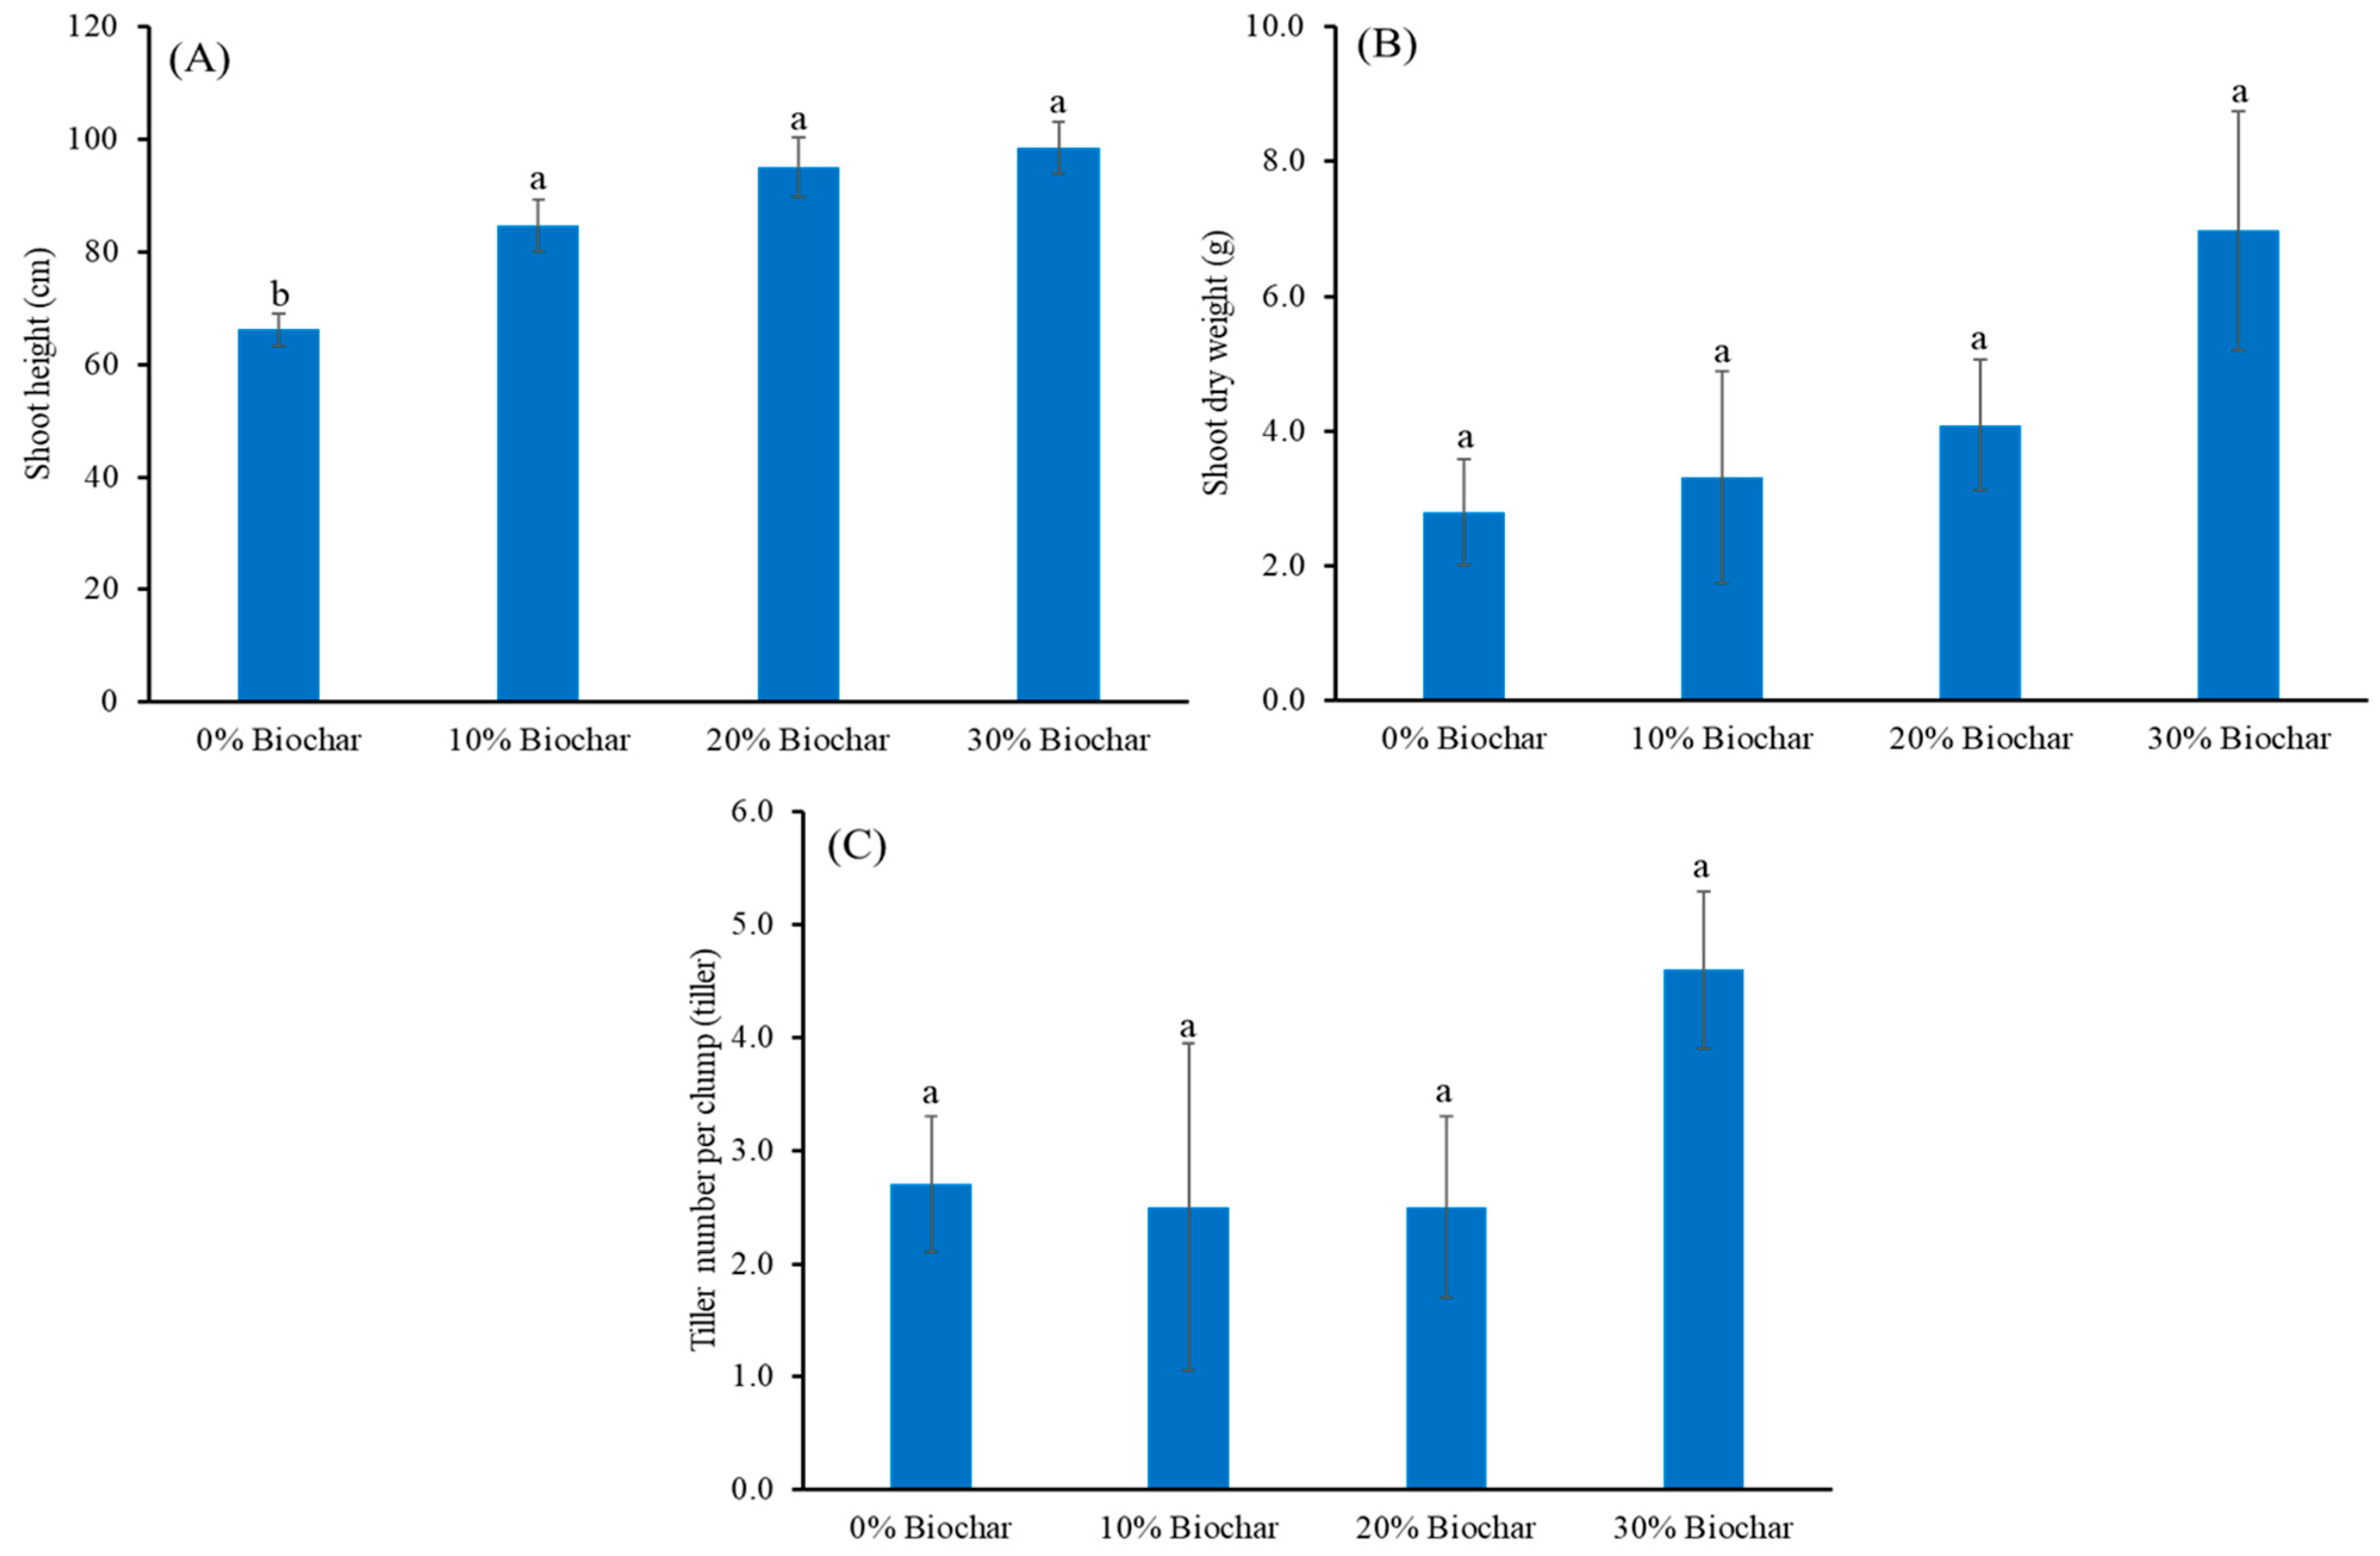
3.3. Growth of Rice at the Harvesting Stage

At the harvesting stage, the shoot height of the Phitsanulok 2 rice was about 66 cm, and the height significantly increased to 85 cm, 95 cm, and 99 cm when 10, 20, and 30% (w/w) biochar was added to the soil, respectively (Figure 3A). The shoot dry weight and number of tillers per clump for the rice without biochar were about 3 g and three tillers, respectively (Figure 3B,C). Biochar application rates of 10–30% (w/w) did not significantly change the shoot dry weight or number of tillers (Figure 3B,C).

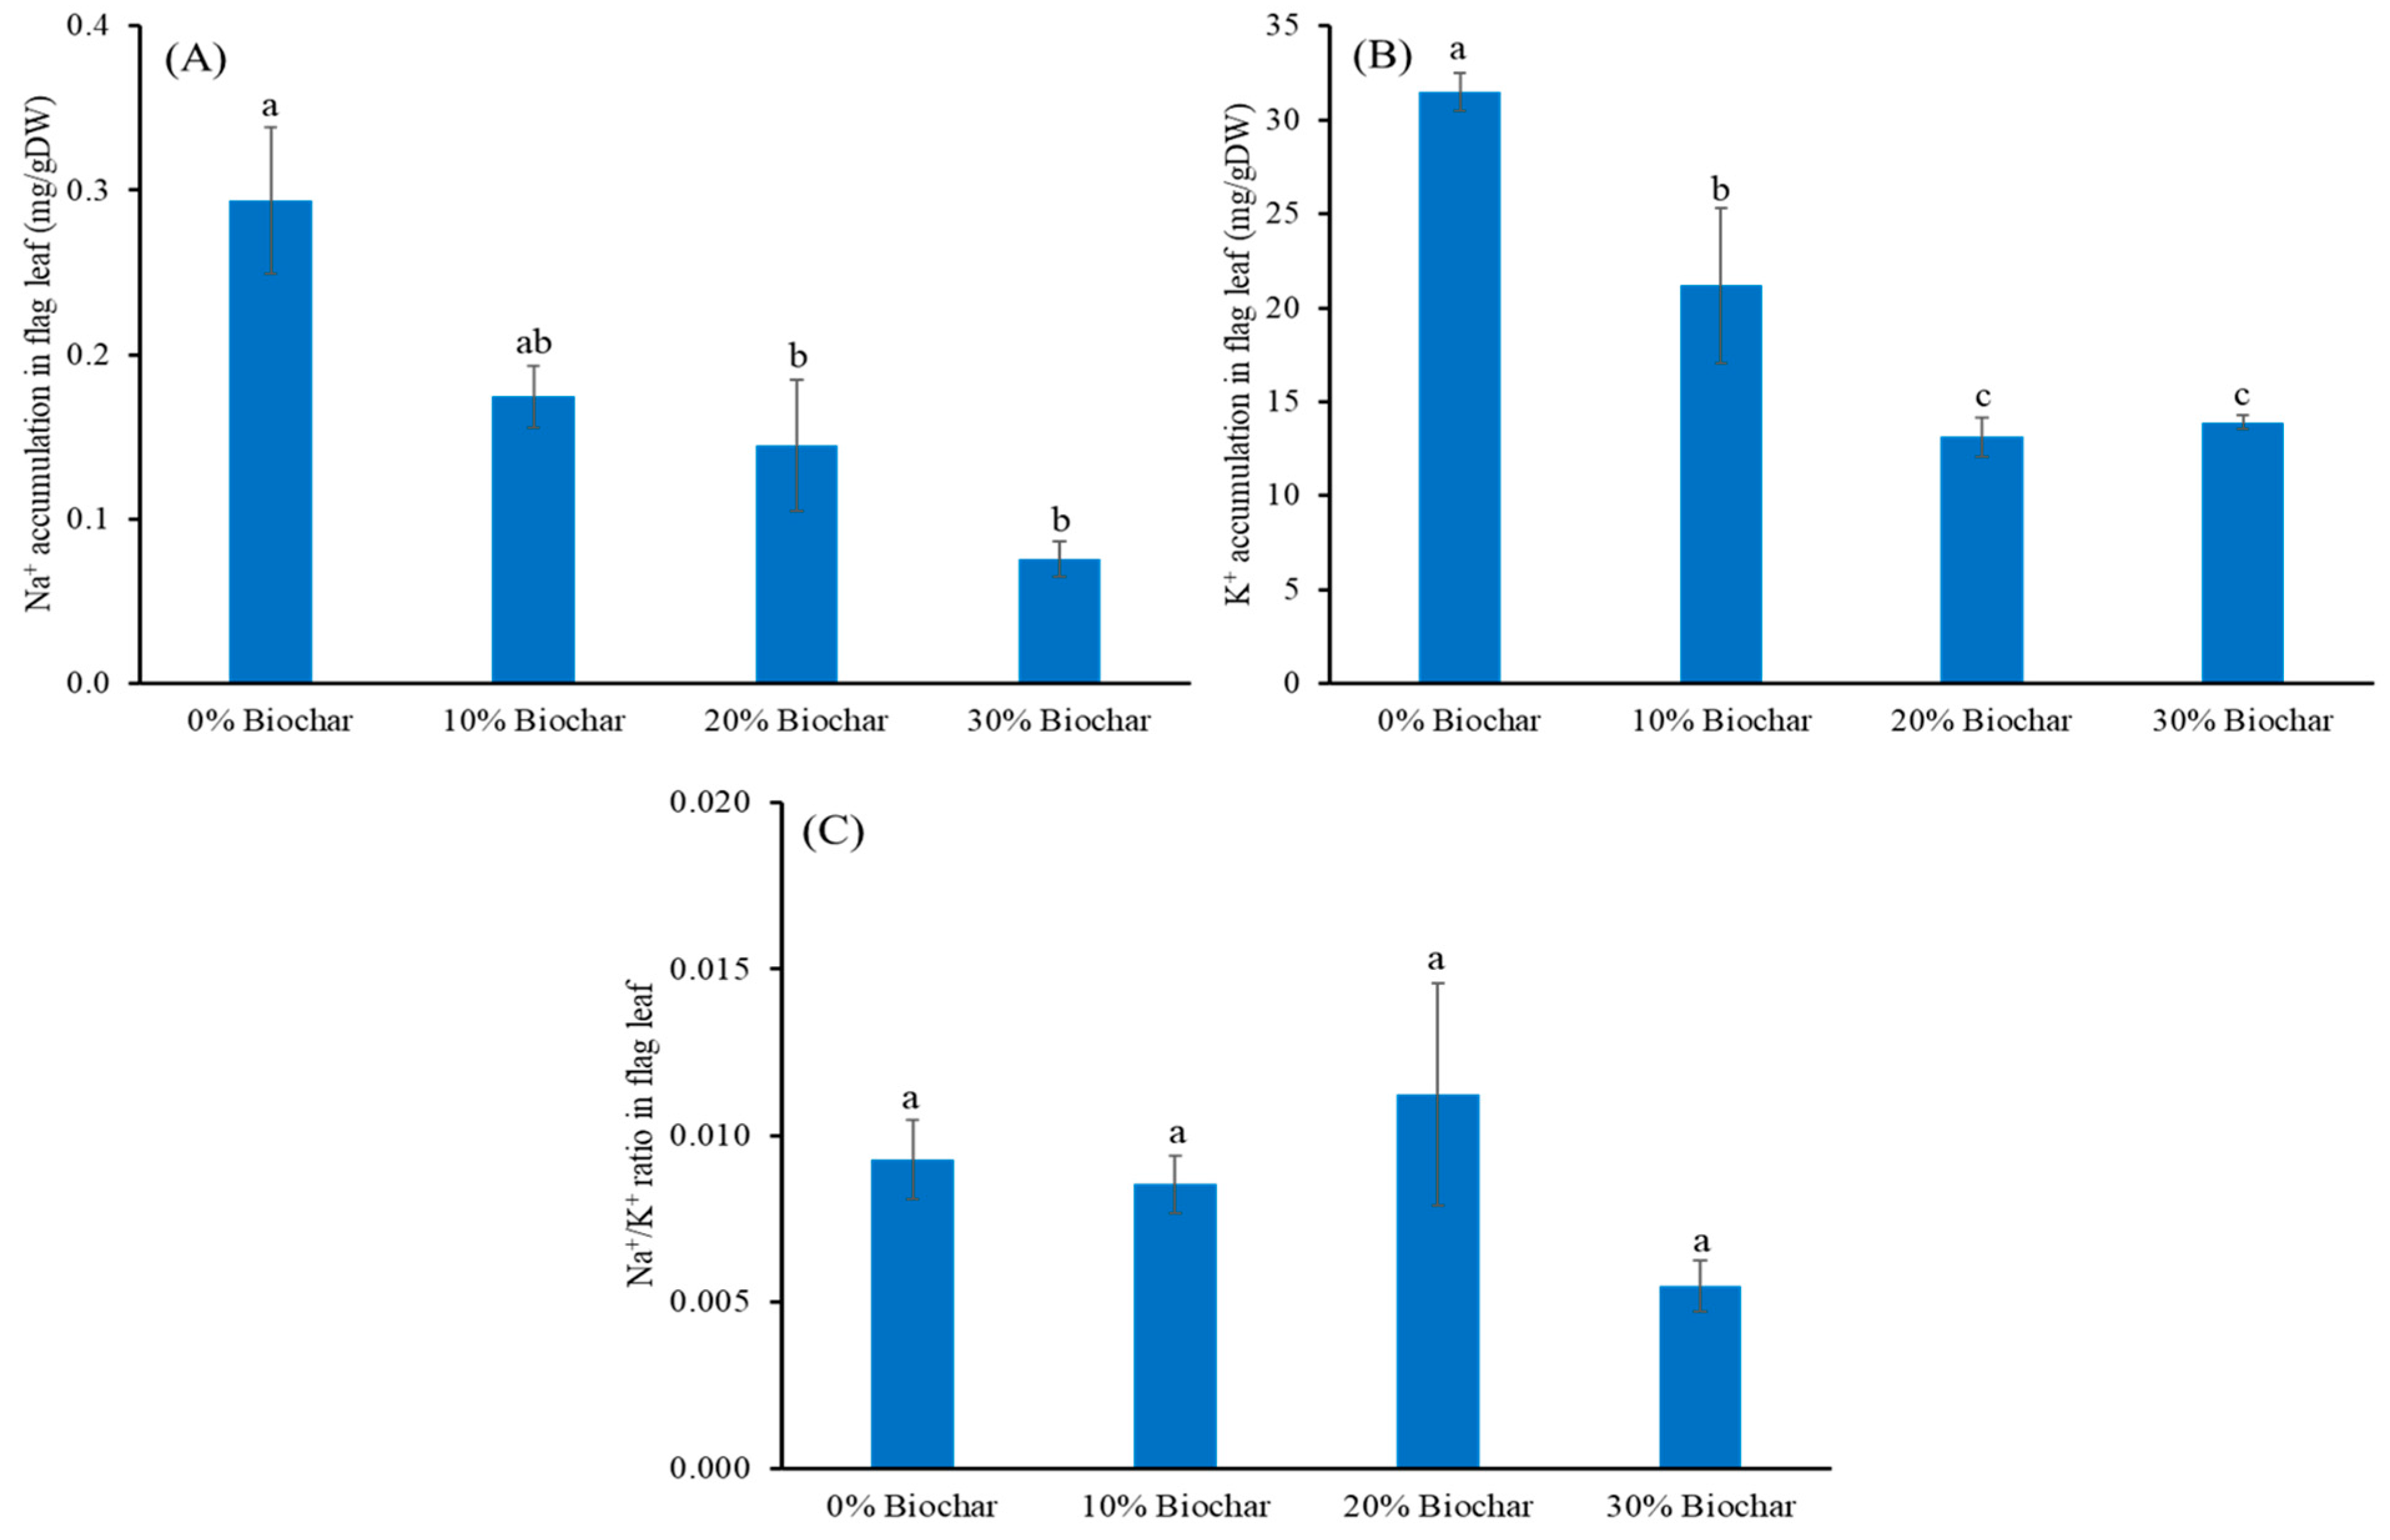
3.4. Ion Accumulation in Flag Leaves of Rice at the Harvesting Stage

The Na+ concentration in the flag leaves of rice without biochar at the harvesting stage was approximately 0.3 mg/gDW (Figure 4A). The concentrations of Na+ in flag leaves decreased with increasing biochar application rates. It was found that 20–30% (w/w) biochar amendment significantly reduced flag leaf Na+ concentrations to an average of 0.1 mg/gDW (Figure 4A). Flag leaf K+ concentrations in rice supplemented with biochar were significantly lower than in rice without biochar (Figure 4B). However, the Na+/K+ ratio in flag leaves was not significantly different between biochar and non-biochar treatments (Figure 4C).

3.5. Yield and Yield Components at the Harvesting Stage

Phitsanulok 2 rice grown in saline soil with saltwater intrusion for 28 days and without biochar addition produced 48% active tillers, and the percentage increased to 69%, 68%, and 90% after adding 10%, 20%, and 30% (w/w) biochar to the soil (Table 1). It was found that 30% (w/w) biochar addition significantly increased the proportion of active tillers by 42% compared to no biochar addition (Table 1). The panicle length of the rice grown under salt stress without biochar was about 20 cm, and it increased significantly to 24.0, 26.3, and 29.2 cm after application of 10–30% (w/w) biochar to the soil (Table 1). Rice without biochar produced approximately 33 grains/panicle and had only 4% filled grains in a panicle (Table 1). Biochar application rates of 10% and 20% (w/w) did not significantly increase the number of grains in a panicle, but they significantly increased grain filling percentage to approximately 30% and 47%, respectively (Table 1). The biochar application rate of 30% (w/w) significantly increased both the number of grains in a panicle to 94 grains and the filled grain percentage to 43% compared to the control (Table 1). The 1000 grain weight of the rice grown without biochar was approximately 19 g, and it increased significantly to 20.1, 23.7, and 23.4 g for 10%, 20%, and 30% (w/w) biochar addition (Table 1). Grain weights/pot of rice with 10% and 20% (w/w) biochar application rates were not significantly different from that of the control without biochar, showing an average of about 3.3 g/pot, whereas the 30% (w/w) application of biochar increased grain weight/pot significantly to 12.23 g (Table 1).

3.6. FTIR and SEM-EDX of Biochar

The functional groups on the surface of the rice husk biochar were identified with FTIR (Figure 5). The transmittance peak at 3339.38 cm−1 typically represents hydroxyl groups (–OH). The peak at 2661.36 cm−1 is attributed to carboxyl groups. The peak at 1574.73 cm−1 is associated with C=C stretching vibrations. The peak at 1094.76 cm−1 can be attributed to the stretching vibrations of Si-related functional groups. The peaks below 600 cm–1 can be attributed to metal–halogen stretching vibrations.
The SEM–EDX result showed that C and O were the major components of the rice husk biochar (Figure 6). Na+ was detected only in the biochar collected from the saline soil, whereas K+ was found in both the biochar and the biochar collected from the saline soil (Figure 6).

4. Discussion

Biochar has been considered as a soil amendment for rice under salinity stress as it has been found that it effectively increased soil fertilities and soil CEC [21,32]; decreased the soil EC and soluble Na+ and Cl contents [2,35]; reduced the shoot Na+ accumulation, Na+/K+ ratio, and relative electrical leakage; increased the shoot K+ accumulation, improved the leaf water status, and increased the chlorophyll content [2,33,34]; and regulated the soil bacterial community structure [35]. Although many studies on biochar addition to saline soil have been undertaken, there are few reports on the effects of biochar on the growth and yield of rice in saline soil with saltwater intrusion, and the potential mechanism underlying the effects of biochar still needs to be investigated [30,31,52].
Our results showed that approximately 63% of Phitsanulok 2 rice grown in saline paddy soil with an ECe of 5.09 dS/m caused by seawater intrusion survived at 14 days old, and the survival severely decreased to 5% when seedlings were subjected to invasion by saltwater with an EC of 6 dS/m for 28 days (Figure 1). The results strongly indicated that saltwater intrusion was harmful to crop growth. Rice is the most salt-sensitive cereal crop [1,17,53]. Growth and yield can be affected by field water salinity as low as 1.9 dS/m, and salinity effects are dependent on salt concentration, time of exposure, and the growth stages of rice [54]. The finding that only 5% of 14 day old rice seedlings survived after being treated with saltwater is in line with previous reports that the seedling stage of rice is very sensitive to salinity [5,7,8,54]. Reductions in survival and growth due to salinity have also been reported in other rice genotypes, such as IR29, IR 2153, IR 31785, IR 55178, IKP, T67, M-202, KDML105, NERICA 1, RD6 [6,9,10,11,12,13,14]. The present study showed that the biochar application rate of 30% (w/w) significantly increased the survival percentage for rice compared to no biochar application after saltwater intrusion for 28 days (Figure 1A), and the shoot height and dry weight significantly increased with the 20% and 30% (w/w) biochar application rates (Figure 1B,C). The results are consistent with previous reports that biochar addition improved the growth of rice under salt stress [32,33,34,35]. However, at the time of harvest, the shoot dry weight of the rice did not significantly differ between the control and 10–30% (w/w) biochar treatments, whereas the shoot height increased significantly after adding biochar (Figure 3A,B). The results are in agreement with those of Ran et al. [34], who reported that addition of biochar increased the shoot height of rice under salt stress, and Phuong et al. [21], who found that biochar addition did not improve the straw dry weight of the rice variety Tep Hanh under salinity conditions. A possible explanation is that the increase in height stimulated by the biochar was a result of competition for light for better photosynthesis during the growth cycle of the rice, while the shoot dry weight was not affected due to the transport of assimilates and nutrients to the panicles of the reproductive stage [55].
Significant yield losses about 17.5–74.0% have been found for rice cultivated in paddy fields subjected to seawater intrusion in Vietnam and Indonesia [26,27,28]. Consistently, in the present study, Phitsanulok 2 rice grown in saline soil with saltwater intrusion produced 48% active tillers with 20 cm panicle lengths, with approximately 33 grains/panicle and only 4% filled grains in each panicle (Table 1). The rice yielded 0.80 g/pot in total or approximately 16 g/m2 (Table 1). However, the yield of rice increased significantly to 12.23 g/pot or about 250 g/m2 when 30% (w/w) biochar was added to the saline soil (Table 1). Addition of 30% (w/w) biochar significantly increased the proportion of active tillers, panicle length, number of grains/panicle, grain filling percentage, 1000 grain weight, and grain weight/pot (Table 1). Our results correlate with previous findings that addition of biochar increased the yield and yield components of rice under salinity conditions [2,33,34,35].
The sensitivity of rice to salinity in general is correlated with Na+ accumulation because rice cannot control the uptake of Na+ from saline soil to the root xylem, leading to high Na+ transport from roots to the shoot [5,6,9,56]. It is evident that the low survival percentage for Phitsanulok 2 rice in the control group was compatible with high Na+ concentrations in the shoot during the seedling stage after saltwater intrusion for 28 days (Figure 1A and Figure 2A). Furthermore, the highest Na+ concentration in flag leaves was observed in the control group consisting of rice without biochar; however, during the reproductive stage, the rice plants were grown in Yoshida solution without NaCl (Figure 4A), indicating that high amounts of Na+ were continuously transported from the saline soil to the aerial parts of the rice. Therefore, if the Na+ uptake is restricted, the growth and survival of rice improve. Our results showed that addition of 30% (w/w) biochar to saline soil significantly decreased Na+ concentrations in the shoots and flag leaves of rice after salt stress (Figure 2A and Figure 4A). The results are consistent with those of Jin et al. [33] and Ran et al. [34], who reported that biochar applications decreased Na+ accumulation in the shoots of G9 and Changbai-9 rice growing in salt-affected soil. It has been reported that biochar alleviates salt stress in plants via its sorption ability [57,58]. The Na+ sorption capacity of biochar depends on the surface area, pore volume, and functional groups [59,60]. The main functional groups present on biochar surfaces are hydroxyl and carboxyl, which contribute to biochar’s negative surface charges [51,61,62]. The results from the FTIR spectra also showed hydroxyl and carboxyl functional groups on the surface of the rice husk biochar (Figure 5). Our results showed that addition of 30% (w/w) rice husk biochar significantly decreased Na+ accumulation in shoots and flag leaves of Phitsanulok 2 rice under salinity conditions (Figure 2A and Figure 4A). A possible explanation is that the rice husk biochar reduced the amount of Na+ available in the rhizosphere by adsorbing Na+ through its negative surface charges, thus reducing Na+ uptake and transport to the aerial parts of the rice. The results from the SEM–EDX analysis showed that Na+ was detected only on rice husk biochar collected from salt-affected soil (Figure 5). Consequently, our results reinforce earlier reports that biochar ameliorates salinity stress in plants due to its strong Na+ sorption ability [57,58,59]. Furthermore, the Na+ sorption capacity increased when the surface area and pore volume of biochar were increased [59]. Hence, rice husk biochar application rates higher than 30% (w/w) are needed in further studies to shed more light on how biochar mitigates the combined effects of soil salinity and saltwater intrusion on rice.
The 30% (w/w) application of rice husk biochar significantly increased the shoot K+ concentration and decreased the shoot Na+/K+ ratio compared to no biochar application (Figure 2B,C). Our results agree with those of Morales et al. [63], Assaha et al. [64], and Zhang et al. [65], who reported that maintaining a low tissue Na+/K+ ratio or high K+/Na+ ratio is one mechanism of salt tolerance in rice. The results also correlate with those of Ran et al. [34], who found that application of peanut shell biochar at rates of 3.375–10.125 kg/m2 enhanced shoot K+ accumulation and reduced the Na+/K+ ratio for rice in salt-affected paddy fields. Furthermore, Hafez et al. [2] showed that biochar co-applied with plant growth-promoting rhizobacteria decreased the Na+/K+ ratio; increased N, P, and K+ uptake; and improved the productivity of rice in salt-affected soil. Nguyen et al. [32] reported that biochar application increased the biomass of OM 6162 rice in salt-affected soil by increasing P availability in the soil. In the present study, the rice husk biochar contained 16.0% OM, 0.68% total N, 0.62% total P, and 1.03% total K+. The SEM–EDX spectra also showed high K+ in the biochar (Figure 6A). Thus, rice husk biochar added to saline soil could provide N, P, and K+ and increase soil nutrient availabilities for rice growth under salt stress.

5. Conclusions

This study showed that soil salinity and saltwater intrusion at the seedling stage significantly decreased the survival, shoot height, shoot dry weight, yield, and yield components of Phitsanulok 2 rice. Rice husk biochar application at a rate of 30% (w/w) mitigated the negative effects of salt stress by absorbing Na+ in the saline soil, reducing Na+ accumulation, and increasing the shoot K+/Na+ ratio in the rice plant. Therefore, addition of rice husk biochar is a potential strategy for enhancing rice productivity in salt-affected soils with saltwater intrusion.

Author Contributions

B.F. conceptualized the study; N.S. conducted the experiments and collected samples; N.S. and B.F. performed the data analysis; B.F. wrote the original draft; B.F. and N.S. reviewed, edited, and finalized the paper. All authors have read and agreed to the published version of the manuscript.

Funding

This research was funded by the Thailand Science Research and Innovation Fund Chulalongkorn University (CU_FRB65_dis (31)_215_54_02), and N.S. was partially funded by the Interdisciplinary Program of Environmental Science Graduate School Thesis Grant of Chulalongkorn University.

Data Availability Statement

Data available from the author.

Acknowledgments

This study was fully supported by the Thailand Science Research and Innovation Fund Chulalongkorn University (CU_FRB65_dis (31)_215_54_02) and partially supported by the Interdisciplinary Program of Environmental Science Graduate School Thesis Grant of Chulalongkorn University to N.S. We thank Phitsanulok Rice Research Center and Kla-Krang Co., Ltd. for providing rice seeds. We are grateful to Kanokporn Kumpai, Sopida Supakiettikul, and Bharerat Kumdaj for their assistance during biochar production and data collection.

Conflicts of Interest

The authors declare no conflict of interest.

References

  1. Hoang, T.; Tran, T.; Nguyen, T.; Williams, B.; Wurm, P.; Bellairs, S.; Mundree, S. Improvement of Salinity Stress Tolerance in Rice: Challenges and Opportunities. Agronomy 2016, 6, 54. [Google Scholar] [CrossRef]
  2. Hafez, E.M.; Alsohim, A.S.; Farig, M.; Omara, A.E.-D.; Rashwan, E.; Kamara, M.M. Synergistic Effect of Biochar and Plant Growth Promoting Rhizobacteria on Alleviation of Water Deficit in Rice Plants under Salt-Affected Soil. Agronomy 2019, 9, 847. [Google Scholar] [CrossRef] [Green Version]
  3. Roy, S.C.; Shil, P. Assessment of Genetic Heritability in Rice Breeding Lines Based on Morphological Traits and Caryopsis Ultrastructure. Sci. Rep. 2020, 10, 7830. [Google Scholar] [CrossRef] [PubMed]
  4. Lv, Y.; Xu, L.; Guo, X.; Liu, J.; Zou, B.; Guo, Y.; Zhang, Y.; Li, H.; Zheng, G.; Guo, Y.; et al. Effect of Biochar on Soil Physiochemical Properties and Bacterial Diversity in Dry Direct-Seeded Rice Paddy Fields. Agronomy 2022, 13, 4. [Google Scholar] [CrossRef]
  5. Singh, R.; Flowers, T.J. The physiology and molecular biology of the effects of salinity on rice. In Handbook of Plant and Crop Stress, 3rd ed.; Pessarakli, M., Ed.; Taylor and Francis: Boca Raton, FL, USA, 2010; pp. 899–939. [Google Scholar]
  6. Faiyue, B.; Al-Azzawi, M.J.; Flowers, T.J. A new screening technique for salinity resistance in rice (Oryza sativa L.) seedlings using bypass flow. Plant Cell Environ. 2012, 35, 1099–1108. [Google Scholar] [CrossRef] [PubMed]
  7. Moradi, F.; Ismail, A.M. Responses of photosynthesis, chlorophyll fluorescence and ROS-scavenging systems to salt stress during seedling and reproductive stages in rice. Ann. Bot. 2007, 99, 1161–1173. [Google Scholar] [CrossRef] [PubMed] [Green Version]
  8. Faiyue, B.; Vijayalakshmi, S.; Nawaz, S.; Nagato, Y.; Taketa, S.; Ichii, M.; Al-Azzawi, M.J.; Flowers, T.J. Studies on sodium bypass flow in lateral rootless mutants lrt1 and lrt2, and crown rootless mutant crl1 of rice (Oryza sativa L.). Plant Cell Environ. 2010, 33, 687–701. [Google Scholar] [PubMed]
  9. Flowers, T.J.; Yeo, A.R. Variability in the Resistance of Sodium Chloride Salinity within Rice (Oryza Sativa L.) Varieties. New Phytol. 1981, 88, 363–373. [Google Scholar] [CrossRef]
  10. Lutts, S.; Kinet, J.M.; Bouharmont, J. Changes in plant response to NaCl during development of rice (Oryza sativa L.) varieties differing in salinity resistance. J. Exp. Bot. 1995, 46, 1843–1852. [Google Scholar] [CrossRef]
  11. Zeng, L.; Shannon, M.C. Salinity Effects on Seedling Growth and Yield Components of Rice. Crop Sci. 2000, 40, 996–1003. [Google Scholar] [CrossRef] [Green Version]
  12. Theerakulpisut, P.; Sumonthip, B.; Kanlaya, K.-N. Genetic diversity, salinity tolerance and physiological responses to NaCl of six rice (Oryza sativa L.) cultivars. Asian J. Plant Sci. 2005, 4, 562–573. [Google Scholar] [CrossRef] [Green Version]
  13. Ologundudu, A.F.; Adelusi, A.A.; Akinwale, R.O. Effect of Salt Stress on Germination and Growth Parameters of Rice (Oryza sativa L.). Not. Sci. Biol. 2014, 6, 237–243. [Google Scholar] [CrossRef]
  14. Cha-um, S.; Kirdmanee, C. Remediation of salt-affected soil by the addition of organic matter—An investigation into improving glutinous rice productivity. Sci. Agric. (Piracicaba Braz.) 2011, 68, 406–410. [Google Scholar] [CrossRef]
  15. Puvanitha, S.; Mahendran, S. Effect of Salinity on Plant Height, Shoot and Root Dry Weight of Selected Rice Cultivars. Sch. J. Agric. Vet. Sci. 2017, 4, 126–131. [Google Scholar] [CrossRef]
  16. Wang, W.; Vinocur, B.; Altman, A. Plant responses to drought, salinity and extreme temperatures: Towards genetic engineering for stress tolerance. Planta 2003, 218, 1–14. [Google Scholar] [CrossRef]
  17. Munns, R.; Tester, M. Mechanisms of salinity tolerance. Annu. Rev. Plant Biol. 2008, 59, 651–681. [Google Scholar] [CrossRef] [Green Version]
  18. Mukhopadhyay, R.; Sarkar, B.; Jat, H.S.; Sharma, P.C.; Bolan, N.S. Soil salinity under climate change: Challenges for sustainable agriculture and food security. J. Environ. Manag. 2021, 280, 111736. [Google Scholar] [CrossRef]
  19. Hussain, S.; Zhang, J.H.; Zhong, C.; Zhu, L.F.; Cao, X.C.; Yu, S.M.; James, A.B.; Hu, J.J.; Jin, Q.Y. Effects of salt stress on rice growth, development characteristics, and the regulating ways: A review. J. Integr. Agric. 2017, 16, 2357–2374. [Google Scholar] [CrossRef] [Green Version]
  20. Litalien, A.; Zeeb, B. Curing the earth: A review of anthropogenic soil salinization and plant-based strategies for sustainable mitigation. Sci. Total Environ. 2020, 698, 134235. [Google Scholar] [CrossRef]
  21. Phuong, N.T.K.; Khoi, C.M.; Linh, T.B.; Minh, D.D.; Duc, T.A.; Sinh, N.V.; Linh, T.T.; Toyota, K. Influence of rice husk biochar and compost amendments on salt contents and hydraulic properties of soil and rice yield in salt-affected fields. Agronomy 2020, 10, 1101. [Google Scholar] [CrossRef]
  22. Wassmann, R.; Hien, N.X.; Hoanh, C.T.; Tuong, T.P. Sea Level Rise Affecting the Vietnamese Mekong Delta: Water Elevation in the Flood Season and Implications for Rice Production. Clim. Chang. 2005, 66, 89–107. [Google Scholar] [CrossRef]
  23. Haque, S.A. Salinity problems and crop production in coastal regions of Bangladesh. Pak. J. Bot. 2006, 38, 1359–1365. [Google Scholar]
  24. Church, J.A.; White, N.J. Sea-Level Rise from the Late 19th to the Early 21st Century. Surv. Geophys. 2011, 32, 585–602. [Google Scholar] [CrossRef] [Green Version]
  25. Erfandi, D.; Rachman, A. Identification of Soil Salinity Due to Seawater Intrusion on Rice Field in the Northern Coast of Indramayu, West Java. J. Trop. Agric. 2011, 16, 115–121. [Google Scholar] [CrossRef]
  26. Phan, L.T.H.; Kamoshita, A. Salinity intrusion reduces grain yield in coastal paddy felds: Case study in two estuaries in the Red River Delta, Vietnam. Paddy Water Environ. 2020, 18, 399–416. [Google Scholar] [CrossRef]
  27. Khai, H.V.; Dang, N.H.; Yabe, M. Impact of salinity intrusion on rice productivity in the Vietnamese Mekong Delta. J. Fac. Agric. Kyushu Univ. 2018, 63, 143–148. [Google Scholar] [CrossRef]
  28. Sembiring, H.; Subekti, N.A.; Erythrina; Nugraha, D.; Priatmojo, B.; Stuart, A.M. Yield Gap Management under Seawater Intrusion Areas of Indonesia to Improve Rice Productivity and Resilience to Climate Change. Agriculture 2020, 10, 1. [Google Scholar] [CrossRef] [Green Version]
  29. Semida, W.M.; Beheiry, H.R.; Sétamou, M.; Simpson, C.R.; EL-Mageed, T.A.A.; Rady, M.M.; Nelson, S.D. Biochar implications for sustainable agriculture and environment: A review. S. Afr. J. Bot. 2019, 2019, 333–347. [Google Scholar] [CrossRef]
  30. Hoque, M.N.; Imran, S.; Hannan, A.; Paul, N.C.; Mahamud, M.A.; Chakrobortty, J.; Sarker, P.; Irin, I.J.; Brestic, M.; Rhaman, M.S. Organic Amendments for Mitigation of Salinity Stress in Plants: A Review. Life 2022, 12, 1632. [Google Scholar] [CrossRef] [PubMed]
  31. Lee, X.; Yang, F.; Xing, Y.; Huang, Y.; Xu, L.; Liu, Z.; Holtzaman, R.; Kan, I.; Li, Y.; Zhang, L.; et al. Use of biochar to manage soil salts and water: Effects and mechanisms. Catena 2022, 211, 106018. [Google Scholar] [CrossRef]
  32. Nguyen, B.T.; Trinh, N.N.; Le, C.M.T.; Nguyen, T.T.; Tran, T.V.; Thai, B.V.; Le, T.V. The interactive effects of biochar and cow manure on rice growth and selected properties of salt-affected soil. Arch. Agron. Soil Sci. 2018, 64, 1744–1758. [Google Scholar] [CrossRef]
  33. Jin, F.; Ran, C.; Aqa Anwari, Q.; Qiu Geng, Y.; Ying Guo, L.; Bo Li, J.; Han, D.; Qin Zhang, X.; Liu, X.; Wen Shao, X. Effects of biochar on sodium ion accumulation, yield and quality of rice in saline-sodic soil of the west of Songnen plain, northeast China. Plant Soil Environ. 2018, 64, 612–618. [Google Scholar] [CrossRef] [Green Version]
  34. Ran, C.; Gulaqa, A.; Zhu, J.; Wang, X.; Zhang, S.; Geng, Y.; Guo, L.; Jin, F.; Shao, X. Benefts of Biochar for Improving Ion Contents, Cell Membrane Permeability, Leaf Water Status and Yield of Rice Under Saline–Sodic Paddy Field Condition. J. Plant Growth Regul. 2020, 39, 370–377. [Google Scholar] [CrossRef]
  35. Huang, J.; Zhu, C.; Kong, Y.; Cao, X.; Zhu, L.; Zhang, Y.; Ning, Y.; Tian, W.; Zhang, H.; Yu, Y.; et al. Biochar Application Alleviated Rice Salt Stress via Modifying Soil Properties and Regulating Soil Bacterial Abundance and Community Structure. Agronomy 2022, 12, 409. [Google Scholar] [CrossRef]
  36. Zhang, J.; Bai, Z.; Huang, J.; Hussain, S.; Zhao, F.; Zhu, C.; Zhu, L.; Cao, X.; Jin, Q. Biochar alleviated the salt stress of induced saline paddy soil and improved the biochemical characteristics of rice seedlings differing in salt tolerance. Soil Tillage Res. 2019, 195, 104372. [Google Scholar] [CrossRef]
  37. Huang, M.; Zhang, Z.; Zhai, Y.; Lu, P.; Zhu, C. Effect of Straw Biochar on Soil Properties and Wheat Production under Saline Water Irrigation. Agronomy 2019, 9, 457. [Google Scholar] [CrossRef] [Green Version]
  38. Huang, M.; Fan, L.; Chen, J.; Jiang, L.; Zou, Y. Continuous applications of biochar to rice: Effects on nitrogen uptake and utilization. Sci. Rep. 2018, 8, 11461. [Google Scholar] [CrossRef] [Green Version]
  39. Chungsangunsit, T.; Gheewala, S.H.; Patumsawad, S. Environmental Assessment of Electricity Production from Rice Husk: A Case Study in Thailand. Int. Energy 2005, 6, 47–54. [Google Scholar]
  40. Pode, R. Potential applications of rice husk ash waste from rice husk biomasspower plant. Renew. Sustain. Energy Rev. 2016, 53, 1468–1485. [Google Scholar] [CrossRef]
  41. Hossain, N.; Nizamuddin, S.; Griffin, G.; Selvakannan, P.; Mubarak, N.M.; Mahlia, T.M.I. Synthesis and characterization of rice husk biochar via hydrothermal carbonization for wastewater treatment and biofuel production. Sci. Rep. 2020, 10, 18851. [Google Scholar] [CrossRef]
  42. Asadi, H.; Ghorbani, M.; Rezaei-Rashti, M.; Abrishamkesh, S.; Amirahmadi, E.; Chengrong, C.; Gorji, M. Application of Rice Husk Biochar for Achieving Sustainable Agriculture and Environment. Rice Sci. 2021, 28, 325–343. [Google Scholar] [CrossRef]
  43. Karam, S.D.; Nagabovanalli, P.; Sundara Rajoo, K.; Fauziah Ishak, C.; Abdu, A.; Rosli, Z.; Melissa Muharam, F.; Zulperi, D. An overview on the preparation of rice husk biochar, factors affecting its properties, and its agriculture application. J. Saudi. Soc. Agric. Sci. 2022, 21, 149–159. [Google Scholar] [CrossRef]
  44. Singh, C.; Tiwari, S.; Gupta, V.K.; Singh, J.S. The effect of rice husk biochar on soil nutrient status, microbial biomass and paddy productivity of nutrient poor agriculture soils. Catena 2018, 171, 485–493. [Google Scholar] [CrossRef]
  45. Sahoo, D.; Remya, N. Influence of operating parameters on the microwave pyrolysis of rice husk: Biochar yield, energy yield, and property of biochar. Biomass Convers. Biorefinery 2022, 12, 3447–3456. [Google Scholar] [CrossRef]
  46. Phetmak, K.; Anusontpornperm, S.; Kheoruenromne, I.; Thanachit, S. Effects of Chicken Manure, Perlite and Rate of Chemical Fertilizer on Virgin Cane Grown in a Coarse-textured Soil. Khon. Kaen. Agr. J. 2019, 47, 1–14. [Google Scholar] [CrossRef]
  47. Staff of U. S. Salinity Laboratory. Determination of the properties of saline and alkali soils. In Diagnosis and Improvement of Saline and Alkali Soils; Richards, L.A., Ed.; U.S. Department of Agriculture: Washington, DC, USA, 1954; pp. 7–33. [Google Scholar]
  48. Jedrum, S.; Thanachit, S.; Anusontpor, S.; Wiriyakitnateekul, W. Soil Amendments Effect on Yield and Quality of Jasmine rice Grown on typic Natraqualfs, Northeaset Thailand. Int. J. Soil Sci. 2014, 9, 37–54. [Google Scholar] [CrossRef] [Green Version]
  49. Malumpong, C.; Buadchee, R.; Thammasamisorn, B.; Moung-ngam, P.; Wasuri, B.; Saensuk, C.; Arikit, S.; Vannavichit, A.; Cheabu, S. Backcross breeding for improvement of heat tolerance at reproductive phase in Thai rice (Oryza sativa L.) varieties. J. Agric. Sci. 2020, 158, 496–510. [Google Scholar] [CrossRef]
  50. Yoshida, S.; Forno, D.; Cock, J.; Gomez, K. Laboratory Manual for Physiological Studies of Rice, 3rd ed.; The International Rice Research Institute: Manila, Philippines, 1976; pp. 61–66. [Google Scholar]
  51. Zhao, S.X.; Ta, N.; Wang, X.D. Effect of Temperature on the Structural and Physicochemical Properties of Biochar with Apple Tree Branches as Feedstock Material. Energies 2017, 10, 1293. [Google Scholar] [CrossRef] [Green Version]
  52. Li, X.; Yao, T.; Huang, X.; Li, X.; Li, P.; Du, S.; Wang, W.; Miao, S.; Wang, D.; Jin, F.; et al. Biochar increases rice yield by improving root morphological and root physiological functions in heavily saline-sodic paddy soil of Northeast China. BioResources 2022, 17, 1241–1256. [Google Scholar] [CrossRef]
  53. Pires, I.; Negrao, S.; Oliveira, M.; Purugganan, M. Comprehensive phenotypic analysis of rice (Oryza sativa) response to salinity stress. Physiol. Plant 2015, 155, 43–45. [Google Scholar] [CrossRef] [PubMed] [Green Version]
  54. Grattan, S.R.; Zeng, L.; Shannon, M.C.; Roberts, S.R. Rice is more sensitive to salinity than previously thought. Calif. Agric. 2002, 56, 189–198. [Google Scholar] [CrossRef] [Green Version]
  55. Fageria, N.K.; Santos, A.B.; Baligar, V.C. Phosphorus Soil Test Calibration for Lowland Rice on an Inceptisol. Agronomy 1997, 89, 737–742. [Google Scholar] [CrossRef]
  56. Ferdose, J.; Kawasaki, M.; Taniguchi, M.; Miyake, H. Differential Sensitivity of Rice Cultivars to Salinity and Its Relation to Ion Accumulation and Root Tip Structure. Plant Prod. Sci. 2009, 12, 453–461. [Google Scholar] [CrossRef]
  57. Thomas, S.C.; Frye, S.; Gale, N.; Garmon, M.; Launchbury, R.; Machado, N.; Melamed, S.; Murray, J.; Petroff, A.; Winsborough, C. Biochar mitigates negative effects of salt additions on two herbaceous plant species. J. Environ. Manag. 2013, 129, 62–68. [Google Scholar] [CrossRef]
  58. Akhtar, S.S.; Andersen, M.N.; Liu, F. Residual effects of biochar on improving growth, physiology and yield of wheat under salt stress. Agric. Water Manag. 2015, 158, 61–68. [Google Scholar] [CrossRef]
  59. Rostamian, R.; Heidarpour, M.; Mousavi, S.; Afyuni, M. Characterization and Sodium Sorption Capacity of Biochar and Activated Carbon Prepared from Rice Husk. J. Agric. Sci. Technol. 2015, 17, 1057–1069. [Google Scholar]
  60. Wei, L.; Huang, Y.; Li, Y.; Huang, L.; Mar, N.N.; Huang, Q.; Liu, Z. Biochar characteristics produced from rice husks and their sorption properties for the acetanilide herbicide metolachlor. Environ. Sci. Pollut. Res. Int. 2017, 24, 4552–4561. [Google Scholar] [CrossRef]
  61. Lehmann, J.; Rilig, M.C.; Thies, J.; Masiello, C.A.; Hockaday, W.C.; Crowley, D. Biochar affects on soil biota—A review. Soil Biol. Biochem. 2011, 43, 1812–1836. [Google Scholar] [CrossRef]
  62. Tomczyk, A.; Sokołowska, Z.; Boguta, P. Biochar physicochemical properties: Pyrolysis temperature and feedstock kind effects. Rev. Environ. Sci. Biotechnol. 2020, 19, 191–215. [Google Scholar] [CrossRef] [Green Version]
  63. Morales, S.G.; Trejo-Téllez, L.I.; Gómez Merino, F.C.; Caldana, C.; Espinosa-Victoria, D.; Herrera Cabrera, B.E. Growth, photosynthetic activity, and potassium and sodium concentration in rice plants under salt stress. Acta Sci. Agron. 2012, 34, 317–324. [Google Scholar] [CrossRef] [Green Version]
  64. Assaha, D.V.M.; Ueda, A.; Saneoka, H.; Al-Yahyai, R.; Yaish, M.W. The Role of Na+ and K+ Transporters in Salt Stress Adaptation in Glycophytes. Front. Physiol. 2017, 8, 509. [Google Scholar] [CrossRef] [PubMed] [Green Version]
  65. Zhang, Y.; Fang, J.; Wu, X.; Dong, L. Na+ /K+ Balance and Transport Regulatory Mechanisms in Weedy and Cultivated Rice (Oryza sativa L.) Under Salt Stress. Plant Biol. 2018, 18, 375. [Google Scholar] [CrossRef] [PubMed] [Green Version]
Figure 1. Survival percentages (A), shoot heights (B), and shoot dry weights (C) of Phitsanulok 2 rice grown in saline soil with saltwater intrusion and different rates of biochar application. Data are means ± SE (n = 3). Bars with different letters are significantly different at p < 0.05 according to DMRT.
Agronomy 13 00815 g001
Figure 2. Shoot Na+ concentrations (A), shoot K+ concentrations (B), and shoot Na+/K+ ratios (C) for Phitsanulok 2 rice grown in saline soil with saltwater intrusion and different rates of biochar application. Data are means ± SE (n = 3). Bars with different letters are significantly different at p < 0.05 according to DMRT.
Agronomy 13 00815 g002
Figure 3. Shoot height (A), shoot dry weight (B), and number of tillers per clump (C) for Phitsanulok 2 rice grown in saline soil with different rates of biochar application in Yoshida solution. Data are means ± SE (n = 3). Bars with different letters are significantly different at p < 0.05 according to DMRT.
Agronomy 13 00815 g003
Figure 4. Na+ concentrations (A), K+ concentrations (B), and Na+/K+ ratios (C) for flag leaves of Phitsanulok 2 rice grown in saline soil with different rates of biochar application in Yoshida solution. Data are means ± SE (n = 3). Bars with different letters are significantly different at p < 0.05 according to DMRT.
Agronomy 13 00815 g004
Figure 5. Transmittance spectrum of rice husk biochar obtained with Fourier-transform infrared (FTIR) spectroscopy.
Agronomy 13 00815 g005
Figure 6. Scanning electron microscopy (SEM) images and X-ray spectroscopy (EDX) spectra of rice husk biochar before (A) and after being added to saline soil (B).
Agronomy 13 00815 g006
Table 1. Yield and yield components of Phitsanulok 2 rice.
TreatmentActive Tillers (%)Panicle Length (cm)Grain Number/Panicle
0% biochar48.0 ± 1.6 b20.4 ± 1.0 c32.5 ± 0.8 b
10% biochar69.0 ± 1.9 ab24.0 ± 0.0 b46.7 ± 6.8 ab
20% biochar67.8 ± 10.4 ab26.3 ± 0.2 b70.0 ± 7.0 ab
30% biochar89.6 ± 8.5 a29.2 ± 0.2 a94.2 ± 18.7 a
TreatmentFilled Grain (%)1000 Grain Weight (g)Grain Weight/Pot (g)
0% biochar3.6 ± 0.6 c18.5 ± 0.4 c0.80 ± 0.4 b
10% biochar29.9 ± 0.2 b20.1 ± 0.1 b1.24 ± 0.7 b
20% biochar46.5 ± 4.0 a23.7 ± 0.3 a7.73 + 2.9 ab
30% biochar42.8 ± 0.1 a23.4 ± 0.7 a12.23 ± 2.9 a
The data values are means ± SE (n = 3). Means in the same column followed by the same letter are not significantly different using DMRT at 0.05%.
Disclaimer/Publisher’s Note: The statements, opinions and data contained in all publications are solely those of the individual author(s) and contributor(s) and not of MDPI and/or the editor(s). MDPI and/or the editor(s) disclaim responsibility for any injury to people or property resulting from any ideas, methods, instructions or products referred to in the content.

