Article

Genetic Diversity of Global Faba Bean Germplasm Resources Based on the 130K TNGS Genotyping Platform

1
Academy of Agriculture and Forestry Sciences, Qinghai University, Xining 810016, China
2
State Key Laboratory of Plateau Ecology and Agriculture, Qinghai University, Xining 810016, China
3
Institute of Crop Sciences, Chinese Academy of Agricultural Sciences, Beijing 100081, China
*
Author to whom correspondence should be addressed.
These authors contributed equally to this work.
Agronomy 2023, 13(3), 811; https://doi.org/10.3390/agronomy13030811
Submission received: 13 February 2023 / Revised: 4 March 2023 / Accepted: 7 March 2023 / Published: 10 March 2023
(This article belongs to the Special Issue Genetics, Genomics and Breeding of Cereals and Grain Legumes)

Abstract

:
Novel germplasm resources are the key to crop breeding, with their genetic diversity and population structure analysis being highly significant for future faba bean breeding. We genotyped 410 global faba bean accessions using the 130K targeted next-generation sequencing (TNGS) genotyping platform, resulting in a total of 38,111 high-quality SNP loci by high-standard filtering. We found the polymorphism information content (PIC) and Nei’s gene diversity were 0.0905–0.3750 and 0.0950–0.5000, with averages of 0.2471 and 0.3035, respectively. After evaluating the genetic diversity of 410 accessions using Nei’s gene diversity and PIC, on the basis of their geographical origin (continent) and structure-analysis-inferred subpopulations, we found that the faba bean accessions from Asia (except China) and Europe had rich genetic diversity, while those from the winter sowing area of China were low. The 410 faba bean accessions were divided into four subpopulations according to population structure analysis and clustering analysis based on Nei’s (1972) genetic distance using the neighbor-joining (NJ) method. However, the same subpopulation contained materials from different geographical origins, thereby indicating that the gene flow or introgression occurred among the accessions. Results from NJ clustering based on shared allele genetic distance indicated that the 410 accessions were divided into three groups according to their dissemination routes. The genetic diversity analysis results demonstrated that the genetic relationships among the faba bean groups with similar ecological environments and geographic origins in neighboring regions or countries were closer and frequently found within the same group, while genetic variation among individuals was the main source of their total genetic variation.

1. Introduction

Faba bean (Vicia faba L.), a cross-pollinated plant with a high natural outcrossing rate of 19–49%, is the only cultivated species of Vicia L. The high outcrossing rate makes the breeding of faba bean varieties highly challenging. The outcrossing rates of faba bean are affected by many biotic and abiotic factors, and bees are considered to be one of the important pollinators. Pierre et al. [1] analyzed the insect vectors affecting the outcrossing rates in faba bean and found that the insect vectors in France consisted mainly of Bombus terrestris L. and Apis mellifera L. in small and scattered distribution; Eucera numida Lep. were predominant in Spain, with a higher frequency of activity and population density. Subsequently, Suso et al. [2] found that the outcrossing rates of faba bean in Spain and France were 65% and 33%, respectively, and the number of insect vectors and feeding activities in Spain were 26 and 32 times higher than those in France, respectively. The results could better explain the reason why the outcrossing rate of faba bean in Spain was much higher than that in France. According to the latest FAO data [3], over 89 countries and regions produce dry faba beans, with a total cultivated area of 266,800 hm2 and a total production of 567,000 tons, of which China accounted for 30.98% and 30.4%, respectively. Faba bean, an important crop for food, vegetables, feed, and green manure, has been cultivated in China for over 2000 years [4]. It is rich in proteins and carbohydrates [5] and can also fix atmospheric nitrogen via rhizobial symbiosis for its utilization and soil nutrition improvement [6,7].
Variety breeding is the key to the development of the seed industry, and germplasm resources can be regarded as the basis for breeding varieties. A comprehensive insight into the genetic diversity of germplasm resources is of great significance for crop genetic improvement. With the development of molecular marker technology, single-nucleotide polymorphism (SNP) has been widely used in the genetic diversity analysis of faba bean due to its numerous genomic loci in the genome, wide distribution, genetic stability, easy genotyping, and high-throughput automated analysis [8,9]. Currently, peas [10], rice beans [11], mungbeans [12,13], chickpeas [14], pigeonpeas [15], lupinus [16], and other legume crops have had their genome completely sequenced, which greatly accelerated their breeding process. The faba bean has 2n = 12 chromosomes with a 13,000 Mb genome size [17]. Its genome sequencing work has not been carried out to date, which limits the pace of its molecular research. The SNP genotyping platform based on liquid-phase probe targeted capture technology is characterized by high throughput and efficiency, high flexibility, and low cost, which is especially advantageous for species with large genomes and has already been successfully applied in major food crops, including barley [18], tomato [19], maize [20], rice [21,22], and wheat [23,24,25].
Link et al. [26] used RAPD markers to analyze the genetic diversity of 13 European small-grain faba bean accessions, six European large-grain accessions, and nine Mediterranean accessions, finding that the genetic diversity of the small-grain accessions was relatively high. Tufan et al. [27] used 25 polymorphic SSR markers to study the genetic variation of 22 faba bean accessions from the ICARDA (International Center for Agricultural Research in the Dry Areas) and Turkey, finding sufficient genetic diversity among the faba bean accessions, which could be directly used in breeding projects. After, Kaur et al. [28] evaluated the genetic diversity of 45 faba bean varieties using 768 SNP markers; they divided these into two main groups, the second of which can be further subdivided into three subgroups. Additionally, El-Esawi et al. [29] assessed the genetic diversity and population structure of the 35 faba bean accessions from three different geographical regions (North Africa, East Africa, and the Near East) using SSR markers, finding that the relationship between faba bean accessions in North and East Africa were closer than that with the Near East accessions. Göl et al. [30] used 32 SSR markers to analyze the population structure diversity and found that the segregation of the faba bean populations was correlated with their geographical origins.
Given the large faba bean genome, the slow pace of the current genomics research, and the limited SNP markers being developed, previous studies on the faba bean genetic diversity either rarely used SNP markers or only used a few SNP markers as exploration attempts. Here, we systematically studied the genetic diversity of 410 global faba bean accessions for the first time using the 130K TNGS genotyping platform developed on the basis of abundant transcriptome data, thereby aiming to not only reveal the genetic diversity differences among the global faba bean germplasm accessions but also provide a theoretical reference for the selection of parents in future faba bean breeding projects. Furthermore, this can also provide a theoretical basis for the next step for the discovery of superior alleles that control the excellent traits of faba bean germplasm resources through association analysis, thus promoting the use of molecular marker-assisted selection technology to breed new faba bean varieties.

2. Materials and Methods

2.1. Plant Materials

The 410 faba bean accessions used in this study were purified for seven generations, and all were derived from the National Crop Gene Bank, Chinese Academy of Agricultural Sciences (https://www.cgris.net/query/croplist.php# accessed on 10 February 2023), with their origins encompassing 5 continents and 31 countries. Among them, 43 and 73 accessions were from the spring sowing and autumn sowing areas of China, involving 7 and 11 provinces (cities and autonomous regions), respectively (Table 1 and Table S1). The experimental materials were planted in October 2021 at the Songming Agricultural Base, Yunnan Academy of Agricultural Sciences (Kunming, China) (25°21′ N, 103°6′ E, 1910.1 m), under regular field management.

2.2. DNA Extraction and SNP Genotyping

Five single plants with good growth were selected for each faba bean accession. When their seedlings grew to 4–5 leaves, young leaves were taken and mixed to extract DNA using the modified CTAB method [31]. PVP and β-mercaptoethanol [32,33] were added to the extraction buffer to prevent the oxidation of phenolic compounds.
SNP genotyping was performed using the 130K TNGS genotyping platform containing 130,514 SNP markers developed by the Institute of Crop Sciences, Chinese Academy of Agricultural Sciences [34]. The parameters were set as a missing rate ≤ 0.2, and the MAF > 0.05 to examine the original SNP genotype data.

2.3. Data Analysis

The PowerMarker v3.25 software was used to calculate the PIC, Nei’s gene diversity, heterozygosity, missing rate, and MAF to evaluate the quality of the SNP markers in our study. We applied TreeBeST software v1.9.2 [35] to calculate Nei’s (1972) genetic distance and constructed a phylogenetic tree on the NJ method to evaluate the genetic relationships among 410 faba bean germplasm resources. In addition, we also selected 3000 polymorphic SNP markers (Table S2) and used PowerMarker software v3.25 to evaluate the genetic relationships between faba bean populations on the basis of geographical origin and distribution routes. The phylogenetic tree based on the shared allele genetic distance was constructed by the NJ method with a bootstrap value of 100. The clustering diagrams were prepared using MEGA v5.2 [36]. We analyzed the population genetic structure of 410 germplasm resources using the Admixture software [37] to infer that an individual belonged to a specific subpopulation, with a length of burn-in period and the number of MCMC Reps after burn-in each set to 10,000 and K values ranging from 1 to 10, with each K value being run 15 times each. The results of the 15 repeated runs at different K values were uploaded to the Structure Harvester online platform [38] (https://taylor0.biology.ucla.edu/structureHarvester/ accessed on 10 December 2022) to determine the optimal number of populations (k). We calculated the Q value, which was defined as the likelihood that the genomic variation of the I material originated from the K group; the higher the Q value, the more likely the material was to be from this subpopulation. This allowed us to assign each piece of material to a particular subpopulation. Q value was a crucial covariate to control false positives in genome-wide association studies at the same time. A total of 125 polymorphic SNP markers were selected (Table S2) for AMOVA using GenALEX 6 software [39] to assess the origin and compositional proportions of genetic variation in faba bean populations on the basis of different classification methods.

3. Results

3.1. The Genetic Diversity Indices of SNP Markers

After filtering the original genotyping data of 410 faba bean accessions, we obtained 38,111 high-quality SNP loci (Table S2), which accounted for 29.20% of the total SNP markers of the 130K TNGS genotyping platform. The ranges of PIC, Nei’s gene diversity, heterozygosity, minor allele frequency (MAF), and missing rate were 0.0905–0.3750, 0.0950–0.5000, 0.000–1.000, 0.0500–0.5000, and 0.0000–0.2000, with averages of 0.2471, 0.3035, 0.2549, 0.2264, and 0.09322, respectively. Overall, the quality of the SNP markers selected in this study was good (Figure S1, Table S3).

3.2. Population Structure Analysis

The Admixture software analyzed the population structure of 410 faba bean accessions. Since the posterior probability value, i.e., lnP (D), increased with the number of populations, we used the maximum likelihood estimation based on ∆K to determine the appropriate number of populations. The results showed that the maximum ∆K value occurred at K = 4 (Figure 1). We calculated the probability Q value of each accession derived from a specific subpopulation. When a faba bean accession had the largest Q value in a subpopulation, the corresponding accession was placed in this subpopulation, resulting in 410 accessions being divided into four subpopulations. Since the faba bean is a frequently cross-pollinated plant with high heterogeneity, accessions with Q ≥ 0.5 were considered to have a relatively homogeneous genetic background, with 99 accessions belonging to a mixed subpopulation, which accounted for 24.15% of the total accessions (Table 2 and Table S4).
According to the composition of Subpop 1, Subpop 4, and mixed Subpop, the foreign accessions accounted for a large proportion in the three subpopulations, with a total of 57, 113, and 99 accessions, respectively. From the composition of Subpop 2 and Subpop 3, the accessions from the winter sowing and spring sowing areas in China accounted for a large proportion, with 74 and 67 accessions, respectively. The data indicates that there was a certain degree of correlation between the subpopulations inferred by population structure analysis and the geographical origin and ecological type of the faba bean accessions. Among them, the spring and winter accessions in China generally showed separation. Including accessions of different geographical origins within the same subpopulation indicated gene flow or introgression among the different accessions.

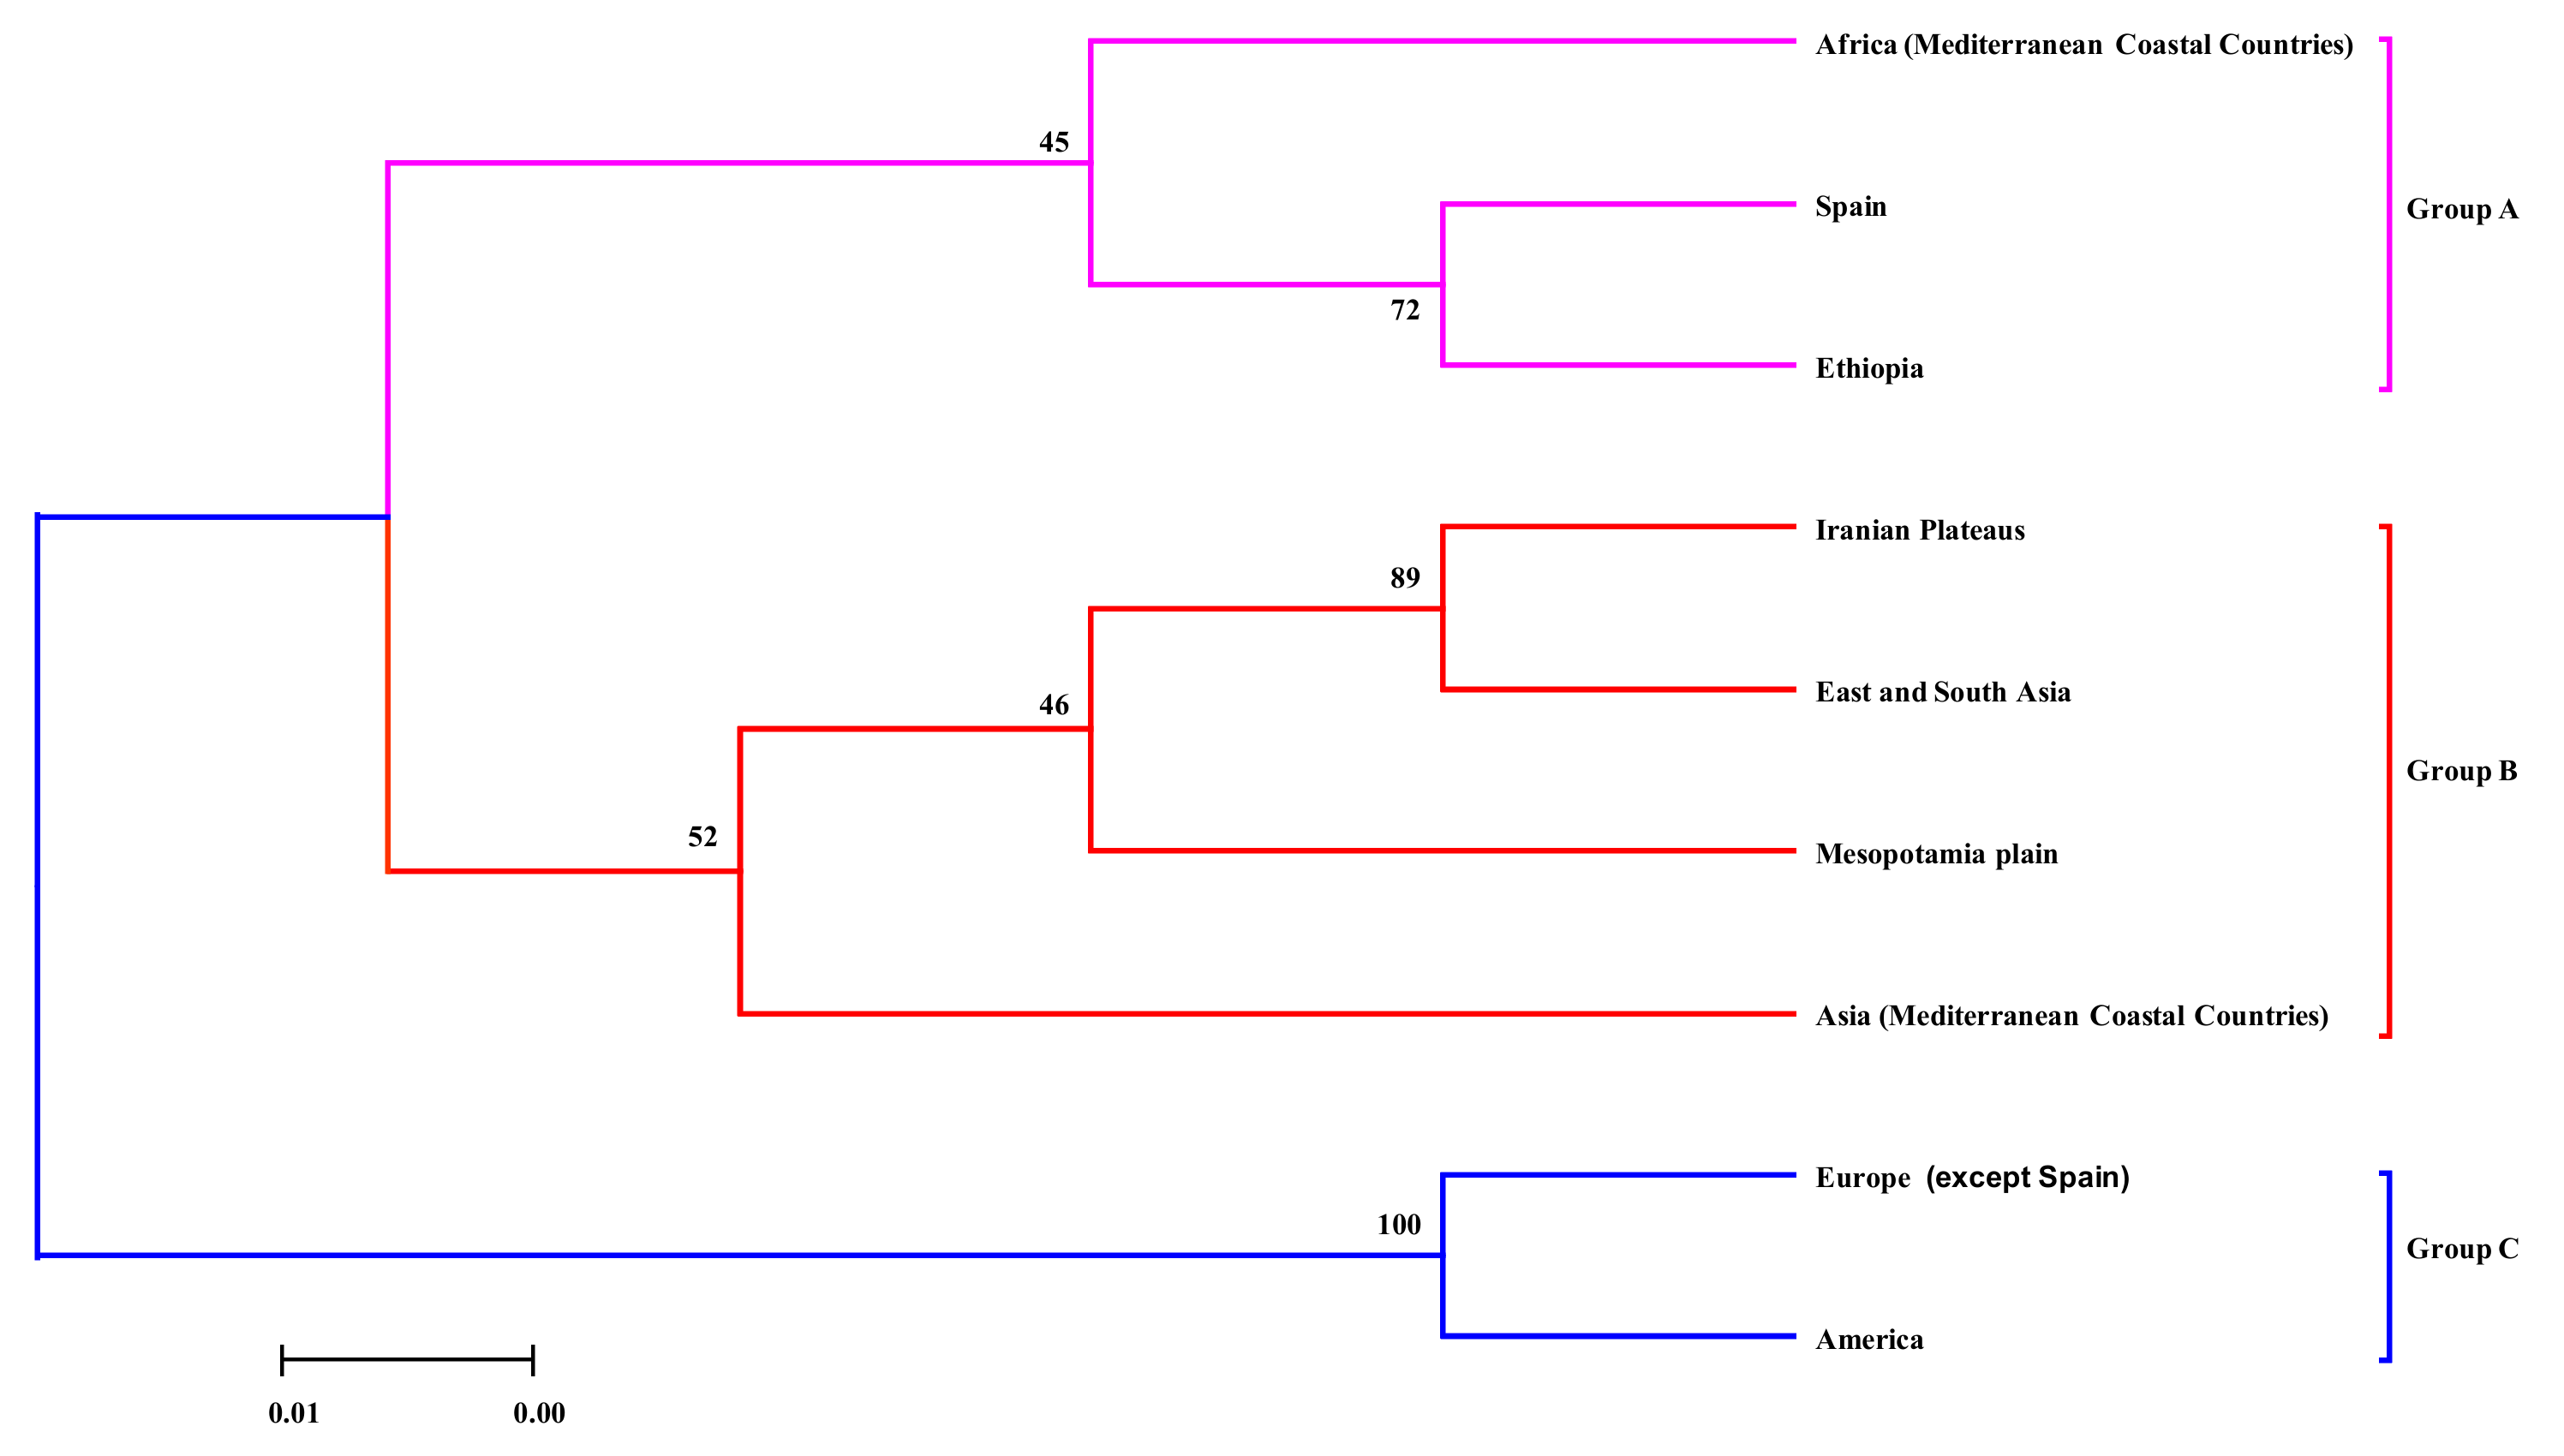
3.3. Clustering Analysis

The cluster analysis results showed that 410 faba bean accessions could also be divided into four groups: groups 1, 2, 3, and 4 (Figure 2, Table 3).
According to the population structure analysis, when a faba bean accession had the highest Q value in a specific subpopulation, it was added to that subpopulation on the basis of the probability Q value of each accession derived from a specific subpopulation. We found that the cluster analysis results based on the NJ method and population structure analysis were the same, with the classification results of faba bean accessions being closely related to their growth habit, geographical origin, and ecological distributions.
We divided the 410 faba bean accessions into nine groups, namely, Africa (Mediterranean coastal countries of Algeria, Egypt, Tunisia, Sudan, and Morocco), Ethiopia, Spain, Asia (Mediterranean coastal countries of Lebanon, Cyprus, Syria, Jordan, and Turkey), East and South Asia (spring sowing area of China, winter sowing area of China, Japan, Nepal, India), Iranian Plateaus (Afghanistan, Iran), Mesopotamia plain (Iraq), Europe (Britain, Holland, France, Bulgaria, Greece, Poland, Hungary, Germany, and Russia), and America (Canada, USA, and Uruguay), on the basis of the possible distribution route and geographical origin of the faba bean. We constructed the phylogenetic tree on the basis of the shared allele genetic distance by the NJ method with a bootstrap value of 100. The results showed that the nine faba bean populations could be divided into three groups. Group A mainly comprised African accessions, namely, Africa (Mediterranean coastal countries), Ethiopia, and Spain; Group B comprised all Asian accessions, namely, East and South Asia, Asia (Mediterranean coastal countries), Iranian Plateaus, and the Mesopotamia plain; Group C comprised Europe and America accessions (Figure 3).
In Group A, Africa (Mediterranean coastal countries) and Spain had the smallest genetic distance (0.1397), followed by Africa (Mediterranean coastal countries) and Ethiopia (0.1690), while Ethiopia and Spain had the largest genetic distance (0.1895).
In Group B, Asia (Mediterranean coastal countries) and the Mesopotamia plain had the smallest genetic distance (0.0941), followed by Asia (Mediterranean coastal countries) and East and South Asia (0.1135), Asia (Mediterranean coastal countries) and Iranian Plateaus (0.1285), East and South Asia and Mesopotamia plain (0.1351), Iranian Plateaus and Mesopotamia plain (0.1432), followed by Iranian Plateaus and East and South Asia, which had the largest genetic distance (0.1514).
In Group C, the smallest genetic distance between Europe (except Spain) and America was 0.0948.
In addition, we found the genetic distances between Africa (Mediterranean coastal countries), Europe (except Spain), and Asia (Mediterranean coastal countries) were 0.0955, 0.0953, and 0.0710, respectively (Table S5).

3.4. Genetic Diversity Analysis of Global Faba Bean Germplasm Resources

According to the geographical origin, we divided all the materials into six groups: (1) the spring sowing area of China, (2) the winter sowing area of China, (3) Asia (except China), (4) Europe, (5) Africa, and (6) America, and calculated the Nei’s gene diversity and PIC. The results showed that the ranges of Nei’s gene diversity and PIC among different populations were 0.4334–0.4721 and 0.3368–0.3603, respectively. The order of Nei’s gene diversity and PIC among the populations was Asia (except China) (0.4721) > Europe (0.4629) > spring sowing area of China (0.4549) > Africa (0.4541) > America (0.4386) > winter sowing area of China (0.4334) and Asia (except China) (0.3603) > Europe (0.3550) > spring sowing area of China (0.3500) > Africa (0.3495) > America (0.3397) > winter sowing area of China (0.3368) (Table 4).
On the basis of the population structure analysis (Q ≥ 0.5), we divided the 410 faba bean resources into four subpopulations and one mixed subpopulation (Table 2 and Table S4) and calculated Nei’s gene diversity and PIC. The results showed that the ranges of Nei’s gene diversity and PIC among different subpopulations were 0.4156–0.4723 and 0.3254–0.3604, respectively. The order of Nei’s gene diversity and PIC among subpopulations was as follows: Mixed subpop (0.4723) > Subpop 1 (0.4467) > Subpop 3 (0.4439) > Subpop 4 (0.4426) > Subpop 2 (0.4156) and Mixed subpop (0.3604) > Subpop 1 (0.3450) > Subpop 3 (0.3433) > Subpop 4 (0.3426) > Subpop 2 (0.3254). The above results were consistent with those obtained from the analysis according to their geographical locations. According to the population structure classification, the Mixed subpop was mainly Asian (except China) and European resources, with Subpop 2 mainly comprising Chinese winter sowing resources, thus causing the Nei’s genetic diversity and PIC to be the highest and lowest, respectively (Table 5).
According to different classification criteria, the changes in Nei’s gene diversity and PIC among populations were the same. Therefore, the combination of Nei’s gene diversity and PIC could comprehensively and accurately measure the genetic diversity among germplasm resources. In general, the genetic diversity of Asian (except China) and European faba bean accessions were higher. However, that from the winter sowing area of China was lower, with the genetic structure being relatively simple.

3.5. Analysis of Molecular Variance

Analysis of molecular variance (AMOVA) was performed using GenAlEx 6.41 to calculate genetic variation between and within populations on the basis of different classification methods.
According to their geographical origin, we divided all the accessions into six populations: (1) the spring sowing area of China, (2) the winter sowing area of China, (3) Asia (except China), (4) Europe, (5) Africa, and (6) America, and calculated the genetic variation between and within the populations. On the basis of the population structure analysis results, we divided the germplasm resource into a specific subpopulation when its Q value was the largest. We performed ANOVA of the four subpopulations inferred by population structure analysis. The results based on two classification methods also showed that the genetic variation among populations (subpopulations) also accounted for only 1% of the total variation, while those within populations (subpopulations) accounted for the remaining 99% (Table 6 and Table 7). Within populations (subpopulations), this was due to numerous materials from different geographical areas, wide distribution, and complex genetic backgrounds. This resulted in less genetic variation among subpopulations and genetic variation among individuals becoming the main source of total genetic variation.

4. Discussion

4.1. On the Faba Bean SNP Genotyping Platform

Faba bean is the third most important cool season legume crop globally, with a grain protein content of 20.3–41%, making it an important plant protein source second only to soybean among legume crops. It is an important legume crop in China and ranks first globally in terms of planting area and production. However, due to its huge genome (≈13,000 Mb), no genome draft has been published yet internationally, with the lack of efficient and reliable genotyping tools also seriously limiting its molecular breeding research. Currently, genotyping based on a target capture strategy has provided an efficient and low-cost genotyping tool for obtaining polymorphic variants in specific genomic regions. Compared with traditional molecular marker technology, it has the advantages of wide adaptability, flexibility, and high efficiency, being widely used in molecular genetics and molecular breeding. SNP chips have been used with success in several crops; for example, Si et al. [40] developed a liquid SNP chip named “ZJU CottonSNP40K” containing 40,071 core SNPs evenly distributed on 26 chromosomes through genotyping via target sequencing, which was validated using 13 cotton accessions with high genotyping efficiency and accuracy. Furthermore, Liu et al. [41] developed the GenoBaits Soy40K array, which included 81,717 background panel regions and 6897 foreground polymorphisms of 49 previously reported functional genes. Its good performance was demonstrated by analyzing 2078 soybean accessions for genetic diversity and population structure analysis. Guo et al. [20] developed a series of liquid phase chips, such as 1 K, 5 K, 10 K, and 20 K, using GBTS (Genotyping by Targeted Sequencing) technology. The high reproducibility and reliability of the microarray assays were confirmed by 96 self-crossed maize lines obtained globally and 387 intermediate materials generated from breeding programs.
The world’s first high-throughput, high-efficiency, high-precision, and low-cost 130K TNGS genotyping platform, including 130,514 polymorphic SNP markers generated from RNA-seq, was developed by the cool season legume crop team of the Institute of Crop Sciences, Chinese Academy of Agricultural Sciences, Beijing, China. In this study, 410 faba bean accessions were scanned using this 130K TNGS genotyping platform, with 38,111 high-quality SNP loci being obtained after rigorous filtering, of which the average of PIC, Nei’s gene diversity, heterozygosity, missing rate, and MAF were 0.2471, 0.3035, 0.2549, 0.2264, and 0.09322, respectively. Overall, the quality of the selected SNP markers in this study was good. Therefore, we confirmed that the faba bean 130K TNGS genotyping platform can indeed provide a valuable tool for gene mapping, population genetic analysis, and germplasm resource evaluation, which could not only accelerate the research progress on faba bean genetics and molecular breeding but also provide new ideas and directions for conducting efficient and low-cost genotyping platforms for other species without reference genomes.

4.2. On Genetic Diversity Studies of the Faba Bean Genetic Resources

Earlier, Terzopoulos et al. [42] analyzed the genetic diversity of Mediterranean faba bean accessions using ISSR markers. The cluster analysis and principal coordinate analysis both separated the small-grain population from the Mediterranean population, with the Mediterranean population being further subdivided into two subgroups. Additionally, AMOVA results indicated relatively high genetic variation within the faba bean populations. Zong et al. [43] analyzed 39 foreign winter-sown resources, 201 Chinese winter-sown resources, and 3 spring-sown resources using 10 AFLP markers. Their study results showed that there were significant differences in the genetic relationship between China and foreign resources, spring sowing type, and winter sowing type accessions in China. Subsequently, Zong et al. [44] further analyzed the genetic diversity of 39 Chinese spring sowing type resources, 136 foreign spring sowing type resources, and 41 breeding materials from ICARDA using 12 AFLP markers, finding that there were significant differences in the geographic distribution of spring sowing type resources, thereby indicating that this type of resources had high genetic diversity, and there were significant differences between China and foreign resources. However, the genetic diversity of the ICARDA breeding materials was relatively low. Gong et al. [45] used 11 pairs of EST-SSR markers to analyze the genetic diversity of 29 Chinese and foreign faba bean varieties. The cluster analysis and principal component analysis divided the materials into different groups, with the genetic background of Chinese faba bean varieties being narrow. Wang et al. [46] used 11 ISSR markers to analyze 802 global faba bean accessions and found that there were significant differences between the spring sowing and winter sowing resources in China, with the Chinese and foreign resources showing significant genetic differences.
In this study, we analyzed the genetic diversity of 410 global faba bean accessions on the basis of the 130K TNGS genotyping platform and divided them into four groups or subpopulations using population structure and cluster analysis, with the classification results being more closely related to their respective geographical origins and ecological environment. Chinese spring sowing and winter sowing faba bean resources were separated from each other, with a certain degree of separation between China and foreign resources, which was similar to the results of Zong et al. [43,44]. AMOVA results showed that the genetic variation among individual materials within the groups or subpopulations was the main source of the total genetic variation, which was consistent with a previous study [42]. According to the possible distribution route and geographical origin of the faba bean, the cluster analysis results showed that 410 faba bean accessions were divided into three groups. In general, the genetic relationship between faba bean groups with similar ecological environments, similar latitudes and longitudes, and geographical origin was relatively close and was often divided into the same group or subgroup.

4.3. On the Origin and Distribution of Faba Bean

Currently, there is no unified conclusion on the origin of the faba bean. Ladizinsky [47] believed that the center of Central Asia was the original origin of the faba bean, with the Mediterranean coast and Ethiopia being the secondary origin of the large-grained faba bean. Another study suggests that the faba bean may have originated in central and western Asia, with Afghanistan and Ethiopia being the secondary origins [48]. Cubero [49] speculated that the faba bean originated in the Near East and then spread in four directions: (1) northward from the Mediterranean region to Europe; (2) along the North African coast to Spain; (3) along the Nile River to Ethiopia; (4) spread from the Mesopotamian plain to India, and then to China. Zeid et al. [50] analyzed the genetic diversity of faba bean accessions from Asia, Europe, and North Africa using AFLP markers. The results showed that the genetic diversity of faba bean accessions in the Middle East was rich, which indicated that faba bean was transmitted from North Africa to the central and northwest of Europe, with the faba bean accessions in North Africa and Europe being closely related.
The following conclusions were drawn from this study. The faba bean accessions from Africa (Mediterranean coastal countries) were less genetically distant from those of Spain and Ethiopia, with both belonging to Group A. This confirmed at the molecular level that the distribution route of the faba bean was along the North African coast to Spain and along the Nile River to Ethiopia. The genetic distance between Europe (except Spain) and the Mediterranean countries of Asia and Africa was small, which was consistent with the northward spread of the faba bean from the Mediterranean regions to Europe. The genetic distance between faba bean accessions in the Mesopotamian plain and those from East and South Asia (Including China, Japan, Nepal, and India) was relatively small and therefore belonged to Group B, which was consistent with the spread of faba bean from Mesopotamia plain to India and then China.

5. Conclusions

This study conducted a more comprehensive genetic diversity analysis of 410 global faba bean accessions using the 130K TNGS genotyping platform for the first time. We found that the genetic relationship between the faba bean accessions with similar ecological environments and geographical origins was close, with them often being divided into the same group or subgroup. It was noteworthy that there was gene flow or introgression among the different accessions within the same subpopulation. It suggests that while considering excellent agronomic traits when breeding elite varieties, the genetic relationship between parents is an essential factor that should not be ignored. Moreover, we also corroborated the faba bean distribution route at the molecular level. Therefore, the related results lay a foundation for the rational selection of parents, association analysis, and molecular marker-assisted selection breeding in the faba bean, which will further accelerate their future molecular breeding process.

Supplementary Materials

The following supporting information can be downloaded at https://www.mdpi.com/article/10.3390/agronomy13030811/s1, Figure S1: The genetic diversity indices of 38,111 SNP markers based on 410 faba bean accessions. (a) The Nei’s gene diversity; (b) the polymorphism information content (PIC); (c) the heterozygosity; (d) the minor allele frequency (MAF); (e) the missing rate. Table S1: List of 410 faba bean accessions used in this study. Table S2: The SNP genotyping of 410 faba bean accessions with high-standard filtering in this study. Table S3: The details of genetic diversity indices of 38,111 SNP markers based on 410 faba bean accessions. Table S4: The Q values and subpopulations inferred by population structure analysis. Table S5: Nei’s genetic distance of nine faba bean groups based on dissemination route and geographical origin by 3000 SNP markers.

Author Contributions

Conceptualization, Y.L., D.D. and X.Z.; formal analysis, H.Z., C.T., W.H. and P.L.; writing—original draft preparation, H.Z. and Y.L.; writing—review and editing, Y.L., D.D. and X.Z. All authors have read and agreed to the published version of the manuscript.

Funding

This research was funded by China Agriculture Research System of MOF and MARA—Food Legumes (CARS-08) and Laboratory for Research and Utilization of Qinghai Tibet Plateau Germplasm Resources (2022-ZJ-Y01).

Data Availability Statement

Not applicable.

Acknowledgments

We thank China Agriculture Research System of MOF and MARA—Food Legumes (CARS-08), and Laboratory for Research and Utilization of Qinghai Tibet Plateau Germplasm Resources (2022-ZJ-Y01). The authors would like to express their gratitude to EditSprings (https://www.editsprings.cn accessed on 29 December 2022) for the expert linguistic services provided.

Conflicts of Interest

The authors declare no conflict of interest.

References

  1. Pierre, J.; Suso, M.J.; Moreno, M.T.; Eanault, R.; Le Guen, J. Diversity and efficiency of the pollinating entomofauna (Hymenoptera: Apidae) of faba bean (Vicia faba L.) in two locations in France and Spain. Ann. De La Société Entomol. De Fr. 1999, 35, 312–318. [Google Scholar]
  2. Suso, M.J.; Pierre, J.; Moreno, M.T.; Eanault, R.; Le Guen, J. Variation in outcrossing levels in faba bean cultivars: Role of ecological factors. J. Agric. Sci. 2001, 136, 399–405. [Google Scholar] [CrossRef]
  3. FAOSTAT. Data from: FAOSTAT Databases, Food and Agriculture Organization. 2020. Available online: https://www.fao.org/faostat/en/#data/TCL (accessed on 3 November 2022).
  4. Ma, Y.; Bao, S.Y.; Yang, T.; Hu, J.G.; Guan, J.P.; He, Y.H.; Wang, X.J.; Wan, Y.L.; Sun, X.L.; Jiang, J.Y.; et al. Genetic linkage map of Chinese native variety faba bean (Vicia faba L.) based on simple sequence repeat markers. Plant Breed. 2013, 132, 397–400. [Google Scholar] [CrossRef]
  5. Duc, G. Faba bean (Vicia faba L.). Field Crop. Res. 1997, 53, 99–109. [Google Scholar] [CrossRef]
  6. Yin, J.; Sui, Z.M.; Li, Y.; Yang, H.J.; Yuan, L.; Huang, J.G. A new function of white-rot fungi Ceriporia lacerata HG2011: Improvement of biological nitrogen fixation of broad bean (Vicia faba). Microbiol. Res. 2022, 256, 126939. [Google Scholar] [CrossRef]
  7. Ingraffia, R.; Amato, G.; Frenda, A.S.; Giambalvo, D. Impacts of arbuscular mycorrhizal fungi on nutrient uptake, N2 fixation, N transfer, and growth in a wheat/faba bean intercropping system. PLoS ONE 2019, 14, e0213672. [Google Scholar] [CrossRef]
  8. Kaur, S.; Cogan, N.; Forster, J.; Paull, J. Assessment of genetic diversity in faba bean based on single nucleotide polymorphism. Diversity 2014, 6, 88–101. [Google Scholar] [CrossRef] [Green Version]
  9. Mulugeta, B.; Tesfaye, K.; Keneni, G.; Ahmed, S. Genetic diversity in spring faba bean (Vicia faba L.) genotypes as revealed by high-throughput KASP SNP markers. Genet. Resour. Crop Evol. 2021, 68, 1971–1986. [Google Scholar] [CrossRef]
  10. Yang, T.; Liu, R.; Luo, Y.F.; Hu, S.N.; Wang, D.; Wang, C.Y.; Pandey, M.K.; Ge, S.; Xu, Q.L.; Li, N.N.; et al. Improved pea reference genome and pan-genome highlight genomic features and evolutionary characteristics. Nat. Genet. 2022, 54, 1553–1563. [Google Scholar] [CrossRef]
  11. Guan, J.T.; Zhang, J.T.; Gong, D.; Zhang, Z.Q.; Yu, Y.; Luo, G.L.; Somta, P.; Hu, Z.; Wang, S.H.; Yuan, X.X.; et al. Genomic analyses of rice bean landraces reveal adaptation and yield related loci to accelerate breeding. Nat. Commun. 2022, 13, 5707–5722. [Google Scholar] [CrossRef]
  12. Kang, Y.J.; Kim, S.K.; Kim, M.Y.; Lestari, P.; Kim, K.H.; Ha, B.K.; Jun, T.H.; Hwang, W.J.; Lee, T.; Lee, J.; et al. Genome sequence of mungbean and insights into evolution within Vigna species. Nat. Commun. 2014, 5, 5443–5451. [Google Scholar] [CrossRef] [Green Version]
  13. Liu, C.Y.; Wang, Y.; Peng, J.X.; Fan, B.J.; Xu, D.X.; Wu, J.; Cao, Z.M.; Gao, Y.Q.; Wang, X.Q.; Li, S.T.; et al. High-quality genome assembly and pan-genome studies facilitate genetic discovery in mung bean and its improvement. Plant Comm. 2022, 3, 100352–100367. [Google Scholar] [CrossRef]
  14. Varshney, R.K.; Song, C.; Saxena, R.K.; Azam, S.; Yu, S.; Sharpe, A.G.; Cannon, S.; Baek, J.M.; Rosen, B.D.; Tar’an, B.; et al. Draft genome sequence of chickpea (Cicer arietinum) provides a resource for trait improvement. Nat. Biotechnol. 2013, 31, 240–246. [Google Scholar] [CrossRef] [Green Version]
  15. Varshney, R.K.; Chen, W.B.; Li, Y.P.; Bharti, A.K.; Saxena, R.K.; Schlueter, J.A.; Donoghue, M.T.A.; Azam, S.; Fan, G.Y.; Whaley, A.M.; et al. Draft genome sequence of pigeonpea (Cajanus cajan), an orphan legume crop of resource-poor farmers. Nat. Biotechnol. 2011, 30, 83–89. [Google Scholar] [CrossRef] [Green Version]
  16. Garg, G.; Kamphuis, L.G.; Bayer, P.E.; Kaur, P.; Dudchenko, O.; Taylor, C.M.; Frick, K.M.; Foley, R.C.; Gao, L.L.; Aiden, E.L.; et al. A pan-genome and chromosome-length reference genome of narrow-leafed lupin (Lupinus angustifolius) reveals genomic diversity and insights into key industry and biological traits. Plant J. 2022, 111, 1252–1266. [Google Scholar] [CrossRef]
  17. Johnston, J.S.; Bennett, M.D.; Rayburn, A.L.; Galbraith, D.W.; Price, H.J. Reference standards for determination of DNA content of plant nuclei. Am. J. Bot. 1999, 86, 609–613. [Google Scholar] [CrossRef]
  18. Hill, C.B.; Wong, D.; Tibbits, J.; Forrest, K.; Hayden, M.; Zhang, X.Q.; Westcott, S.; Angessa, T.T.; Li, C.D. Targeted enrichment by solution-based hybrid capture to identify genetic sequence variants in barley. Sci. Data 2019, 6, 12–19. [Google Scholar] [CrossRef] [Green Version]
  19. Terracciano, I.; Cantarella, C.; Fasano, C.; Cardi, T.; Mennella, G.; D’Agostino, N. Liquid-phase sequence capture and targeted re-sequencing revealed novel polymorphisms in tomato genes belonging to the MEP carotenoid pathway. Sci. Rep. 2017, 7, 5616–5628. [Google Scholar] [CrossRef] [Green Version]
  20. Guo, Z.F.; Wang, H.W.; Tao, J.J.; Ren, Y.H.; Xu, C.; Wu, K.S.; Zou, C.; Zhang, J.N.; Xu, Y.B. Development of multiple SNP marker panels affordable to breeders through genotyping by target sequencing (GBTS) in maize. Mol. Breed. 2019, 39, 37–48. [Google Scholar] [CrossRef]
  21. Hussain, I.; Ali, S.; Liu, W.G.; Awais, M.; Li, J.H.; Liao, Y.L.; Zhu, M.S.; Fu, C.Y.; Liu, D.L.; Wang, F. Identification of heterotic groups and patterns based on genotypic and phenotypic characteristics among rice accessions of diverse origins. Front. Genet. 2022, 13, 811124. [Google Scholar] [CrossRef]
  22. Li, X.W.; Zheng, H.L.; Wu, W.S.; Liu, H.L.; Wang, J.G.; Jia, Y.; Li, J.M.; Yang, L.M.; Lei, L.; Zou, D.T.; et al. QTL mapping and candidate gene analysis for alkali tolerance in Japonica rice at the bud stage based on linkage mapping and genome-wide association study. Rice 2020, 13, 48–58. [Google Scholar] [CrossRef] [PubMed]
  23. Huang, S.; Zhang, Y.B.; Ren, H.; Li, X.; Zhang, X.; Zhang, Z.Y.; Zhang, C.L.; Liu, S.J.; Wang, X.T.; Zeng, Q.D.; et al. Epistatic interaction effect between chromosome 1BL (Yr29) and a novel locus on 2AL facilitating resistance to stripe rust in Chinese wheat Changwu 357-9. Theor. Appl. Genet. 2022, 135, 2501–2513. [Google Scholar] [CrossRef] [PubMed]
  24. Zheng, X.W.; Qiao, L.; Liu, Y.; Wei, N.C.; Zhao, J.J.; Wu, B.B.; Yang, B.; Wang, J.L.; Zheng, J. Genome-wide association study of grain number in common wheat from Shanxi under different water regimes. Front. Plant Sci. 2022, 12, 806295. [Google Scholar] [CrossRef] [PubMed]
  25. Qiao, L.; Li, H.L.; Wang, J.; Zhao, J.J.; Zheng, X.W.; Wu, B.B.; Du, W.J.; Wang, J.L.; Zheng, J. Analysis of genetic regions related to field grain number per spike from Chinese wheat founder parent Linfen 5064. Front. Plant Sci. 2022, 12, 808136. [Google Scholar] [CrossRef] [PubMed]
  26. Link, W.; Dixkens, C.; Singh, M.; Schwall, M.; Melchinger, A.E. Genetic diversity in European and Mediterranean faba bean germplasm revealed by RAPD markers. Theor. Appl. Genet. 1995, 90, 27–32. [Google Scholar] [CrossRef]
  27. Tufan, H.; Erdoğan, C. Genetic diversity in some faba bean (Vicia faba L.) genotypes assessed by simple sequence repeats. Biotechnol. Biotechnol. Equip. 2016, 31, 29–35. [Google Scholar] [CrossRef] [Green Version]
  28. Kaur, S.; Kimber, R.B.E.; Cogan, N.O.I.; Materne, M.; Forster, J.W.; Paull, J.G. SNP discovery and high-density genetic mapping in faba bean (Vicia faba L.) permits identification of QTLs for ascochyta blight resistance. Plant Sci. 2014, 217–218, 47–55. [Google Scholar] [CrossRef]
  29. El-Esawi, M.A. SSR analysis of genetic diversity and structure of the germplasm of faba bean (Vicia faba L.). Comptes Rendus Biol. 2017, 340, 474–480. [Google Scholar] [CrossRef]
  30. Göl, Ş.; Doğanlar, S.; Frary, A. Relationship between geographical origin, seed size and genetic diversity in faba bean (Vicia faba L.) as revealed by SSR markers. Mol. Genet. Genom. 2017, 292, 991–999. [Google Scholar] [CrossRef]
  31. Yang, T.; Jiang, J.Y.; Zhang, H.Y.; Liu, R.; Strelkov, S.; Hwang, S.; Chang, K.F.; Yang, F.; Miao, Y.M.; He, Y.H.; et al. Density Enhancement of a Faba Bean Genetic Linkage Map (Vicia Faba) Based on Simple Sequence Repeats Markers. Plant Breed. 2019, 138, 207–215. [Google Scholar] [CrossRef]
  32. Sokol, E.; Nijenhuis, M.; Sjollema, K.A.; Jonkman, M.F.; Pas, H.H.; Giepmans, B.N. Particle bombardment of ex vivo skin to deliver DNA and express proteins. In Inflammation: Methods and Protocols; Clausen, B.E., Laman, J.D., Eds.; Humana Press: New York, NY, USA, 2017; pp. 107–118. [Google Scholar] [CrossRef]
  33. Gentile, F.; Arcaro, A.; Pizzimenti, S.; Daga, M.; Cetrangolo, G.P.; Dianzani, C.; Lepore, A.; Graf, M.; Ames, P.R.J.; Barrera, G. DNA damage by lipid peroxidation products: Implications in cancer, inflammation and autoimmunity. AIMS Genet. 2017, 04, 103–137. [Google Scholar] [CrossRef]
  34. Wang, C.Y.; Liu, R.; Liu, Y.J.; Hou, W.W.; Wang, X.J.; Miao, Y.M.; He, Y.H.; Ma, Y.; Li, G.; Wang, D.; et al. Development and application of the Faba_bean_130K targeted next-generation sequencing SNP genotyping platform based on transcriptome sequencing. Theor. Appl. Genet. 2021, 134, 3195–3207. [Google Scholar] [CrossRef]
  35. Deng, Y.Q.; Xu, H.D.; Su, Y.L.; Liu, S.L.; Xu, L.W.; Guo, Z.X.; Wu, J.J.; Cheng, C.H.; Feng, J. Horizontal gene transfer contributes to virulence and antibiotic resistance of Vibrio harveyi 345 based on complete genome sequence analysis. BMC Genom. 2019, 20, 761–779. [Google Scholar] [CrossRef] [Green Version]
  36. Tamura, K.; Peterson, D.; Peterson, N.; Stecher, G.; Nei, M.; Kumar, S. MEGA5: Molecular evolutionary genetics analysis using maximum likelihood, evolutionary distance, and maximum parsimony methods. Mol. Biol. Evol. 2011, 28, 2731–2739. [Google Scholar] [CrossRef] [Green Version]
  37. Alexander, D.H.; Novembre, J.; Lange, K. Fast model-based estimation of ancestry in unrelated individuals. Genome Res. 2009, 19, 1655–1664. [Google Scholar] [CrossRef] [Green Version]
  38. Zhu, C.S.; Gore, M.; Buckler, E.S.; Yu, J.M. Status and prospects of association mapping in plants. Plant Genome 2008, 1, 5–20. [Google Scholar] [CrossRef]
  39. Peakall, R.O.D.; Smouse, P.E. GENALEX 6: Genetic analysis in Excel. Population genetic software for teaching and research. Mol. Ecol. Notes 2006, 6, 288–295. [Google Scholar] [CrossRef]
  40. Si, Z.F.; Jin, S.K.; Li, J.Y.; Han, Z.G.; Li, Y.Q.; Wu, X.N.; Ge, Y.X.; Fang, L.; Zhang, T.Z.; Hu, Y. The design, validation, and utility of the “ZJU CottonSNP40K” liquid chip through genotyping by target sequencing. Ind. Crop. Prod. 2022, 188, 115629. [Google Scholar] [CrossRef]
  41. Liu, Y.C.; Liu, S.L.; Zhang, Z.F.; Ni, L.B.; Chen, X.M.; Ge, Y.X.; Zhou, G.A.; Tian, Z.X. GenoBaits Soy40K: A highly flexible and low-cost SNP array for soybean studies. Sci. China Life Sci. 2022, 65, 1898–1901. [Google Scholar] [CrossRef]
  42. Terzopoulos, P.J.; Bebeli, P.J. Genetic diversity analysis of Mediterranean faba bean (Vicia faba L.) with ISSR markers. Field Crop. Res. 2008, 108, 39–44. [Google Scholar] [CrossRef]
  43. Zong, X.X.; Liu, X.J.; Guan, J.P.; Wang, S.M.; Liu, Q.C.; Paull, J.G.; Redden, R. Molecular variation among Chinese and global winter faba bean germplasm. Theor. Appl. Genet. 2009, 118, 971–978. [Google Scholar] [CrossRef] [PubMed]
  44. Zong, X.X.; Ren, J.Y.; Guan, J.P.; Wang, S.M.; Liu, Q.C.; Paull, J.G.; Redden, R. Molecular variation among Chinese and global germplasm in spring faba bean areas. Plant Breed. 2009, 129, 508–513. [Google Scholar] [CrossRef]
  45. Gong, Y.M.; Xu, S.C.; Mao, W.H.; Li, Z.Y.; Hu, Q.Z.; Zhang, G.W.; Ding, J. Genetic diversity analysis of faba bean (Vicia faba L.) based on EST-SSR markers. Agric. Sci. China 2011, 10, 838–844. [Google Scholar] [CrossRef]
  46. Wang, H.F.; Zong, X.X.; Guan, J.P.; Yang, T.; Sun, X.L.; Ma, Y.; Redden, R. Genetic diversity and relationship of global faba bean (Vicia faba L.) germplasm revealed by ISSR markers. Theor. Appl. Genet. 2011, 124, 789–797. [Google Scholar] [CrossRef]
  47. Ladizinsky, G. On the origin of the broad bean, Vicia faba L. Isr. J. Bot. 1975, 24, 80–88. [Google Scholar]
  48. Zheng, Z.J. Food Legumes in China; Chinese Agricultural Press: Beijing, China, 1997; ISBN 7-109-04257-X. [Google Scholar]
  49. Cubero, J.I. On the evolution of Vicia faba L. Theor. Appl. Genet. 1974, 45, 47–51. [Google Scholar] [CrossRef]
  50. Zeid, M.; Schön, C.C.; Link, W. Genetic diversity in recent elite faba bean lines using AFLP markers. Theor. Appl. Genet. 2003, 107, 1304–1314. [Google Scholar] [CrossRef]
Figure 1. Population genetic analysis of 410 faba bean accessions: (A) the K-value changing with ΔK indicates that the 410 faba bean accessions can be divided into four subpopulations; (B) the population structure of the 410 faba bean accessions.
Agronomy 13 00811 g001
Figure 2. Cluster analysis of 410 faba bean accessions based on the NJ method.
Agronomy 13 00811 g002
Figure 3. Clusters of 410 faba bean accessions based on distribution route and geographical origin by 3000 SNP markers.
Agronomy 13 00811 g003
Table 1. Geographic origins of 410 faba bean accessions.
Origin (Continent)Origin (Country or Province) and No. of Accessions
AfricaAlgeria (5), Egypt (7), Tunisia (5), Sudan (6), Morocco (2), Ethiopia (7)
North AmericaCanada (24), USA (1)
South AmericaUruguay (1)
EuropeRussia (7), Poland (1), Hungary (2), Bulgaria (1), Spain (12), Greece (1), Britain (29), Holland (9), France (12), Germany (39)
Asia (except China)Japan (3), Nepal (1), India (1), Afghanistan (17), Iran (2), Lebanon (9), Cyprus (1), Syria (46), Iraq (20), Jordan (3), Turkey (20)
Asia (spring sowing area of China)Gansu (16), Hebei (1), Inner Mongolia (6), Ningxia (4), Qinghai (8), Shanxi (4), Xinjiang (4)
Asia (winter sowing area of China)Anhui (3), Guangxi (3), Guizhou (8), Hubei (5), Hunan (4), Jiangsu (11), Jiangxi (3), Sichuan (12), Yunnan (11), Zhejiang (9), Chongqing (4)
Table 2. The compositions of subpopulation calculated by population structure analysis of 410 faba bean accessions based on 38,111 SNP markers (Q ≥ 0.5).
PopulationsAccession No.Origin (Country or Province) and No. of Accessions
Subpop 157Africa (4), Asia (except China) (24), Europe (17),
spring sowing area of China (8), winter sowing area of China (4)
Subpop 274Africa (3), Asia (except China) (12), Europe (4),
spring sowing area of China (4), winter sowing area of China (51)
Subpop 367Asia (except China) (17), Europe (15), America (5),
spring sowing area of China (24), winter sowing area of China (6)
Subpop 4113Africa (15), Asia (except China) (28), Europe (50), America (15),
spring sowing area of China (2), winter sowing area of China (3)
Mixed subpop99Africa (10), Asia (except China) (42), Europe (27), America (6),
spring sowing area of China (5), winter sowing area of China (9)
Abbreviations: Subpop—subpopulation.
Table 3. The compositions of group inferred by cluster analysis of 410 faba bean accessions based on the NJ method.
PopulationsAccession No.Origin (Country or Province) and No. of Accessions
Group 179Africa (3), Asia (except China) (39), Europe (26),
spring sowing area of China (9), winter sowing area of China (2)
Group 2102Africa (4), Asia (except China) (27), Europe (9), America (1),
spring sowing area of China (5), winter sowing area of China (56)
Group 382Africa (5), Asia (except China) (25), Europe (19), America (3),
spring sowing area of China (25), winter sowing area of China (5)
Group 4147Africa (20), Asia (except China) (32), Europe (59), America (22),
spring sowing area of China (4), winter sowing area of China (10)
Table 4. Genetic diversity of 410 faba bean accessions based on geographical origin.
PopulationsSample SizeNei’s Gene DiversityPIC
Africa320.45410.3495
America260.43860.3397
Asia (except China)1230.47210.3603
Europe1130.46290.3550
Spring sowing area of China430.45490.3500
Winter sowing area of China730.43340.3368
Table 5. Genetic diversity of 410 faba bean accessions based on structure population analysis.
PopulationsSample SizeNei’s Gene DiversityPIC
Mixed subpop990.47230.3604
Subpop 1570.44670.3450
Subpop 2740.41560.3254
Subpop 3670.44390.3433
Subpop 41130.44260.3426
Table 6. Analysis of genetic differentiation among faba bean accessions based on their geographic origin using AMOVA.
SourcedfSSMSEst. Var.Percentage of Variation
Among Pops5954.546190.9091.0831%
Within Pops40449,195.268121.770121.77099%
Total40950,149.815 122.853100%
Table 7. Analysis of genetic differentiation among faba bean accessions based on the structure population analysis using AMOVA.
SourcedfSSDMSDEst. Var.Percentage of Variation
Among Pops3754.650251.5501.3111%
Within Pops40649,395.165121.663121.66399%
Total40950,149.815 122.974100%
Abbreviations: df, degrees of freedom; SSD, sum of squared deviation; MSD, mean squared deviation, and Est. Var. means estimates of variance components.
Disclaimer/Publisher’s Note: The statements, opinions and data contained in all publications are solely those of the individual author(s) and contributor(s) and not of MDPI and/or the editor(s). MDPI and/or the editor(s) disclaim responsibility for any injury to people or property resulting from any ideas, methods, instructions or products referred to in the content.

