Article

Comparative Omics-Based Identification and Expression Analysis of a Two-Component System in Vigna radiata in Drought Stress

1
Department of Bioinformatics and Biotechnology, Government College University, Faisalabad 38000, Pakistan
2
Department of Microbiology, University of Agricultural, Faisalabad 38000, Pakistan
3
Department of Environmental Sciences, Government College University, Faisalabad 38000, Pakistan
4
Korean Soybean Research Institute, 950 Worasan-ro, Jinju 52840, Republic of Korea
5
Advanced Engineering School (Agrobiotek), Tomsk State University, Lenin Ave, 36, 63050 Tomsk, Russia
*
Authors to whom correspondence should be addressed.
Agronomy 2023, 13(4), 989; https://doi.org/10.3390/agronomy13040989
Submission received: 31 December 2022 / Revised: 25 February 2023 / Accepted: 20 March 2023 / Published: 27 March 2023
(This article belongs to the Special Issue Genetics, Genomics and Breeding of Cereals and Grain Legumes)

Abstract

:
Two-component system (TCS) genes regulate a wide range of biological activities in prokaryotes and eukaryotes, including plants. TCS plays an important role in cellular responses to external stimuli, such as biotic and abiotic factors. In plants, this system supports cell division, leaf senescence, stress response, chloroplast division, and nutrient signaling. There are three kinds of proteins responsible for the appropriate functioning of the TCS system: histidine kinases (HKs), histidine phosphotransfer proteins (HPs), and response regulators (RRs). The results of the current study revealed that Vigna radiata has 54 genes encoding potential TCS proteins, which were divided into three subgroups: 18 HKs, 9 HPs (seven true and two pseudos), and 27 RRs (8 type-A, 8 type-B, 3 type-C, and 8 PRRS). The anticipated TCS genes were widely dispersed across all eleven chromosomes and had family-specific intron/exon structures. After investigating TCS genes in a variety of plant species, we determined that Vigna HK (L)s, HPs, and RRs have closer evolutionary relationships with other legume genes. Gene duplication, including segmental and tandem types, is the most frequent source of gene family expansion. Multiple stress-related cis-elements were predicted in the promoter sequences of the VrTCS genes. RNA-seq data analysis demonstrated that VrTCS genes were expressed in clusters of upregulated and downregulated groups in response to drought stress. Moreover, these clusters were differentially expressed as early or late responses to drought stress. Real-time qPCR showed that VrHK2, VrHK3, VrPHYE, VrHP4.1, VrRR5.2, and VrRR10 genes were upregulated, while VrRR3 and VrHP6.1 genes were downregulated in response to drought stress. The current study highlights the architecture of V. radiata TCS and provides a robust framework for subsequent functional evaluation.

1. Introduction

A crucial plant hormone commonly known as cytokinin is associated with several aspects of plant development, such as the formation of leaves and roots, seed germination, flowering, and the aging of plants [1,2,3,4]. Plants often transduce cytokinin signals through a process known as the two-component system [5]. Initially, this system was first reported in bacteria which was comprised of two signaling elements, namely, the histidine kinase (HK) gene family and the response regulator gene family [6]. The HK protein autophosphorylates when an external factor, such as a change in temperature, pH, antibiotics, or osmolarity supply of C, N, or PO4, causes the phosphoryl group to be coupled with conserved histidine residues of the Hiska domain [7]. The activated HK protein subsequently transfers this phosphoryl group to the RRs protein, where it binds with a conserved Asp residue of the Rec domain [8]. Over time, eukaryotes have acquired an intermediate protein family known as histidine phosphotransfer proteins as members of their multistep phosphorylation pathway. HP family members function as a linker protein in the signaling cascade, transferring the phosphate group from the histidine kinase protein to the response regulator protein [5,9].
Plants have three types of HKs: cytokinin receptors, phytochromes, and ethylene receptors. In Arabidopsis thaliana, three other HKs (ACKI1, CKl2/AKH5, and AHK1) do not belong to any particular class [9,10]. The general architecture of HKs consists of an input domain, a receiver (Rec) domain, a histidine-conserved transmitter domain (autophosphorylation site), and several N-terminus trans-membrane domains. Three ethylene receptors, ERS2, AEIN4, and AETR2, do not constitute autophosphorylation activity because phosphorylation-related residues are missing from their transmitter domains. As a result, they are characterized as diverging HKs [7,11]. In addition, cytokinin recognizes the cyclase/HK-associated sensory extracellular (CHASE) domain on the cytokinin receptors AHK4, AHK3, and AHK2. The phytochrome family includes the PHYE, PHYC, PHYB, PHYD, and PHYA members, as well as two PAS (Per/Arndt/Sim) folds and a chromophore-binding (PHY) domain [12,13].
The phosphotransfer (Hpt) domain of the HP family contains an evolutionarily conserved motif (XHQXKGSSXS) required for phosphoryl transfer from the HKs Rec domain to the RRs Rec domain [8,9,14]. AHP6 is known as a pseudo-HP protein because it lacks a His residue in its domain. AHP6 is also a cytokinin signaling suppressor that cannot function as a phosphotransfer protein [13,15]. Based on domain architecture, the response regulators were divided into three distinct categories: Type A, Type B, and Type C [7,16]. The majority of the type-A RRs are C-terminally extended cytokinin response proteins containing the Rec domain. Type B RRs belong to a class of transcriptional factors with an N-terminus Rec domain and a C-terminus output domain in their structure. The domain architecture of Type C RRs is similar to Type A RRs, but they are not activated by cytokinin, and no specific role of type-C RR in cytokinin signaling is recognized to date [17]. Moreover, there is a different class of RRs, generally called pseudo-RRs (PRRs). PRRs are not considered true RRs because they lack DDK-conserved motifs, in which essential residues for phosphorylation are absent. However, a specific motif known as CCT is present in the C-terminal extension, which is essential for regulating circadian rhythms [18,19,20].
Two-component system genes are linked to a wide range of abiotic stress tolerance, particularly responses to temperature, wind, water, and salt [21,22]. In plants, the TCS genes are involved in signal transduction, osmosensing, and important cellular processes such as ethylene, cytokinin, and red light responses [23,24]. Furthermore, the TCS genes are involved in activities such as nutrition sensing, stress response, chemotaxis, endosperm formation, and nodulation during plant growth, development, and adaptability [25,26].
Vigna radiata (L.) R. Wilczek var. radiata (Mung bean), also known as moong or green gram, is a staple food and a source of revenue in rice-based agricultural systems in Southeast and South Asia, though it is grown globally [27]. This crop is grown in both subsistence and commercial agriculture systems around the world for fiber, food (syrup and grain), fuel, and animal feed [28,29]. In most regions, mung bean yields are low, ranging from 0.5 to 1.5 t/ha. Temperature and salinity are two major factors that influence plant growth and development in a variety of ways [30,31]. As a result, crop productivity must be increased to meet global food demand in the coming decades. The current study sought to identify salt stress and drought stress-responsive TCS genes that may be beneficial in V. radiata development. Owing to the important role of the TCS genes in a wide range of biological activities, their identification and characterization must be carried out in V. radiata.

2. Materials and Methods

2.1. Gene Family Identification of Two-Component System in V. radiata

The Ensemble plants database was used to get A. thaliana TCS full-length protein sequences (https://plants.ensembl.org/index.html, accessed on 2 November 2021) [32]. The gene family members of TCS in V. radiata were identified by a BLASTp software (https://blast.ncbi.nlm.nih.gov/Blast.cgi?PAGE=Proteins, accessed on 2 November 2021) search using A. thaliana sequences as a query [33]. The parameters of BLASTp were set as non-redundant protein sequence database, and BLOSUM62 was set as a scoring parameter. All TCS sequences with an E-value lower than 1 × 10⁻¹⁰ and the largest ORF were chosen for further investigation. Further, the TCS sequences that do not have a conserved domain for the functioning of TCS were eliminated using different domain databases, Pfam (https://pfam.xfam.org/, accessed on 20 November 2021) [34], ScanProsite (https://prosite.expasy.org/scanprosite/, accessed on 25 November 2021) [35], SMART (http://smart.embl-heidelberg.de/, accessed on 26 November 2021) [36], and CDD (https://www.ncbi.nlm.nih.gov/Structure/cdd/cdd.shtml, accessed on 2 December 2021) [37]. The ExPASY server’s ProtParam tool was used to calculate the theoretical isoelectric point (pI), molecular weight (MW), grand average of hydrophobicity (GRAVY), aliphatic index, and instability index (https://web.expasy.org/protparam/, accessed on 10 December 2021) [38,39]. VrTCS gene subcellular localization was identified by using CELLO V.2.5 (http://cello.life.nctu.edu.tw/, accessed on 16 January 2022) [40]. The TCS genes’ genomic information, such as genomic and cDNA sequences, chromosomal location, and protein length, was obtained from NCBI (https://www.ncbi.nlm.nih.gov/, accessed on 18 January 2022) [41]. The parameter of CELLO V.2.5 were set as protein fasta sequences and choose organism as eukaryotes.

2.2. Prediction of TCS Gene Structure and Cis Regulatory Elements in V. radiata

The schematic representation of the VrTCS gene structure (introns/exons) was carried out using the online software Gene Structure Display Service (GSDS) (http://gsds.gao-lab.org/, accessed on 24 January 2022) [42]. The input parameters were set as fasta sequence and output format were set as PNG format. NCBI was used to extract upstream 1000 bp genomic DNA sequences from the transcription start point of VrTCS genes. Then, these upstream sequences were subjected to the plant CARE website (http://bioinformatics.psb.ugent.be/webtools/plantcare/html/, accessed on 26 January 2022) to identify potential cis-regulatory elements [43].

2.3. Phylogenetic Analysis, Multiple Sequence Alignment, and Motif Recognition

MEGA 7.0 software [44] was utilized to perform the phylogenetic analysis. For phylogenetic tree building, the Neighbor-joining (NJ) and Maximum Likelihood techniques were applied and additional factors such as bootstrapping (1000 replicates), poisson correction, and pairwise deletion, were considered. To construct phylogenetic relation TCS, the TCS protein sequences (HKs, HPt, and RRs) of A. thaliana, Glycine max, Sorghum bicolor, Cicer arietinum, and Oryza sativa were retrieved from the database phytozome (https://phytozome-next.jgi.doe.gov/, accessed on 29 January 2022) [45]. Phylogenetic trees were built using these reported full-length protein sequences and the identified V. radiata potential TCS proteins. To evaluate the conservation of crucial residues involved in the phosphorylation process, ClustalX [46] (http://www.clustal.org/, accessed on 2 February 2022) was used to align sequences from several conserved domains (Rec, HK, Hpt, and Myb) and motifs (CCT). In addition, the MEME (Multiple EM for Motif Elicitation) program was used to anticipate the unique conserved motifs in the VrTCS protein sequence (https://meme-suite.org/meme/, accessed on 26 February 2022) [47]. The prediction range of the motif was fixed to twenty and the other thresholds were kept at their default values as classic mode for motif discovery, and the minimum width of the motif should be 6 and 60, respectively.

2.4. Chromosomal Mapping, Gene Duplication, and Evolutionary Analysis of TCS Members in V. radiata

A chromosomal genetic linkage map was created by using the advance Circus TBtool (https://bio.tools/tbtools, accessed on 18 March 2022) [48]. Furthermore, the location of each TCS gene on V. radiata chromosomes was also determined using the NCBI-gene database. The gene duplication events were investigated using the DnaSP v.6 software (https://bioinformaticshome.com/tools/descriptions/DnaSP.html, accessed on 22 March 2022) [49]. To measure the selection pressure on the duplicated genes, the rates of synonymous and non-synonymous substitutions were determined. To trace evolutionary events, the divergence time was computed. T Ks/2x (x = 6.56 × 10⁻⁹) formula was used to calculate the duplication time.

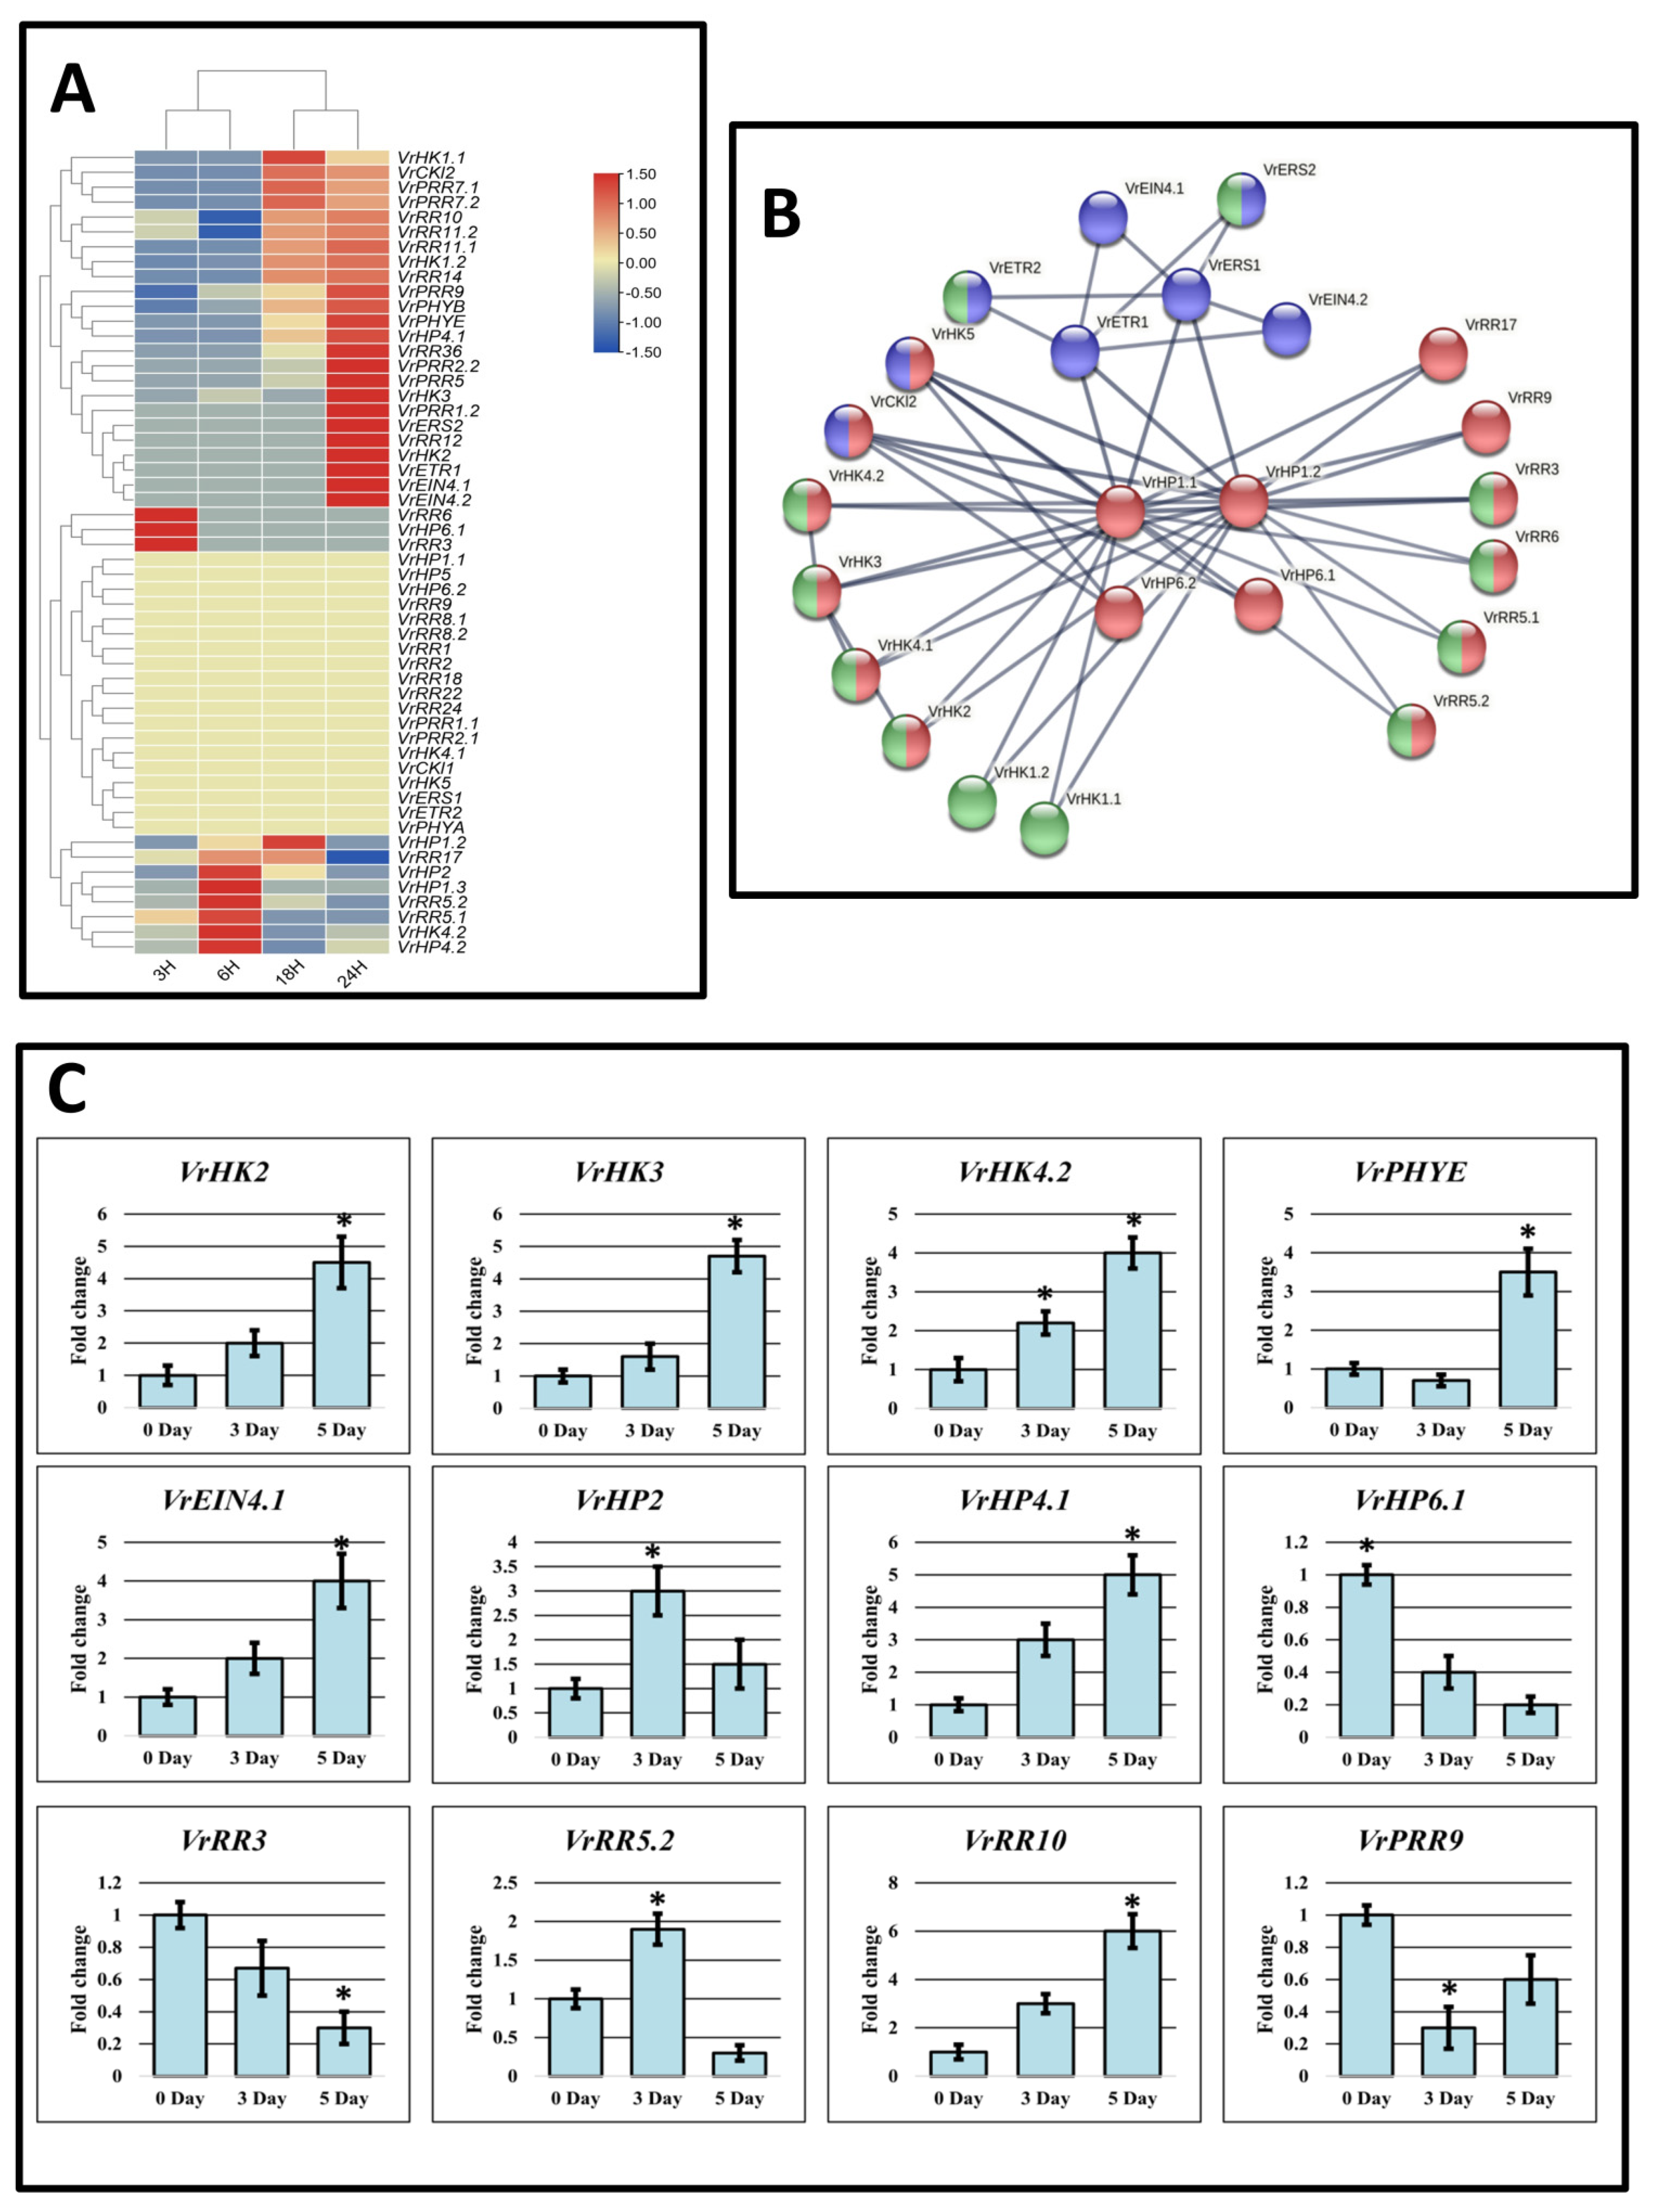
2.5. Two-Component System Gene Expression Patterns and Protein–Protein Interaction PPI in V. radiata

To further explore the expression level of these discovered VrTCSs in response to drought stress, RNA-seq data on seed (BioProject: PRJNA327304) was downloaded from the SRA database (https://www.ncbi.nlm.nih.gov/sra, accessed on 29 March 2022). From NCBI (https://www.ncbi.nlm.nih.gov/assembly/GCF_000741045.1/, accessed on 29 March 2022), the genome annotation files (.gtf and .fna) were downloaded. Bowtie2 was used to create indexes of the V. radiata genome sequence, and paired-end clean reads of high quality were mapped to the V. radiata genome. The cufflinks software was then utilized to compute the expression levels of the reference genome’s annotated genes. The normalized FPKM values of each VrTCS were computed to determine whether genes were differently expressed, either up-regulated or down-regulated [50]. The statistical analysis and measures for RNA sequence analysis and differential gene expression were same as reported in BioProject: PRJNA327304. TBtool was used to create a heatmap of the expression. To further understand how these TCS proteins respond to abiotic stress, we projected a protein interaction network for these TCS proteins. The VrTCS protein sequences were input into the STRING database to create the protein interaction [51]. In PPI, proteins having an interaction score > 0.700 were selected for further analysis.

2.6. Plant Growth and Treatments

V. radiata plants were cultivated in a growth chamber for 28 days under the following conditions. The temperature ranged from 25 to 27 °C throughout the experimental duration, whereas the light/dark cycle was for 16/8 h. The relative humidity level was maintained at 65%. Twenty-eight days after the cultivation, the drought stress was applied. For the drought treatment, the watering to the selected pots was stopped. The pots in control were watered to normal field capacity, i.e., 80–100%. Leaf samples were collected from each pot (control, and drought at day 0, day 3 and day 5 with three biological replicates for RNA extraction.

2.7. Validation of Expression Results Using Quantitative Real-Time PCR

Leaf samples were crushed using antiseptic pestles and mortar in the presence of liquid nitrogen. The Fastlane cell cDNA kit (Qiagen, Switzerland) was used to synthesize complementary DNA (cDNA). The RNA was quantified using a Nanodrop spectrophotometer (NanoDrop 2000, Thermo Fisher Scientific Waltham, MA, USA). One microgram of the RNA sample was used for cDNA synthesis with an All-in-One First-Strand synthesis kit (Thermo Fisher Scientific, Waltham, MA, USA). The SYBR Green Master kit was used to perform the qPCR reactions in the Applied Biosystem Real-Time PCR Detection System (RT-PCR). TCS gene-specific primers (Supplementary Table S1) were constructed using the “Oligo Calculator” online tool (http://mcb.berkeley.edu/labs/krantz/tools/oligocalc.html, accessed on 18 June 2022) [52], and their specificity was confirmed using the NCBI Primer-BLAST program (https://www.ncbi.nlm.nih.gov/tools/primer-blast/, accessed on 18 June 2022) [53]. To standardize gene expression, the reference gene glyceraldehyde-3-phosphate dehydrogenase (GAPDH) was employed [54,55].

3. Results

3.1. Comprehensive Identification of Two-Component System Genes in V. radiata

The current study used a BLASTp search to identify putative TCS gene family members in V. radiata using the TCS protein sequences of A. thaliana. V. radiata genome contained 54 TCS genes, which were further classified as 18 HK, 9 HP, and 27 RR.

3.2. Histidine Kinase Protein Family in V. radiata

In the current genome-wide analysis, the genome of V. radiata contains 18 HKs (VrHKs/VrHKLs (histidine kinase like)) sequences which are more than the HKs sequences of O. sativa (5), Z. mays (11), S. bicolor (13), T. aestivum (7) and P. trichocarpa (12). However, this higher proportion of HKs is close to other plants such as C. melo L. (17), A. thaliana (17), G. max (21), B. rapa (20), S. lycopersicum (18) and L. japonicus (14), indicating that HKs may be important in these species (Table 1). VrHK1.1, VrHK1.2, VrHK2, VrHK3, VrHK4.1, VrHK4.2, VrHK5, VrCKl1, and VrCKl2 were discovered to be cytokinin-related genes in V. radiata. The conserved residues required for HK activity appeared to be present in all members (Figure 1; Supplementary Table S2; Figure S1). All of these HKs have a conserved HisKa domain with a conserved His phosphorylation site, according to domain analysis. Furthermore, each of the nine members possessed a conserved RR (Rec) domain containing a highly conserved Asp residue that functions as a phosphoreceptor. According to genetic and molecular studies, the ethylene response in A. thaliana is mediated by five ethylene receptors. These receptors contain a GAF protein–protein interaction domain, a HisKa domain, and a HATPase domain [56]. Similarly, six genes in V. radiata were predicted to code ethylene receptors (VrETR1, VrETR2, VrERS1, VrERS2, VrEIN4.1, and VrEIN4.2). VrETR1, VrERS1, and VrERS2 have domains that are similar to those found in A. thaliana. While VrETR2, VrEIN4.1, and VrEIN4.2 contain GAF, HisKa, and a conserved Rec domain (Figure 1; Supplementary Table S2, Figure S1).
The developmental and growth processes of plants in response to light stimuli are mediated by photoreceptors or the phytochrome family. PHYA, PHYB, PHYC, PHYD, and PHYE have been identified as phytochrome families in A. thaliana [57]. Phytochrome consists of an N-terminal PHY domain that is responsible for the absorption of light. One HisKa, GAF domain, and two PAS domains are involved in signal transduction. The structures of phytochrome are similar to those of sensor H proteins and are soluble proteins. The signal transduction (HisKa) domain is located at the C-terminal and the sensor domain is located at the N-terminal site. The phytochrome family is also known as divergent HKs because they lack all the conserved motifs. They contain Ser/Thr kinase activity instead of HKs activity for signal transduction [58]. In the genome of V. radiata, three members VrPHYA, VrPHYB, and VrPHYE were found. All three members contain PAS, GAF, PHY, and HisKa domains that are responsible for light and signal transduction. The presence of these domains makes them true photoreceptors (Figure 1; Supplementary Table S2, Figure S2).

3.3. Histidine Phosphotransfer Protein (HpT) Family in V. radiata

Six members of the HP gene family (AHP1AHP6) have been discovered in the genome of A. thaliana, five of which are true HPs and one of which is a pseudo-HP because it lacks a conserved histidine (H) residue required to accept the phosphate group from the donor protein [56,59]. The histidine (H) residue in AHP6/APHP1 was replaced by an (N) residue, making this member a pseudo-HP, whereas a conserved phosphorylation motif (XHQXKGSSXS) was present in all other members of the HP family. In the genome of V. radiata, nine potential HP gene family members (HP1.1, HP1.2, HP1.3, HP2, HP4.1, HP4.2, HP5, HP6.1, and HP6.2) were discovered. VrHP6.1 and VrHp6.2 genes were identified as pseudo-HPs due to the absence of phosphorylating conserved residue (Figure 1; Supplementary Table S2, Figure S2).

3.4. The Response Regulators (RR) Family in V. radiata

The final response to the environmental stimulus was regulated by the response regulator (RR). In the A. thaliana genome, 32 putative RR family members were discovered, and 22 in O. sativa [9,60]. In this study, a total of 27 putative response regulators (RRs) were discovered in the V. radiata genome. In the signaling pathway of TCS, response regulators act as terminal components that perform a function as phosphorylation-activated switches. The RR family were divided into three subfamilies based on conserved domains: the first one is type-A, the second is type-B and the third is type-C RRs. Type-A RRs have a conserved aspartic acid (D) residue in their Rec domain and a long C-terminus extension. Type-B RRs have a conserved Rec domain and a Myb binding domain, whereas type-C RRs have a domain structure like type-A RRs but lack the C-terminal extension. Another type of RR is the pseudo-response regulator, which has a conserved Rec domain in which the conserved aspartic acid (D) residue is replaced by glutamic acid (E) and a C-terminal CCT motif. A comprehensive genome-wide analysis of V. radiata reveals the presence of 27 RR family-related members. There were eight type-A, eight type-B, three type-C, and eight PRRs present. The type-A RR family in V. radiata is made up of eight members: VrRR3, VrRR5.1, VrRR5.2, VrRR6, VrRR8.1, VrRR8.2, VrRR9, and VrRR17, all of which are likely to be identical to their A. thaliana counterparts and have a conserved Rec domain [18].
Because they contain a Myb-DNA binding domain, type-B RRs were discovered to be involved in transcriptional regulation. VrRR1, VrRR2, VrRR10, VrRR11.1, VrRR11.2, VrRR12, VrRR14, and VrRR18 are members of this family in V. radiata, which is more than O. sativa (7), C. arietinum (7), T. aestivum (2), and S. bicolor (7), but less than A. thaliana and G. max [4,58,59,60]. Except for VrRR11.1 and VrRR11.2, which are missing the Myb domain, all nine members have conserved Myb and Rec domains. V. radiata has three members of the type-C RR family (VrRR22, VrRR24, and VrRR36), while A. thaliana has two (ARR22 and ARR24) [18]. These members share a Rec domain with their A. thaliana counterparts and have strong phylogenetic homologous relationships. The V. radiata genome contains eight PRRs: VRPRR1.1, VRPRR1.2, VRPRR2.1, VRPRR2.2, VRPRR5, VRPRR7.1, VRPRR7.2, and VRPRR9. PRRs were further classified into two types based on their C-terminal extension: clock-associated PRRs (which contain the CCT motif) and type-B PRRs (contain the Myb domain). VrPRR2.1 and VrPRR2.2 are the only two genes with a Myb domain rather than a CCT motif, indicating that they are type-B PRRs (Figure 1; Supplementary Table S2, Figure S3).
Table 1. TCS genes reported in a variety of plants.
SpeciesTotal No. of TCS GenesHKHP (Pseudo HP)Type-A RRsType B RRsType C RRsPRRSCotyledonsReferences
Arabidopsis thaliana4786 (1)101229Dicot[15]
Oryza sativa L.375515705Monocot[60]
Cicer arietinum51187 (2)77210 bDicot[58]
Sorghum bicolor37135 (2)3727 bMonocot[59]
Glycine max9836131815313Dicot[10]
Citrullus lanatus49196 (2)81065Dicot[61]
Cucumis melo L.5117981106Eudicots[62]
Cucumis sativus L.46187 (2)8805Dicot[61]
Populus trichocarpa49121291105Dicot[63]
Solanum lycopersicum65206 (2)72318Dicot[64]
Physcomitrella patens391837524 aMonocot[65]
Zea mays59119 (2)169311 aMonocot[66]
Zizania latifolia69258141426Monocot[67]
Lotus japonicus4014771115 aDicot[20]
Brassica rapa85208 (1)2117415Dicot[68]
Triticum aestivum6271041202Monocot[69]
V. radiata54189(2)8838DicotPresent work
a Clock-associated. b Both type-B PRRs and clock-associated.

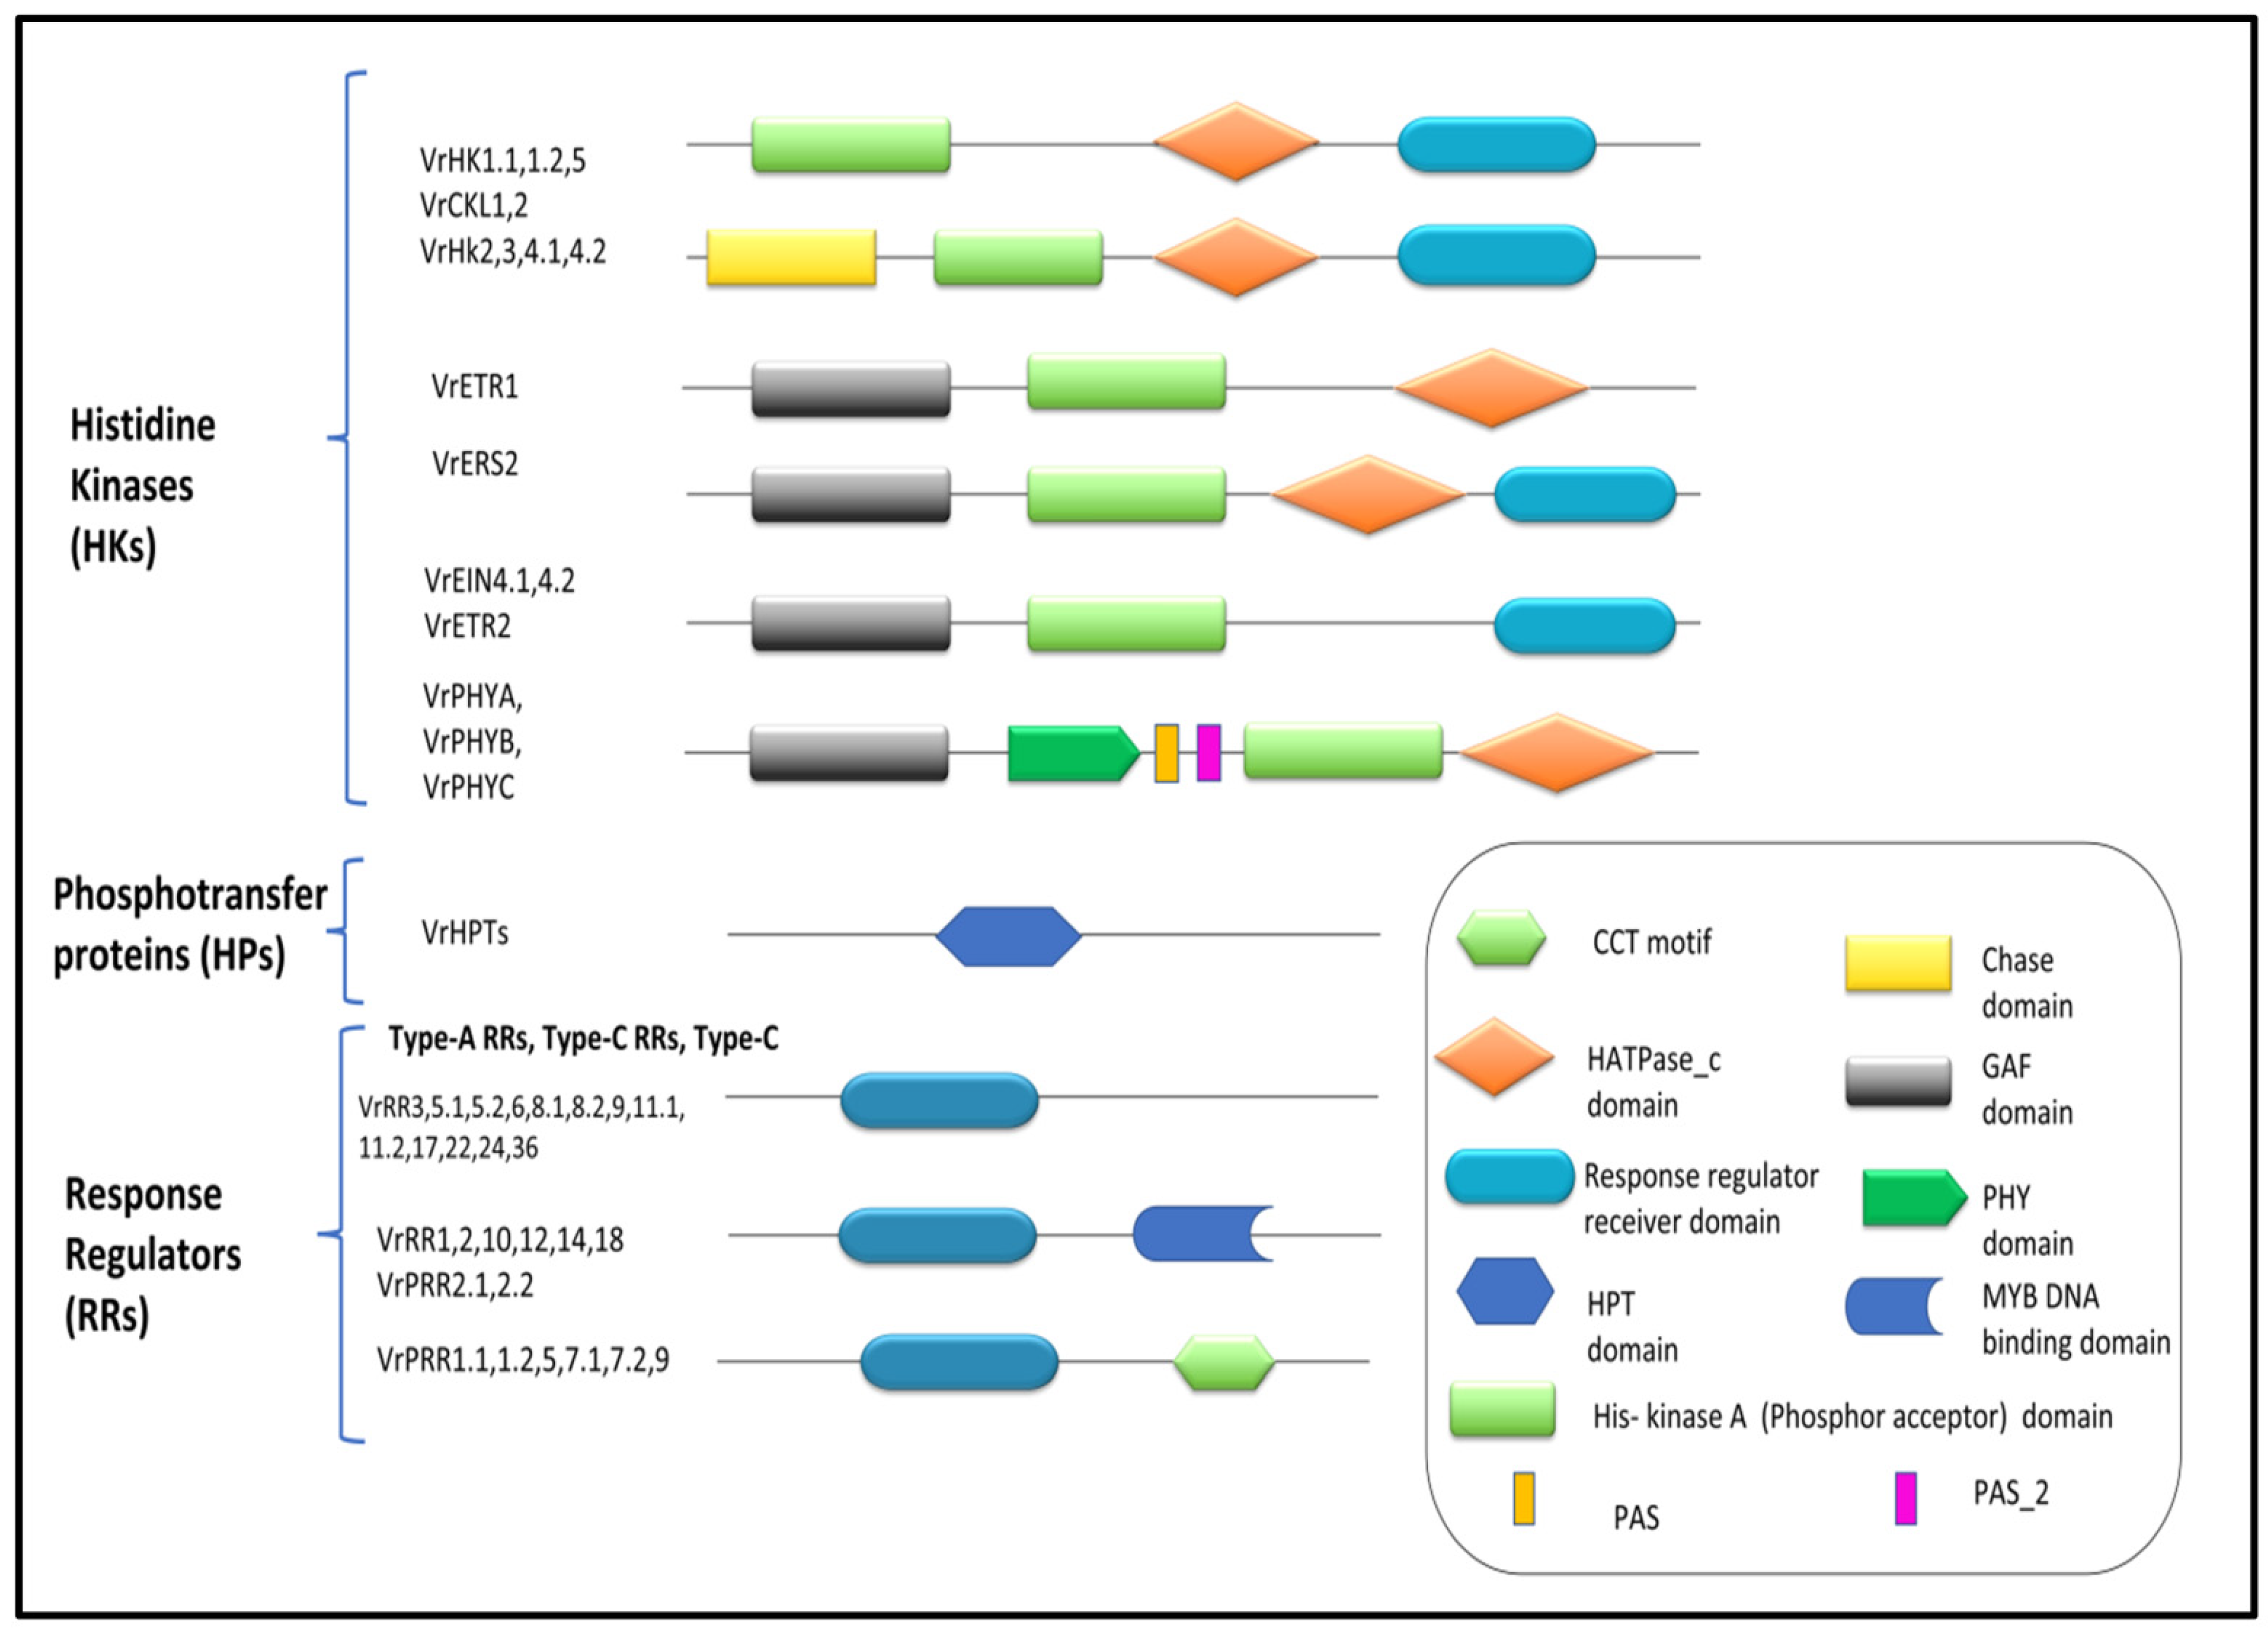
3.5. Features of VrTCS

The genomic Table 2 examines the detailed physio-chemical properties of the 54 VrTCS proteins. VrTCSs are found on chromosomes 1–10. The length of the proteins ranged from 111 amino acids (VrHP5) to 1265 amino acids (VrHk1.1), and the number of exons ranged from 2 to 14. ExPASY analysis shows that the VrTCS proteins’ isoelectric points range from 4.53 to 8.69, their molecular weights range from 12,940.53 Da to 141,438.69 Da, and their stability index ranges from 24.28 to 71.26. In addition, the aliphatic index and GRAVY of VrTCS were computed, with values ranging from 66.68 to 107.17 and 0.828 to 0.122, respectively.

3.6. Gene Structure and Conserved Motif Analysis of V. radiata TCS Members

A gene’s intron-exon structure is an important evolutionary feature that provides insight into its functional variation. As a result, the intron-exon arrangements of the VrTCS genes were investigated. The cytokinin receptor HK family has exons ranging from 10 in VrHK3 to 14 in VrHK4.2, with introns ranging from 9 to 13. VrCKl1 has six introns and seven exons in its gene sequence, whereas VrCKl2 has twelve introns and thirteen exons. TCS members VrEIN4.1 and VrEIN4.2 had two exons and three introns, whereas VrERS1, VrETR1, VrETR2, and VrERS2 have seven, seven, three, and five exons in their gene structures, respectively. VrPHYA has seven exons, while VrPHYB and VrPHYE have four exons each.
The gene structure of the HP family consists of four to seven exons. Exon counts in the V. radiata RR family genes ranged from 2 to 13. The most exons were discovered in VrPRR2.1 and VrPRR2.2. After that, we used the MEME program to predict the VrTCS conserved motifs. MEME software discovered a total of 20 motifs, of which motifs 8, 10, 11, and 18 were conserved throughout the HK family. The ethylene receptor family also contained similar motifs, with additional conserved motifs 9, 12, 14, and 19. There are between eight and ten non-conserved motifs in the phytochrome family; seven and nine were conserved in the HP family motifs. Overall, Type A RRs shared motifs 1, 2, 4, and 13, whereas Type C shares all but motif 2. Type-B has a motif similar to type-A, with one additional conserved motif 20, and motif 15 is present in PRRs (Figure 2, Supplementary Figure S4). Members of the same gene families share motifs, indicating that there is no sequence divergence between them.

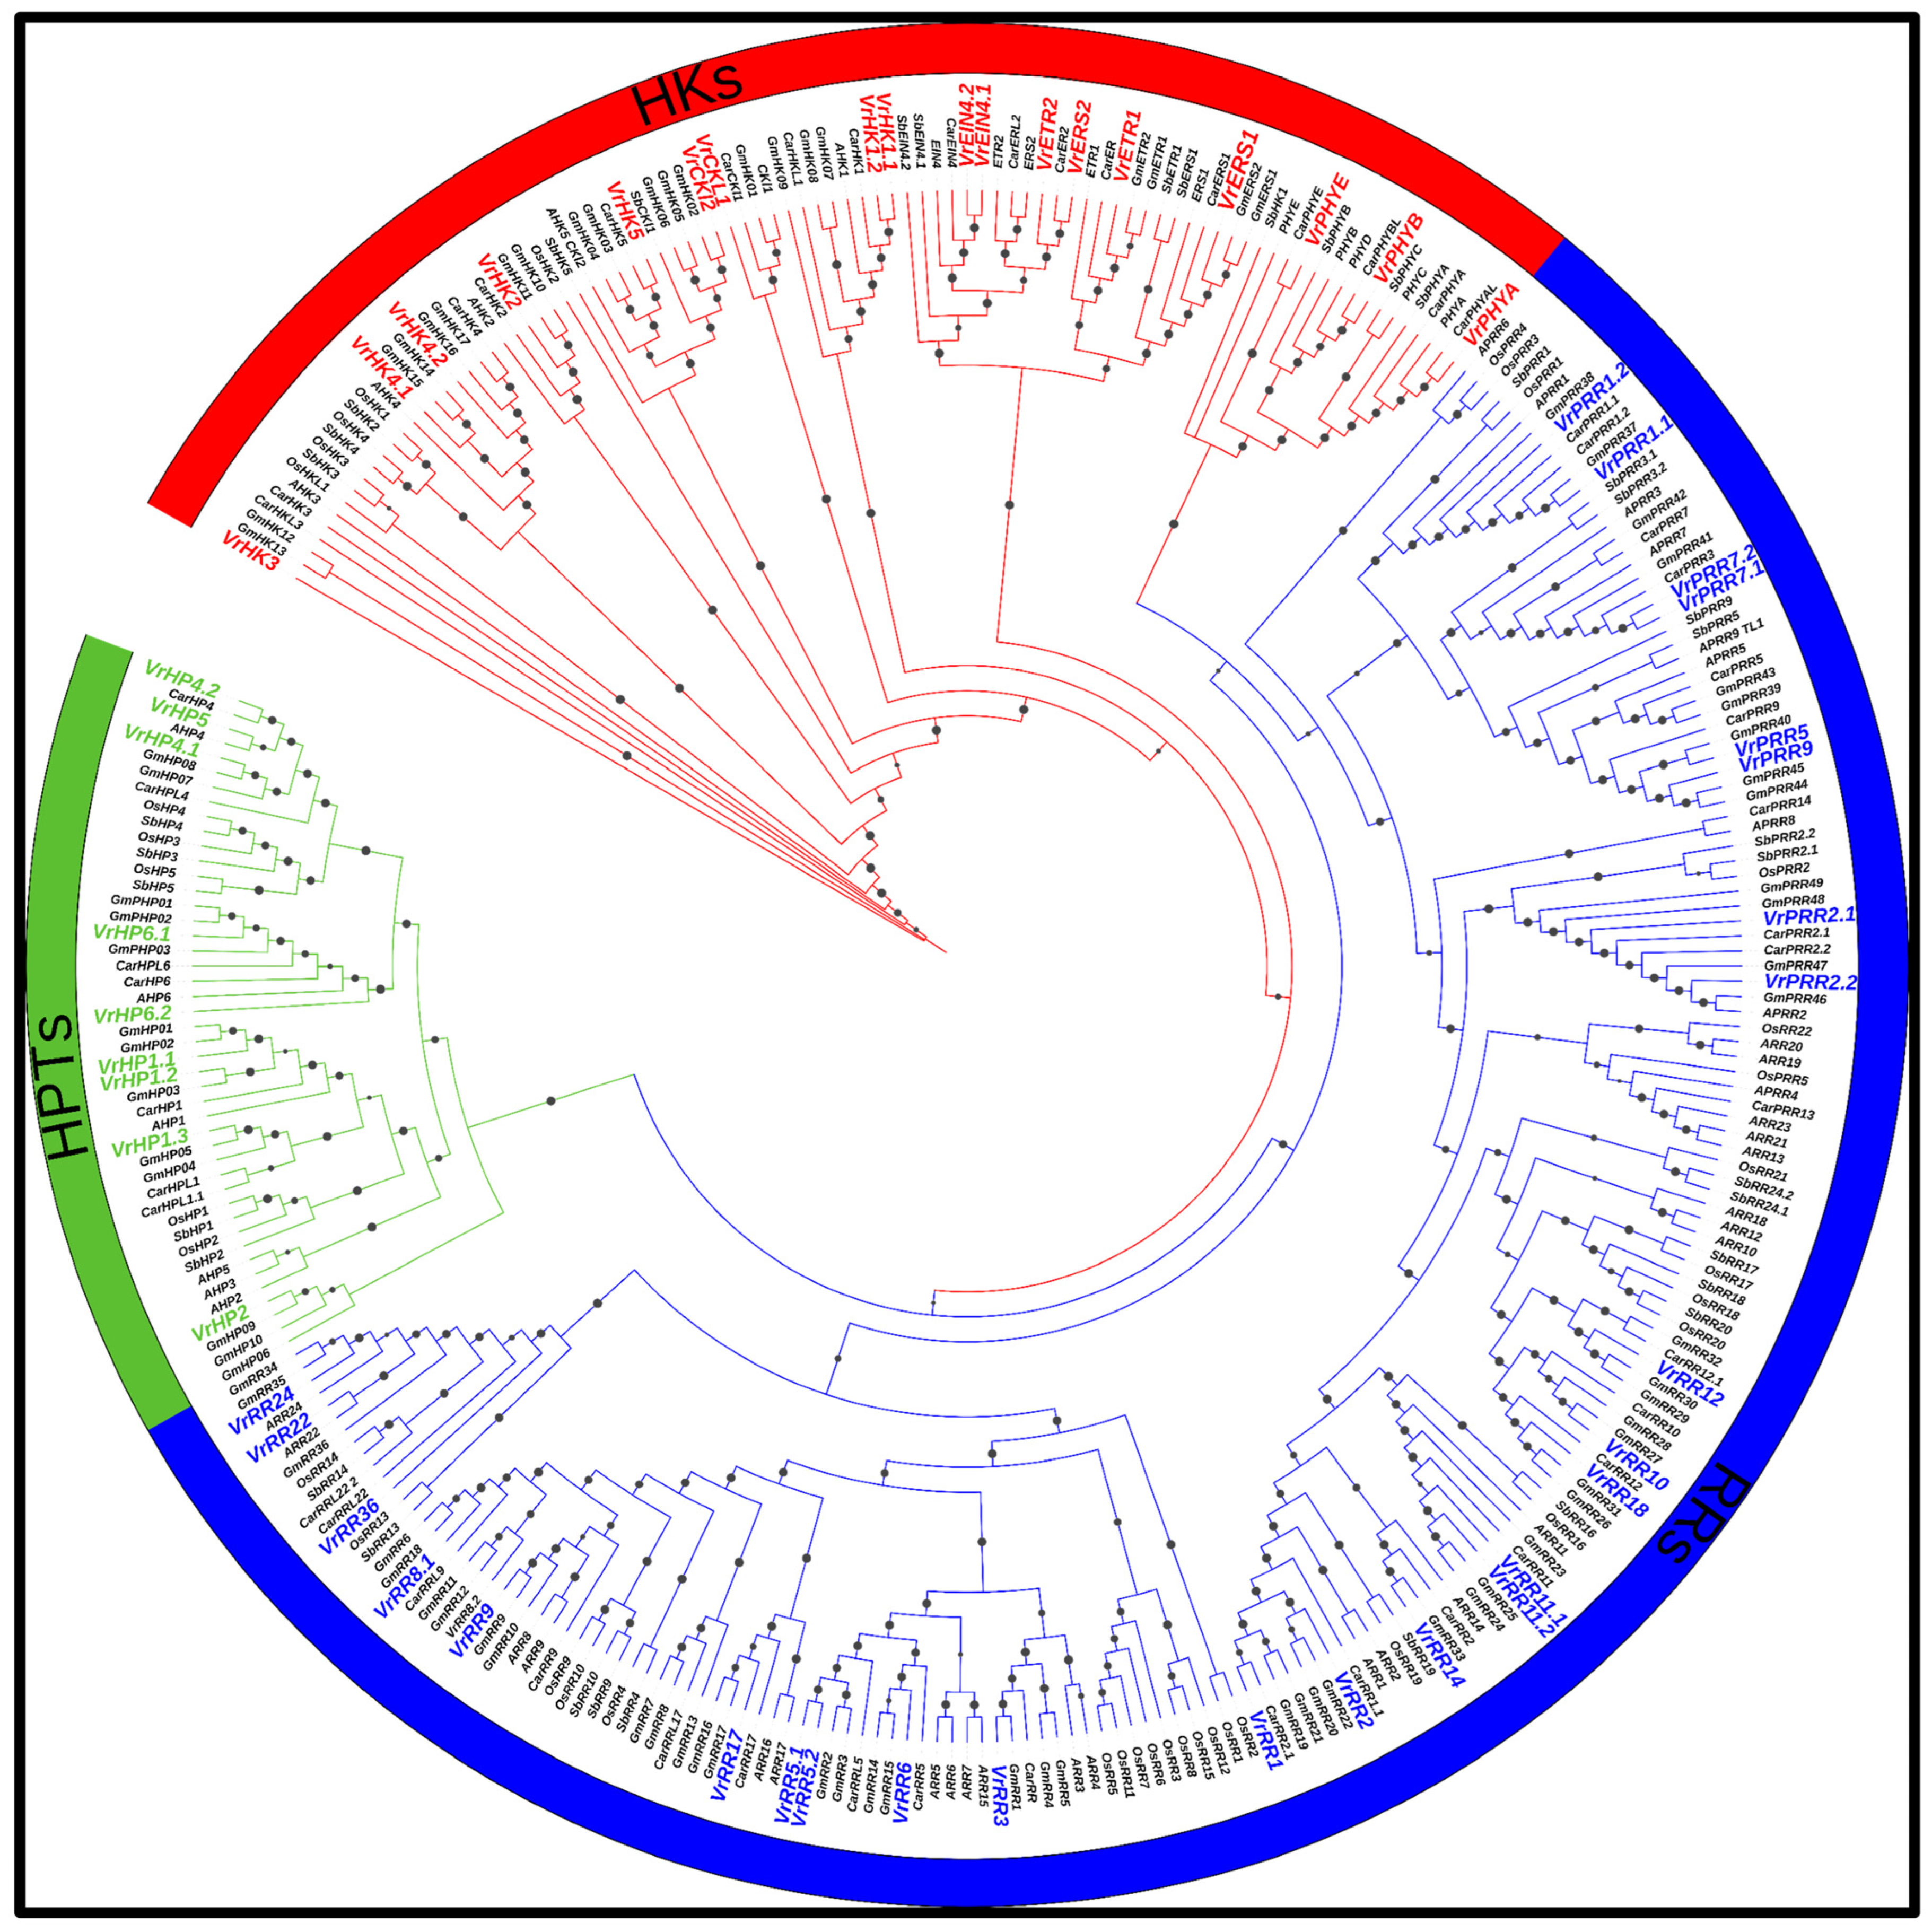
3.7. Phylogenetic Analysis of V. radiata TCS Members

We further investigated the evolutionary trend and phylogenetic relationships of TCS proteins in V. radiata. The neighbor-joining tree was constructed using TCS peptide sequences for V. radiata, A. thaliana, C. arietinum, G. max, S. bicolor, and O. sativa (Figure 3) [58,59,60]. These TCS proteins were classified into three groups: phosphotransfer proteins (HPs), histidine kinases (HKs), and response regulators (RRs). The histidine kinase subunits were classified into five groups in the evolutionary tree: phytochromes, HK1, CKl1, cytokinin receptor, CKl2, and ethylene receptor. It has been revealed that both A. thaliana and V. radiata contain cytokinin receptors. They were identified in A. thaliana as AKH4, AKH3, and AKH2, and in V. radiata as VrHK2, VrHK3, VrHK4.1, and VrHK4.2. The HKs tree revealed that VrHK3 and VrHK4 were orthologues of the AHKs. The functional analysis of A. thaliana cytokinin receptors revealed that they are involved in a wide range of cytokinin activities, including cell differentiation, vascular differentiation, stress responses, leaf senescence, mitosis, and seed size. Based on the formation of cytokinin groups in V. radiata and A. thaliana in the HK tree, it is possible that V. radiata’s cytokinin serves a similar function.
AHK1 is an osmosensing transmembrane protein in A. thaliana that is primarily expressed in the roots under salt-stress conditions. VrHK1.1, VrHK1.2, and VrCKL1 are orthologues of AHK1 in V. radiata [70]. VrHK5 and VrCKl2 are the orthologs of AHK5/ACKl2 in the CKl2 group, according to phylogenetic analysis. VrETR1 and VrERS1 are ethylene receptors that are direct homologs of ETR1 and ERS1. VrEIN4.1 and VrEIN4.2 proteins are also found on another branch, forming a direct ortholog link with ERS2 and ETR2 in A. thaliana (Figure 3; Supplementary Figure S5) [59].
Photoreceptors known as phytochromes have been discovered to be important in plant development and growth under light-stress conditions [71]. A. thaliana has five photoreceptors, including one HisKa, two PAS domains, a GAF domain, and a C-terminal, N-terminus PHY domain, all of which are important in the transduction of signaling pathways [72]. Three photoreceptors, VrPHYA, VrPHYB, and VrPHYE, were discovered in V. radiata with the same domain as those found in A. thaliana. All the putative identified VrPHYs were direct homologs of AtPHYs. V. radiata contains nine HPs that are all closely related to the true HPs found in O. sativa and A. thaliana. These HPs were classified based on their evolutionary relationships with A. thaliana counterparts. VrHP1.1, VrHP1.2, and VrHP1.3 were identified as AHP1-like. VrHP2 was grouped as AHP2-like, while VrHP6.1 and VrHP6.2 were grouped as being AHP6-like, whereas VrHP4.1, VrHP4.2, and VrHP5 were categorized with AHP4-like HPs (Figure 3; Supplementary Figure S6).
For the evolutionary study of response regulators, the sequence RRs proteins of A. thaliana, V. radiata, O. sativa, C. arietinum, S. bicolor, and G. max were utilized [58,59,60]. The third partner in the signaling TCS transduction pathways that trigger the genes in response to stress is response regulators, which are classified as Type A, Type B, Type C, and PRRs. All type-A RRs have a close relationship to their A. thaliana and O. sativa counterparts, indicating that they are genuine type-A RRs. The evolution pattern of V. radiata revealed that segmental duplication occurs in their genome. Similar findings have been obtained in A. thaliana and O. sativa, both of which exhibit segmental duplication. Type-A RRs are considered novel members of the RR family because they are found only in terrestrial plants and are absent in unicellular algae. They have been proposed to engage in a variety of novel activities in those species. The attachment of the phosphate group in their structure requires a conserved DDK and Rec domain motif [73]. Cytokinin primarily activates type-A RRs, with type-B RRs also contributing to cytokinin induction (Figure 3; Supplementary Figure S7).

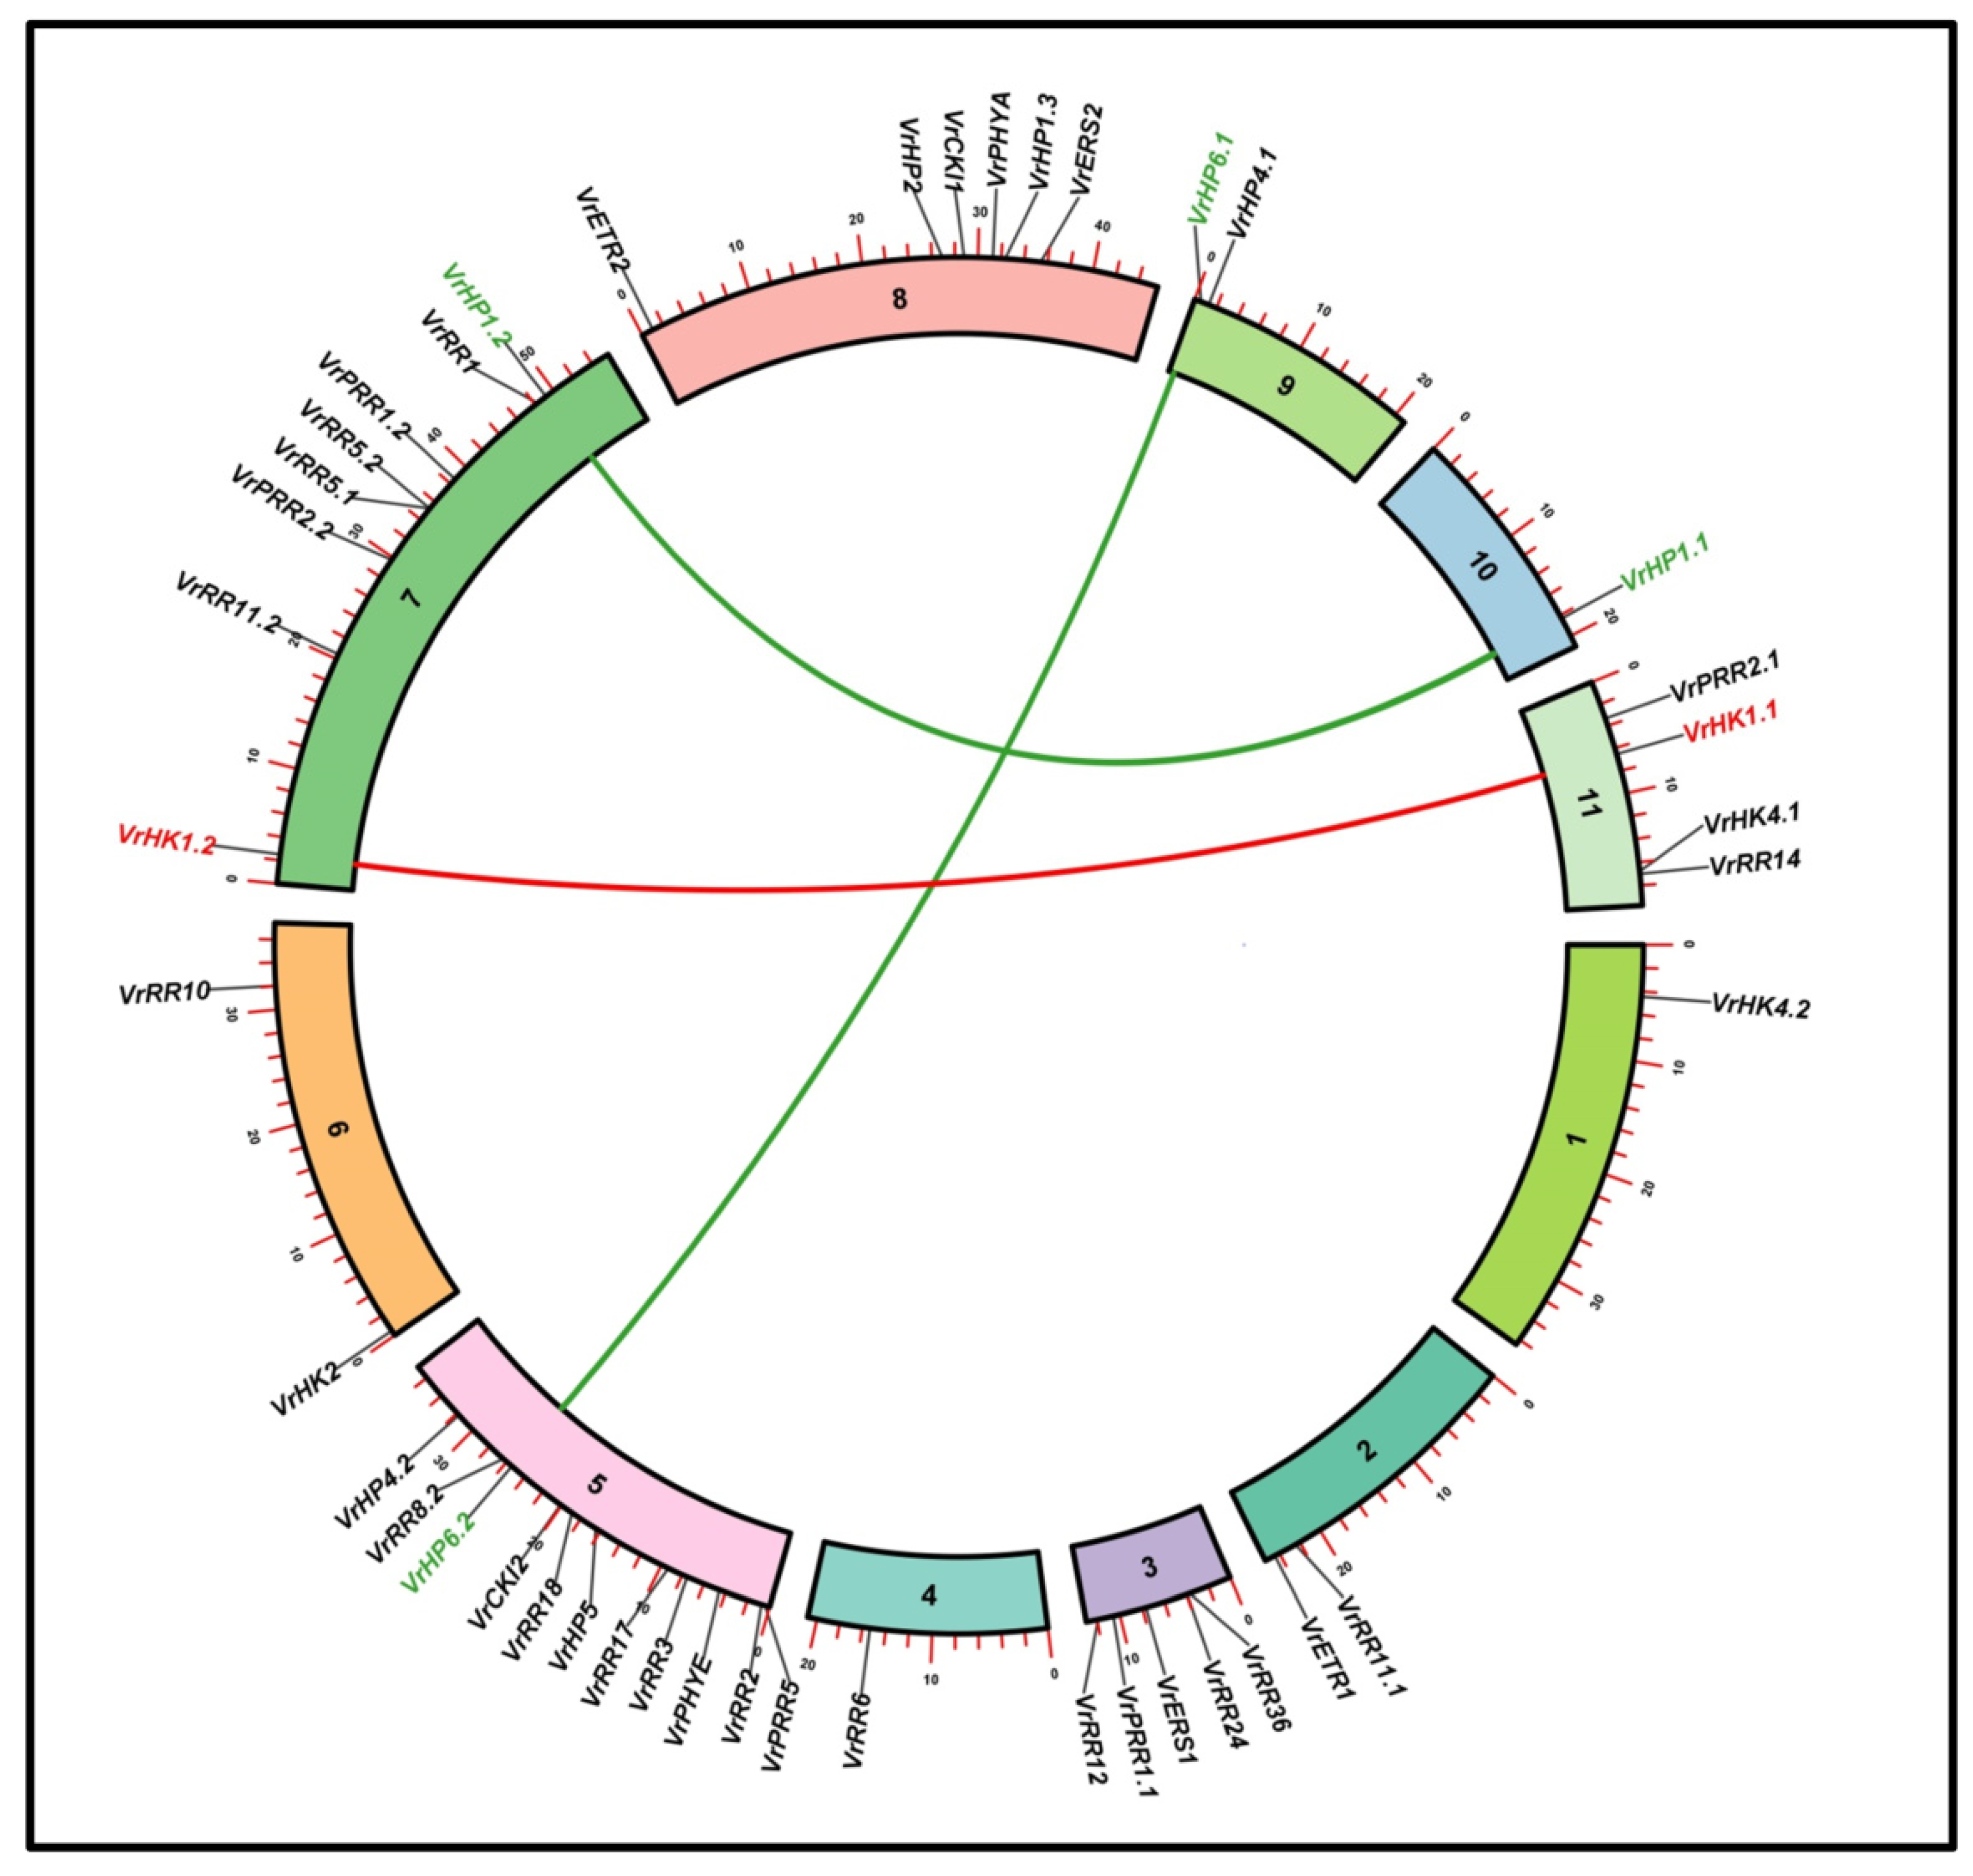
3.8. Synteny Analysis, Gene Distribution, and Duplication of V. radiata TCS Members

The VrTCS gene distribution, as well as the gene location on the chromosome and gene duplicated pairs, were determined using Synteny analysis. All of the TCS family members identified in V. radiata—except for a few genes, due to a lack of locus information—are distributed across eleven chromosomes. The distribution of genes on chromosomes is unequal, with chromosome 5 containing eleven genes (the maximum number of genes present), chromosome 7 containing eight genes, and chromosomes 1, 4, and 10 containing only one gene. Except for chr4, ch9, and chr10, the HKL-related genes are dispersed randomly across all V. radiata chromosomes. Members of the TCS HP family can be found on chromosomes 5, 7, 9, and 10. Apart from chromosomes 1, 8, 9, and 10, members of the TCS RR family are found on all other chromosomes (Figure 4).
Gene duplication is dominant in the evolution of gene families because it provides the raw resources for the introduction of unique genes. The gene pool of plants has grown as a result of tandem or segmental gene duplication [74]. When investigating the putative genomic duplication events, three possible pairs of paralogs were discovered in the genome of V. radiata. In this study, VrHK1.1/VrHK1.2, VrHP1.1/VrHP1.2, and VrHP6.1/VrHP6.2 were among the duplicated pairs, discovered as a consequence of segmental duplication. Multiple pairs of V. radiata genes showed segmental duplication, indicating that segmental duplication is the primary cause of VrTCS gene expansion. Different plants, such as A. thaliana, S. bicolor, Chinese cabbage, and G. max, also showed a similar pattern of gene expansion [10,59,68].
The synonymous/nonsynonymous substitution rates and the Ka/Ks ratio were used to estimate the gene divergence mechanism. Ks and Ka modes for segmental duplication were computed to reflect the time of paralogous divergence and evolutionary trend in V. radiata. Three segment duplicates had Ka/Ks ratios ranging from 0.918083957 to 2.395882445. As a result, the divergent time spans 79.59 to 193.99 Mya (Table 3).

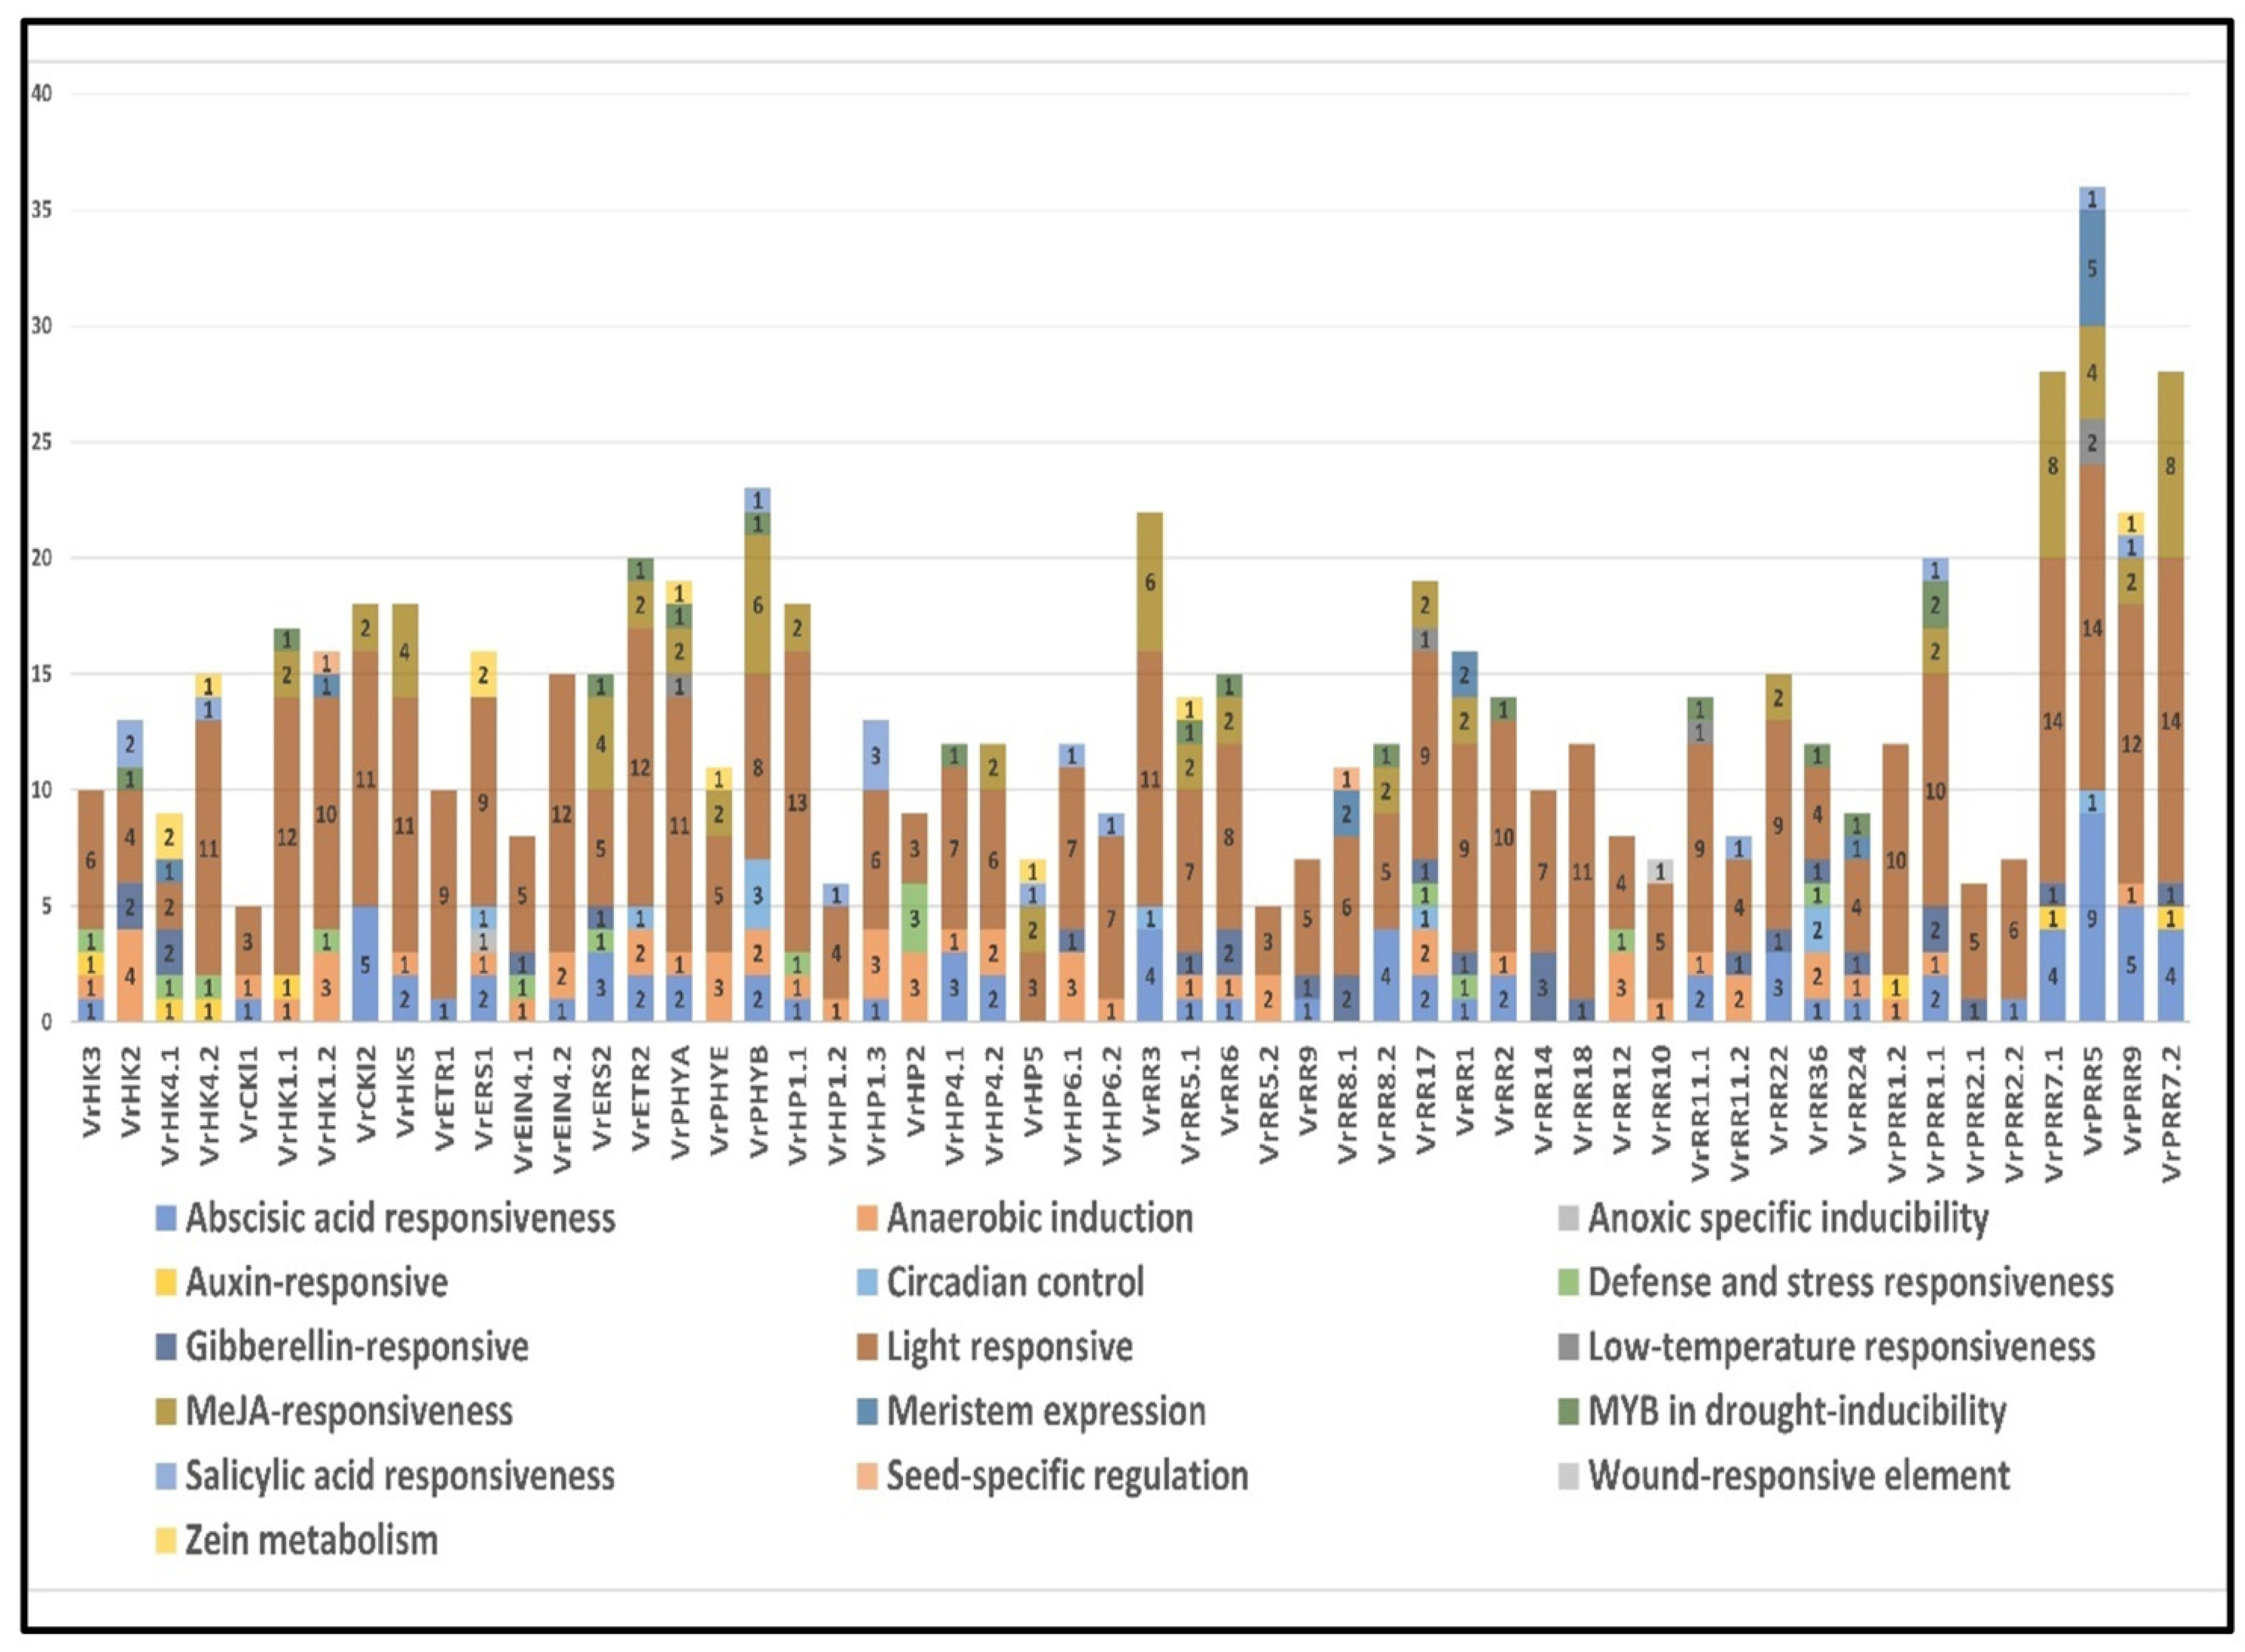
3.9. Promoter Analysis of V. radiata TCS Genes

The upstream sequences of the VrTCS genes were investigated in order to predict the cis-regulatory elements to gain a better understanding of their regulating expression and functional significance. In the upstream sequences of TCS genes, several hormone-related (gibberellins responsiveness, auxin, ethylene, MeJA responsiveness, abscisic acid responsiveness, and salicylic acid responsive) and abiotic stress-related (cold, drought, high temperatures, light, and high salinity) cis-regulatory elements were predicted [75]. All VrTCSs contained a large number of light responsiveness-related cis-regulatory elements (G-box, GATA motif, TCCC motif, ACE, box 4, and TCT motifs). It was discovered that nearly 20 VrTCSs genes contain gibberellin-responsive components (TATC-box, GARE motif, and P-box) and 33 VrTCSs genes contain an abscisic acid-responsive element (ABRE) that is associated with abscisic acid response. Elements of low-temperature responsive elements (LTR), stress and defense responsive elements, salicylic acid-responsive elements, and MeJA-responsive elements were also discovered in 4, 12, 12, and 24 VrTCSs, respectively. The occurrence of MBS (MYB binding site), TC-rich repeats (defense responsive element), and LTRs, all of which are associated with drought-inducibility, indicates that TCS is crucial for the growth of the plant and in response to abiotic stress [76]. TCS genes may potentially participate in development and growth processes involving hormone metabolism and signal transduction networks according to these findings (Figure 5; Supplementary Table S3; Figure S8).

3.10. Expression Analysis of V. radiata TCS Genes

The SRA-NCBI database was used to collect publicly available RNA-seq data from V. radiata in order to assess the expression of the 54 VrTCS genes under abiotic stress conditions. Drought tolerance studies in V. radiata were carried out across a wide range of time frames to collect data on abiotic stress. These experiments included CK3h (SRR3735179), CK6h (SRR3735193), CK18h (SRR3735547), CK24h (SRR3735572), SY3h (SRR3735589), SY6h (SRR3735674), SY18h (SRR3735739) and SY24h (SRR3735764) where “CK” refers to the group that served as the experiment’s control and “SY” refers to the group that served as the subject of the experiment. During various stages of drought 35 of the 54 possible TCS genes were found to be expressed while the remaining genes showed no expression. Only three genes, VrHP6.1, VrRR3, and VrRR6, showed higher levels of expression in the first three hours of drought exposure. However, as the duration of exposure increased, the expression of these genes decreased significantly. After being exposed to a drought environment for six hours, the genes VrHK4.2, VrHP4.2, VrHP1.3, VrHP2, VrRR5.1, and VrRR5.2 showed upregulated expression significantly. VrRR17 showed a slightly positive expression, while the other genes showed negative expression. After eighteen hours of exposure, the genes VrHK1.1, VrCKl2, VrHP1.2, VrPRR7.1, and VrPRR7.2 were highly upregulated, while VrHK1.2, VrRR10, VrRR11.1, VrRR11.2, VrRR14, VrHP4.1, and VrPHYB genes were moderately upregulated. The majority of TCS genes were highly upregulated after 24 h of drought stress exposure. Cytokinin-related genes VrHK1.1, VrHK1.2, VrHK2, VrHK3, VrCKL2, VrPHYB, and VrPHYE were found to be more expressed after 24 h of exposure compared to other time frames. Ethylene-related genes VrETR1, VrERS2, VrEIN4.1, and VrEIN4.2 were shown to be upregulated. Only one histidine phosphotransferase, VrHP4.1, was upregulated. Interestingly, the genes that were upregulated after six hours were downregulated after 24 h. Positive expression was also found in genes related to response regulators VrRR10, VrRR11.1, VrRR11.2, VrRR14, and VrRR36. These expression results show that as the duration of the stress increases, so do the expression levels of these genes, indicating that these genes promote plant growth and development under stress conditions (Figure 6A).
To provide information on the expression profiles of two-component system genes in leaves in response to drought stress, we used real-time RT-qPCR in V. radiata leaves to examine the expression of selected genes. Based on the VrTCS RNA-seq data from 54 genes, 12 genes were selected that were differentially expressed. After three weeks of germination, all drought stress (0 days, 3 days, and 5 days) was applied to the plants. Drought stress altered the expression of the following genes: VrHK2, VrHK3, VrHK4.2, VrPHYE, VrEIN4.1, VrHP2, VrHP4.1, VrHP6.1, VrRR3, VrRR5.2, VrRR10, and VrPRR9. These findings revealed that the overall expression trend of these genes obtained through qRT-PCR analysis was highly consistent with the RNA-seq data except for VrHK4.2 and VrPRR9. At 3 days of drought treatment, significant expression was observed in VrHK4.2, VrHP2, VrRR5.2, and VrRR10 whereas expression of these genes significantly dropped at the fifth day of drought treatments. It suggests their role in early response to drought stress. Except for VrHK4.2 and VrPRR9, the overall expression trend of these genes obtained through qRT-PCR analysis was highly consistent with the RNA-seq data. On the third and fifth days, the expression of the VrRR3 and VrHP6.1 genes was significantly reduced. The expression profiling revealed that as the drought duration increased, so did the expression of these genes (VrHK2, VrHK3, VrHK4.2, VrPHYE, VrHP4.1, and VrRR5.2), facilitating plant growth (Figure 6C).
The TCS interaction network identified three distinct TCS clusters as HKs, HPTs, and RRs. During the interaction, all of the HK proteins were linked to the HPTs proteins, which were then linked to the RRs protein. As a result, this TCS interaction network provides strong evidence that HPTs act as bridges or hub proteins between HK and RR in plants, transferring the HK phosphoryl group to the RR protein. TCS proteins have been shown to interact with one another, which has resulted in the discovery of several metabolic and regulatory pathways. Furthermore, all of the HKs, HPTs, and RRs in the interaction network provide evidence that they are involved in the cytokinin-activated signaling pathway, while ethylene-related proteins were involved in the ethylene-activated signaling pathway. Furthermore, some response regulators, such as VrRR3, VrRR6, VrRR5.1, and VrRR5.2, as well as histidine kinases, such as HK1.1, HK1, 2, HK2, HK3, and HK4.2, were found to be involved in the response to abiotic stimuli that activated the signaling cascade (Figure 6B).

4. Discussion

Several environmental conditions can inhibit plant growth, development, and productivity. Sessile plants have evolved different signaling pathways to help them survive under different environmental conditions [9]. The TCS gene family plays an important role in signal transduction and, as a result, this system aids the plant’s development and growth [1,3]. As a reason, identifying and functionally validating TCS involved in metabolic pathways and signal transduction may contribute to the development of such kinds of crops with enhanced characteristics, such as tolerance to stress, to address the challenges of global warming and climate change issues. These studies were conducted on a variety of model and non-model plant species.
TCS genes have been discovered in a variety of plant species, including A. thaliana [15], S. bicolor [59], melon cucumber [61], C. arietinum [58], B. rapa [68], C. lanatus [61], O. sativa [60], S. lycopersicum [64], and G. max [10]. In this study, 54 TCS-related genes were discovered in the entire genome of V. radiata. This number of genes is greater than the number of genes found in the genomes of A. thaliana, S. bicolor, P. trichocarpa, O. sativa, and L. japonicus, with 47, 37, 49, 37, and 40 genes, respectively, while the number is lower than the TCS genes of S. lycopersicum, T. aestivum, Z. latifolia, and G. max, with 65, 62, 69, and 98 genes, respectively [10,59,60,63,67,76]. VrTCSs are segmentally distributed on chromosomes. Only three pairs of duplicated genes were found. Numerous plants, including A. thaliana, S. bicolor, melon cucumber, C. arietinum, Chinese cabbage, watermelon, O. sativa, tomato, and G. max, have both tandem and segmental duplication in their genomes, suggesting that genome duplication is significant in gene family duplication. The Ks for segmental duplication in this investigation ranged from 1.585 to 2.545, corresponding to divergence times of 120.80 to 193.99 Mya. In tomato, the segmental duplication (Ks) value ranged from 0.79 to 0.60, with the tandem duplication period lasting from 5.96 to 26.55 million years ago and the divergence period lasting from 46 to 60 million years ago (Mya) [64]. The first duplication event in C. arietinum occurred 256.7 Mya ago, and the most recent random duplication occurred around 38.90 Mya ago, resulting in the emergence of a novel gene [58].
In phylogenetic analysis, VrTCS genes were found to be grouped into the same subgroups as those found in earlier investigations of O. sativa, Z. mays, S. lycopersicum, G. max, and A. thaliana. TCS subfamilies are present in all of these plants (HK, HP, and RR). As in A. thaliana, the conserved functional domains were employed to categorize the subfamilies in V. radiata. The Rec/Response domains in A. thaliana were used to distinguish between the types of RR family members. In V. radiata, the RR family clades shared the same domains [17].
The identification of cis-elements in the promoter regions of VrTCS genes assists in the discovery of switches that regulate gene transcription. Our analysis indicated that many drought-responsiveness, light-responsiveness, ABA-responsiveness, and hormone-responsiveness components were found to be associated with wound and stress responses. Similar components related to the TCS were found in the promoter regions of previous plants studied. Light-sensitive and hormone-associated components (TCA elements, gibberellin, and ethylene responsiveness element (GARE and ERE motifs)) were widespread in the HK family of dicots plants. Both biotic and abiotic stress-responsive components are found in the RR family. A substantial quantity of comparable stress-responsive elements have been discovered in cucumber and watermelon [61], comprising ABA-responsive, ABRE, drought-responsive, MBS, and components. In addition to these stress-responsiveness elements seen in Chinese cabbage, type-A RRs also contain GARP binding sites [68]. The type-B ARRs may bind to these promoters, activating transcription. It has been observed that transcriptional regulation type-B RRs are partially required for the activation of cytokinin-dependent type-A RRs. This implies that in addition to hormone signals, other genes that respond to ripening or stress conditions may potentially trigger the TCS genes. In our findings, we discovered a large number of these associated switches in their promoter regions.
Drought, salinity, and temperature are examples of abiotic factors that may affect plant growth and maturation. TCS are involved in abiotic stress responses, and thus their relative expressions have been studied to further understand their function in adapting to environmental changes. A. thaliana contains the AHK1 gene that helps the plant respond well to drought and salinity stress. In addition, the genes HK5 and EIN2 were responsive under saline conditions. In this investigation, the VrTCS gene family was shown to have a time-bound expression of drought stress. VrHK2, VrHK3, VrHK1.2, and ethylene receptors were found to be upregulated in seeds. CarHK2, 3, and 4 were found in all tissues of C. arietinum, whereas CarHK 1 and 5 were found in pods and shoots, and the response regulators were found in floral buds [58]. Members of the rice histidine kinase family were discovered to be expressed in the shoots/roots, while members of the histidine phosphotransfer family were discovered to be expressed in the leaves, and RR family members were discovered to be expressed in the stems, roots, leaves, and spikelets. Response regulator is expressed more in the melon’s root, implying that these genes are involved in cytokinin signaling. Similar findings were also observed in B. rapa [68].
Agriculture is most vulnerable to two abiotic stresses: salinity stress and water depletion. The vast majority of available evidence suggests that TCS genes are involved in a variety of environmental stresses. This study identified 54 VrTCS genes, some of which showed a negative response to drought stress, but the majority showed a positive response. Drought stress reduced the expression of these genes in A. thaliana but increased the expression of HPs and RRs in S. lycopersicum and S. bicolor. VrHK3, VrHK2, VrETR2, VrERS2, HP4.1, VrRR1, VrRR12, VrRR36, VrPRR2.2, VrPRR5, and VrPRR9 were upregulated in V. radiata under drought stress, whereas A. thaliana ARR1 and ARR12 were downregulated [18]. Some V. radiata genes related to response regulators (VrRR3, VrRR5.1, VrRR5.2, VrRR6, VrRR8.1, VrRR8.2, and VrRR17) were downregulated, and similar expression was also observed in Cicer response regulator 5 and 12 in drought stress conditions [58]. Only a few numbers of VrTCS genes were found to be silent. Expression analysis of drought environment depicted that the majority of TCS genes exhibit expression as the time of the water depletion increases. These findings of the TCS gene expression show how these genes respond to abiotic stresses.

5. Conclusions

In this investigation, we discovered 54 potential TCS protein family members, comprising 18 HK (L), 9 HPs, and 27 RRs. The categorization of proteins, domain architecture, gene structure, and evolutionary linkages with other species, gene duplication, and gene location on chromosomes were all carefully investigated. The sequence and domains of these TCSs were found to be highly conserved. TCS proteins from other plants seemed to have a closer phylogenetic connection with VrTCS proteins. Expression analysis of VrTCS genes revealed that some of the genes were expressed in early response to drought stress, while the majority of them were expressed in late response to drought stress. These findings give us valuable information on V. radiata TCS genes that will assist in the functional characterization of signal transduction pathways and in improving the plant’s stress tolerance.

Supplementary Materials

The following supporting information can be downloaded at: https://www.mdpi.com/article/10.3390/agronomy13040989/s1, Figure S1: Protein sequence alignment of histidine kinase and ethylene receptors. The boxes represent the conserved phosphorylation residue. Figure S2: Protein sequence alignment of phytochrome family and histidine phosphotransferase proteins. The boxes represent the conserved phosphorylation residue. Figure S3: Sequence alignment of all types of response regulators. Showing the conserved residue in their receiver domain. Figure S4: Conserved motifs present in the protein sequence of VrTCS. Figure S5: Phylogenetic tree of histidine kinase protein with different species and different symbols representing the different species HKs. HK1 family, HK2 family, HK5 family, Ethylene receptor, and phytochromes were represented by blue, red, brown, purple, and green colors. Figure S6: Phylogenetic tree of Histidine phosphotransferase proteins with other species. AHP1-like proteins were grouped in a separate clade and represented by red color, AHP2 protein represent by green color whereas blue and purple colored clade show AHP6-like and AHP4-like proteins respectively. Figure S7: Phylogenetic tree of Response regulator proteins with other species. Type-A RRs-like proteins were grouped in a separate clade and represented by red color, PRRRRs-like proteins represent by green color whereas blue and purple colored clades show Type-B-like and Type-C-like proteins respectively. Figure S8: Representation of all the cis-regulatory identified in VrTCS promoter sequences. Various colors show a different types of switches discovered in each corresponding sequence. Table S1: List of primers used in this study. Table S2: Conserved domain and cellular localization of VrTCS proteins. Table S3: Cis regulatory elements discovered in promoter region of VrTCS.

Author Contributions

Conceptualization, M.A.A., M.A.N. and F.A.; data curation, S.A.; formal analysis, M.A.A.; funding acquisition, F.A.; investigation, M.A.A. and S.A.; methodology, S.A. and N.A.; project administration, F.A. and A.A.S.; supervision, M.A.N., A.A.S. and M.A.A.; visualization, N.A. and H.S. writing—original draft, M.A.A.; writing—review and editing, M.A.N., H.S. and M.R. All authors have read and agreed to the published version of the manuscript.

Funding

This research received no external funding.

Data Availability Statement

All the data sets generated in this study are presented either in the manuscript or as Supplementary Files.

Acknowledgments

Authors thank Gyuhwa Chung, Korean Soybean Research Institute, Jinju, Republic of Korea for his support for proofreading the manuscript and provision of funds for Article Processing Charges.

Conflicts of Interest

The authors declare no conflict of interest.

References

  1. Kieber, J.J.; Schaller, G.E. Cytokinin Signaling in Plant Development. Development 2018, 145, dev149344. [Google Scholar] [CrossRef] [PubMed]
  2. Han, Y.; Zhang, C.; Yang, H.; Jiao, Y. Cytokinin Pathway Mediates APETALA1 Function in the Establishment of Determinate Floral Meristems in Arabidopsis. Proc. Natl. Acad. Sci. USA 2014, 111, 6840–6845. [Google Scholar] [CrossRef] [PubMed]
  3. Werner, T.; Schmülling, T. Cytokinin Action in Plant Development. Curr. Opin. Plant Biol. 2009, 12, 527–538. [Google Scholar] [CrossRef] [PubMed]
  4. Hwang, I.; Sheen, J. Two-Component Circuitry in Arabidopsis Cytokinin Signal Transduction. Nature 2001, 413, 383–389. [Google Scholar] [CrossRef] [PubMed]
  5. Urao, T.; Yamaguchi-Shinozaki, K.; Shinozaki, K. Two-Component Systems in Plant Signal Transduction. Trends Plant Sci. 2000, 5, 67–74. [Google Scholar] [CrossRef] [PubMed]
  6. Thomason, P.; Kay, R. Eukaryotic Signal Transduction via Histidine-Aspartate Phosphorelay. J. Cell Sci. 2000, 113, 3141–3150. [Google Scholar] [CrossRef]
  7. Mizuno, T. Plant Response Regulators Implicated in Signal Transduction and Circadian Rhythm. Curr. Opin. Plant Biol. 2004, 7, 499–505. [Google Scholar] [CrossRef]
  8. Schaller, G.E.; Kieber, J.J.; Shiu, S.-H. Two-Component Signaling Elements and Histidyl-Aspartyl Phosphorelays. Arab. Book 2008, 6, e0112. [Google Scholar] [CrossRef]
  9. Hwang, I.; Chen, H.-C.; Sheen, J. Two-Component Signal Transduction Pathways in Arabidopsis. Plant Physiol. 2002, 129, 500–515. [Google Scholar] [CrossRef]
  10. Mochida, K.; Yoshida, T.; Sakurai, T.; Yamaguchi-Shinozaki, K.; Shinozaki, K.; Tran, L.-S.P. Genome-Wide Analysis of Two-Component Systems and Prediction of Stress-Responsive Two-Component System Members in Soybean. DNA Res. 2010, 17, 303–324. [Google Scholar] [CrossRef]
  11. Kiba, T.; Naitou, T.; Koizumi, N.; Yamashino, T.; Sakakibara, H.; Mizuno, T. Combinatorial Microarray Analysis Revealing Arabidopsis Genes Implicated in Cytokinin Responses through the His→Asp Phosphorelay Circuitry. Plant Cell Physiol. 2005, 46, 339–355. [Google Scholar] [CrossRef]
  12. Lohrmann, J.; Buchholz, G.; Keitel, C.; Sweere, U.; Kircher, S.; Bäurle, I.; Kudla, J.; Schäfer, E.; Harter, K. Differential Expression and Nuclear Localization of Response Regulator-Like Proteins from Arabidopsis Thaliana. Plant Biol. 1999, 1, 495–505. [Google Scholar] [CrossRef]
  13. Mähönen, A.P.; Bishopp, A.; Higuchi, M.; Nieminen, K.M.; Kinoshita, K.; Törmäkangas, K.; Ikeda, Y.; Oka, A.; Kakimoto, T.; Helariutta, Y. Cytokinin Signaling and Its Inhibitor AHP6 Regulate Cell Fate During Vascular Development. Science 2006, 311, 94–98. [Google Scholar] [CrossRef]
  14. Gupta, P.; Yadav, C.; Singh, D.; Nongpiur, R.C.; Singla-Pareek, S.L.; Pareek, A. Two Component Mediated Stress Signaling in Plants: A Comparative Profiling in Monocots and Dicots. In Protein Kinases and Stress Signaling in Plants; Pandey, G.K., Ed.; John Wiley & Sons, Inc.: Hoboken, NJ, USA, 2020; pp. 1–19. ISBN 978-1-119-54157-8. [Google Scholar]
  15. Hutchison, C.E.; Li, J.; Argueso, C.; Gonzalez, M.; Lee, E.; Lewis, M.W.; Maxwell, B.B.; Perdue, T.D.; Schaller, G.E.; Alonso, J.M.; et al. The Arabidopsis Histidine Phosphotransfer Proteins Are Redundant Positive Regulators of Cytokinin Signaling. Plant Cell 2006, 18, 3073–3087. [Google Scholar] [CrossRef] [PubMed]
  16. West, A.H.; Stock, A.M. Histidine Kinases and Response Regulator Proteins in Two-Component Signaling Systems. Trends Biochem. Sci. 2001, 26, 369–376. [Google Scholar] [CrossRef]
  17. Tiwari, M.; Yadav, M.; Singh, B.; Pandey, V.; Nawaz, K.; Bhatia, S. Evolutionary and Functional Analysis of Two-component System in Chickpea Reveals CaRR13, a TypeB RR, as Positive Regulator of Symbiosis. Plant Biotechnol. J. 2021, 19, 2415–2427. [Google Scholar] [CrossRef] [PubMed]
  18. Gattolin, S.; Alandete-Saez, M.; Elliott, K.; Gonzalez-Carranza, Z.; Naomab, E.; Powell, C.; Roberts, J.A. Spatial and Temporal Expression of the Response Regulators ARR22 and ARR24 in Arabidopsis Thaliana. J. Exp. Bot. 2006, 57, 4225–4233. [Google Scholar] [CrossRef]
  19. Makino, S.; Kiba, T.; Imamura, A.; Hanaki, N.; Nakamura, A.; Suzuki, T.; Taniguchi, M.; Ueguchi, C.; Sugiyama, T.; Mizuno, T. Genes Encoding Pseudo-Response Regulators: Insight into His-to-Asp Phosphorelay and Circadian Rhythm in Arabidopsis Thaliana. Plant Cell Physiol. 2000, 41, 791–803. [Google Scholar] [CrossRef] [PubMed]
  20. Ishida, K.; Niwa, Y.; Yamashino, T.; Mizuno, T. A Genome-Wide Compilation of the Two-Component Systems in Lotus Japonicus. DNA Res. 2009, 16, 237–247. [Google Scholar] [CrossRef]
  21. Nongpiur, R.; Soni, P.; Karan, R.; Singla-Pareek, S.L.; Pareek, A. Histidine Kinases in Plants: Cross Talk between Hormone and Stress Responses. Plant Signal. Behav. 2012, 7, 1230–1237. [Google Scholar] [CrossRef]
  22. Le, D.T.; Nishiyama, R.; Watanabe, Y.; Mochida, K.; Yamaguchi-Shinozaki, K.; Shinozaki, K.; Tran, L.-S.P. Genome-Wide Expression Profiling of Soybean Two-Component System Genes in Soybean Root and Shoot Tissues under Dehydration Stress. DNA Res. 2011, 18, 17–29. [Google Scholar] [CrossRef] [PubMed]
  23. Schäfer, M.; Brütting, C.; Meza-Canales, I.D.; Großkinsky, D.K.; Vankova, R.; Baldwin, I.T.; Meldau, S. The Role of Cis -Zeatin-Type Cytokinins in Plant Growth Regulation and Mediating Responses to Environmental Interactions. J. Exp. Bot. 2015, 66, 4873–4884. [Google Scholar] [CrossRef] [PubMed]
  24. Zdarska, M.; Dobisová, T.; Gelová, Z.; Pernisová, M.; Dabravolski, S.; Hejátko, J. Illuminating Light, Cytokinin, and Ethylene Signalling Crosstalk in Plant Development. J. Exp. Bot. 2015, 66, 4913–4931. [Google Scholar] [CrossRef]
  25. Singh, D.; Singla-Pareek, S.L.; Pareek, A. Two-Component Signaling System in Plants: Interaction Network and Specificity in Response to Stress and Hormones. Plant Cell Rep. 2021, 40, 2037–2046. [Google Scholar] [CrossRef]
  26. Tran, L.-S.P.; Shinozaki, K.; Yamaguchi-Shinozaki, K. Role of Cytokinin Responsive Two-Component System in ABA and Osmotic Stress Signalings. Plant Signal. Behav. 2010, 5, 148–150. [Google Scholar] [CrossRef]
  27. Nair, R.M.; Schafleitner, R.; Lee, S.-H. (Eds.) The Mungbean Genome; Compendium of Plant Genomes; Springer: Cham, Switzerland, 2020; ISBN 978-3-030-20007-7. [Google Scholar]
  28. Cao, D.; Li, H.; Yi, J.; Zhang, J.; Che, H.; Cao, J.; Yang, L.; Zhu, C.; Jiang, W. Antioxidant Properties of the Mung Bean Flavonoids on Alleviating Heat Stress. PLoS ONE 2011, 6, e21071. [Google Scholar] [CrossRef] [PubMed]
  29. Uppalwar, S.V.; Garg, V.; Dutt, R. Seeds of Mung Bean (Vigna radiata (L.) R.Wilczek): Taxonomy, Phytochemistry, Medicinal Uses and Pharmacology. Curr. Bioact. Compd. 2021, 17, 220–233. [Google Scholar] [CrossRef]
  30. Yin, L.; Zhang, M.; Wu, R.; Chen, X.; Liu, F.; Xing, B. Genome-Wide Analysis of OSCA Gene Family Members in Vigna Radiata and Their Involvement in the Osmotic Response. BMC Plant Biol. 2021, 21, 408. [Google Scholar] [CrossRef] [PubMed]
  31. Sehrawat, N.; Yadav, M.; Sharma, A.K.; Kumar, V.; Bhat, K.V. Salt Stress and Mungbean (Vigna radiata (L.) Wilczek): Effects, Physiological Perspective and Management Practices for Alleviating Salinity. Arch. Agron. Soil Sci. 2019, 65, 1287–1301. [Google Scholar] [CrossRef]
  32. Bolser, D.; Staines, D.M.; Pritchard, E.; Kersey, P. Ensembl Plants: Integrating Tools for Visualizing, Mining, and Analyzing Plant Genomics Data. In Plant Bioinformatics; Edwards, D., Ed.; Methods in Molecular Biology; Springer: New York, NY, USA, 2016; Volume 1374, pp. 115–140. ISBN 978-1-4939-3166-8. [Google Scholar]
  33. Gish, W.; States, D.J. Identification of Protein Coding Regions by Database Similarity Search. Nat. Genet. 1993, 3, 266–272. [Google Scholar] [CrossRef]
  34. Bateman, A. The Pfam Protein Families Database. Nucleic Acids Res. 2004, 32, D138–D141. [Google Scholar] [CrossRef] [PubMed]
  35. Hulo, N. The PROSITE Database. Nucleic Acids Res. 2006, 34, D227–D230. [Google Scholar] [CrossRef] [PubMed]
  36. Schultz, J. SMART: A Web-Based Tool for the Study of Genetically Mobile Domains. Nucleic Acids Res. 2000, 28, 231–234. [Google Scholar] [CrossRef] [PubMed]
  37. Marchler-Bauer, A.; Derbyshire, M.K.; Gonzales, N.R.; Lu, S.; Chitsaz, F.; Geer, L.Y.; Geer, R.C.; He, J.; Gwadz, M.; Hurwitz, D.I.; et al. CDD: NCBI’s Conserved Domain Database. Nucleic Acids Res. 2015, 43, D222–D226. [Google Scholar] [CrossRef] [PubMed]
  38. Artimo, P.; Jonnalagedda, M.; Arnold, K.; Baratin, D.; Csardi, G.; de Castro, E.; Duvaud, S.; Flegel, V.; Fortier, A.; Gasteiger, E.; et al. ExPASy: SIB Bioinformatics Resource Portal. Nucleic Acids Res. 2012, 40, W597–W603. [Google Scholar] [CrossRef] [PubMed]
  39. Bendtsen, J.D.; Jensen, L.J.; Blom, N.; von Heijne, G.; Brunak, S. Feature-Based Prediction of Non-Classical and Leaderless Protein Secretion. Protein Eng. Des. Sel. 2004, 17, 349–356. [Google Scholar] [CrossRef]
  40. Yu, C.-S.; Cheng, C.-W.; Su, W.-C.; Chang, K.-C.; Huang, S.-W.; Hwang, J.-K.; Lu, C.-H. CELLO2GO: A Web Server for Protein SubCELlular LOcalization Prediction with Functional Gene Ontology Annotation. PLoS ONE 2014, 9, e99368. [Google Scholar] [CrossRef]
  41. Brown, G.R.; Hem, V.; Katz, K.S.; Ovetsky, M.; Wallin, C.; Ermolaeva, O.; Tolstoy, I.; Tatusova, T.; Pruitt, K.D.; Maglott, D.R.; et al. Gene: A Gene-Centered Information Resource at NCBI. Nucleic Acids Res. 2015, 43, D36–D42. [Google Scholar] [CrossRef]
  42. Hu, B.; Jin, J.; Guo, A.-Y.; Zhang, H.; Luo, J.; Gao, G. GSDS 2.0: An Upgraded Gene Feature Visualization Server. Bioinformatics 2015, 31, 1296–1297. [Google Scholar] [CrossRef]
  43. Lescot, M. PlantCARE, a Database of Plant Cis-Acting Regulatory Elements and a Portal to Tools for in Silico Analysis of Promoter Sequences. Nucleic Acids Res. 2002, 30, 325–327. [Google Scholar] [CrossRef]
  44. Kumar, S.; Stecher, G.; Li, M.; Knyaz, C.; Tamura, K. MEGA X: Molecular Evolutionary Genetics Analysis across Computing Platforms. Mol. Biol. Evol. 2018, 35, 1547–1549. [Google Scholar] [CrossRef] [PubMed]
  45. Goodstein, D.M.; Shu, S.; Howson, R.; Neupane, R.; Hayes, R.D.; Fazo, J.; Mitros, T.; Dirks, W.; Hellsten, U.; Putnam, N.; et al. Phytozome: A Comparative Platform for Green Plant Genomics. Nucleic Acids Res. 2012, 40, D1178–D1186. [Google Scholar] [CrossRef] [PubMed]
  46. Larkin, M.A.; Blackshields, G.; Brown, N.P.; Chenna, R.; McGettigan, P.A.; McWilliam, H.; Valentin, F.; Wallace, I.M.; Wilm, A.; Lopez, R.; et al. Clustal W and Clustal X Version 2.0. Bioinformatics 2007, 23, 2947–2948. [Google Scholar] [CrossRef] [PubMed]
  47. Bailey, T.L.; Johnson, J.; Grant, C.E.; Noble, W.S. The MEME Suite. Nucleic Acids Res. 2015, 43, W39–W49. [Google Scholar] [CrossRef]
  48. Chen, C.; Chen, H.; Zhang, Y.; Thomas, H.R.; Frank, M.H.; He, Y.; Xia, R. TBtools: An Integrative Toolkit Developed for Interactive Analyses of Big Biological Data. Mol. Plant 2020, 13, 1194–1202. [Google Scholar] [CrossRef]
  49. Rozas, J.; Ferrer-Mata, A.; Sánchez-DelBarrio, J.C.; Guirao-Rico, S.; Librado, P.; Ramos-Onsins, S.E.; Sánchez-Gracia, A. DnaSP 6: DNA Sequence Polymorphism Analysis of Large Data Sets. Mol. Biol. Evol. 2017, 34, 3299–3302. [Google Scholar] [CrossRef]
  50. Zhao, Y.; Li, M.-C.; Konaté, M.M.; Chen, L.; Das, B.; Karlovich, C.; Williams, P.M.; Evrard, Y.A.; Doroshow, J.H.; McShane, L.M. TPM, FPKM, or Normalized Counts? A Comparative Study of Quantification Measures for the Analysis of RNA-Seq Data from the NCI Patient-Derived Models Repository. J. Transl. Med. 2021, 19, 269. [Google Scholar] [CrossRef]
  51. Mering, C.V. STRING: A Database of Predicted Functional Associations between Proteins. Nucleic Acids Res. 2003, 31, 258–261. [Google Scholar] [CrossRef]
  52. Bakhtiarizadeh, M.R.; Najaf-Panah, M.J.; Mousapour, H.; Salami, S.A. Versatility of Different Melting Temperature (Tm) Calculator Software for Robust PCR and Real-Time PCR Oligonucleotide Design: A Practical Guide. Gene Rep. 2016, 2, 1–3. [Google Scholar] [CrossRef]
  53. Ye, J.; Coulouris, G.; Zaretskaya, I.; Cutcutache, I.; Rozen, S.; Madden, T.L. Primer-BLAST: A Tool to Design Target-Specific Primers for Polymerase Chain Reaction. BMC Bioinform. 2012, 13, 134. [Google Scholar] [CrossRef]
  54. Bas, A.; Forsberg, G.; Hammarstrom, S.; Hammarstrom, M.-L. Utility of the Housekeeping Genes 18S RRNA, Beta-Actin and Glyceraldehyde-3-Phosphate-Dehydrogenase for Normalization in Real-Time Quantitative Reverse Transcriptase-Polymerase Chain Reaction Analysis of Gene Expression in Human T Lymphocytes. Scand. J. Immunol. 2004, 59, 566–573. [Google Scholar] [CrossRef] [PubMed]
  55. Kim, B.-R.; Nam, H.-Y.; Kim, S.-U.; Kim, S.-I.; Chang, Y.-J. Normalization of Reverse Transcription Quantitative-PCR with Housekeeping Genes in Rice. Biotechnol. Lett. 2003, 25, 1869–1872. [Google Scholar] [CrossRef] [PubMed]
  56. Chang, C.; Stadler, R. Ethylene Hormone Receptor Action InArabidopsis. Bioessays 2001, 23, 619–627. [Google Scholar] [CrossRef] [PubMed]
  57. Clack, T.; Mathews, S.; Sharrock, R.A. The Phytochrome Apoprotein Family InArabidopsis Is Encoded by Five Genes: The Sequences and Expression OfPHYD AndPHYE. Plant Mol. Biol. 1994, 25, 413–427. [Google Scholar] [CrossRef] [PubMed]
  58. Ahmad, B.; Azeem, F.; Ali, M.A.; Nawaz, M.A.; Nadeem, H.; Abbas, A.; Batool, R.; Atif, R.M.; Ijaz, U.; Nieves-Cordones, M.; et al. Genome-Wide Identification and Expression Analysis of Two Component System Genes in Cicer Arietinum. Genomics 2020, 112, 1371–1383. [Google Scholar] [CrossRef]
  59. Zameer, R.; Sadaqat, M.; Fatima, K.; Fiaz, S.; Rasul, S.; Zafar, H.; Qayyum, A.; Nashat, N.; Raza, A.; Shah, A.N.; et al. Two-Component System Genes in Sorghum Bicolor: Genome-Wide Identification and Expression Profiling in Response to Environmental Stresses. Front. Genet. 2021, 12, 794305. [Google Scholar] [CrossRef]
  60. Du, L.; Jiao, F.; Chu, J.; Jin, G.; Chen, M.; Wu, P. The Two-Component Signal System in Rice (Oryza sativa L.): A Genome-Wide Study of Cytokinin Signal Perception and Transduction. Genomics 2007, 89, 697–707. [Google Scholar] [CrossRef]
  61. He, Y.; Liu, X.; Zou, T.; Pan, C.; Qin, L.; Chen, L.; Lu, G. Genome-Wide Identification of Two-Component System Genes in Cucurbitaceae Crops and Expression Profiling Analyses in Cucumber. Front. Plant Sci. 2016, 7, 899. [Google Scholar] [CrossRef]
  62. Liu, P.; Wang, S.; Wang, X.; Yang, X.; Li, Q.; Wang, C.; Chen, C.; Shi, Q.; Ren, Z.; Wang, L. Genome-Wide Characterization of Two-Component System (TCS) Genes in Melon (Cucumis melo L.). Plant Physiol. Biochem. 2020, 151, 197–213. [Google Scholar] [CrossRef]
  63. Singh, G.; Kumar, R. Genome-Wide Insilico Analysis of Plant Two Component Signaling System in Woody Model Plant Populus Trichocarpa. Res. Plant Biol. 2012, 2, 13–23. [Google Scholar]
  64. Firon, N.; Pressman, E.; Meir, S.; Khoury, R.; Altahan, L. Ethylene Is Involved in Maintaining Tomato (Solanum lycopersicum) Pollen Quality under Heat-Stress Conditions. AoB Plants 2012, 2012, pls024. [Google Scholar] [CrossRef] [PubMed]
  65. Ishida, K.; Yamashino, T.; Nakanishi, H.; Mizuno, T. Classification of the Genes Involved in the Two-Component System of the Moss Physcomitrella patens. Biosci. Biotechnol. 2010, 74, 2542–2545. [Google Scholar] [CrossRef] [PubMed]
  66. Chu, Z.X.; Ma, Q.; Lin, Y.X.; Tang, X.L.; Zhou, Y.Q.; Zhu, S.W.; Fan, J.; Cheng, B.J. Genome-Wide Identification, Classification, and Analysis of Two-Component Signal System Genes in Maize. Genet. Mol. Res. 2011, 10, 3316–3330. [Google Scholar] [CrossRef] [PubMed]
  67. He, L.; Zhang, F.; Wu, X.; Hu, Y.; Dong, L.; Dewitte, W.; Wen, B. Genome-Wide Characterization and Expression of Two-Component System Genes in Cytokinin-Regulated Gall Formation in Zizania Latifolia. Plants 2020, 9, 1409. [Google Scholar] [CrossRef] [PubMed]
  68. Liu, Z.; Zhang, M.; Kong, L.; Lv, Y.; Zou, M.; Lu, G.; Cao, J.; Yu, X. Genome-Wide Identification, Phylogeny, Duplication, and Expression Analyses of Two-Component System Genes in Chinese Cabbage (Brassica rapa ssp. Pekinensis). DNA Res. 2014, 21, 379–396. [Google Scholar] [CrossRef] [PubMed]
  69. Gahlaut, V.; Mathur, S.; Dhariwal, R.; Khurana, J.P.; Tyagi, A.K.; Balyan, H.S.; Gupta, P.K. A Multi-Step Phosphorelay Two-Component System Impacts on Tolerance against Dehydration Stress in Common Wheat. Funct. Integr. Genomics. 2014, 14, 707–716. [Google Scholar] [CrossRef] [PubMed]
  70. Urao, T.; Yakubov, B.; Satoh, R.; Yamaguchi-Shinozaki, K.; Seki, M.; Hirayama, T.; Shinozaki, K. A Transmembrane Hybrid-Type Histidine Kinase in Arabidopsis Functions as an Osmosensor. Plant Cell 1999, 11, 1743–1754. [Google Scholar] [CrossRef]
  71. Franklin, K.A.; Larner, V.S.; Whitelam, G.C. The Signal Transducing Photoreceptors of Plants. Int. J. Dev. Biol. 2005, 49, 653–664. [Google Scholar] [CrossRef]
  72. Filiault, D.L.; Wessinger, C.A.; Dinneny, J.R.; Lutes, J.; Borevitz, J.O.; Weigel, D.; Chory, J.; Maloof, J.N. Amino Acid Polymorphisms in Arabidopsis Phytochrome B Cause Differential Responses to Light. Proc. Natl. Acad. Sci. USA 2008, 105, 3157–3162. [Google Scholar] [CrossRef]
  73. Farré, E.M.; Liu, T. The PRR Family of Transcriptional Regulators Reflects the Complexity and Evolution of Plant Circadian Clocks. Curr. Opin. Plant Biol. 2013, 16, 621–629. [Google Scholar] [CrossRef]
  74. Panchy, N.; Lehti-Shiu, M.; Shiu, S.-H. Evolution of Gene Duplication in Plants. Plant Physiol. 2016, 171, 2294–2316. [Google Scholar] [CrossRef] [PubMed]
  75. Zhang, W.; Ruan, J.; Ho, T.-H.D.; You, Y.; Yu, T.; Quatrano, R.S. Cis-Regulatory Element Based Targeted Gene Finding: Genome-Wide Identification of Abscisic Acid- and Abiotic Stress-Responsive Genes in Arabidopsis Thaliana. Bioinformatics 2005, 21, 3074–3081. [Google Scholar] [CrossRef] [PubMed]
  76. Zhao, J.-P.; Jiang, X.-L.; Zhang, B.-Y.; Su, X.-H. Involvement of MicroRNA-Mediated Gene Expression Regulation in the Pathological Development of Stem Canker Disease in Populus Trichocarpa. PLoS ONE 2012, 7, e44968. [Google Scholar] [CrossRef] [PubMed]
Figure 1. Domain architecture of V. radiata TCS proteins. Different colored shapes represent different domains.
Agronomy 13 00989 g001
Figure 2. Representation of V. radiata TCS gene family’s conserved motif and gene structure. In every gene structure, the yellow bar represents the exon, while the black line represents the intron part of the corresponding gene, and the blue bars show the untranslated region (UTR). In conserved motifs, distinct colors represent different motifs.
Agronomy 13 00989 g002
Figure 3. Evolutionary analysis of VrTCS with other plant species. The red color clades represented histidine kinase, blue represents the response regulators and the histidine phosphotransfer is represented by green colors.
Agronomy 13 00989 g003
Figure 4. Representation of potential VrTCS genes on chromosomes. The circular bar scale indicates the length of the chromosomes in MBs and the numbers in the circular bar represent chromosomes number. The duplicated gene pair is represented by colored lines.
Agronomy 13 00989 g004
Figure 5. The cis-regulatory components of V. radiata are graphically shown. Various colors represent various types of cis-elements and the number on the bars shows the number of that element present in that gene.
Agronomy 13 00989 g005
Figure 6. (A) Heat map representation of VrTCS genes under drought stress. The blue color represents gene down-regulation, the red color represents gene up-regulation, and the skin color represents gene null regulation. (B) VrTCS protein–protein interaction. The genes involved in cytokinin-activated signaling pathways were colored red, while the genes involved in ethylene-activated signaling pathways were colored blue. The proteins that respond to abiotic stimuli were highlighted in green. (C) TCS gene expression profiling in response to drought stress. The data represent the means (standard deviations) of three biological replicates. The vertical bars represent standard deviations and (*) represents the significantly up regulation of the genes.
Agronomy 13 00989 g006
Table 2. Genomic features of VrTCS.
Locus IDGene NameIsoelectric Point (PI)Molecular Weight (Da)Instability IndexAliphatic IndexGRAVYProtein Length (Amino Acids)Chr No.No. of ExonG StartG EndCellular Localization
HK Family
LOC106755439VrHK36.7114,68237.6193.55−0.1071028Un10110,644118,425Plasma Membrane
LOC106764676VrHK27.2134,09843.7687.55−0.221190C614479,116488,795Plasma Membrane
LOC106777844VrHK4.16.67110,95036.1989.42−0.124990C111416,816,3221,683,310Cytoplasmic
LOC106770782VrHK4.26.82111,43033.6686.49−0.174999C1124,438,9614,447,994Cytoplasmic
LOC106770468VrCKl16.82111,43033.9890.75−0.1151060C8728,809,95828,814,950Plasma Membrane
LOC106777758VrHK1.16.18141,43941.2690.86−0.2231265C11136,536,7596,543,727Plasma Membrane
LOC106768916VrHK1.28.31137,83840.2289.76−0.2531234C7132,505,1032,511,396Plasma Membrane
LOC106761316VrCKl24.99109,37456.9782.21−0.445972C51320,096,52820,101,731Nuclear
LOC106763060VrHK55.15114,12754.9577.67−0.5671011C613315,594,33831,567,102Nuclear
LOC106756118VrETR18.3183,132.240.46107.20.122742C2724,449,04724,457,030Plasma Membrane
LOC106757732VrERS16.3670,848.141.01102.40.031636C377,678,5377,683,030Plasma Membrane
LOC106754157VrEIN4.16.9185,246.935.961010.053760Un21,092,8321,096,427Plasma Membrane
LOC106754157VrEIN4.26.6585,181.136.55103.30.086759Un21,098,9891,102,570Plasma Membrane
LOC106772158VrERS28.0583,779.441.93103.90.085757C8535,402,75535,407,049Plasma Membrane
LOC106772500VrETR26.2884,271.933.7897.530.111760C831,031,5091,035,564Plasma Membrane
LOC106771983VrPHYA6.09123,96147.2393.94−0.0791123C8731,264,70131,270,514Cytoplasmic
LOC106760765VrPHYE5.69125,31246.7490.79−0.1731121C544,573,6544,579,012Cytoplasmic, Plasma Membrane,
LOC106754114VrPHYB5.69125,67745.8593.98−0.1161131Un410,54117,443Cytoplasmic
HPTs
LOC106775067VrHP1.14.817,63142.5388.65−0.254155C10718,301,33816,303,340Cytoplasmic, Extracellular
LOC106767217VrHP1.24.7417,736.243.9390.45−0.223154C7649,140,07349,141,539Cytoplasmic, Nuclear
LOC106771462VrHP1.35.0316,565.737.794.73−0.34146C8632,351,13932,352,533Nuclear
LOC106771501VrHP25.4517,067.443.3374.8−0.361150C8626,939,46526,942,841Nuclear
LOC106773913VrHP4.18.6817,413.762.0771.85−0.746151C961,290,4831,292,013Nuclear
LOC106761115VrHP4.28.5923,040.536.0379.29−0.365198C5631,782,31231,785,137Nuclear
LOC106760377VrHP54.5312,940.549.0670.27−0.48111C5416,465,48916,467,894Nuclear, Cytoplasmic
LOC106773969VrHP6.15.9417,971.544.390.71−0.271156C96547,257548,917Extracellular
LOC106761820VrHP6.27.5925,968.948.2889.69−0.116223C5525,414,24425,415,627Extracellular, Plasma Membrane
Type-A RRs
LOC106760963VrRR34.8125,479.866.9388.06−0.309232C557,566,2407,568,017Nuclear
LOC106766897VrRR5.17.6322,881.755.32103.1−0.143206C7535,245,72635,247,771Nuclear
LOC106758083VrRR67.721,905.257.5791.09−0.116202C4515,357,96715,359,998Nuclear, Chloroplast
LOC106767155VrRR5.26.7622,762.555.51102.1−0.121206C7535,254,95935,257,043Nuclear, Cytoplasmic
LOC106752532VrRR95.6927,500.971.2674.98−0.828243Un5359,726361,726Nuclear
LOC106779256VrRR8.15.7220,486.659.8288.72−0.401179Un5344,091345,589Nuclear
LOC106760951VrRR8.24.9524,924.768.9893.93−0.276219C5426,430,47226,431,946Nuclear, Plasma Membrane
LOC106759802VrRR178.6915,785.547.5494.69−0.208143C559,332,6869,333,984Nuclear, Extracellular
Type-B RRs
LOC106768205VrRR15.8477,305.445.0582.15−0.393706C7748,240,05048,244,152Nuclear
LOC106760138VrRR26.0773,630.946.0381.08−0.441673C56734,320738,195Nuclear
LOC106777889VrRR146.1568,215.756.7374.84−0.49620C11717,020,13517,027,339Nuclear
LOC106762533VrRR186.2173,998.241.9577.94−0.562670C5618,903,24218,907,979Nuclear
LOC106757890VrRR125.4473,702.248.2176.48−0.516677C3611,915,19411,920,109Nuclear
LOC106763713VrRR106.467,500.741.8776.44−0.504613C6932,044,56232,048,926Nuclear
LOC106777203VrRR11.15.5764,93048.3776.71−0.527578C2622,436,39322,440,444Nuclear
LOC106766713VrRR11.25.0665,044.156.9476.23−0.503578C7520,462,82420,467,554Nuclear
Type-C RRs
LOC106754035VrRR226.915,514.924.2872.1−0.395138Un2964,858965,390Cytoplasmic
LOC106757536VrRR368.4916,082.726.0984.48−0.275143C333,714,2563,715,525Chloroplast, Mitochondrial
LOC106756903VrRR247.9414,994.347.1488.65−0.382133C323,954,7023,955,257Nuclear, Mitochondrial
PRRs
LOC106769035VrPRR1.25.6763,861.353.1473.33−0.642570C7738,576,82438,582,446 Nuclear
LOC106756669VrPRR1.15.9562,408.757.4966.68−0.724557C3610,571,69210,576,727Nuclear
LOC106777717VrPRR2.15.8962,525.556.8167.57−0.668560C11133,330,6883,336,996Nuclear
LOC106769136VrPRR2.26.2262,034.55471.81−0.573554C71329,778,48629,785,007Nuclear
LOC106754416VrPRR7.17.5480,057.943.7368.81−0.734737Un9279,157313,750Nuclear
LOC106760140VrPRR56.572,478.742.3666.99−0.656655C58404,026408,131Nuclear
LOC106780351VrPRR96.0574,267.344.6467.32−0.656675Un1015,08720,882Nuclear
LOC106754416VrPRR7.27.5481,386.443.6769.52−0.721749Un9279,157313,750Nuclear
Table 3. Divergence time and duplicated gene pairs in VrTCS.
Gene Duplication PairsKaKsKa/KsDivergence Time Mya (Million Years Ago)Type of Duplication
VrHK1./VrHK1.23.4631.5852.185120.80Segmental
VrHP1.1/VrHP1.26.0982.5452.396193.99Segmental
VrHP6.1/VrHP6.22.2942.4990.9180190.46Segmental
Disclaimer/Publisher’s Note: The statements, opinions and data contained in all publications are solely those of the individual author(s) and contributor(s) and not of MDPI and/or the editor(s). MDPI and/or the editor(s) disclaim responsibility for any injury to people or property resulting from any ideas, methods, instructions or products referred to in the content.

