Article

Study of the Humification Process and Humic Acid-like Structure Characteristics of Kitchen Waste with the Addition of Biochar

1
College of Resource and Environmental Science, Jilin Agricultural University, Changchun 130118, China
2
College of Landscape Architecture, Changchun University, Changchun 130022, China
*
Author to whom correspondence should be addressed.
Agronomy 2023, 13(2), 465; https://doi.org/10.3390/agronomy13020465
Submission received: 13 December 2022 / Revised: 16 January 2023 / Accepted: 1 February 2023 / Published: 4 February 2023
(This article belongs to the Special Issue Biochar for Sustainable Farming and Recultivation)

Abstract

:
The majority of the studies on humification culture presently use livestock and poultry manure as the primary raw material. There is significantly less research on the changes and structural characteristics of humic acid-like compounds (HAL) formed by humification using real food waste as the raw material. This paper aims to study the changes in humic components and the structure of HAL in the humification process through the addition of biochar to pre-meal waste and post-meal swill as the primary raw materials. Kitchen waste + corn straw (KC) and kitchen waste + corn straw + biochar carbon (KCBr) were humified for 24 days, respectively, using the indoor static composting method, where the samples were collected at days 0, 12, and 24 of incubation. The HAL were analyzed using elemental analysis, infrared spectroscopy, and differential thermal techniques. The results demonstrated that KCBr first entered the high-temperature phase, which lasted for 12 days above 50 °C. The total organic carbon (TOC) demonstrated a decreasing trend in both treatments, while the total nitrogen (TN) demonstrated an upward trend. The HAL and fulvic acid-like (FAL) contents of the two treatments increased and decreased with an increase in the incubation time, respectively. The relative HAL content and humification index (PQ%) of KCBr and KC at the end of humification were 22.76% and 19.69% and 74.30%, and 73.11%, respectively. In terms of the HAL structure, the KCBr treatment demonstrated lowered condensation, reduced oxidation, decreased aliphatic, enhanced aromatization, and increased thermal stability of HAL compared with the KC treatment.

1. Introduction

Biochar, a type of insoluble, stable, highly aromatic substance with high solid carbon content, is obtained through the thermal cracking and carbonization of agricultural wastes such as crop straw, wood material, livestock, poultry manure, and other biochars at high temperatures (<700 °C) under hypoxia or low oxygen environment [1]. Alkyl and aromatic groups comprise the majority of the rich carbon-containing components that constitute biochar [2]. Biochar offers an ideal habitat for microbial populations considering its significant adsorption capacity, large specific surface area, and rich pore structure [3]. The addition of biochar significantly alters the structure of the microbial community, increases microbial activity and diversity, and promotes further degradation of organic matter, thereby affecting the stability of the soil organic carbon [4,5]. Biochar has recently been proposed as a new additive in the improvement of the humification process. Studies have indicated that adding biochar to the same heap of material during composting can rapidly increase the temperature of the heap—usually 6–7 d earlier when the heap enters the high-temperature period—and can also extend the high-temperature period, thereby promoting the degradation rate of organic matter and significantly accelerating the composting process [6,7,8,9]. The application of biochar increases the porosity of the reactor, thereby improving its water retention [10]. The high pH value of biochar, which is typically alkaline, may raise the pH [7,8,9] of the reactor. Bruno et al. [11] believed that biochar can effectively improve the carbon content of humus in livestock and poultry manure compost. Bruno et al. [11] applied biochar in the composting process to enrich the humus in a heap. Here, the humic acid content in the alkali extract of the fertilizer reached 90%. Biochar generates humic acid and other organic matter in the pyrolysis process that can adsorb to the surface of biochar and consequently enter the soil [12,13]. This directly affects the amount and structure of the soil humic matter.
Restaurant kitchen waste comprises food waste and waste edible oil generated from food processing, catering, food service, and other activities [14]. The annual output of restaurant waste in China is approximately 60 million tons [15]. The effectiveness of resource recycling may be considerably increased if the organic matter can be transformed into organic fertilizer. Kitchen waste requires the addition of exogenous materials with a high C/N ratio considering their high water content, acidic pH value, and low C/N value. This makes it more complicated to pile rot independently than the other types of waste due to its lower content of simple, inert substances and heavy metals (such as corn straw, biochar charcoal, etc.). Returning corn straw to the field is an important means for agricultural waste resources, soil fertility, and the maintenance and improvement of soil structure [16]. Corn straw has a high C/N value and low water content, which can effectively address the deficiency of kitchen waste composting. Composting kitchen waste and corn straws are, therefore, an effective way of resource utilization. Humus will be formed when the corn stalk decomposes, a process that requires energy.
Humification, typically described as the transformation of solid waste into a stable humic substance (HS) [17], is the reverse of mineralization in that it creates more complex and stable compounds from lesser stable ones [18]. HS releases a large number of lipid compounds in the process of humification, which are then decomposed. The final assemblage of HS comprises nitrogenous alkyl structures, peptides, and other compounds that are difficult to oxidize [19]. Haride et al. [20] noted that the carboxyl group, as an intermediate product in the process of the generation of HS, plays an important role in increasing the number of lipid compounds and the unsaturation of HS. Wu et al. [21] demonstrated that most of the carboxyl groups were derived from aromatic compounds. Amir et al. [19] concluded from elemental analysis that the H content of HA decreased, the ratio of H/C and C/N decreased, and N and S contents increased during humification. The proportion of HS in macromolecules and small molecules changed significantly before and after humification. The HS generated during humification may be divided into HA recombination and FA light component, with HAL being one of the main components of organic materials. Compared with the “mature” humic acids in the soil, HAL is relatively “immature” during the process of humification [22,23]. It, however, contains a large number of oxygen-containing groups, such as carboxyl, phenolic hydroxyl, alcohol hydroxyl, methoxyl, and quinone groups [24]. If the current hot spot material–biochar–is selected for humification culture, can its humification process be efficiently promoted? What are the differences between the structural characteristics of the culture product–humic acid-like–and the treatment without biochar?
Aimed at these two problems, this study used the indoor static composting method, with biochar as the conditioner of kitchen waste, and carried out a comparative experiment with the treatment without adding biochar. The HAL were analyzed using elemental analysis, infrared spectroscopy, and differential thermal techniques, which provided a basis for clarifying whether there were differences in the structure of HAL obtained by adding biochar and whether adding biochar could efficiently promote the humification process.

2. Materials and Methods

2.1. Kitchen Waste and Pretreatment

The kitchen waste (including pre-meal waste and post-meal waste) used in the experiment was collected from the student canteen of Changchun University. The collected kitchen waste was cleared of sundries and other hard, difficult-to-break substances, washed several times with deionized water to remove the upper layer of oil, drained, spread on a clean plastic sheet, placed in a ventilated area for 1–2 h, crushed with a grinder, and finally mixed with a homogenizer.

2.2. Corn Straw and Pretreatment

The corn straw (leaf and stem) used in the experiment was collected from the teaching experimental base of Jilin Agricultural University (43°48′43.57″ N, 125°23′38.50″ E), Jilin province, Changchun, China. The straw was placed in a ventilated area for natural air drying. The dried corn straw was crushed using a grinder with a particle size of ≤3 cm.

2.3. Biochar

The biochar used in the experiment was purchased from Henan Lize Environmental Protection Technology Co., Ltd., Zhengzhou, China.
Biochar was made from corn straw under anaerobic conditions at 500–600 °C. Before preparing the biochar, the corn straw was dried in an oven at 80 °C for 12 h. The corn straw was put into the carbonization furnace, vacuumized, and the furnace was then filled with nitrogen 3 times. In the oxygen-free state (filled with high-purity nitrogen), the temperature was slowly raised to 400 °C (the initial set temperature of the carbonization furnace was 200 °C, increased by 100 °C every 3 h).
The basic physical and chemical properties of the above tested materials are shown in Table 1.

2.4. Compost Culture Experiment

The additive and kitchen waste were thoroughly mixed in a foam box with a volume of 60 L. The same treatment was packed in three foam boxes for indoor static composting. The sampling method was the multi-point mixing method. The same amount (50 g) of samples was taken from the upper layer, middle layer, and lower layer of the pile, respectively, and mixed evenly. In terms of the dry matter, kitchen waste:corn straw was in the ratio of 2:1, denoted as KC. Kitchen waste:corn straw:biochar was in the ratio of 4:2:1, denoted as KCBr. The water content was adjusted to a range of approximately 60%, the pH was natural, C/N was 25–30:1, and the material was turned every 48 h. The compost was incubated for 24 days. Samples (fresh) were collected every 3 days; they were immediately used for the determination of pH value, water content, and electrical conductivity (EC). Samples for determination of various humic substances were collected every 12 days. The samples were placed in a cool, dry, ventilated area, and air-dried (air-dried sample).

2.5. Analysis Method of Basic Physical and Chemical Properties of Compost

The weight-loss method was used for moisture content calculation. pH measuring apparatus was used for pH value. A conductivity meter was used for EC calculation. The improved Kjeldahl method for nitrogen determination was used for TN calculation.

2.6. Grouping of Humus Acid-like Substances Extraction

The HAL and FAL were extracted from the culture samples as per the modification method of soil humus composition [25]. The total organic carbon (TOC) and the content of each component were determined using the potassium dichromate plus thermal oxidation method [26]. The relative content and proportion of HAL (PQ value) were then calculated.
HAL   relative   content   formula :   HAL = HAL ( g / k g ) TOC ( g / k g ) × 100 %
The   calculation   formula   of   PQ   value :   PQ = HAL ( g / k g ) HAL ( g / k g ) + FAL ( g / k g ) × 100 %

2.7. Determination of Optical Properties

A UV-1600pc ultraviolet visible spectrophotometer was used to measure the absorbance values at 400 nm, 465 nm, 600 nm, and 665 nm and calculate the E4/E6, ΔLgK (hue factor) value:
ΔLgK = LgK400 − LgK600
E4/E6 = K465/K665

2.8. Extraction and Purification of Humus Acid-like Substances

The procedure followed was as per the method recommended by the International Humus Association for operation [27]. The process is described as follows: 5 g of dried material sample were weighed and added to the centrifuge tube, to which 1 mol·L−1 HCl solution was added and left to stand for 1 h. The solid–liquid ratio was then adjusted to 1:10 with 0.1 mol·L−1 HCl. The supernatant was subsequently discarded after centrifugation at low speed (4000 r/min, 15 min). This was followed by the addition of 0.1 mol·L−1 NaOH solution into the centrifuge tube until the solid–liquid ratio was 1:10. The pH was then adjusted to 13–14 with 1 mol·L−1 NaOH. N2 was immediately injected into the centrifuge tube for approximately 30 s, which was then sealed. The tubes were oscillated 12 times for 1 h each at room temperature and left to stand overnight. The humus-like extracted supernatant HLE (humus-like extracted) was retained using low-speed centrifugation. The extraction process was repeated thrice. The HLE was acidified to a pH of 1–2 with 6 mol·L−1 HCl and left overnight. The HAL was precipitated after low-speed centrifugation. The separated HAL precipitate was dissolved with a small amount of 0.1 mol L−1 KOH. KCl was then added to bring the K ion concentration to 0.3 mol L–1. The suspended solids were removed using high-speed (11,000 g/min, 15 min) centrifugation after being left to stand for 1 h. The pH was adjusted to 1.0 with 6 mol·L−1 HCl, and the sample was then left to stand for 12–16 h. The precipitation of the supernatant was obtained using high-speed centrifugation. The HAL was soaked with 0.1 mol·L−1 HCl and 0.3 mol·L−1 HF mixed solution. The supernatant was discarded using high-speed centrifugation the next day. The above-mixed pickling process was repeated thrice. After pickling, the precipitated electrodialysis in the centrifugal tube was carried out until the Cl was not detected (AgNO3 detection). The purified dry sample of the HAL was finally obtained through rotary evaporation and lyophilization.

2.9. Structural Characteristics Analysis and Determination Method

Elemental composition: A German Vario EL III elemental analyzer was used to measure in C/H/N mode. The data were corrected with moisture and ash calculated in Differential Thermal Analysis (DTA).
Thermal stability: This was measured using a Shimadzu TA-60 thermogravimetric analyzer with a sample size of 5–7 mg. The heating rate was increased from 35 °C to 700 °C at 15 °C·min−1 under the condition of 60 mL·min−1 airflow. DTA and TGA tests were performed using instrumentation software. Infrared spectrum: The KBr compression method was adopted, and a Nicolet AV-360 Fourier transform infrared spectrometer was used to determine the infrared spectrum. The range of the wave number was 4000–500 cm−1. Omnic software was used to calculate the peak area of the characteristic absorption peak of the infrared spectrum.

2.10. Data Processing

Microsoft Office Excel software was used for data analysis and processing. The data were statistically analyzed using SPSS by one-way ANOVA and Duncan’s method for multiple comparisons at a 5% significance level. The Shapiro–Wilk Test was used to check for normal distribution and the Levene Test was used to confirm the homogeneity of variances. All figures were constructed using Origin 9.1.

3. Results

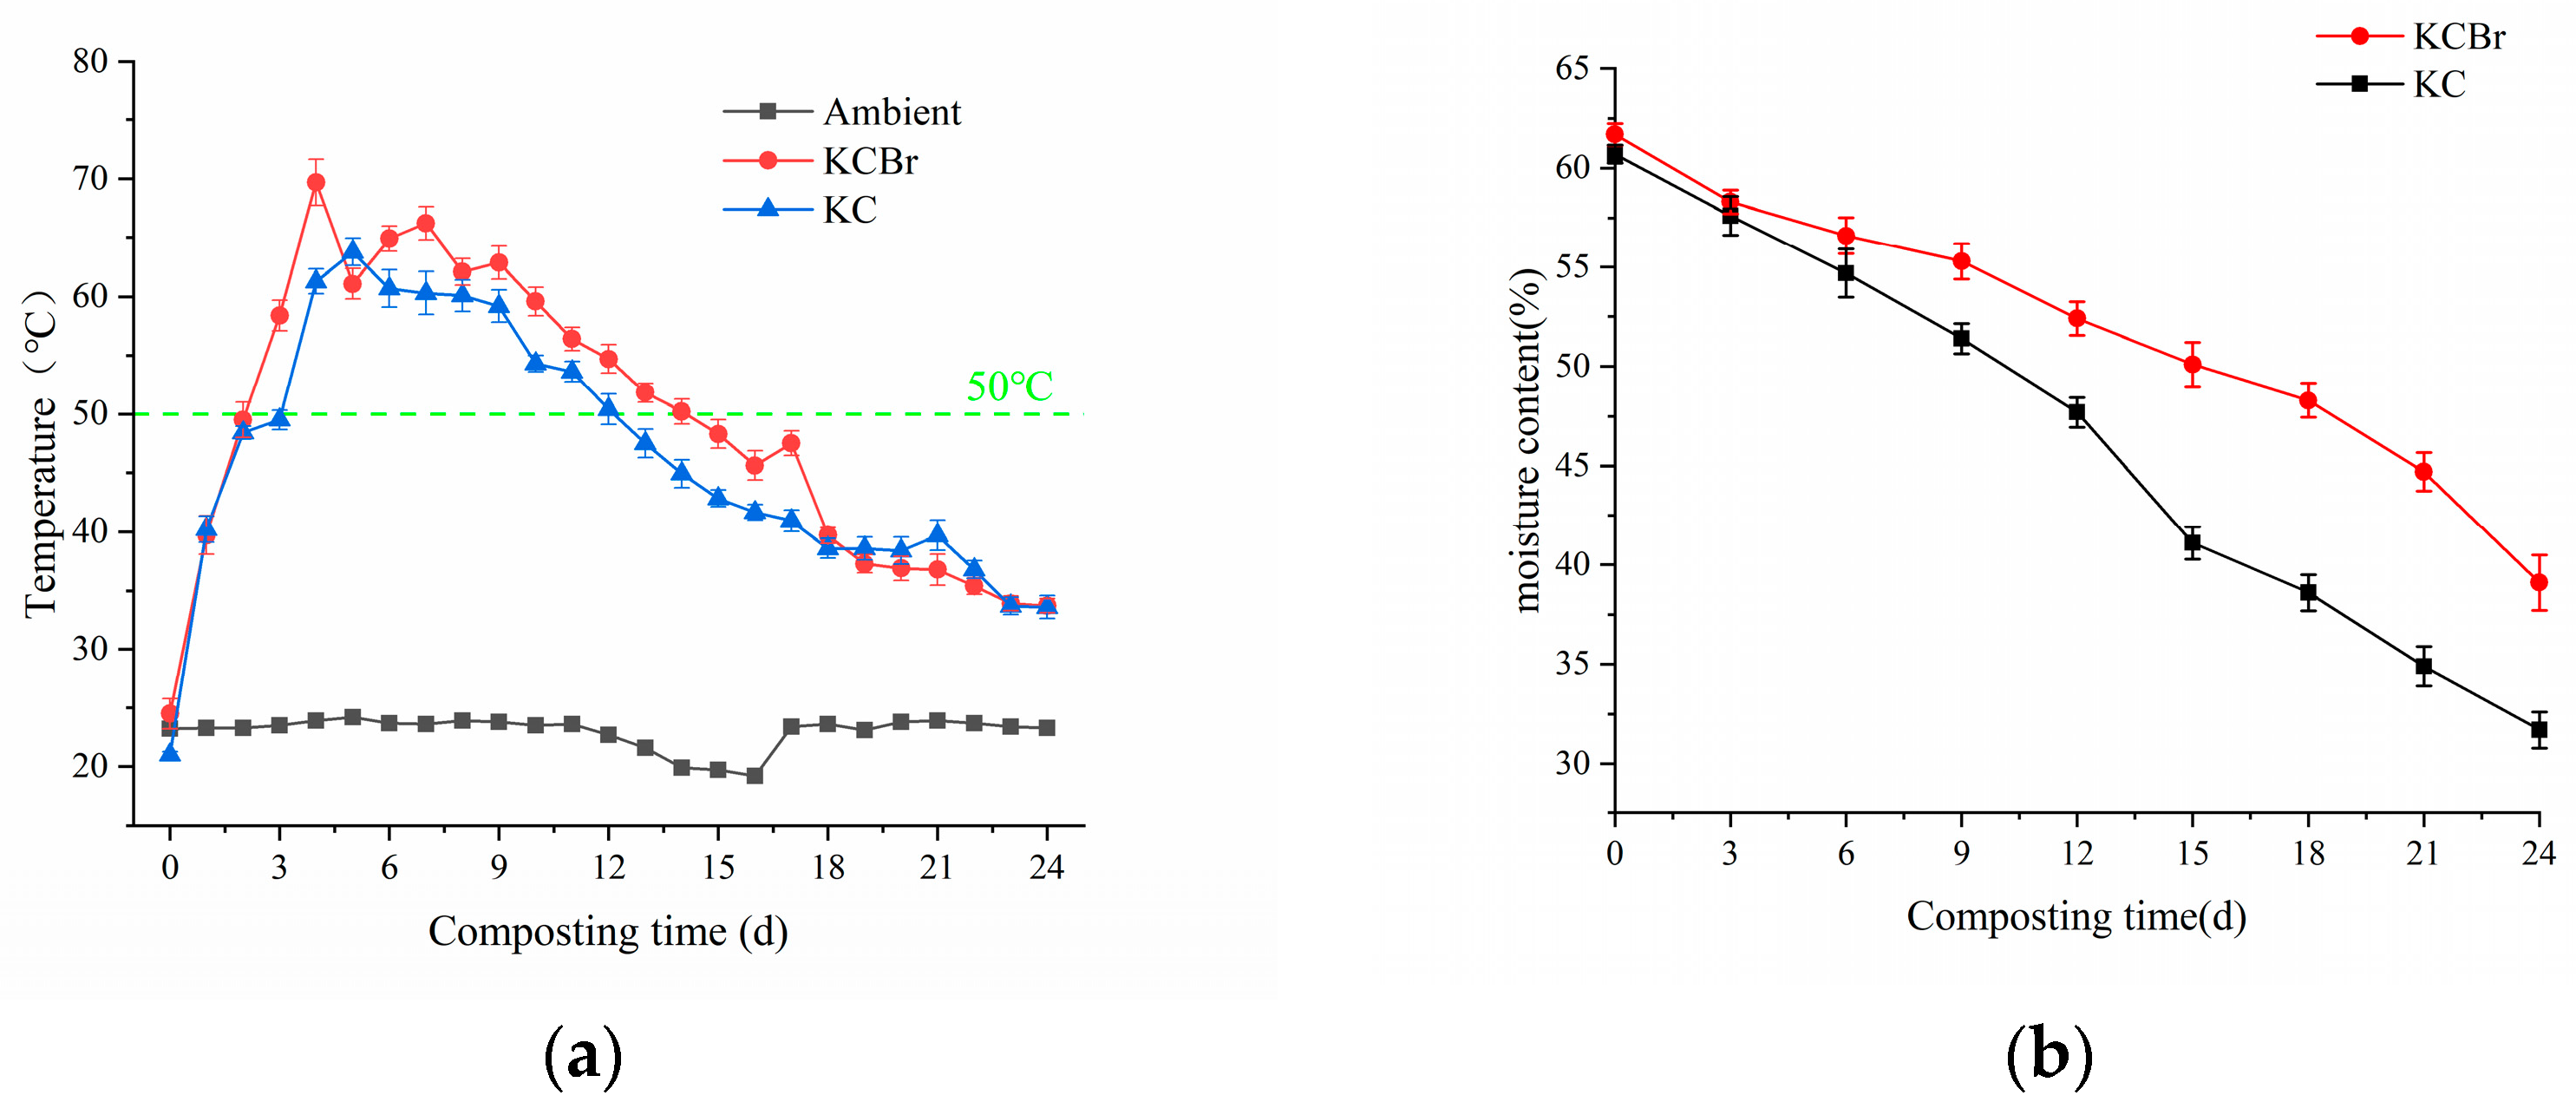
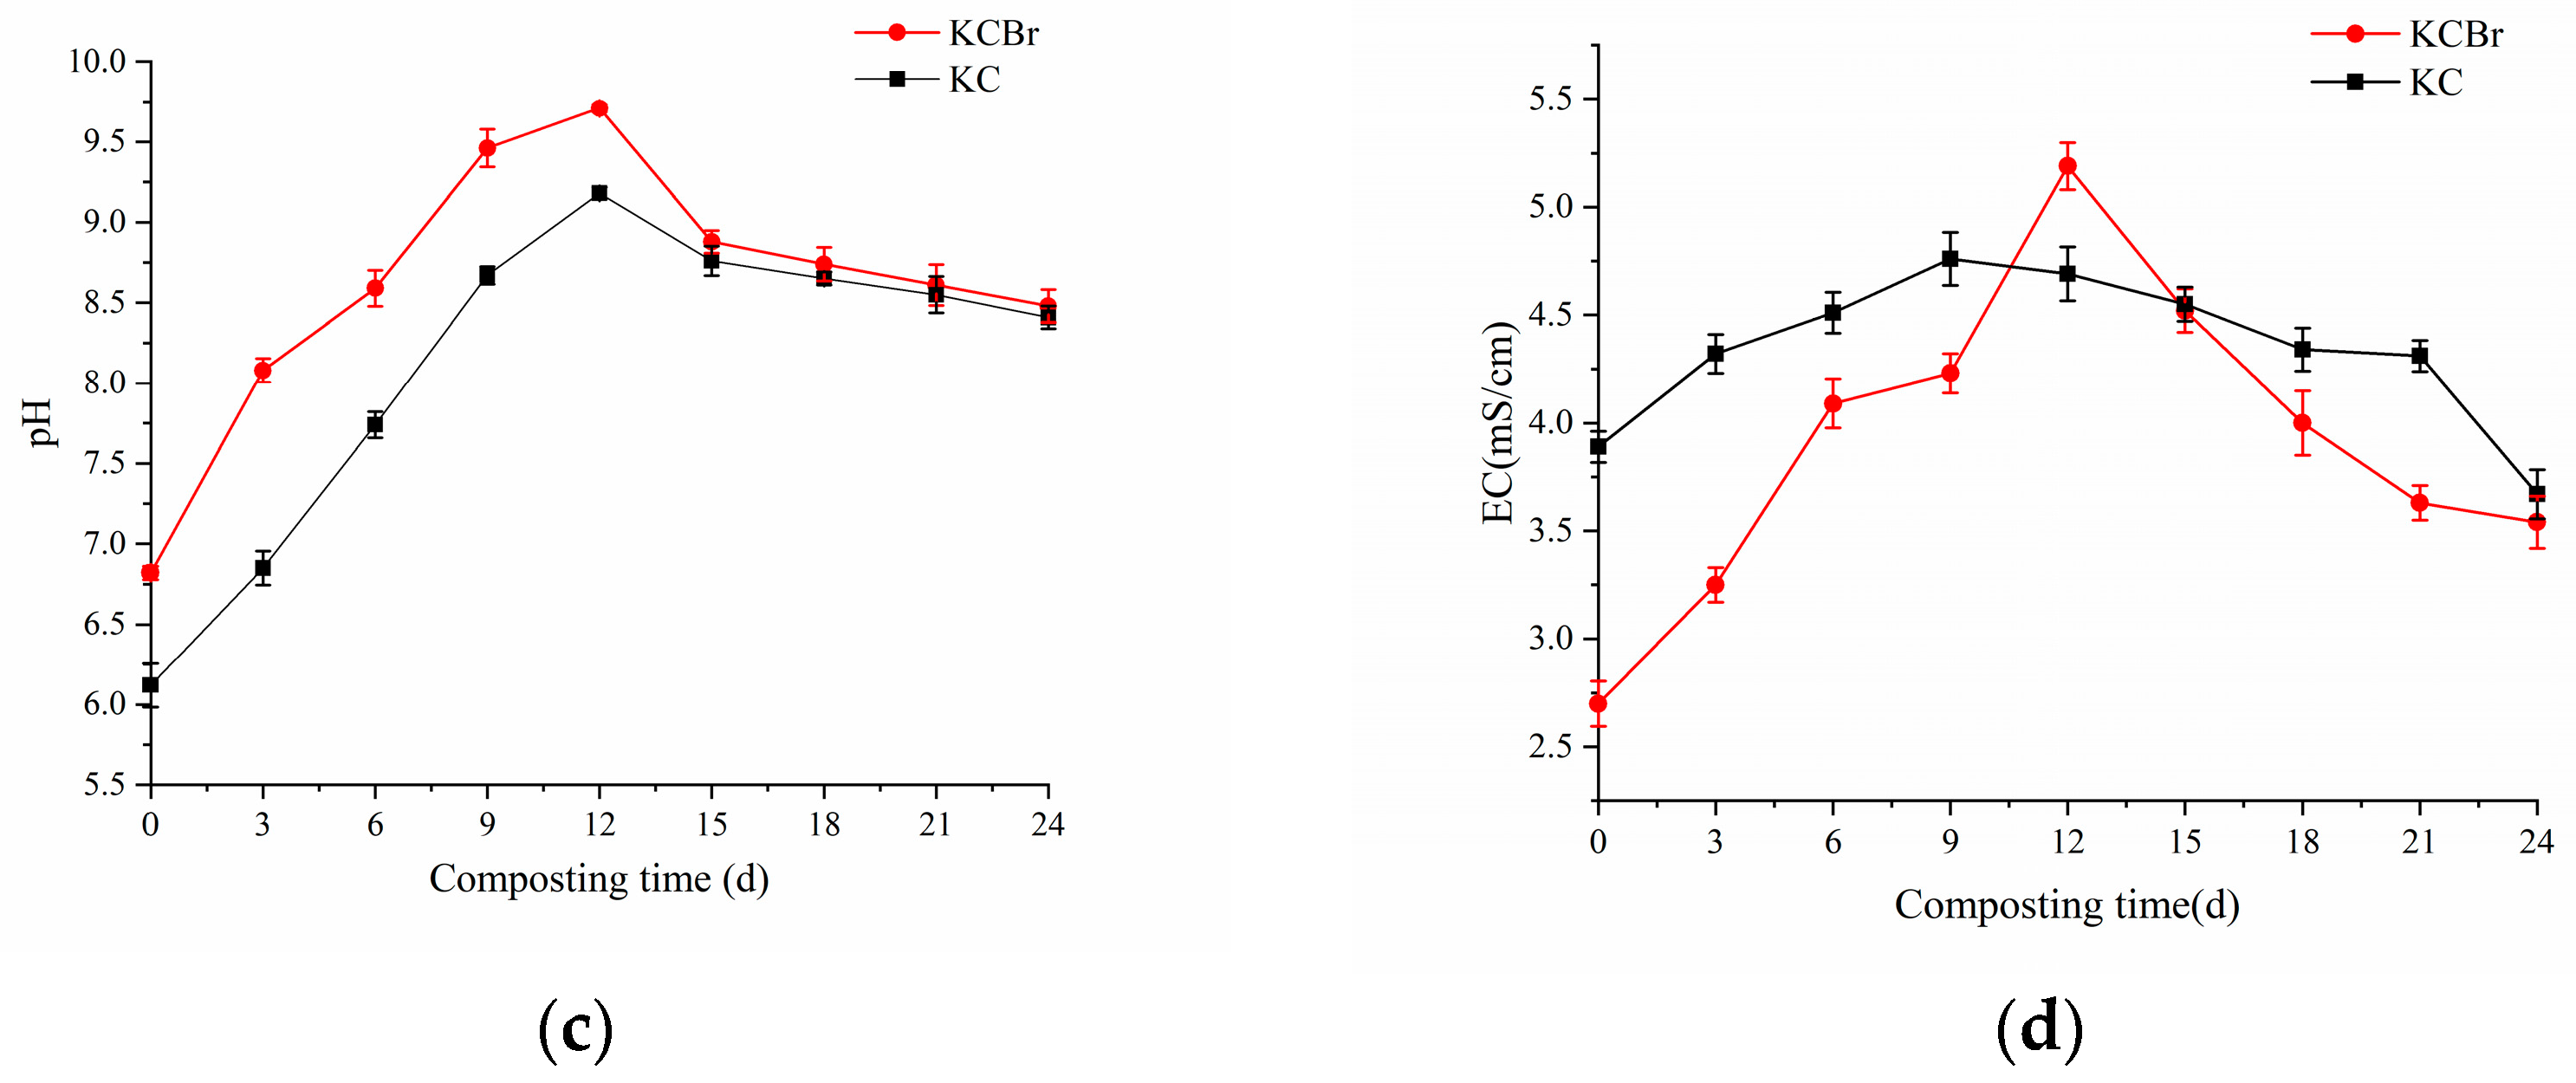
3.1. Physical Parameters of Composting Kitchen Waste Mixed with Different Additives

Changes in the main parameters of the compost are presented in Figure 1. The temperature of KCBr increased faster during the composting process, reaching a maximum temperature of 69.7 °C and lasting 12 days above 50 °C. The heating rate of the KC treatment in the composting process was lower than that of the KCBr treatment. The maximum temperature was 63.8 °C and lasted above 50 °C for nine days. Both treatments met the requirements of harmlessness [28] (Figure 1a). The initial moisture content of KC and KCBr was 60.7% and 61.7%, respectively, and was maintained at 39.1% and 31.7% at the end of composting (Figure 1b). The pH of both treatments gradually increased as the composting process progressed. The pH values of KCBr reached a peak of 9.71 on the 12th day and then decreased gradually as composting progressed. The pH values of the two treatments were approximately 8.5 after composting (Figure 1c). The initial test conductivity of KC and KCBr was 2.7 ms/cm and 3.89 ms/cm, respectively. The conductivity initially increased and then decreased as composting progressed. At the end of composting, it reached 3.67 ms/cm and 3.54 ms/cm, respectively (Figure 1d).

3.2. Changes in the Organic Carbon Content of Humus Acid-like Fractions at Different Culture Times for the Two Treatments

Effect of organic carbon content of the humus-like components (Table 2). While the two treatments were notably different from one another and the KCBr declined dramatically compared to the TOC of the KC, both treatments saw a decrease in the total organic carbon over time. The changing pattern of TN in both treatments during humification was exactly the opposite to that of the total organic carbon, which increased with time, with a greater increase in the total nitrogen of KCBr. The organic carbon content of the humus-like components of HAL and FAL increased and then decreased, respectively, with significant differences. The relative HAL content of the two treatments increased with the time of humization, with the additional increase in PQ values over time.
The effects of two treatments on ΔlgK and E4/E6 of HAL are shown in Figure 2. The KC and KCBr treatments with the ratio of ΔlgK and E4/E6 demonstrated an upward trend with the increase in culture time. The KCBr treated the ratio of ΔlgK, and the E4/E6 was lower than that of the KC treatments at each stage of the culture. This indicates a more complex structure of the humic acid-like substance in the KCBr treatment. The humification process was additionally observed to be more mature, stable, and humic.

3.3. Changes in the Elemental Composition of HAL in KC and KCBr at Different Culture Times

The structural characteristics of HAL may be easily determined by analyzing the elemental compositions of the KC and KCBr samples. Among them, the H/C molar ratio and (O + S)/C molar ratio characterize the molecular condensation and oxidation of its structure. The composition of the two processing elements is depicted in Table 3. The HAL of KC and KCBr exhibited a C-high O-base state during the period of humification, with more than 50% of the HAL elements occupied by the C elements. The C/N of both treatments demonstrated a decreasing trend during the humification process, with a greater decrease in the C/N ratio in the KCBr treatment as compared to the KC treatment. The H/C in the KC treatment demonstrated a post-increasing trend, while the H/C of KCBr decreased during humification. This indicates that the condensation of the added biochar carbon molecules increased the carbon fixation capacity. The KCBr was observed to be more oxidized than KC.

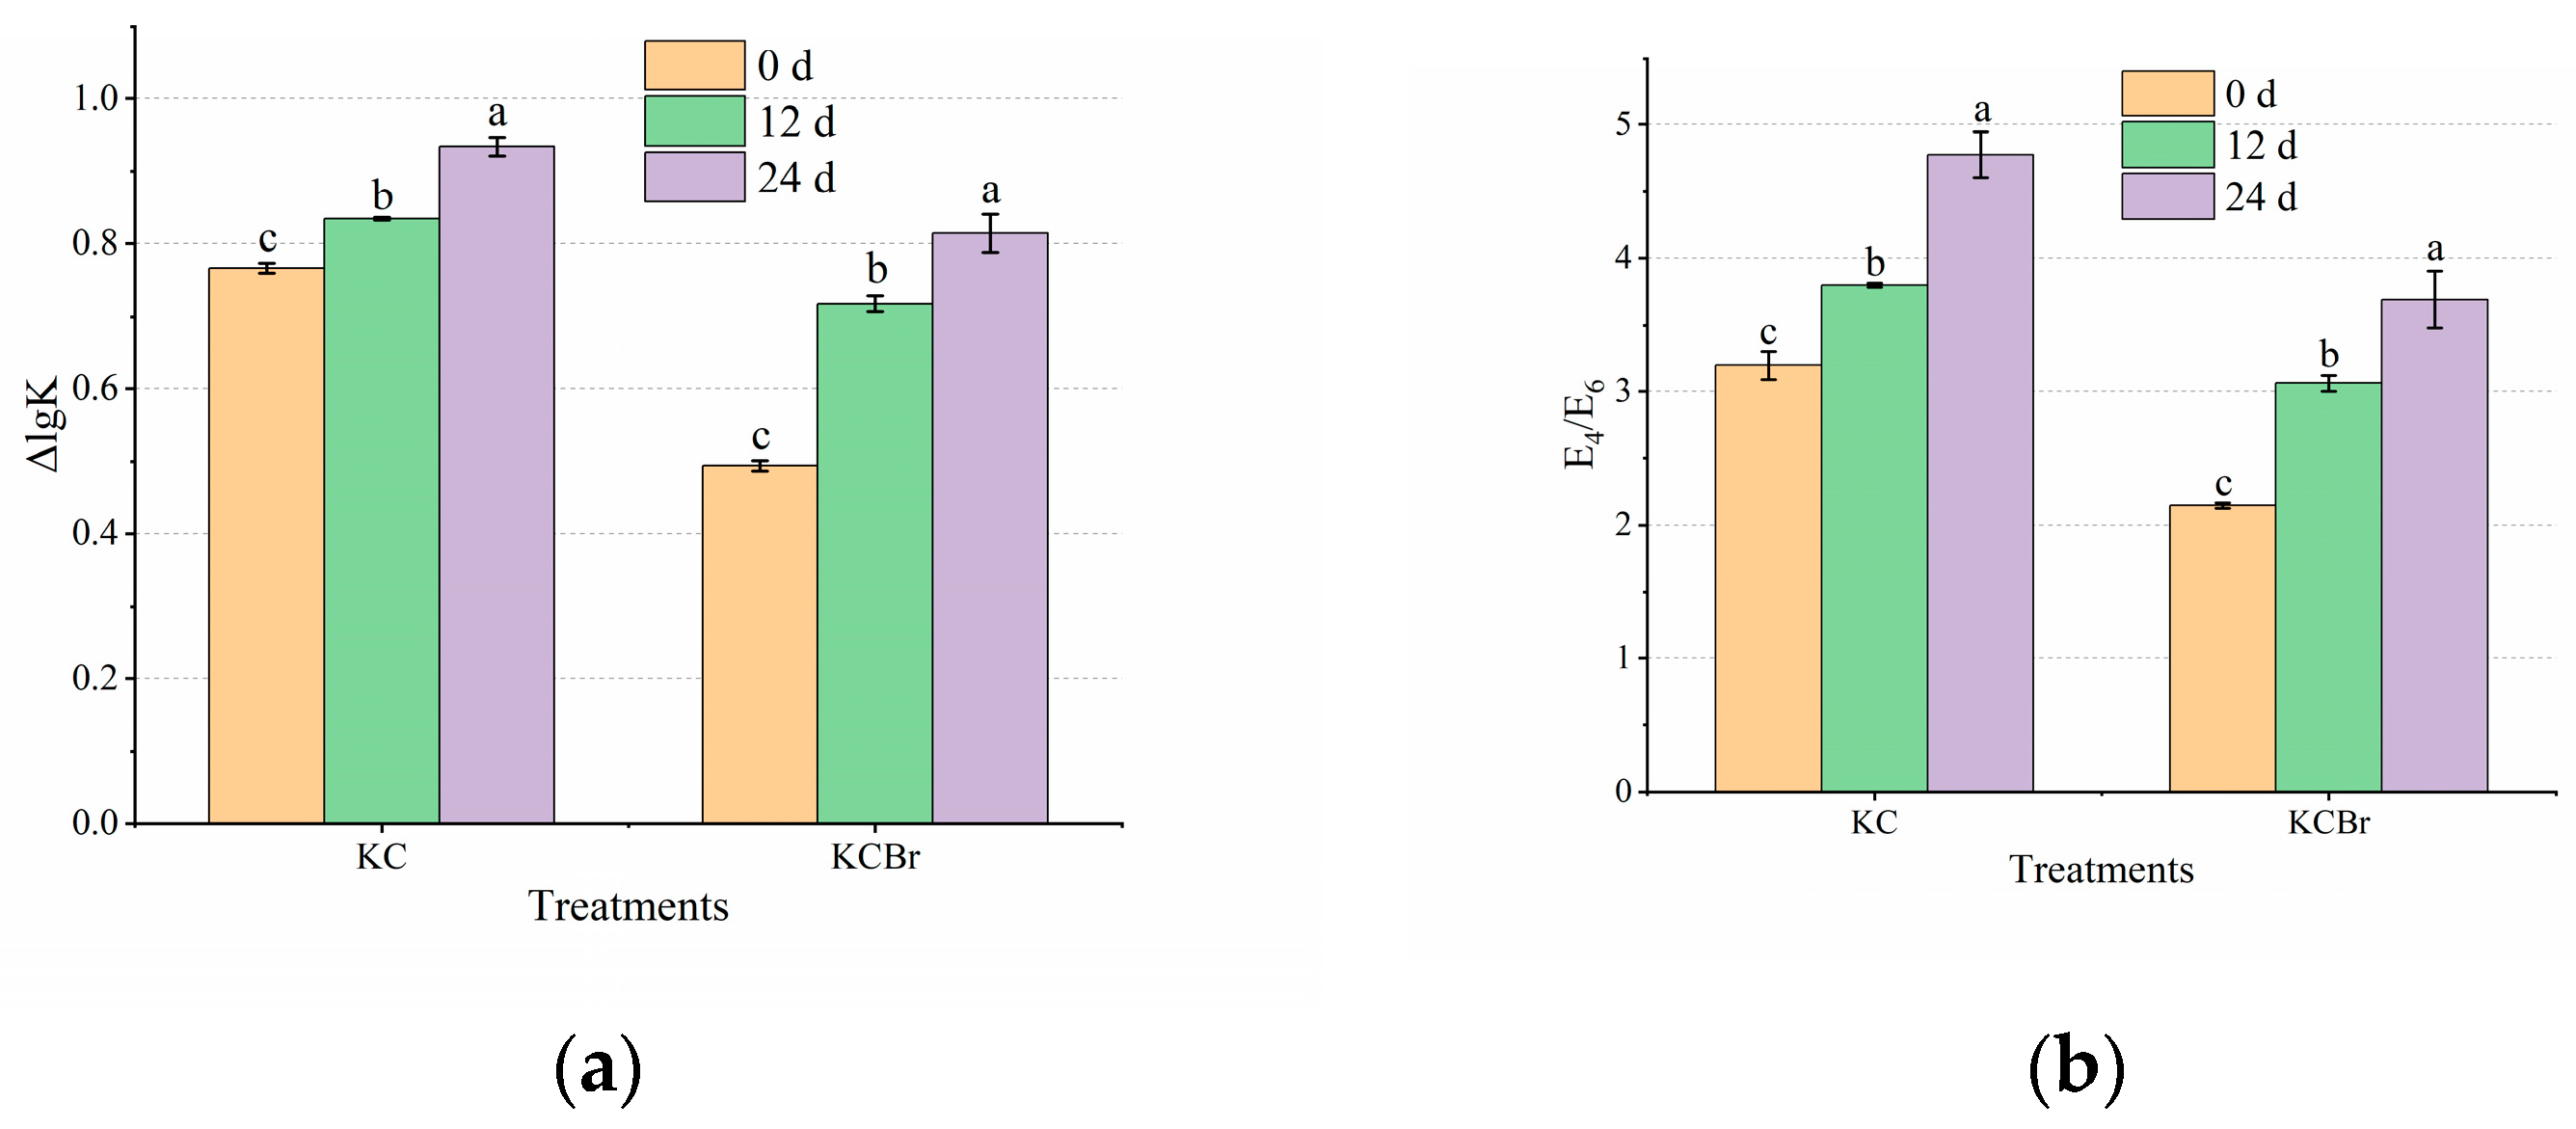
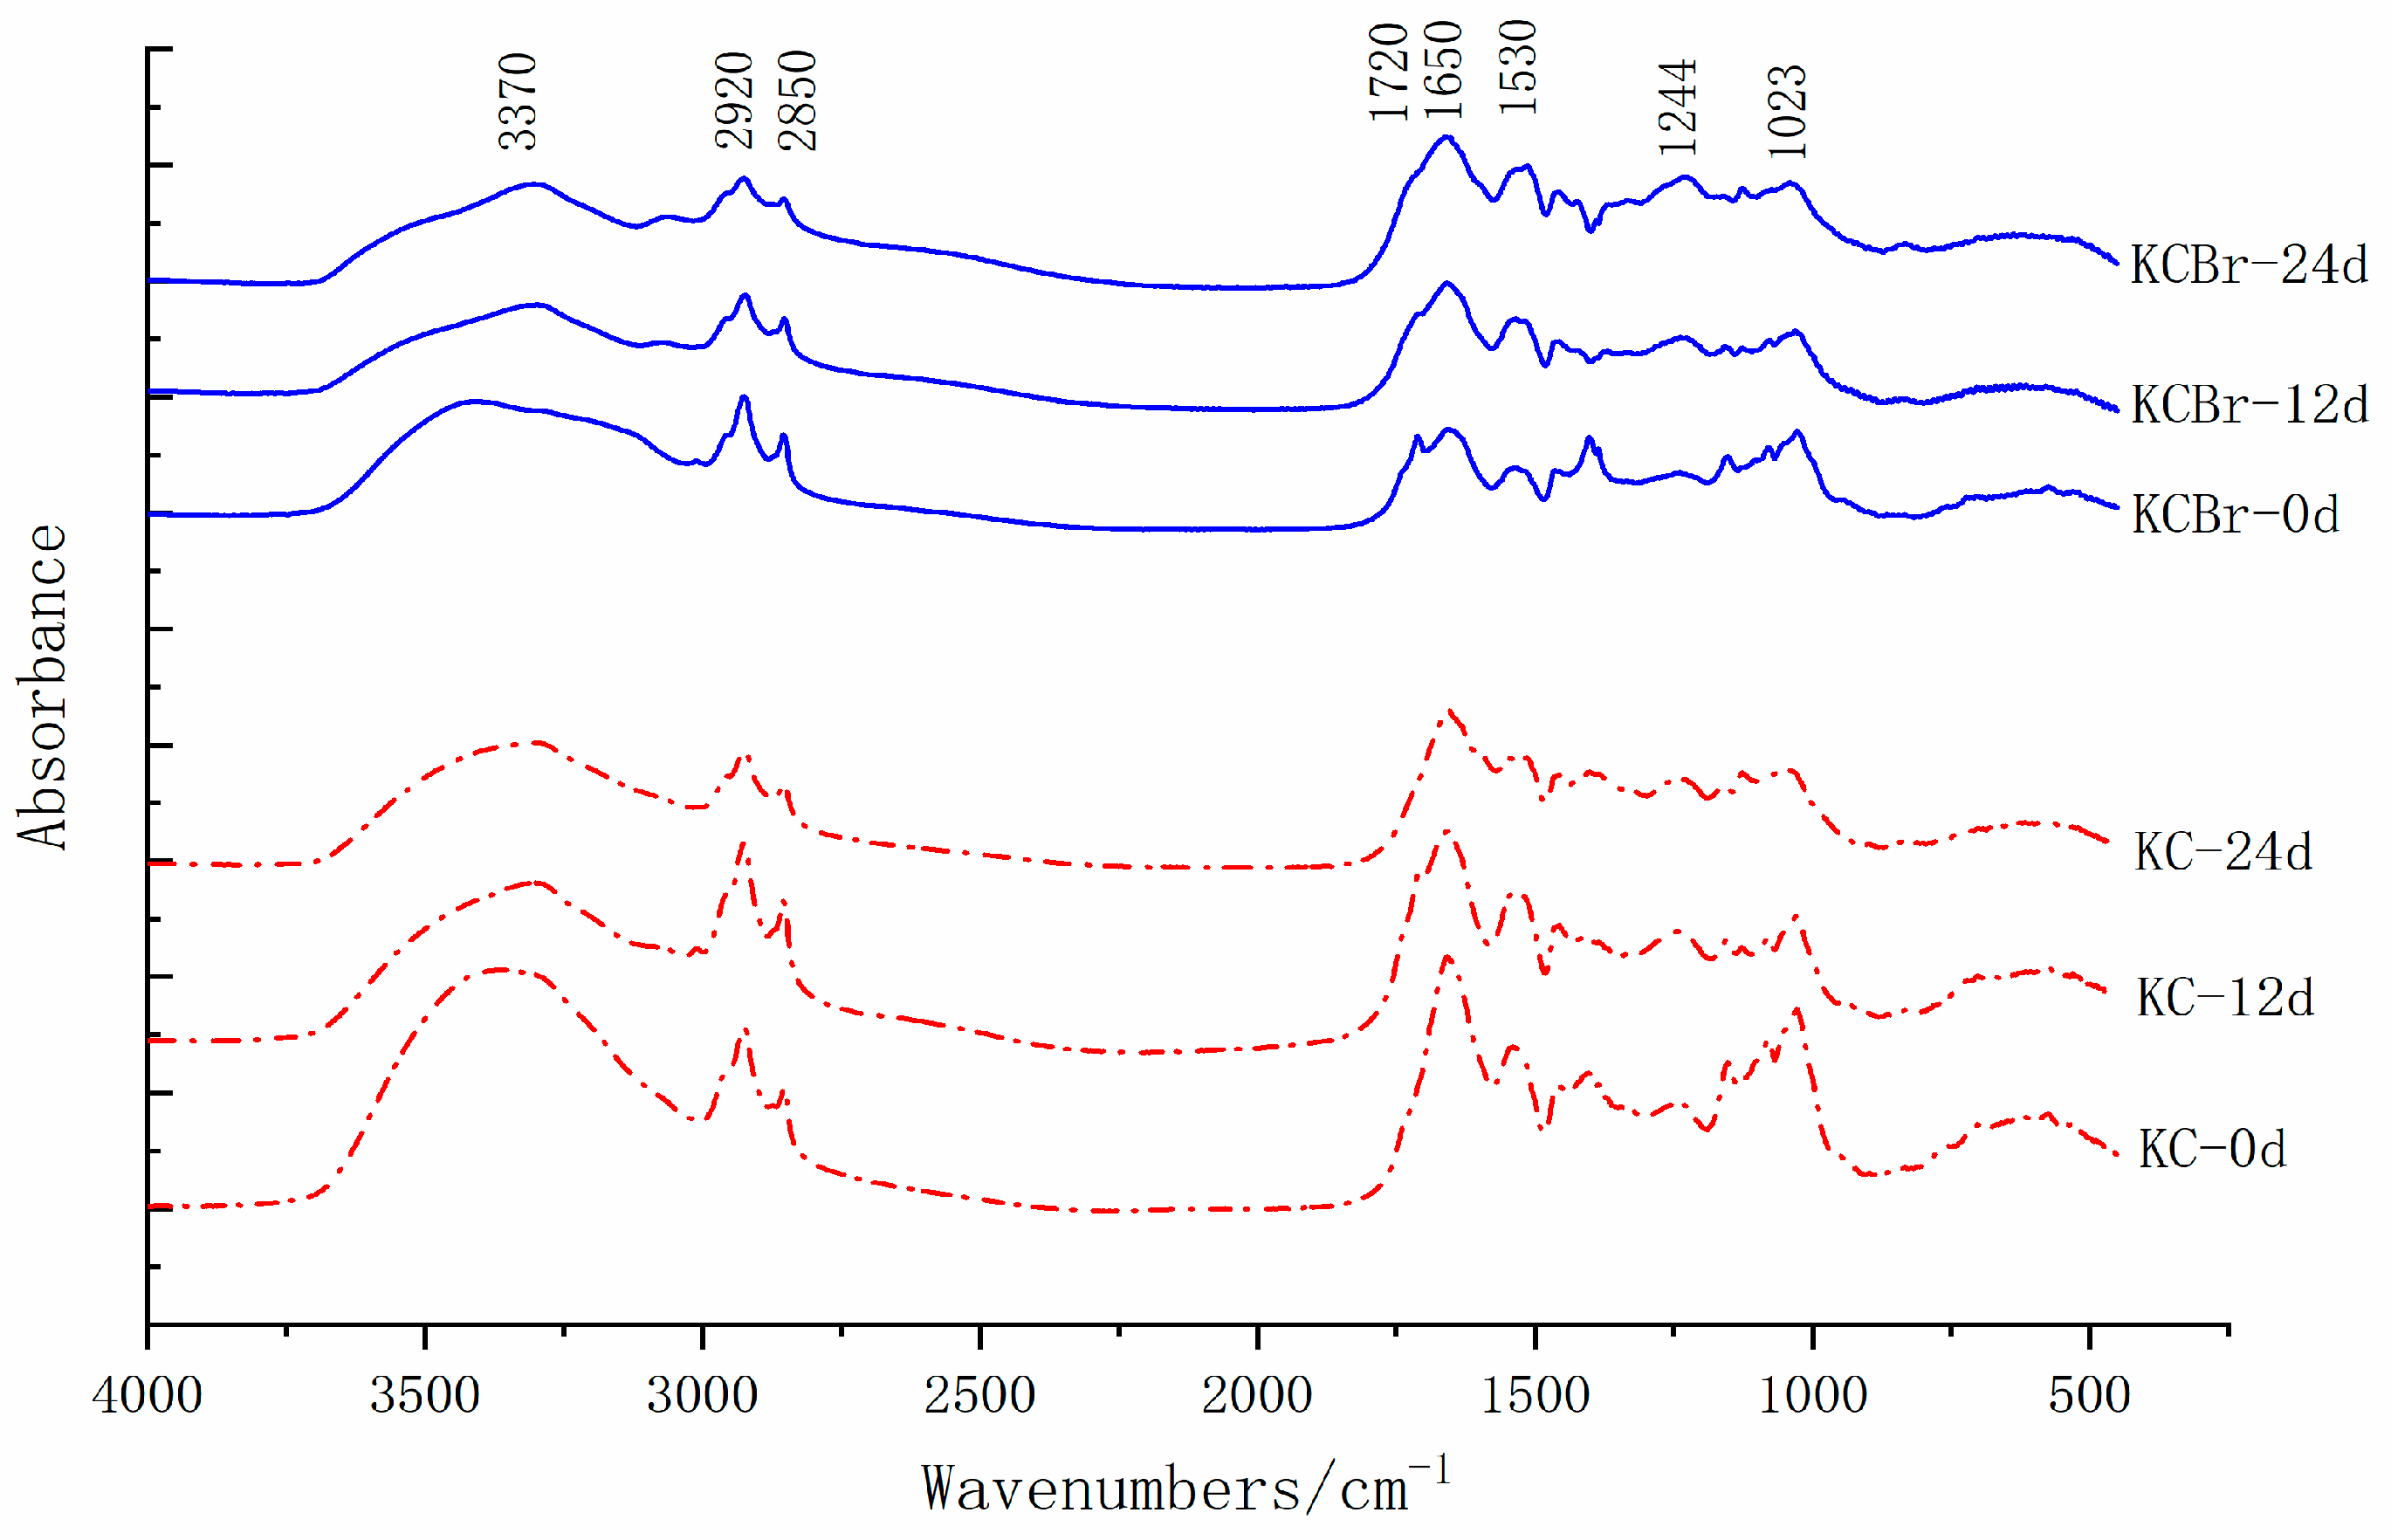
3.4. HAL FTIR Spectra of KC and KCBr at Different Culture Times

The FTIR profiles of KC versus KCBr against HAL at different culture times are presented in Figure 3. The intensity of the absorption peaks in the functional group region and the relative influence of the characteristic peaks in the fingerprint region were analyzed semi-quantitatively (Table 4).
The broad range of the 3370 cm−1 peak observed in the functional group region may be due to the presence of hydrogen bonds that reduce the frequency. This is caused by the expansion vibration of phenolic-OH, hydroxyl, or carboxyl O-H. The overall reduction of the hydroxyl content of HAL in both treatments with increasing humification time would be greater in magnitude than that in KC in the presence of KCBr. Here, 2920–2850 cm−1 represents the stretching vibration of C-H, -CH2, and -CH3 in aliphatic structures, C=O of 1720 cm−1 carboxyl, aldehyde, or ketone, and the values of I2920/I1720 measure the aliphatic content. The relative intensity of the absorption peak of 2920 cm−1 was elevated at 0–12 d. The relative intensity of KCBr increased by 5.44 at 1720 cm−1, while KC demonstrated no absorption peak at 1720 cm−1. The value of the I2920/I1720 for the KCBr decreased by 13.02 during the humization process. With the C=C skeleton vibration of aromatic hydrocarbons from 1650 cm−1 to 1530 cm−1, the appearance of these two peaks may be considered one of the most important indicators in identifying the presence of aromatic nuclei. The value of I2920/I1650 measures the strength of the aromaticity. The value of I2920/I1650 for KCBr decreased by 1.02 at 0–12 d and by 0.14 at 12–24 d, while the value of I2920/I1650 for KC instead increased by 0.82 at 0–12 d and decreased by 0.54 at 12–24 d. The relative intensity of KCBr indicated that the addition of biochar reduced the ratio of lipid chain hydrocarbon to the aerobic functional groups, thereby improving the structural ratio of the C=C double bond (Table 4).
The C-OH vibrations of the aromatic group in the fingerprint region of 1244 cm−1, or the C-O-C vibration of the aryl ether and phenols, the deformation vibration of the -OH and the C-O expansion vibration of the carboxyl group, and the peak at 1034 cm−1 can represent the presence of C-O in the polysaccharide and polysaccharide-like substances. The relative strength of the absorption peak at 1244 and 1023 cm−1 of the two treatments increased throughout the humization period, with KCBr increasing by 2.46 and 0.82, respectively.

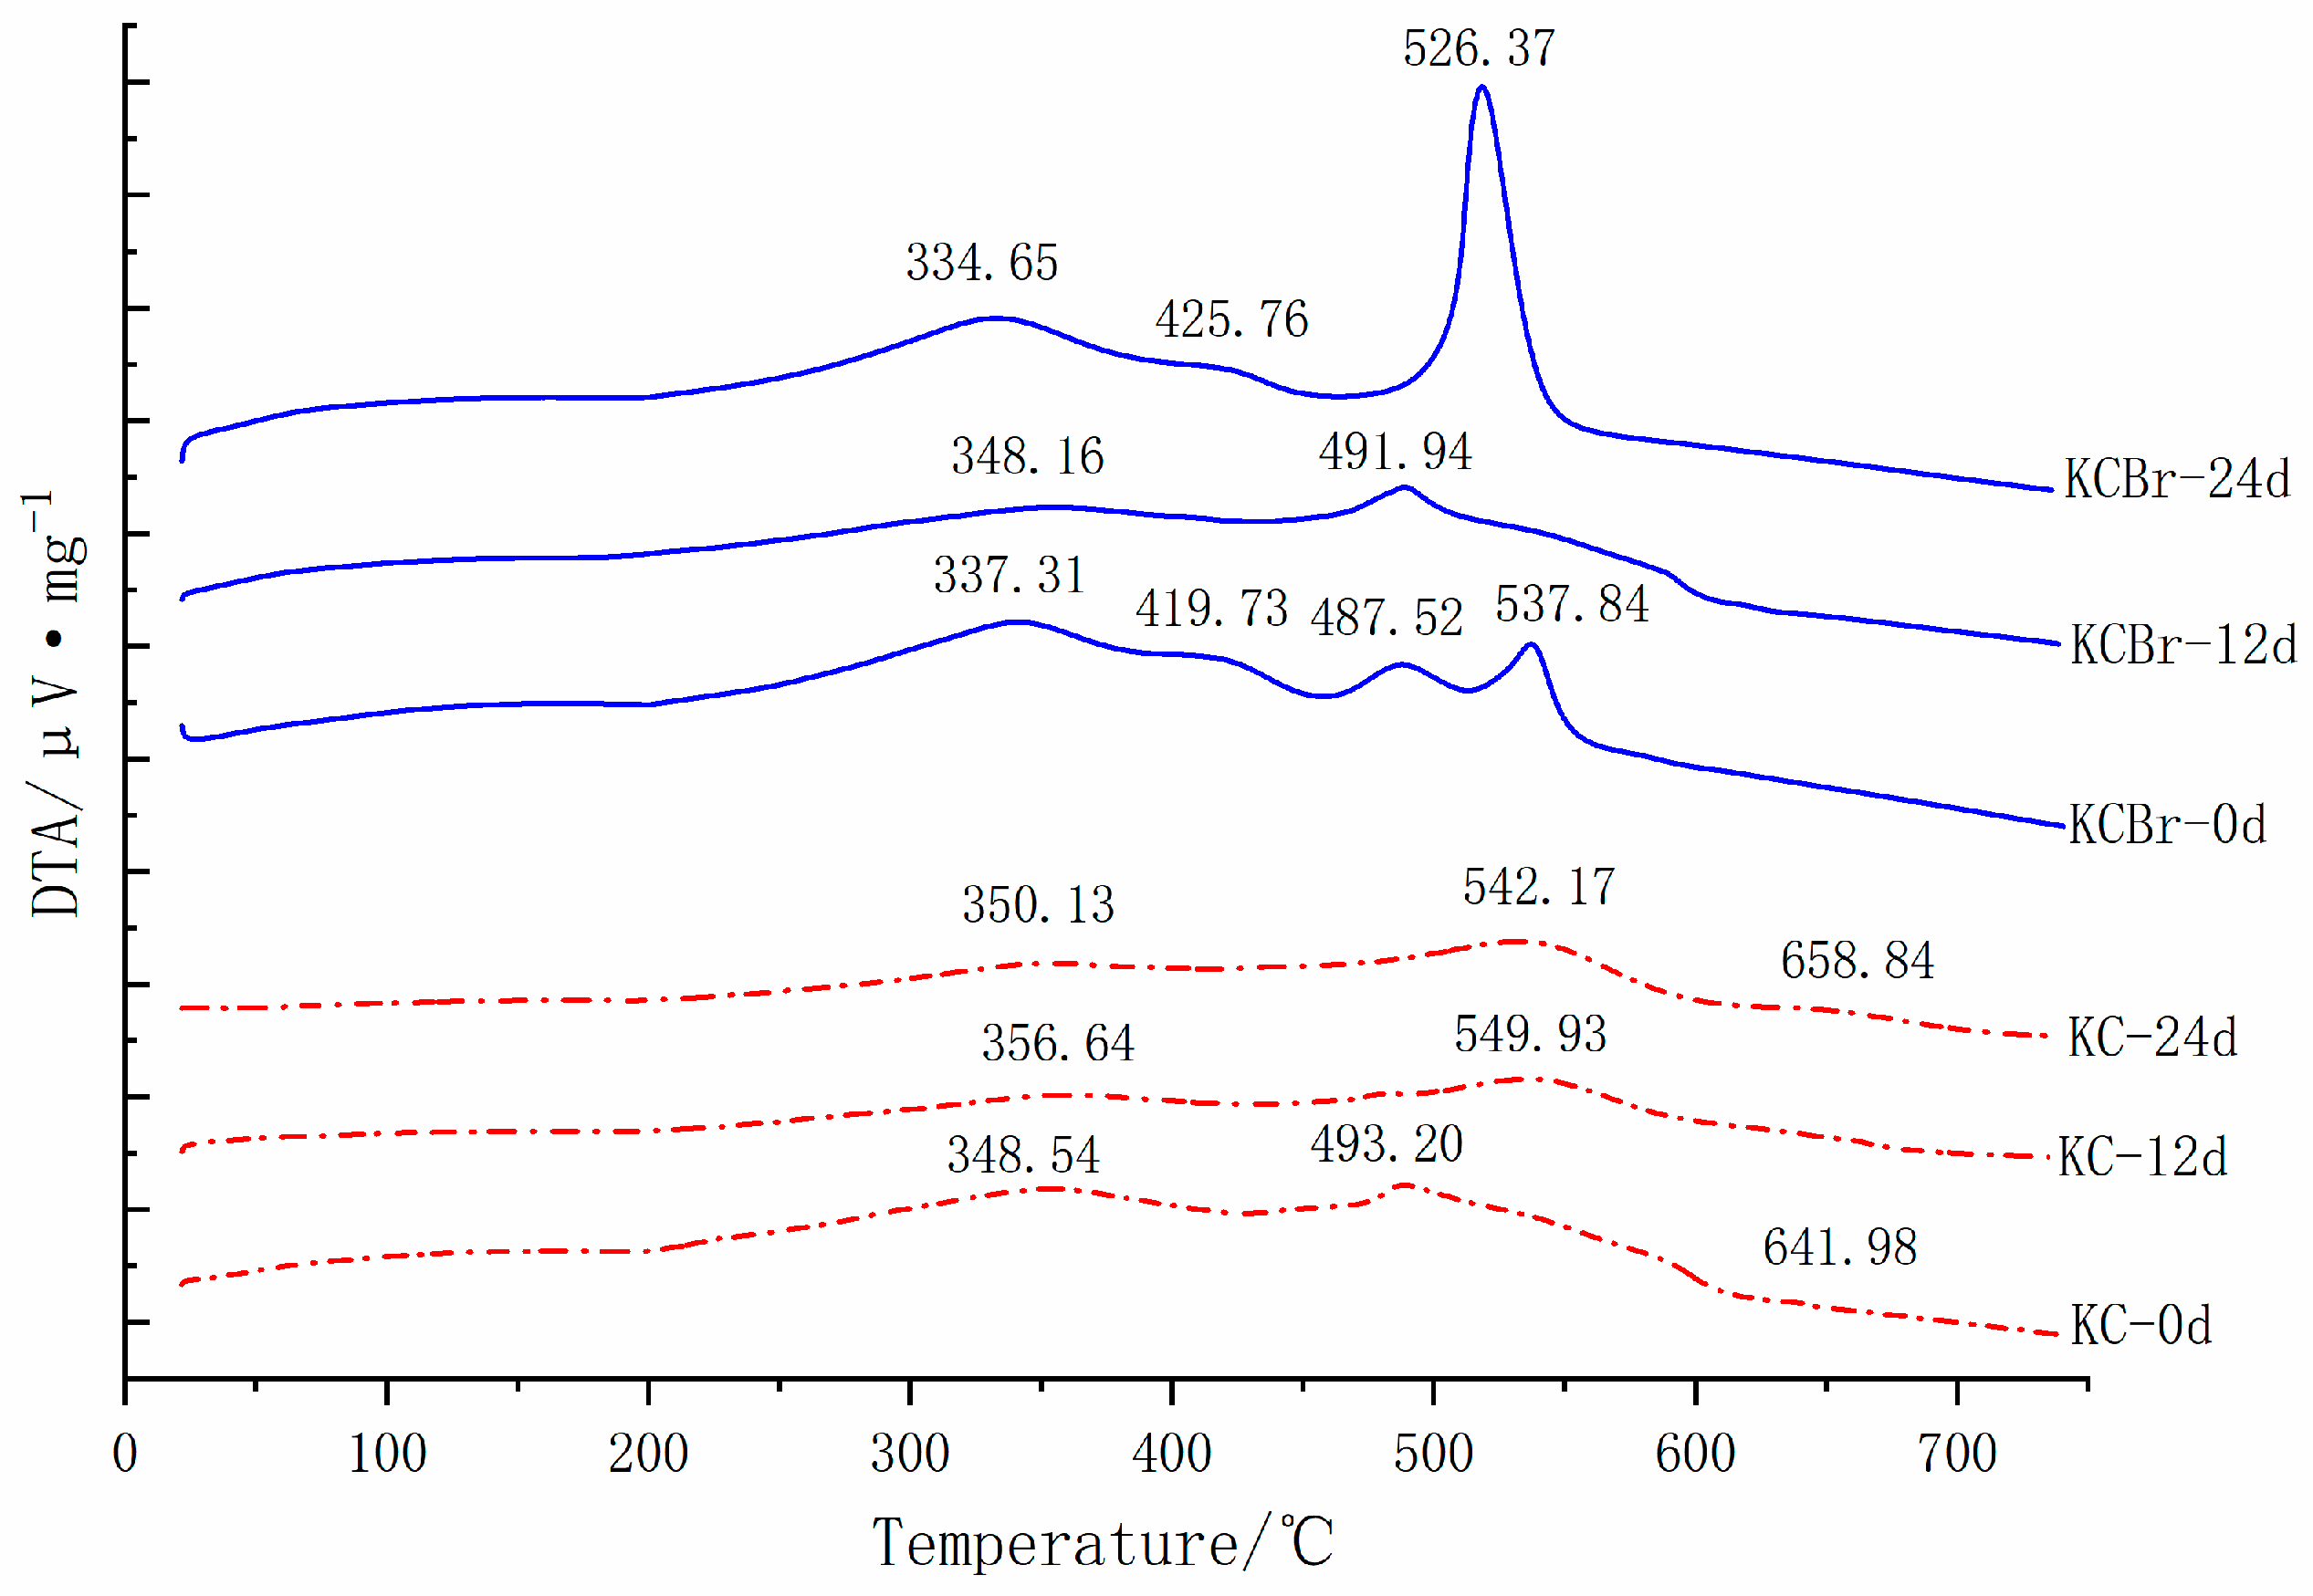
3.5. Changes in HAL Thermal Stability of KC and KCBr at Different Culture Times

The DTA curves for the two treatments of HAL are presented in Figure 4. During the medium-temperature exothermic (334–357 °C) decomposition, the HAL samples represent the decomposition of aliphatic compounds in the molecule and decarboxylation of the peripheral functional groups [29]; high-temperature exothermic (419–659 °C) decomposition represents the result of complete molecular oxidation and decomposition of the internal structure [30,31]. There was a significant change in the KCBr heat-temperature exothermic peak at 24 d, while the DTA curve of the KC only slightly changed from 0 d. Table 5 presents the semi-quantitative analysis of HAL, where both KC and KCBr increased with the humification process. The High/Medium ratio of exothermic heat, and the High/Medium ratio of mass loss of the two types of HAL increased to varying degrees throughout the humification process. The KCBr decreased when the medium temperature was approximately 334–357 °C, indicating a decrease in lipogenicity. When the temperature was approximately 419–659 °C, there was an increase in weight loss, indicating an increase in aromatization and thermal stability. The reason for the increase in thermal stability of the KCBr over the KC treatment could be the increase in thermal stability with the addition of biochar, and the gradual decomposition of unstable aliphatic substances through microbial activities during the humification process. This resulted in the formation of a proportion of aromatic biochar. This, thus, improved the thermal stability and promoted the use of corn stalks in the humification process. This is consistent with the analysis of the infrared spectrograph, where the number of aromatic rings in the molecule significantly increased with a more stable structure.

4. Discussion

4.1. Changes in the Main Parameters of Biochar and Kitchen Waste Composting

Temperature is a direct evaluation index of the composting process and is also one of the important indexes to determine whether the compost meets the requirements of harmless treatment. Microbial catabolism oxidizes the organic matter in the raw materials of compost into simple inorganic matter, generating significant heat in the process. The temperature in a heap will gradually increase due to the preservation effect of the compost. The composting process may be divided into a heating period (<50 °C), a high-temperature period (50–70 °C), and a cooling and ripening period, as per the temperature change in the compost. The temperature of the KCBr composting reached the second peak at the early stage of maturity. This may be due to the provision of more oxygen with the turning of the compost on the 18th day. Lijie Li et al. [32] also demonstrated that the addition of biochar carbon to composting can significantly increase the temperature of the reactor and accelerate the reaction process of composting. The addition of biochar in composting accelerated the degradation of organic matter, reduced the time to enter the high-temperature stage, and increased the composting temperature, thus improving the composting effect. The water in the compost body regulates the temperature of the entire composting system by eliminating heat during evaporation. The water content in a pile is also a vital parameter that determines the composting effect. Water content that is too high leads to less oxygen in a pile, anaerobic fermentation of microorganisms, and odor [33]. Water content that is too low, on the other hand, will affect the growth and reproduction of microorganisms and delay the composting reaction process. Most of the nutrients required for microbial metabolism can be absorbed only in the water environment. The moisture content in the stack is, therefore, of great significance to microbial metabolism. The decrease in the water content in KCBr was a result of the microbial metabolic activity of the heap during the high-temperature phase. This was primarily during the heating and especially the high-temperature period when phagosomes act as the dominant microbial community, and with the rapid utilization and degradation of KCBr by phagosomal microorganisms, the demand for oxygen by the heap increased significantly. While the air entering the heap is cold air, the temperature is maintained at room temperature. The discharge of hot air increases the water saturation of the tail gas and leads to a more rapid utilization and evaporation of water [34]. Yingting Li [35] determined that the addition of biomass carbon to sludge compost accelerated the decline of the moisture content in the early stage of composting, primarily because biomass carbon increased the porosity of the reactor and improved the exchange capacity between the reactor and external gases. Microbes can only metabolize normally under appropriate pH conditions. The pH value, therefore, needs to be kept within a certain range. Too high or too low a pH value will reduce the decomposition rate of the organic matter in a pile, consequently affecting the composting process. In addition, too high a pH value will cause a large amount of nitrogen in a heap to volatilize in the form of NH3, thereby reducing the fertilizer efficiency of the compost. In this test, the initial pH value was not adjusted to the same value under the condition of reducing manual intervention. The initial pH values were, however, maintained between 6.0 and 7.0, which was the allowable range for a composting startup. Biochar is alkaline, and the addition of which can improve the pH value of the compost. This affects the growth and reproduction of microorganisms in a pile and, to some extent, the composting process [7]. The pH value of the two treatments increased with the composting process, possibly with the breakdown of proteins in the waste to amino acids, which were then converted to ammonia. Over time, the volatilization of ammonia leads to a decrease in pH. The overall pH value of the KCBr treatment with the added biomass carbon is lower than that of the KC treatment. This may be because the addition of the biochar carbon adsorbed the NH3 released by the composting process, inhibiting the dissolution and release of NH3 and OH, thereby reducing the pH value of the reactor. The conductivity reflects the total soluble salt content in the kitchen garbage extract, such as the plasma content of Cl, SO42−, Na+, and NH4+ [36]. Conductivity that is too high may cause the soil osmotic pressure to be too high after application, leading to plant salt damage. However, electrical conductivity that is too low indicates the insufficient concentration of kitchen waste ions and nutrition, which is not conducive to the improvement of soil quality [37,38]. An initial increase and then decrease was observed in both treatments during the composting process. The inorganic ions, such as phosphate and ammonium ions, created by the biodegradation and mineralization of organic materials are the cause of the enhanced conductivity. Additionally, the water evaporates during the composting process, concentrating the compost matrix and enhancing its conductivity [39]. With the volatilization of NH3 and the decrease in soluble inorganic salts, the conductivity has decreased.

4.2. Humus Composition and Humic Acid-like Structure of Compost Mixed with Biochar and Kitchen Waste

Unstable carbonaceous organics in a pile will undergo a series of changes, such as degradation, transformation, and synthesis of new compounds under the action of microorganisms during the composting process. The change in the total organic carbon content in a pile can, therefore, reflect the change rules of carbon substances to a certain extent [40]. The unique porosity of biochar improves the aeration of the compost, and the microorganisms attached to its surface can strengthen metabolism, thereby promoting the degradation of organic matter [41]. The carbon content of the humus decreases as the organic matter in the compost rapidly decomposes. The compost then enters the humification stage. The organic matter in the composting process is transformed in the direction of stabilization and humification [42], with a gradual increase in the carbon content of the humus. The results of this study demonstrated that the carbon-containing organic matter in the stack was constantly decomposed by mineralization, with a gradual decrease in the total organic carbon content. Compared with the treatment of 0 day, the TOC content in the treatment of adding biochar on the 24th day decreased by 40.63%, and the total nitrogen content increased by 95.89%. The TOC content of the KC treatment on the 24th day decreased by 12.44% compared with that on the 0th day, and the total nitrogen content increased by 41.09%. Huang Hongli et al. [43] believed that the difference in the raw materials in the compost led to the increase and decrease in the changes in humic acid. The humic index, however, demonstrated an upward trend. In the process of composting, the number of acidic functional groups on the surface of biomass carbon gradually increases due to biological oxidation, which is followed by the gradual strengthening of the adsorption capacity of money-state nitrogen, reducing the volatilization caused by nitrogen loss [44]. After Guiyu Zhou [45] added straw biochar and pine biochar to the soil for 45 d, the content of humic acid and fulvic acid increased by varying degrees. Wang et al. (2014) [46] found that the addition of biochar carbon can promote the production of humic acid-like substances in compost. On the 24th day, the humification index was observed to be the greatest in both treatments, with the humification index of the treatment with biochar being higher than that of the treatment without the addition of biochar. Compared with the KC treatment, the relative content of HAL in the KCBr treatment was 3% higher and the PQ value was 1.2% higher. This indicates that the addition of biochar facilitated the humification of the compost. Elemental analysis is one of the effective methods to analyze the structure of complex organic compounds. The structural characteristics of HAL may be initially determined by analyzing the C, H, O, and N in the elements of bulk HAL samples. Composting is not only a process of microbial degradation of organic matter but also a process of humus synthesis and complexity. The content of the C element of the humic acid in compost decreased significantly with the composting process, and the easily degradable components were degraded and mineralized under the action of microorganisms, resulting in a decrease in their proportion. However, the content of O increased, which may be due to the formation of substances with a higher degree of oxidation and more difficult degradation during composting humification or due to the enhanced oxidation degree. Through elemental analysis, Eneji et al. [16] determined that the structure of HAL was C high and O low, indicating a low degree of oxidation. This is consistent with the results of the composition of the elements in Table 3. The content of organic matter and total C content in the composting process, on the other hand, generally decreased. The relative content of humic acid, however, increased. The content of H element and H/C of humic acid-like compounds in the KCBr treatment decreased with the composting process, which may be due to the formation of humic acid-like compounds with a higher polymerization degree in the KCBr treatment, indicating the degradation of fatty substances and the enhancement of the condensation degree and aromatization degree of humic acid molecules [19]. The C/N of the two treatments decreased continuously during the composting process, possibly because the nitrogen structure from plant residues or microbial residues formed a stable nitrogen structure under the protection of the humus structure, which was not easily degraded by microorganisms. From the infrared spectrum analysis, there was no obvious difference observed between the functional groups of the two treatments, which demonstrated similar infrared characteristics. Through the FTIR library identification, humic acid in the compost was found to contain methanol, aliphatic organic acid, cyclopentane, phenols, acetone, ethylphthalamine, aromatic organic acid, alkylbenzene, and pyrrole [47]. The H/C of the KCBr HAL continuously decreased. The results of the FTIR, DTA, and TG analyses demonstrated that the growth rate was faster in the first 12 d than in the last 12 d. The reason for this phenomenon may be that the aliphatic carbon in HAL was readily available during the first 12 d of the humization process, while the relatively more stable aromatic carbon was retained during this period, that is, the core humic acid was gradually exposed during this period, resulting in a decrease in H/C. This result confirmed the polyphenol theory. The continuous decrease in the I2920/I1620 ratio could also demonstrate the continuous increase in the aromaticity of the HAL structure during the simulation of humization, which is consistent with the results of this study. The stretching vibration of hydroxy O-H (3370 cm−1) and methylene C-H (2920 cm−1 and 2850 cm−1) in the humic acid-like structures in the early stage of composting was observed to be relatively strong, indicating relatively high contents of these two types of substances in the early stage. However, the microorganisms use fatty substances and carbohydrates such as polysaccharides, cellulose, and hemicellulose with the increase in composting time to meet their metabolic energy needs [48]. The stretching vibration of these functional groups demonstrated a weakening trend. The enhanced stretching vibration of aromatic C=C and C=O (1650 cm−1) also indicates an enhanced oxidation degree of humic acid, and the appearance of C-O-C (1244 cm−1) at the late stage of composting indicates the high structural stability of humic acid, accompanied by the enhancement of humification degree. This is consistent with the results of the element analysis.

5. Conclusions

The addition of biochar not only shortened the time for the reactor to enter the high-temperature period and prolonged the high-temperature period, resulting in a more mature replication of the reactor, but also reduced the content of TOC, HLM, and FAL, and improved the relative content of TN, HAL, and the PQ value. Compared with the KC treatment, the relative content of HAL in the KCBr treatment was 3% higher and the PQ value was 1.2% higher. Compared with the treatment of 0 days, the TOC content in the treatment of adding biochar on the 24th day decreased by 40.63%, and the total nitrogen content increased by 95.89%. The TOC content of the KC treatment on the 24th day decreased by 12.44% compared with that on 0 days, and the total nitrogen content increased by 41.09%. Compost supplemented with biochar changed the structural characteristics of HAL, making the structure of HAL more complex, reduced the lipidicity of HAL, enhanced the degree of aromatization and the thermal stability ability, promoted the replication process of the reactor, and made the composting materials more mature. The study further elucidated that the addition of biochar can improve the humification process of kitchen waste, making humification more mature.

Author Contributions

Conceptualization, S.D.; methodology, data curation, L.M.; formal analysis, L.M. and Y.Z.; resources, L.M. and H.W.; investigation, Y.Z. and H.W.; writing—original draft preparation, L.M.; funding acquisition, L.M. All authors have read and agreed to the published version of the manuscript.

Funding

The study was supported by the Key Science and Technology Project of Education Department of Jilin Province (No. JJKH20230685KJ).

Data Availability Statement

Not applicable.

Conflicts of Interest

The authors declare no conflict of interest.

References

  1. Tang, X. The modified biochar preparation and adsorption of ammonia-nitrogen. Master’s Thesis, Guangxi University, Nanning, China, 2018. [Google Scholar]
  2. Lehmann, J.; Rondon, M. Biochar soil management on highly weathered soils in the humid tropics. In Biological Approaches to Sustainable Soil Systems; CRC Press: Boca Raton, FL, USA, 2006; pp. 517–530. [Google Scholar]
  3. Keiluweit, M.; Nico, P.S.; Johnson, M.G.; Kleber, M. Dynamic molecular structure of plant biomass-derived black carbon (biochar). Environ. Sci. Technol. 2010, 44, 1247–1253. [Google Scholar] [CrossRef]
  4. Zhu, M.T.; Liu, X.X.; Wang, J.M.; Liu, Z.W.; Zheng, J.F.; Bian, R.J.; Wang, G.M.; Zhang, X.H.; Li, L.Q.; Pan, G.X. Effects of bio-car in soil aggregates microbial diversity from paddy soil. J. Actor EcoLogica Sircica 2020, 40, 1–12. [Google Scholar]
  5. Huang, J.Q.; Ye, J.; Li, Y.C.; Lin, Y.; Liu, C.W.; Wang, Y.X. Effect of biochar on bacteria community structure of pig manure eomposting. J. Microbiol. China 2020, 47, 1477–1491. [Google Scholar]
  6. Liu, G.T.; Xia, X.; Li, L.; Li, W.Y.; Yang, C.Y.; Li, S.B. Research advances of the influence of biochar on the aerobic constitution process of the organic wastes. J. Saf. Environ. 2018, 18, 1523–1526. [Google Scholar]
  7. Steiner, C.; Das, K.C.; Melear, N.; Lakly, D. Reducing nitrogen loss during poultry litter composting using biochar. J. Environ. Qual. 2010, 39, 1236–1242. [Google Scholar] [CrossRef] [PubMed]
  8. Czekala, W.; Malinska, K.; Caceresr, R.; Janczak, D.; Dach, J.; Lewick, A. Co-composting of poultry manure mixtures amended with biochar-the effect of biochar on temperature and C-CO2 emission. J. Bioresour. Technol. 2016, 200, 921–927. [Google Scholar] [CrossRef]
  9. Jia, X.Y.; Wang, M.; Yuan, W.Q.; Ju, X.T.; Yang, B.Z. The influence of biochar addition on chicken manure composting and associated methane and carbon dioxide emissions. J. Bioresour. 2016, 11, 5255–5264. [Google Scholar] [CrossRef]
  10. Zhang, J.N.; Chen, G.F.; Sun, H.F.; Zhou, S.; Zou, G.Y. Straw biochar hastens organic matter degradation and produces nutrient- rich compost. J. Bioresour. Technol. 2016, 200, 876–883. [Google Scholar] [CrossRef]
  11. Bruno, O.D.; CARLOS, A.S.; FÀBIO, S.H.; Asuncion, R.; Miguel, A.S.-M. Use of biochar as bulking agent for the composting of poultry manure, effect on organic matter degradation and humification. J. Bioresour. Technol. 2010, 101, 1239–1246. [Google Scholar]
  12. Uchimiya, M.; Ohno, T.; He, Z.Q. Pyrolysis temperature dependent release of dissolved organic carbon from plant, manure, and biorefinery wastes. J. Anal. Appl. Pyrolysis 2013, 104, 84–94. [Google Scholar] [CrossRef]
  13. Lin, Y.; Munroe, P.; Joseph, S.; Henderson, R.; Ziolkowski, A. Water extractable organic carbon in untreated and chemical treated biochars. J. Chemosphere 2012, 87, 151–157. [Google Scholar] [CrossRef]
  14. Guo, X.L.; Zuo, J.E.; Shi, X.C.; Wang, K.J. Mesophilic and Thermophilic Anaerobic Co-Digestion of Food Waste and Straw. J. Environ. Sci. 2017, 7, 3070–3071. [Google Scholar]
  15. Hu, X.J.; Zhang, M.; Yu, J.F.; Zhang, G.R. Food waste management in China status, problem and solutions. J. Acta Ecol. Sin. 2012, 32, 4575–4584. [Google Scholar]
  16. Eneji, A.E.; Honna, T.; Yamamoto, S.; Masuda, T.; Endo, T.; Irshad, M. Changes in humic substances and phosphorus fractions during composting. Commun. Soil Sci. Plant Anal. 2003, 34, 2303–2314. [Google Scholar] [CrossRef]
  17. Strom, P.F. Effect of temperature on bacterial species diversity in thermophilic solid-waste composting. Appl. Environ. Microbiol. 1985, 50, 899–905. [Google Scholar] [CrossRef]
  18. Sun, B.H. The study of decaying characteristics of plant residues in desert-oasis ecosystem. Master’s Thesis, Northwest Sci-Tech University of Agriculture and Forestry, Shanxi, China, 2003. [Google Scholar]
  19. Amir, S.; Jouraiphy, A.; Meddich, A.; Gharous, M.E.; Winterton, P.; Hafidi, M. Structural Study of Humic Acids During Composting of Activated Sludge-Green Waste, Elemental Analysis, FTIR and 13C NMR. J. Hazard. Mater. 2010, 177, 524–529. [Google Scholar] [CrossRef] [PubMed]
  20. Hardie, A.G.; Dynes, J.J.; Kozak, L.M.; Huang, P.M. The Role of Glucose in Abiotic Humification Pathways as Catalyzed by Birnessite. J. Mol. Catal. A Chem. 2009, 308, 114–126. [Google Scholar] [CrossRef]
  21. Wu, J.Q.; Zhao, Y.; Zhao, W.; Yang, T.X.; Zhang, X.; Xie, X.Y.; Cui, H.Y.; Wei, Z.M. Effect of Precursors Combined With Bacteria Communities on the Formation of Humic Substances during Different Materials Composting. J. Bioresour. Technol. 2017, 226, 191–199. [Google Scholar] [CrossRef] [PubMed]
  22. Kawasaki, S.; Maie, N.; Watanabe, A. Composition of humic acids with respect to the degree of humification in cultivated soils with and without manure application as assessed by fractional precipitation. J. Soil Sci. Plant Nutr. 2008, 54, 57–61. [Google Scholar] [CrossRef]
  23. Camiatelli, P.; Ceppi, S. Effects of composting technologies on the chemical and physicochemical properties of humic acids. J. Geoderma 2008, 144, 325–333. [Google Scholar] [CrossRef]
  24. Quagiltto, P.L.; Montonoeri, E.; Tambone, F.; Adani, F.; Godetto, R.; Viscardi, G. Chemicals from wastes, Compost-derived humic acid-like matter as surfactant. J. Environ. Sci. Technol. 2006, 40, 1686–1692. [Google Scholar] [CrossRef] [PubMed]
  25. Kumada, K.; Sato, O.; Ohsumi, Y.; Ohta, S. Humus composition of maintain soil in central Japan with special reference to the distribution of Ptype humic acid. J. Soil Sci. Plant Nutr. 1967, 13, 151–158. [Google Scholar] [CrossRef]
  26. Lu, R.K. Soil Agricultural Chemical Analysis Method; China Agricultural Science and Technology Press: Beijing, China, 2000; pp. 30–34. [Google Scholar]
  27. Kuwatsuka, S.; Watanabe, A.; Itoh, K.; Arai, S. Comparison of two methods of preparation of humic and fulvic acids, IHSS method and NAGOYA method. J. Soil Sci. Plant Nutr. 1992, 38, 23–30. [Google Scholar] [CrossRef]
  28. GB 7959-2012; Hygienic Requirements for Harmless Disposal of Night Soil. Standards Press of China: Beijing, China, 2013.
  29. Dou, S.; Chen, E.F.; Tan, S.W.; Xu, X.C. Characterization of humic acids from different origin. J. Jilin Agric. Univ. 1989, 11, 50–56, 123. [Google Scholar]
  30. Dou, S.; Chen, E.F.; Xu, X.C.; Tan, S.W.; Zhang, J.H. Effect of improving soil fertility by organic material application on structural characteristics of humic acids in soils, I. the chemical and thermal properties of HAs. J. Acta Pedol. Sin. 1992, 29, 199–207. [Google Scholar]
  31. Zhu, Y.; Li, A.M.; Li, C.; Dai, J.Y. Characteristics of soil humic substances by infrared spectra and thermal gravity. J. Environ. Chem. 2005, 24, 288–292. [Google Scholar]
  32. Li, L.J. Effects of bamboo charcoal on nitrogen conservation and greenhouse gas emissions reduction during swine manure composing. Master’s Thesis, Zhejiang University, Hangzhou, China, 2012. [Google Scholar]
  33. Li, R.H.; Zhang, G.J.; Wang, Q.; Zhang, Z.Q.; Mao, H. Effect of Mineral-based Additives on Organic matter Degradation during Pig Manure Aerobic Composting. J. Trans. Chin. Soc. Agric. Mach. 2014, 45, 190–198+316. [Google Scholar]
  34. Kang, J. Substance Transformation and Microbial Populations Evolution during the Composting of Cattle Manure, and Mechanistic Insights into Enzymatic Activity. Ph.D. Thesis, Lanzhou University of Technology, Lanzhou, China, 2019. [Google Scholar]
  35. Li, Y.T. The influence of biomass carbon to low C/N in high temperature aerobic composing. Master’s Thesis, Southwest University, Congqing, China, 2012. [Google Scholar]
  36. Macgregor, S.T.; Miller, F.C.; Psarianos, K.M.; Finstein, M.S. Composting process control based on interaction between microbial heat output and temperature. J. Appl. Environ. Microbiol. 1981, 41, 1321–1330. [Google Scholar] [CrossRef]
  37. Awasthi, M.K.; Pandey, A.K.; Bundela, P.S.; Wong, J.W.C.; Li, R.H.; Zhang, Z.Q. Co-composting of gelatin industry sludge combined with organic fraction of municipal solid waste and poultry waste employing zeolite mixed with enriched nitrifying bacterial consortium. J. Bioresour Technol. 2016, 213, 181–189. [Google Scholar] [CrossRef]
  38. Sánchez-Monedero, M.A.; Roig, A.; Paredes, C.; Bernal, M.P. Nitrogen transformation during organic waste composting by the Rutgers system and its effects on pH, EC and maturity of the composting mixtures. J. Bioresour. Technol. 2001, 78, 301–308. [Google Scholar] [CrossRef]
  39. Barauskait, K.; Ydelis, R.; Maeika, R. Screening of chemical composition and risk index of different origin composts produced in Lithuania. J. Environ. Sci. Pollut. Res. 2020, 27, 24480–24494. [Google Scholar] [CrossRef]
  40. Wang, Y.X.; Gao, L.F.; Ye, J.; Li, Y.C.; Weng, B.Q. Change of carbon substance characteristics during composting waste packing and fungus chaff. J. Trans. Chin. Soc. Agric. Eng. 2016, 32, 292–296. [Google Scholar]
  41. Zhang, J.N.; Lü, F.; Luo, C.H.; Shao, L.M.; He, P.J. Humification characterization of biochar and its potential as a composting amendment. J. Environ. Sci. 2014, 26, 390–397. [Google Scholar] [CrossRef] [PubMed]
  42. Xiong, X.; Li, Y.X.; Han, J.; Lin, C.Y. Formation and Transformation of Humus in Composting and Its Impacts on Bioavailability of Toxic Metals. J. Agro-Environ. Sci. 2008, 27, 2137–2142. [Google Scholar]
  43. Huang, H.L. Research on Characteristics of Ligninolytic Microorganisms and Their Effect on the Humification of the Agricultural Wastes Composting. Ph.D. Thesis, Hunan University, Changsha, China, 2009. [Google Scholar]
  44. Chen, W.; Wang, Y.; Liao, X.D. Application of biochar in organic waste aerobic composing. J. China Poult. 2015, 37, 41–50. [Google Scholar]
  45. Zhou, G.Y.; Dou, S.; Liu, S.J. The Structural Characteristics of Biochar and Its Effects on Soil Available Nutrients and Humus Composition. J. Agro-Environ. Sci. 2011, 30, 2075–2080. [Google Scholar]
  46. Wang, C.; Tu, Q.P.; Dong, D.; Strong, P.J.; Wang, H.L.; Sun, B.; Wu, W.X. Spectroscopic evidence for biochar amendment promoting humic acid synthesis and intensifying humification during composting. J. Hazard. Mater. 2014, 280, 409–416. [Google Scholar] [CrossRef]
  47. Wu, J.G.; Lü, Y.; Wang, M.H.; Jiang, Y.M. Study on decomposition of organic fertilizers by FTIR. J. Plant Nutr. Fertil. 2004, 10, 259. [Google Scholar]
  48. Jouraiphy, A.; Amir, S.; EIGharous, M.; Revel, J.-C.; Hafidi, M. Chemical and spectroscopic analysis of organic matter transformation during composting of sewage sludge and green plant waste. Int. Biodeterior. Biodegrad. 2005, 56, 101–108. [Google Scholar] [CrossRef]
Figure 1. Changes in the parameters during mixed composting of kitchen waste and biochar: (a) changes in temperature during composting, (b) changes in moisture content during composting, (c) changes in pH during composting, (d) changes in EC during composting.
Agronomy 13 00465 g001aAgronomy 13 00465 g001b
Figure 2. Effect of the mixed humification process of kitchen waste and biochar carbon on ΔlgK and E4/E6 of HAL:(a) Change of hue coefficient of diluted HAL aqueous solution with different treatments. (b) Changes in the ratio of absorbance at 465 and 665 nm of diluted HAL aqueous solution with different treatments. Note: Lowercase letters indicate significant differences between different culture times in the same treatment (p < 0.05).
Agronomy 13 00465 g002
Figure 3. FTIR spectra of the HAL of KC and KCBr treatments at different culture times.
Agronomy 13 00465 g003
Figure 4. Effects of KC and KCBr on DTA curves of HAL.
Agronomy 13 00465 g004
Table 1. Basic physical and chemical properties of the tested materials.
Primary MaterialMoisture Content (%)pHTOC (g/kg)TN (g/kg)C/N
Kitchen waste62.69 ± 1.506.07 ± 0.03422.80 ± 2.3723.30 ± 0.9918.15
Corn straw7.23 ± 0.136.31 ± 0.04395.10 ± 2.6412.61 ± 0.3331.33
Biochar16.50 ± 0.119.03 ± 0.05618.10 ± 2.531.10 ± 0.11561.9
Table 2. Effects of KC and KCBr on the organic carbon content of humus-like components in different culture times. Note: Lowercase letters indicate significant differences between different culture times in the same treatment (p < 0.05).
TreatmentCulture Time/dTOCTNHALFALHLMHAL Relative Content/%PQ/%
KCBr0329.30 ± 2.64 a17.30 ± 0.38 c21.56 ± 0.09 c62.48 ± 0.23 a233.35 ± 1.49 a6.55 ± 0.16 c25.66 ± 0.56 c
12235.60 ± 1.96 b27.34 ± 0.36 b31.24 ± 0.09 b41.80 ± 0.18 b151.59 ± 1.96 b13.26 ± 0.26 b42.70 ± 0.82 b
24195.50 ± 6.07 c33.89 ± 0.60 a44.44 ± 0.23 a15.4 ± 0.32 c126.47 ± 6.57 c22.76 ± 0.62 a74.30 ± 2.45 a
KC0359.30 ± 1.47 a16.01 ± 0.51 c21.95 ± 0.21 c79.69 ± 0.23 a234.11 ± 1.18 a6.11 ± 0.28 c21.58 ± 0.88 c
12335.20 ± 2.96 b18.01 ± 0.47 b38.60 ± 0.18 b54.56 ± 0.23 b229.51 ± 2.85 a11.52 ± 0.26 b41.44 ± 1.12 b
24314.60 ± 3.81 c22.59 ± 0.60 a61.95 ± 0.08 a22.88 ± 0.37 c210.91 ± 4.32 b19.69 ± 0.46 a73.11 ± 1.16 a
Table 3. Effect of KC and KCBr on the elemental composition of HAL at different culture times.
TreatmentCulture Time/dElements Content/(g·kg−1)Molar Ratio
CNHOC/NH/CO/C
KCBr0574.341.9591.01292.815.971.9010.382
12573.962.8984.36278.810.651.7630.362
24553.768.7279.24298.39.401.7170.404
KC0549.656.3377.92316.211.381.7010.431
12506.552.6782.27358.611.221.9490.531
24596.865.7890.26247.210.581.8150.311
Table 4. Effects of relative intensity of the main absorption peaks in the FTIR spectrum of HAL by KC and KCBr treatments at different culture times.
TreatmentCulture Time/dRelative Intensity%Ratio
33702920285017201650153012441023I2920/I1720I2920/I1650
KCBr074.155.661.060.494.733.061.434.8713.811.42
1251.236.170.915.9818.336.683.393.371.180.39
2449.514.040.665.9318.576.843.895.690.790.25
KC074.913.620.67-10.813.171.093.23-0.39
1266.847.611.82-7.786.723.163.35-1.21
2470.384.440.97-8.051.622.443.72-0.67
Table 5. Comparative analysis of exothermic heat and mass loss of HAL by KC and KCBr under different culture times.
TreatmentCulture Time/dExothermic Heat/kJ·g−1High/Medium Ratio of Exothermic HeatMass Loss/mg·g−1High/Medium Ratio of Mass Loss
MediumHighMediumHigh
KCBr02.3861.8090.758535.1301.90.564
122.1053.7161.765485.4405.10.835
242.9085.8382.008476.0402.70.846
KC03.0824.0861.32685.7899.00.394
121.2141.4251.174361.1373.61.035
240.8743.2493.717421.4503.41.195
Disclaimer/Publisher’s Note: The statements, opinions and data contained in all publications are solely those of the individual author(s) and contributor(s) and not of MDPI and/or the editor(s). MDPI and/or the editor(s) disclaim responsibility for any injury to people or property resulting from any ideas, methods, instructions or products referred to in the content.

