Article

Does Drone Data Allow the Assessment of Phosphorus and Potassium in Soil Based on Field Experiments with Winter Rye?

by
Piotr Mazur
1,
Dariusz Gozdowski
2,
Wojciech Stępień
3 and
Elżbieta Wójcik-Gront
2,*
1
Agrotechnology, Jagiellonów 4, 73-150 Łobez, Poland
2
Department of Biometry, Institute of Agriculture, Warsaw University of Life Sciences, Nowoursynowska 159, 02-776 Warsaw, Poland
3
Division of Agricultural and Environmental Chemistry, Institute of Agriculture, Warsaw University of Life Sciences, Nowoursynowska 159, 02-776 Warsaw, Poland
*
Author to whom correspondence should be addressed.
Agronomy 2023, 13(2), 446; https://doi.org/10.3390/agronomy13020446
Submission received: 22 December 2022 / Revised: 23 January 2023 / Accepted: 31 January 2023 / Published: 2 February 2023

Abstract

:
The evaluation of the nutrient content in the soil, such as potassium and phosphorus, is very important, especially in precision agriculture, where the fertilizer rate should be adjusted to field variability in terms of nutrient content. Soil chemical analysis is time-consuming and expensive, and dense soil sampling is not always possible. In recent years, remote sensing methods have been used to assess the within-field variability of soil and crop nutritional status. The main aim of this study was to evaluate the relationship between UAV-derived spectral reflectance for winter rye in a long-term experiment for different fertilization with phosphorus and potassium. The study was conducted in 2022 in two field experiments in which winter rye was cultivated in monoculture and with crop rotation. The experiments were located in central Poland in Skierniewice. Statistical analyses were performed using univariate and multivariate methods, e.g., analysis of correlation, regression, and principal component analysis (PCA). The effect of phosphorus and potassium fertilization on the UAV-derived spectral reflectance of winter rye was weak, weaker in comparison to the effect of nitrogen fertilization. The effect of phosphorus and potassium fertilization on spectral reflectance was stronger in the experiment with monoculture than in the experiment with crop rotation. On the basis of correlation coefficients and PCA, negative relationships were proven between available soil potassium and spectral reflectance in the range of blue, green, and red bands and positive with red edge and near-infrared bands. The first principal component (PC1) was very strongly correlated with almost all spectral bands, either positively or negatively. The correlation of potassium and phosphorus content was very weak with PC1 in the experiment with crop rotation, while in the experiment with rye monoculture, the correlation was slightly stronger, indicating a stronger effect of nutrient deficiency in monoculture.

1. Introduction

Remote sensing methods can be used to detect nutrient deficiencies in crops and to optimize fertilization [1]. Remote sensing data can be acquired using on-ground sensors, sensors mounted on unmanned aerial vehicles (UAVs), or satellite-derived data [2,3]. The evaluation of plant stress is usually based on reflectance in the visible (380–720 nm) and infrared (720–1500 nm) ranges. These ranges of wavelength are connected with the reflectance of most common leaf pigments, including chlorophyll (a and b) and carotenoids [4,5]. Some studies [6,7,8] proved a relationship between the spectral reflectance in the range from 1500 to 2500 nm (short-wave infrared—SWIR) and nutritional status, including the content of potassium and phosphorus in leaves and the stress of various plants. Spectral reflectance can be useful in detecting nutrient deficiency only when one factor is involved, as a deficiency of two or more nutrients is very difficult to diagnose [9]. Deficiency evaluation for a nutrient can be based on vegetation indices, which are calculated using two or more spectral bands [3,10] or based on reflectance profiles for multiple bands [11,12].
Most of the sensors are passive, i.e., they register sun radiation reflectance, but some of them are active (mainly on ground sensors) [13,14,15]. Most of the sensors used to evaluate the nutritional status of crops are multispectral, meaning that they register reflectance in several ranges of radiation. A more specific evaluation of crop reflectance is possible using hyperspectral sensors that register several dozen bands of wavelength [16,17].
In most studies, remote sensing methods are used to evaluate the nutritional status of crops for nitrogen, which has a very strong effect on crop reflectance [18,19]. Nitrogen content in plants is strongly related to chlorophyll content. Relationships between many vegetation indices based on remote sensing data with nitrogen content in plants per unit area are very strong and positive [20]. Since nitrogen concentration in plants is related most strongly with reflectance in red and near-infrared spectra, both of these bands are used to calculate vegetation indices (including NDVI—Normalized Difference Vegetation Index (NIR − RED)/(NIR + RED)) to evaluate nitrogen deficiency [19,21]. Three band vegetation indices (e.g., nitrogen planar domain index—NPDI), based on wavelengths in the range of red, red edge, and near-infrared spectra, can be used to assess nitrogen nutritional status if saturation affected by high nitrogen and biomass levels is observed [22]. The evaluation of the nitrogen nutritional status can be used for the optimized variable rate fertilization of crops which form a uniform canopy, such as, e.g., cereals [23]. In addition to nitrogen, the most important macronutrients for crops are potassium and phosphorus.
Due to the fact that the deficit of both potassium and phosphorus occurs much less often than nitrogen, and these two macronutrients have a weaker effect on crop reflectance, studies on remote sensing for the evaluation of deficiency of potassium and phosphorus are not very common. However, some research has already been performed on this subject. In the study by Furlanetto et al. [24], relationships between selected UAV-derived vegetation indices and potassium leaf content in maize were studied. Depending on the stage of maize growth, the strongest relationships were observed with the RVI-simple ratio between infrared and red NIR/RED (in early growth stages) or with GRVI-green ratio vegetation index NIR/GREEN (in later growth stages) or RNIR-simple ratio between red and infrared RED/NIR (R2 equals 0.71, 0.79 and 0.71, respectively). The vegetation indices are based on near-infrared, red, and green reflectance indicating that these spectra were related to potassium deficiency in maize. Peng et al. [25] studied the relationships between the content of potassium and phosphorus in grape leaves with multispectral data (vegetation indices and individual bands) acquired using a UAV. The correlations between bands of visible light (blue, green, red) reflectance and the content of potassium and phosphorus in leaves were negative, while the correlation with near-infrared was positive. Most of the studied vegetation indices were positively correlated with the content of potassium and phosphorus in leaves. Depending on the growth stage of the grape, the strongest correlations occurred for different spectral indices. Potassium deficiency could be evaluated using a reflectance profile based on UAV remote sensing data. In the study by Severtson et al. [11] on canola, multispectral and hyperspectral reflectance profiles were compared between plants that were potassium-sufficient and -deficient. The reflectance of potassium-deficient plants was higher in the range of visible light (especially for the blue band) and lower for near-infrared bands (especially in the range of wavelengths from 720 to 850 nm). In the study by Nguyen et al. [12], hyperspectral remote sensing data were obtained for two plants, bok choy and spinach. Potassium concentration in plants was most strongly correlated with a wavelength reflectance in the range of 714–750 nm, 845–915 nm, and 959–962 nm for bok choy, while for spinach with a wavelength in the range of 890–915 nm, 944–949 nm, and 965–969 nm. Phosphorus concentration was strongly correlated with wavelength reflectance in the range of 659–669 nm, 750 nm, and 959–962 nm for bok choy; for spinach with a wavelength in the range of 768–776 nm. In the study by Siedliska et al. [26], the effect of different doses of phosphorus fertilization on the hyperspectral reflectance of three crops, celery, sugar beet, and strawberry, was studied. The strongest effect of phosphorus fertilization for all three crops was observed for reflectance in the range of 750–850 nm, 1200–1300 nm, 1600–1800 nm, and 2200–2400 nm. The reflectance for all these wavelength ranges was stronger with higher phosphorus fertilization. The profile of reflectance in the range of visible light (400–700 nm) was very similar for all levels of phosphorus fertilization. In the study by Chen et al. [27], the opposite results were obtained, i.e., strong positive correlations were found between phosphorus content in the leaves of apple and the light reflectance in the range of 400–700 nm. Moreover, negative correlations were found between phosphorus content and reflectance in the range of 800–1300 nm. In the same study, correlations between potassium content in apple leaves and reflectance in all studied wavelength ranges were very weak. In a laboratory study by de Oliveira et al. [28] on cotton, the effect of potassium deficiency on the reflectance profile was evaluated. Potassium fertilization increased the reflectance in the range of 500–650 nm and 1600–1800 nm.
Studies on the detection of the deficiency of phosphorus and potassium using remote sensing methods in field conditions are difficult because the deficiency of these two nutrients is usually not very severe since some amount of these nutrients is available even in unfertilized soil. The assessment of severe deficiency of these nutrients requires long-term experiments in which phosphorus and potassium fertilizers have not been applied for many years. For this reason, there are very few studies that conduct this type of research. Moreover, the effect of the deficiency of phosphorus and potassium is usually weaker in comparison to nitrogen deficiency and more difficult to detect using remote sensing methods. The aim of this study was the evaluation of multispectral reflectance based on UAV-derived data for winter rye treatments with different fertilization, especially phosphorus and potassium, in long-term experiments.

2. Materials and Methods

2.1. Description of the Experiments

Two long-term field experiments (monoculture and crop rotation) conducted in 2022 with winter rye were included in the study. The experiments were located in central Poland in Skierniewice (51.965° N, 20.160° E) at the Experimental Station of the Institute of Agriculture of Warsaw University of Life Sciences. The soil in the experimental field was classified as Luvisols. The humus horizon (Ap) of this soil, with a thickness of approx. 25 cm, was made up of heavy loamy sand (16% in ex. 1 I 17% ex.2 of <0.02 mm fraction), and the Et (eluvial leaching) wash-out horizon (26–45 cm) of slightly loamy sand (13% of <0.02 mm fraction). The Bt (illuvial accumulation) wash-in horizon (46–75 cm) and bedrock below 75 cm were made up of light clay (28% ex.1 I 29% ex.2 of <0.02 mm fraction). The content of soil particles was evaluated using an areometric method for soil horizons in both experiments is presented in Table 1.
The climate of the area of the study was hemiboreal according to the Köppen-Geiger climate classification [29]. Experiments have been conducted with the same fertilization since 1974. The experiments were conducted in a randomized complete block design (RCBD). The size of the individual plot was 36 m2.
The treatments of the experiments are presented in Table 2.
Archival results from 2017 of chemical composition (the content of total N, P, and K) of plants (in grain and straw) during harvest are presented in Table 3 and Table 4.
In both experiments, the rates of fertilizers, if applied for treatments, were adjusted to crop requirements. The following rates of mineral fertilizers were applied annually: N—90 kg ha−1 (as NH4NO3), P—26 kg ha−1 (as Ca(H2PO4)2), and K—91 kg ha−1 (as KCl). Lime was applied every 4 years at a dose of 1.6 t ha−1 of CaO. Every 5 years, 30 t ha−1 of farmyard manure was applied. Winter rye was sown on 4 October 2021 and harvested on 24 August 2022.

2.2. Methods of Measurements of Experimental Data

After harvest, soil samples were collected from each plot from the arable layer (0–20 cm of depth), and contents of available phosphorus, potassium, and magnesium were measured using the Mehlich 3 method [30], and soil pH was obtained using a potentiometric method in 1 M KCl solution [31].
The DJI Phantom 4 Multispectral (SZ DJI Technology Co., Ltd., Shenzhen, China) unmanned aerial vehicle was used to acquire multispectral images. The UAV was equipped with an array of six 1/2.9-inch CMOS sensors, including RGB and 5 individual band sensors, i.e., blue (B): 450 nm ± 16 nm; green (G): 560 nm ± 16 nm; red (R): 650 nm ± 16 nm; red edge (RE): 730 nm ± 16 nm; near-infrared (NIR): 840 nm ± 26 nm. Flights were planned and performed using DJI GS Pro software (SZ DJI Technology Co., Ltd., Shenzhen, China). The altitude of all flights was 40 m above ground level; overlaps were set at 70%. The terrain resolution of the images was about 2 cm. The images were georeferenced with high accuracy (error less than several cm) based on the RTK correction of the GNSS receiver mounted on the UAV. The flights were performed four times, i.e., at the end of rye booting on 5 May 2022, at the heading stage on 26 May 2022, during flowering on 3 June 2022, and at the beginning of the development of grains on 13 June 2022. Pix4Dfields software (Pix4D S.A. Prilly, Switzerland) was used to prepare a multispectral orthomosaic map.

2.3. Data Analysis

Vector layers containing the border of plots were used to calculate reflectance means. To avoid a border effect, a 30 cm buffer was removed for each plot from the analysis. The zonal statistics tool in QGIS 3.28 software (Free Software Foundation Inc., Boston, MA, USA) was used to calculate the mean reflectance per plot. The same software was used to visualize the maps. Statistical analysis was conducted using one-way analysis of variance (ANOVA) and Tukey’s HSD multiple comparisons procedure to distinguish homogenous groups. Relationships between spectral reflectance were evaluated using Pearson’s correlation coefficients. Moreover, multivariate statistical analyses were performed. Principal component analysis (PCA) was applied to evaluate multivariate relationships between studied variables and the similarity of the experimental treatments. The Statistica 13 (TIBCO, Palo Alto, CA, USA) program was used for statistical analyses [32]. In all analyses, the significance level was set at 0.05.

3. Results

3.1. Effect of Fertilization on Spectral Reflectance of Winter Rye

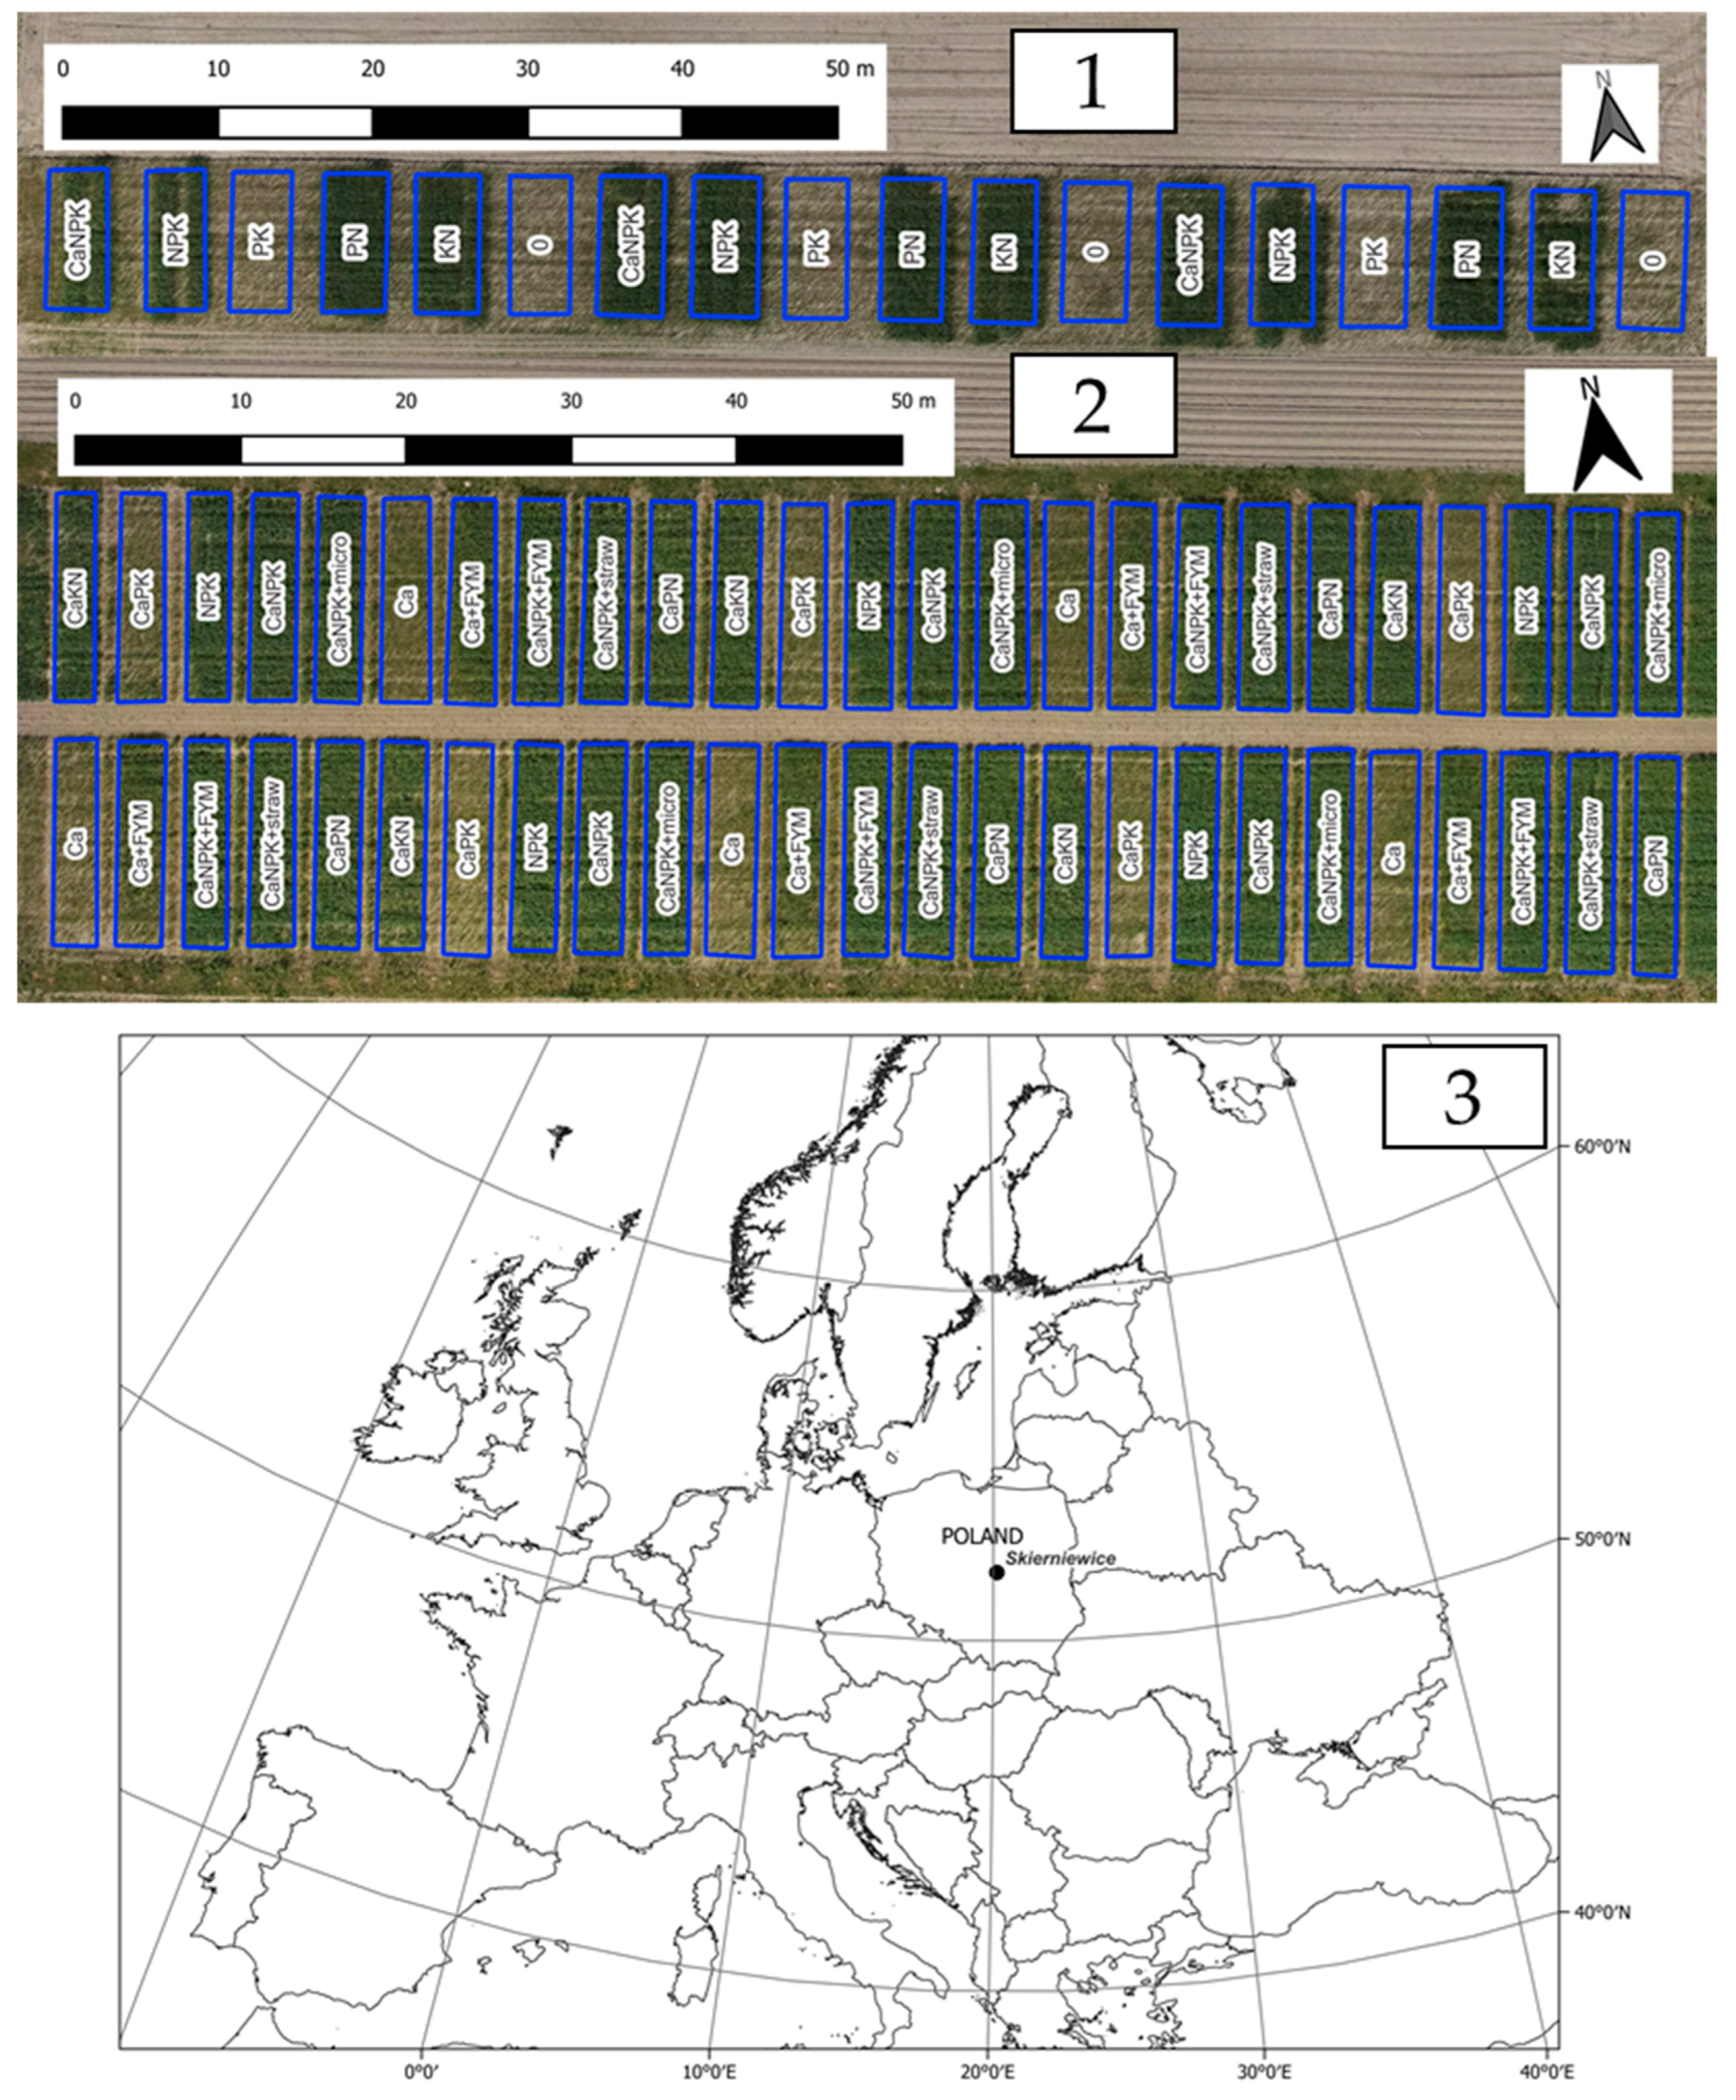
The RGB maps for both experiments are presented in 
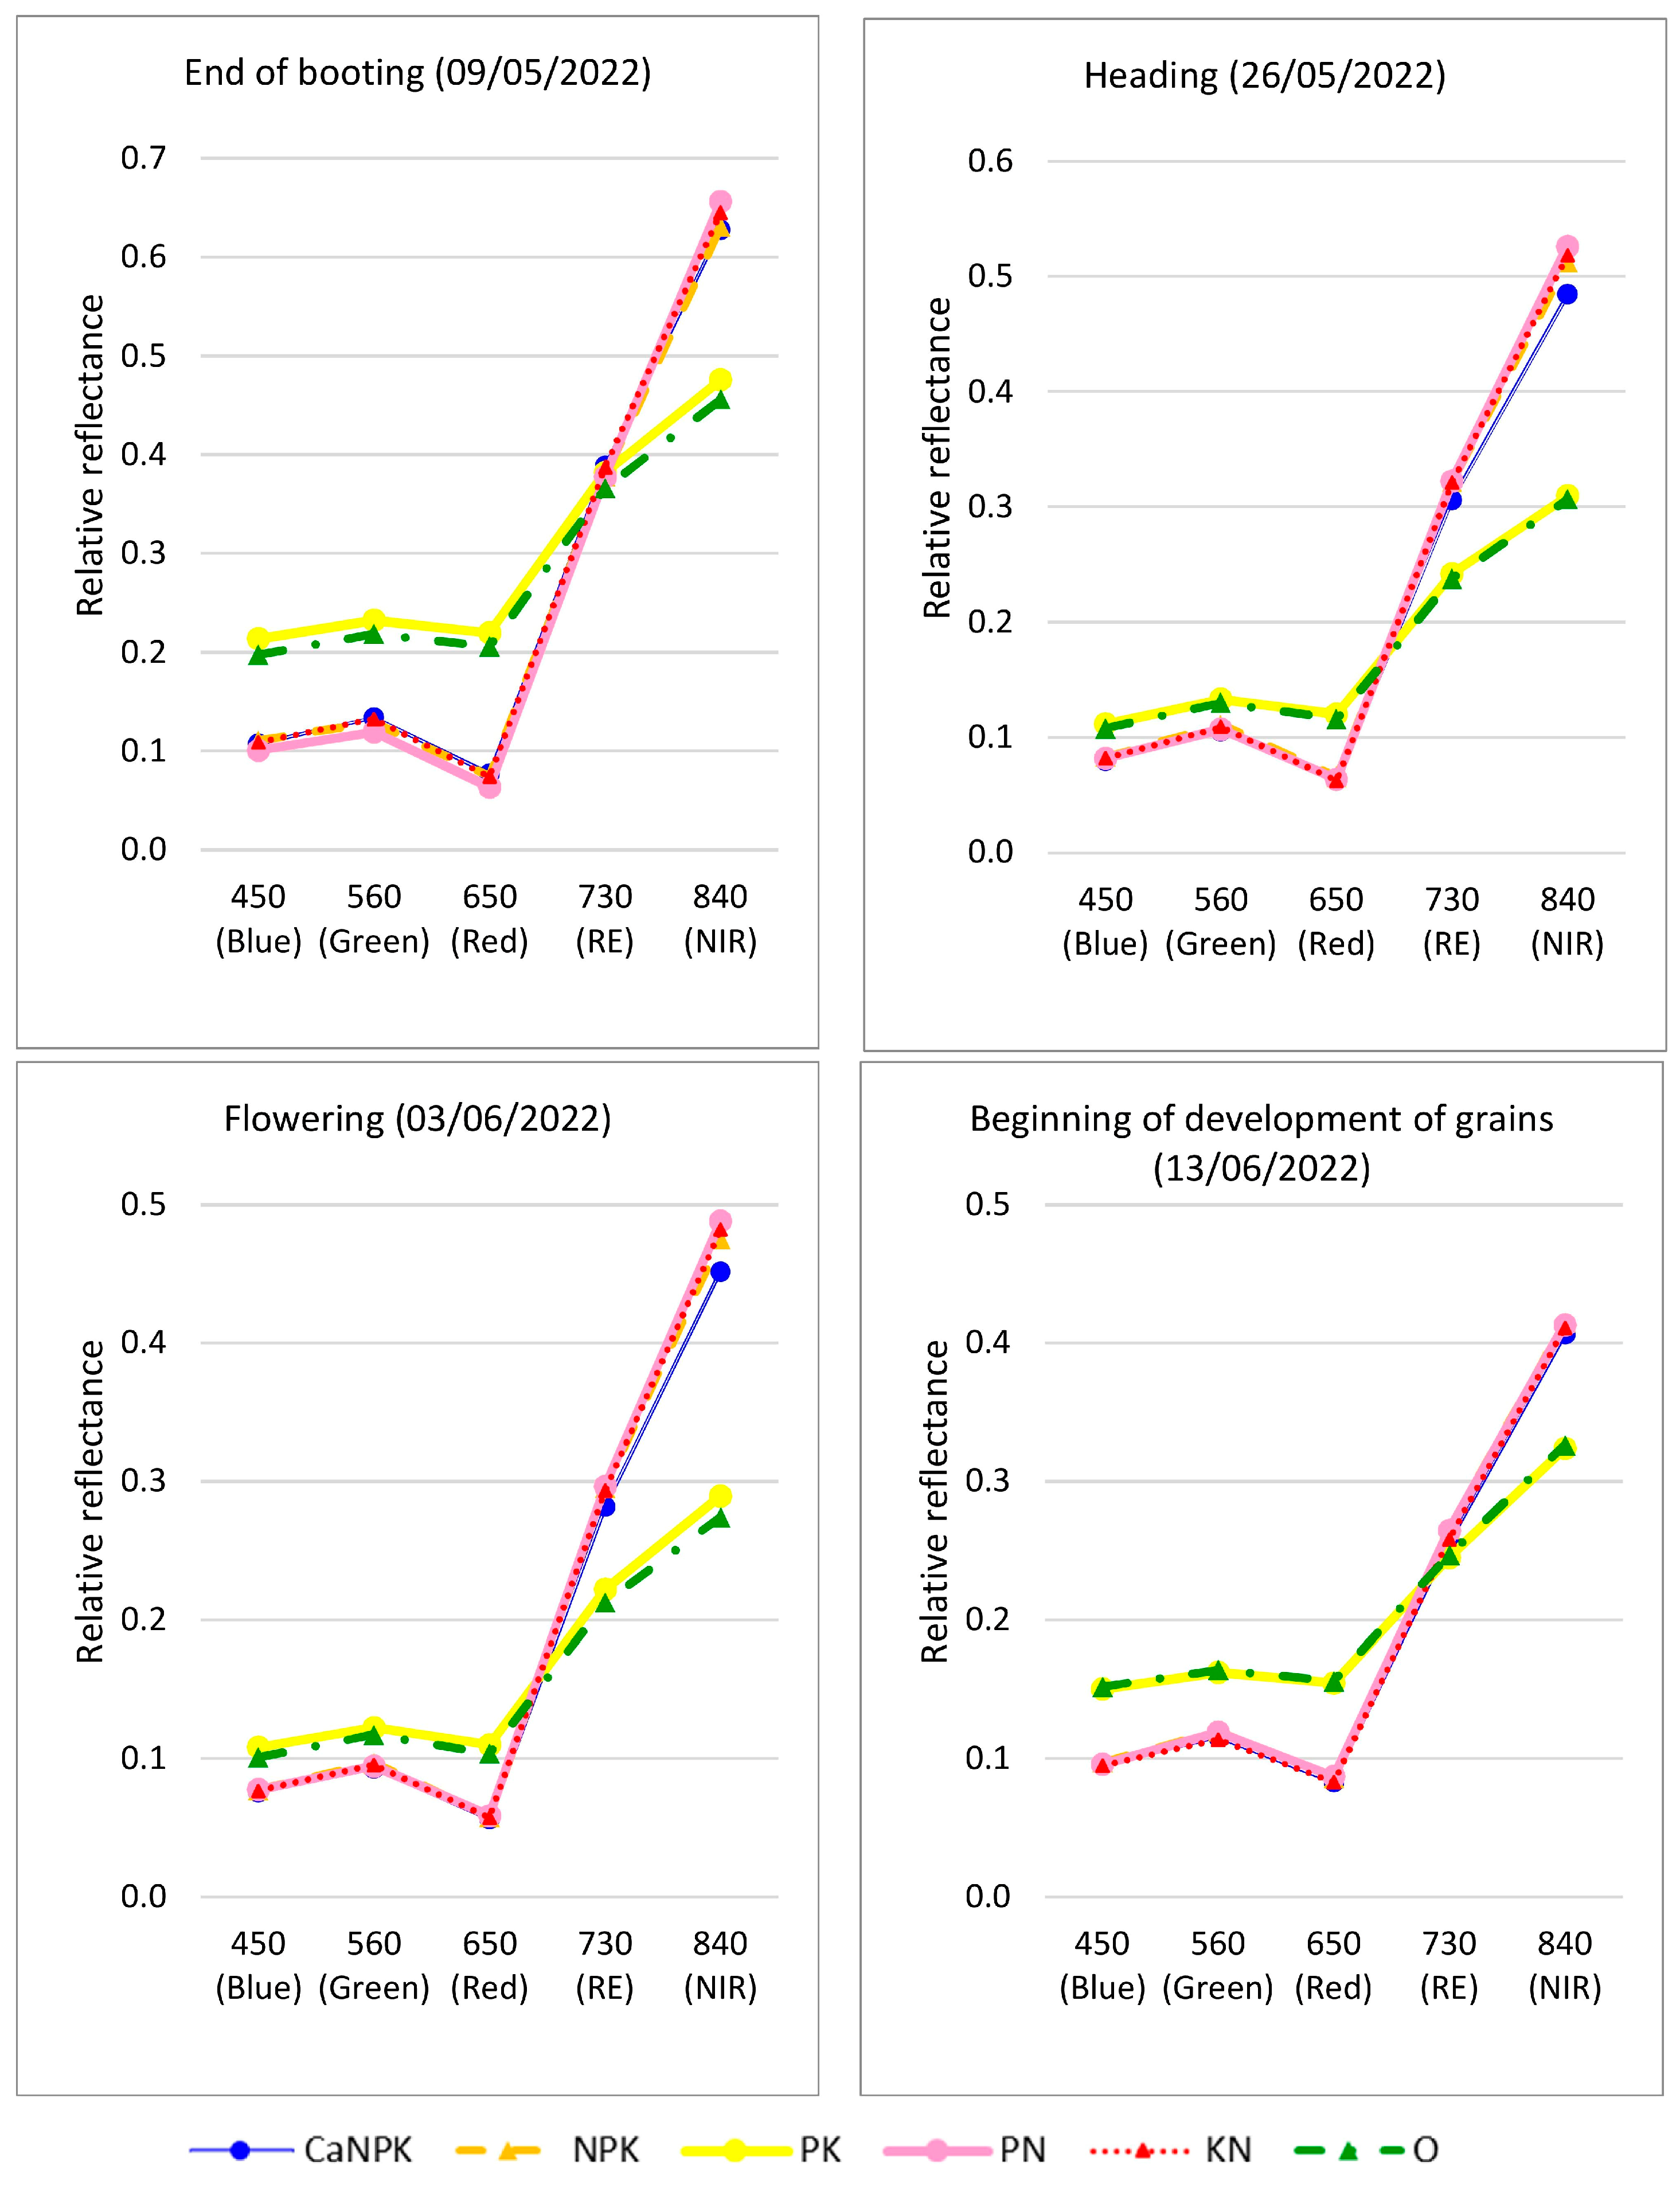
Figure 1. The means of relative spectral reflectance for different treatments in two experiments are presented in Table 5 and in Figure 2 for the experiment with crop rotation, and in
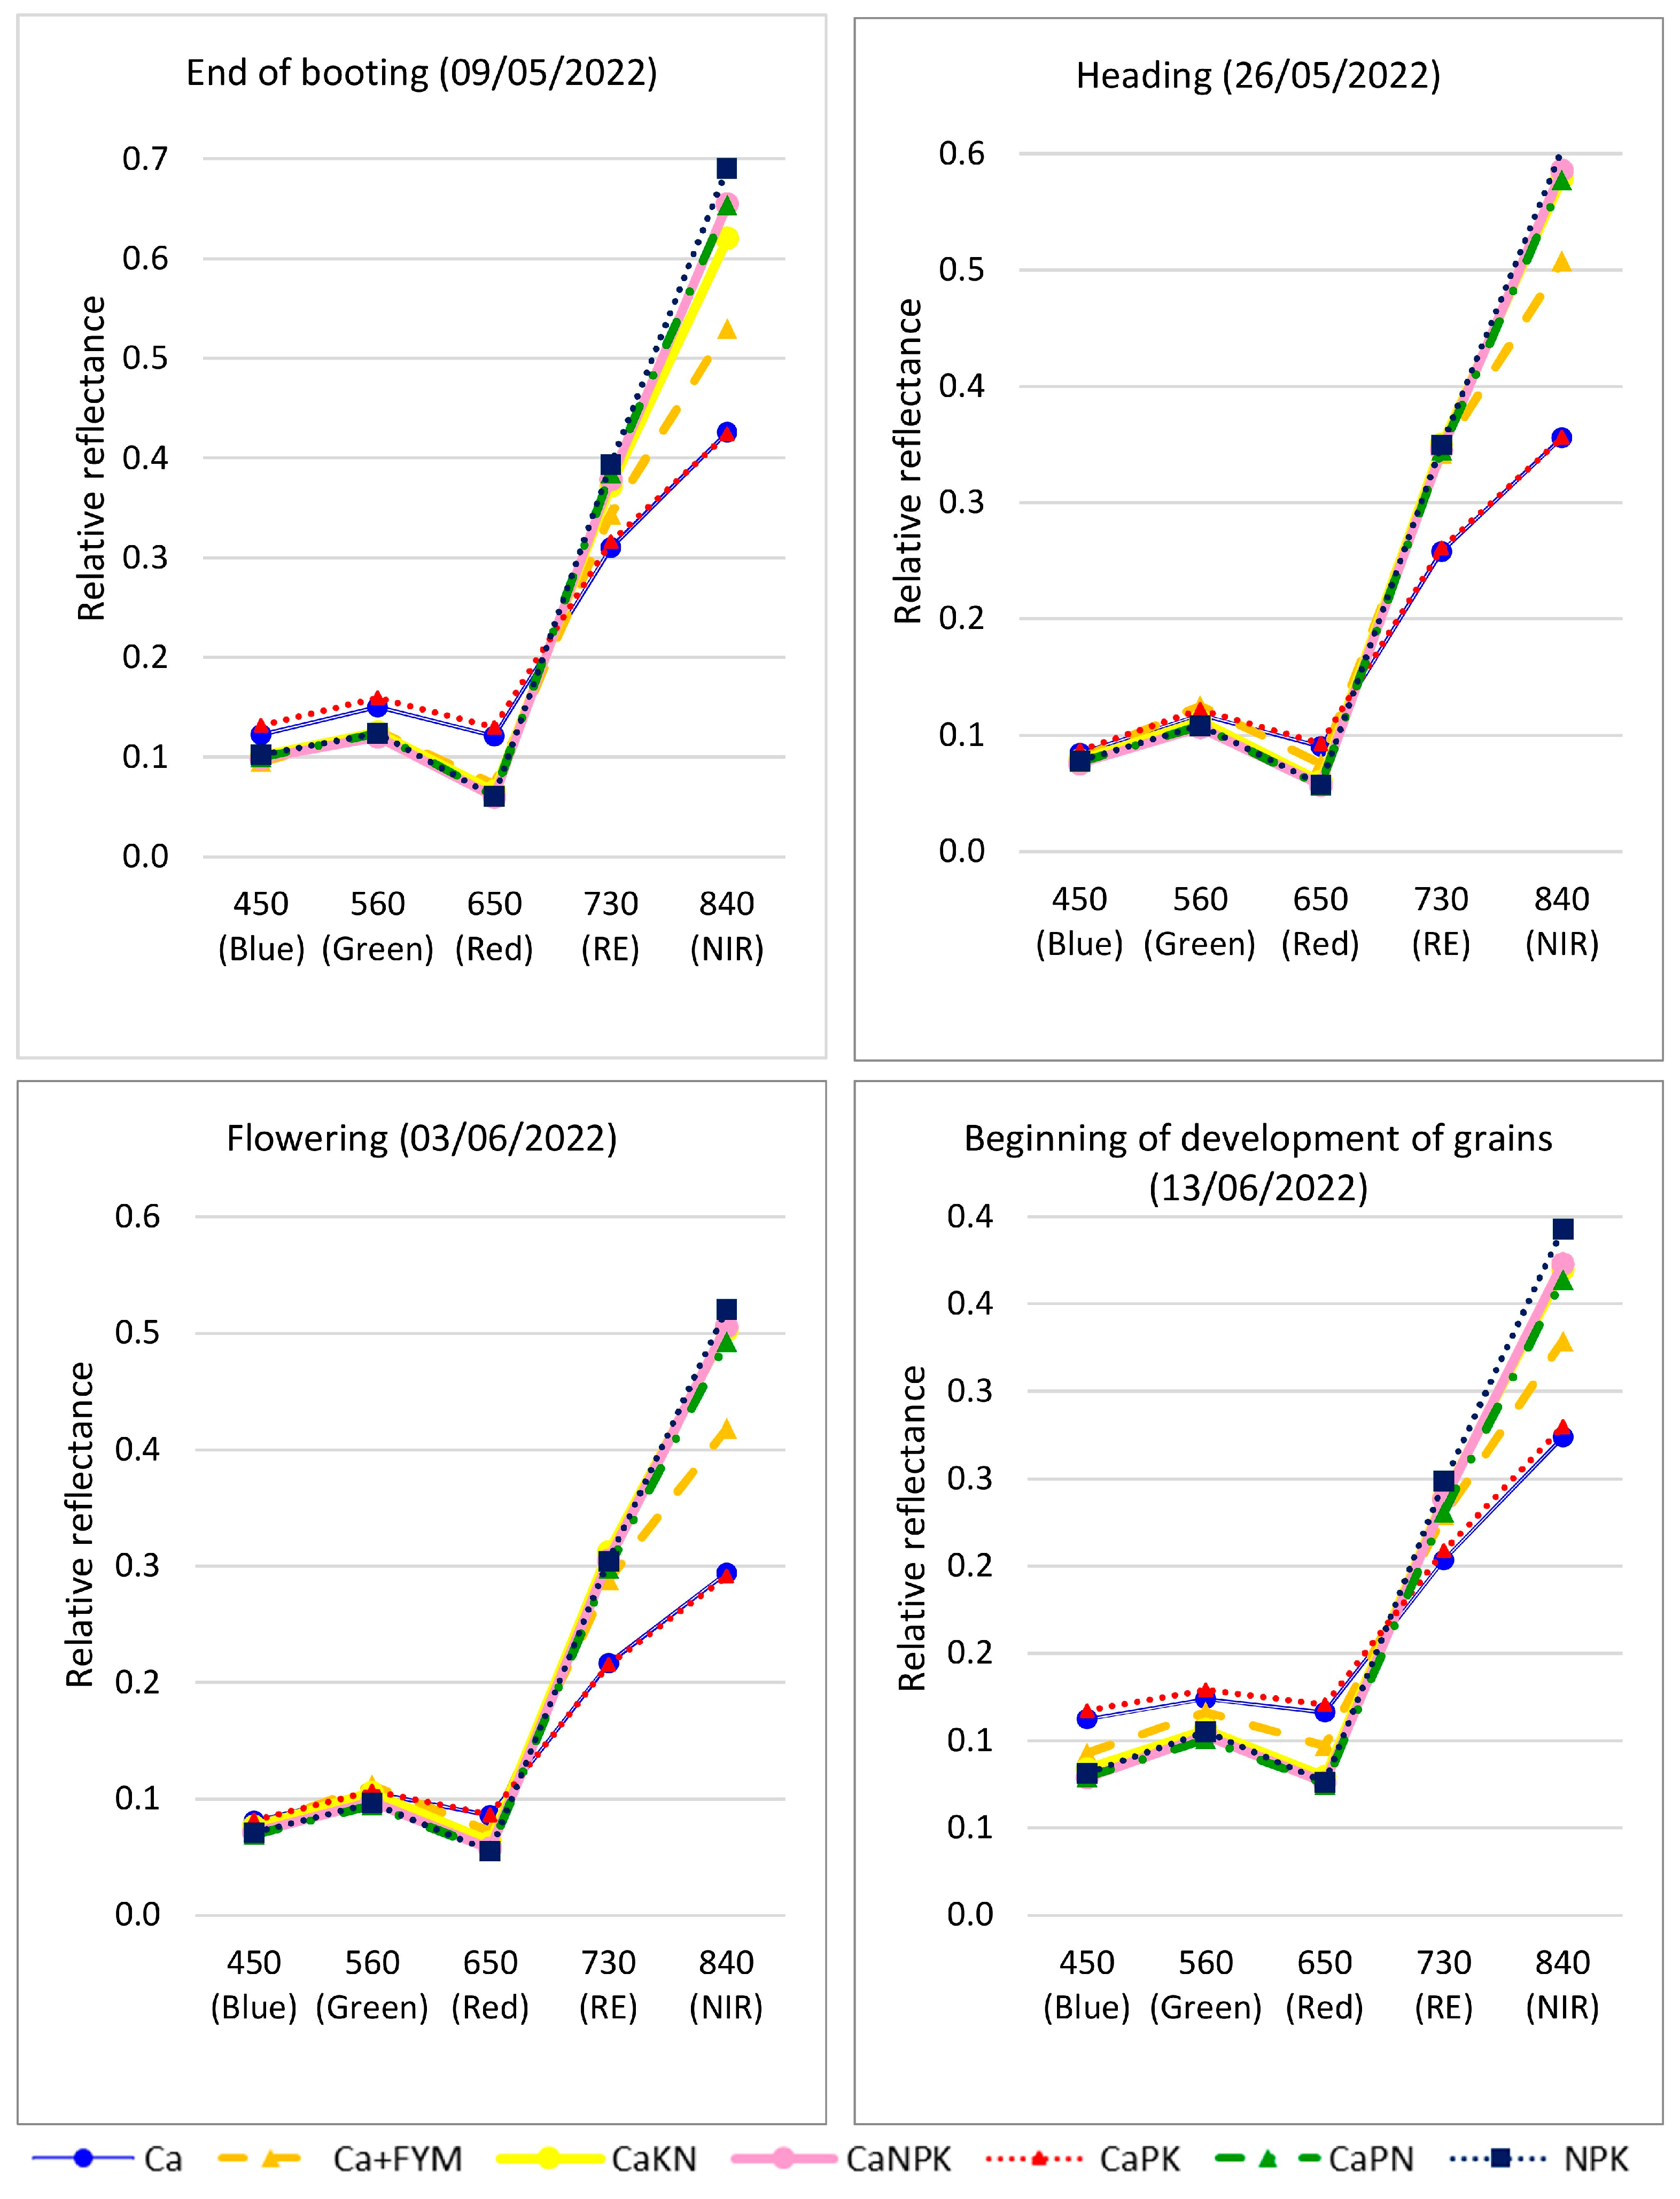
 Table 6 and Figure 3 for the experiment with the monoculture of winter rye. In these tables, the results of the analysis of variance (F-statistic and p-value) for comparisons of means of studied variables between all the treatments were presented. To evaluate the effect of potassium and phosphorus fertilization, a t-test was performed, and P-values were presented. The treatment effect evaluated for all treatments together was significant for almost all the studied spectral reflectance indices for both experiments. The P-values were below 0.05, and the only exceptions were spectral reflectance 730 nm (red edge band) on 9 May (end of booting) and 730 nm on 13 June (beginning of the development of grains) in experiment 1 (with crop rotation).
In experiment 1 (with crop rotation), the strongest effect on spectral reflectance had nitrogen fertilization. All treatments with nitrogen fertilization had lower spectral reflectance for the wavelengths 450 nm (blue), 560 nm (green), and 650 nm (red), and higher reflectance was observed for wavelength 730 nm (red edge) and 840 nm (near-infrared). The differences varied in different growth stages, and the highest visible light reflectance (red, green, and blue bands) was observed at the end of booting and the lowest during flowering. For the near-infrared reflectance, the greatest differences were observed during heading and flowering, while the smallest were at the beginning of grain development.
The results of the t-test for experiment 1 proved a significant effect of potassium fertilization (comparison between PN and NPK treatments) only for wavelength 840 nm (near-infrared) on 9 May (end of booting). The relative reflectance was higher for PN fertilization treatment in comparison to NPK fertilization. The effect of phosphorus fertilization (KN fertilization vs. NPK fertilization) was not significant. For all studied spectral reflectances, p-values were greater than 0.05.
In experiment 2 (monoculture of winter rye), comparisons of all treatments based on ANOVA proved significant differences for all spectral reflectances. The strongest effect of treatment, i.e., the highest F-statistic and the lowest p-value, was observed in most of the growth stages for the near-infrared band (840 nm). The greatest differences in the means of spectral reflectances were observed between treatments without nitrogen fertilization (Ca and CaPK fertilization) compared to all other treatments. The effect of potassium and phosphorus fertilization on spectral reflectance evaluated using a t-test was weak. A significant effect of potassium fertilization (a comparison between CaPN and CaNPK fertilization) was observed only for one spectral reflectance, i.e., 730 nm (red edge) on 13 June (beginning of grain development). A higher mean spectral reflectance was observed for treatment with potassium fertilization (CaNPK) in comparison to the treatment without potassium (CaPN). A significant effect of phosphorus fertilization on spectral reflectance was observed only for the wavelength of 650 nm (red band) on 9 May (end of booting). The spectral reflectance was higher for the treatment without phosphorus fertilization (CaKN) in comparison to the treatment with phosphorus (CaNPK).

3.2. Relationships between Spectral Reflectance and Soil Properties

Correlation coefficients between relative spectral reflectance and pH, the content of available nutrients (P, K, and Mg) in soil and grain yield of winter rye are presented in Table 7 for experiment 1 (with crop rotation) and in Table 8 for experiment 2 (monoculture of rye).
All correlation coefficients for experiment 1 between spectral reflectances and chemical soil properties were not significant, but similar relationships were observed for both phosphorus and potassium, i.e., weak but positive correlations with spectral reflectance of wavelength 730 nm (red edge band) and 840 nm (near the infrared band) for all studied growth stages. Relative spectral reflectances were very strongly correlated with the grain yield of winter rye. The correlations were negative with wavelengths 450 nm (blue), 560 nm (green), and 650 nm (red), while positive with 730 nm (red edge) and 840 nm (near the infrared band). In experiment 2, positive, significant relationships were found between the content of P and K in the soil as well as pH and the content of Mg. Other correlations between soil nutrients and grain yield of rye were not significant.
In experiment 2 (monoculture), similar relationships were found between spectral reflectance and the soil content of phosphorus and potassium, but the correlations were stronger, and some of them were statistically significant. For phosphorus, only a significant positive correlation (r = 0.32) was observed with spectral reflectance 730 nm (red edge band) on 26 May (heading stage). In the case of potassium, many more correlations were significant. The strongest positive correlations were observed on 13 June, i.e., during the beginning of grain development. The strongest positive correlation coefficient (r = 0.49) was observed between the available potassium in the soil and the spectral reflectance of wavelength 730 nm (red edge). For the remaining growth stages, correlations were slightly weaker but almost all significant, positive with red edge and near-infrared and negative with blue, green, and red bands. The correlations between spectral reflectances and grain yield in experiment 2 were significant and similar to those observed in experiment 1 but slightly weaker. Positive significant relationships were found in experiment 2 between P and K contents in soil, pH and Mg content in the soil, while significant negative correlations were found between pH and P content in the soil, between Mg and P, as well as between the Mg and K contents in soil. The grain yield of rye was significantly positively correlated with the content of P and K while negatively correlated with pH.

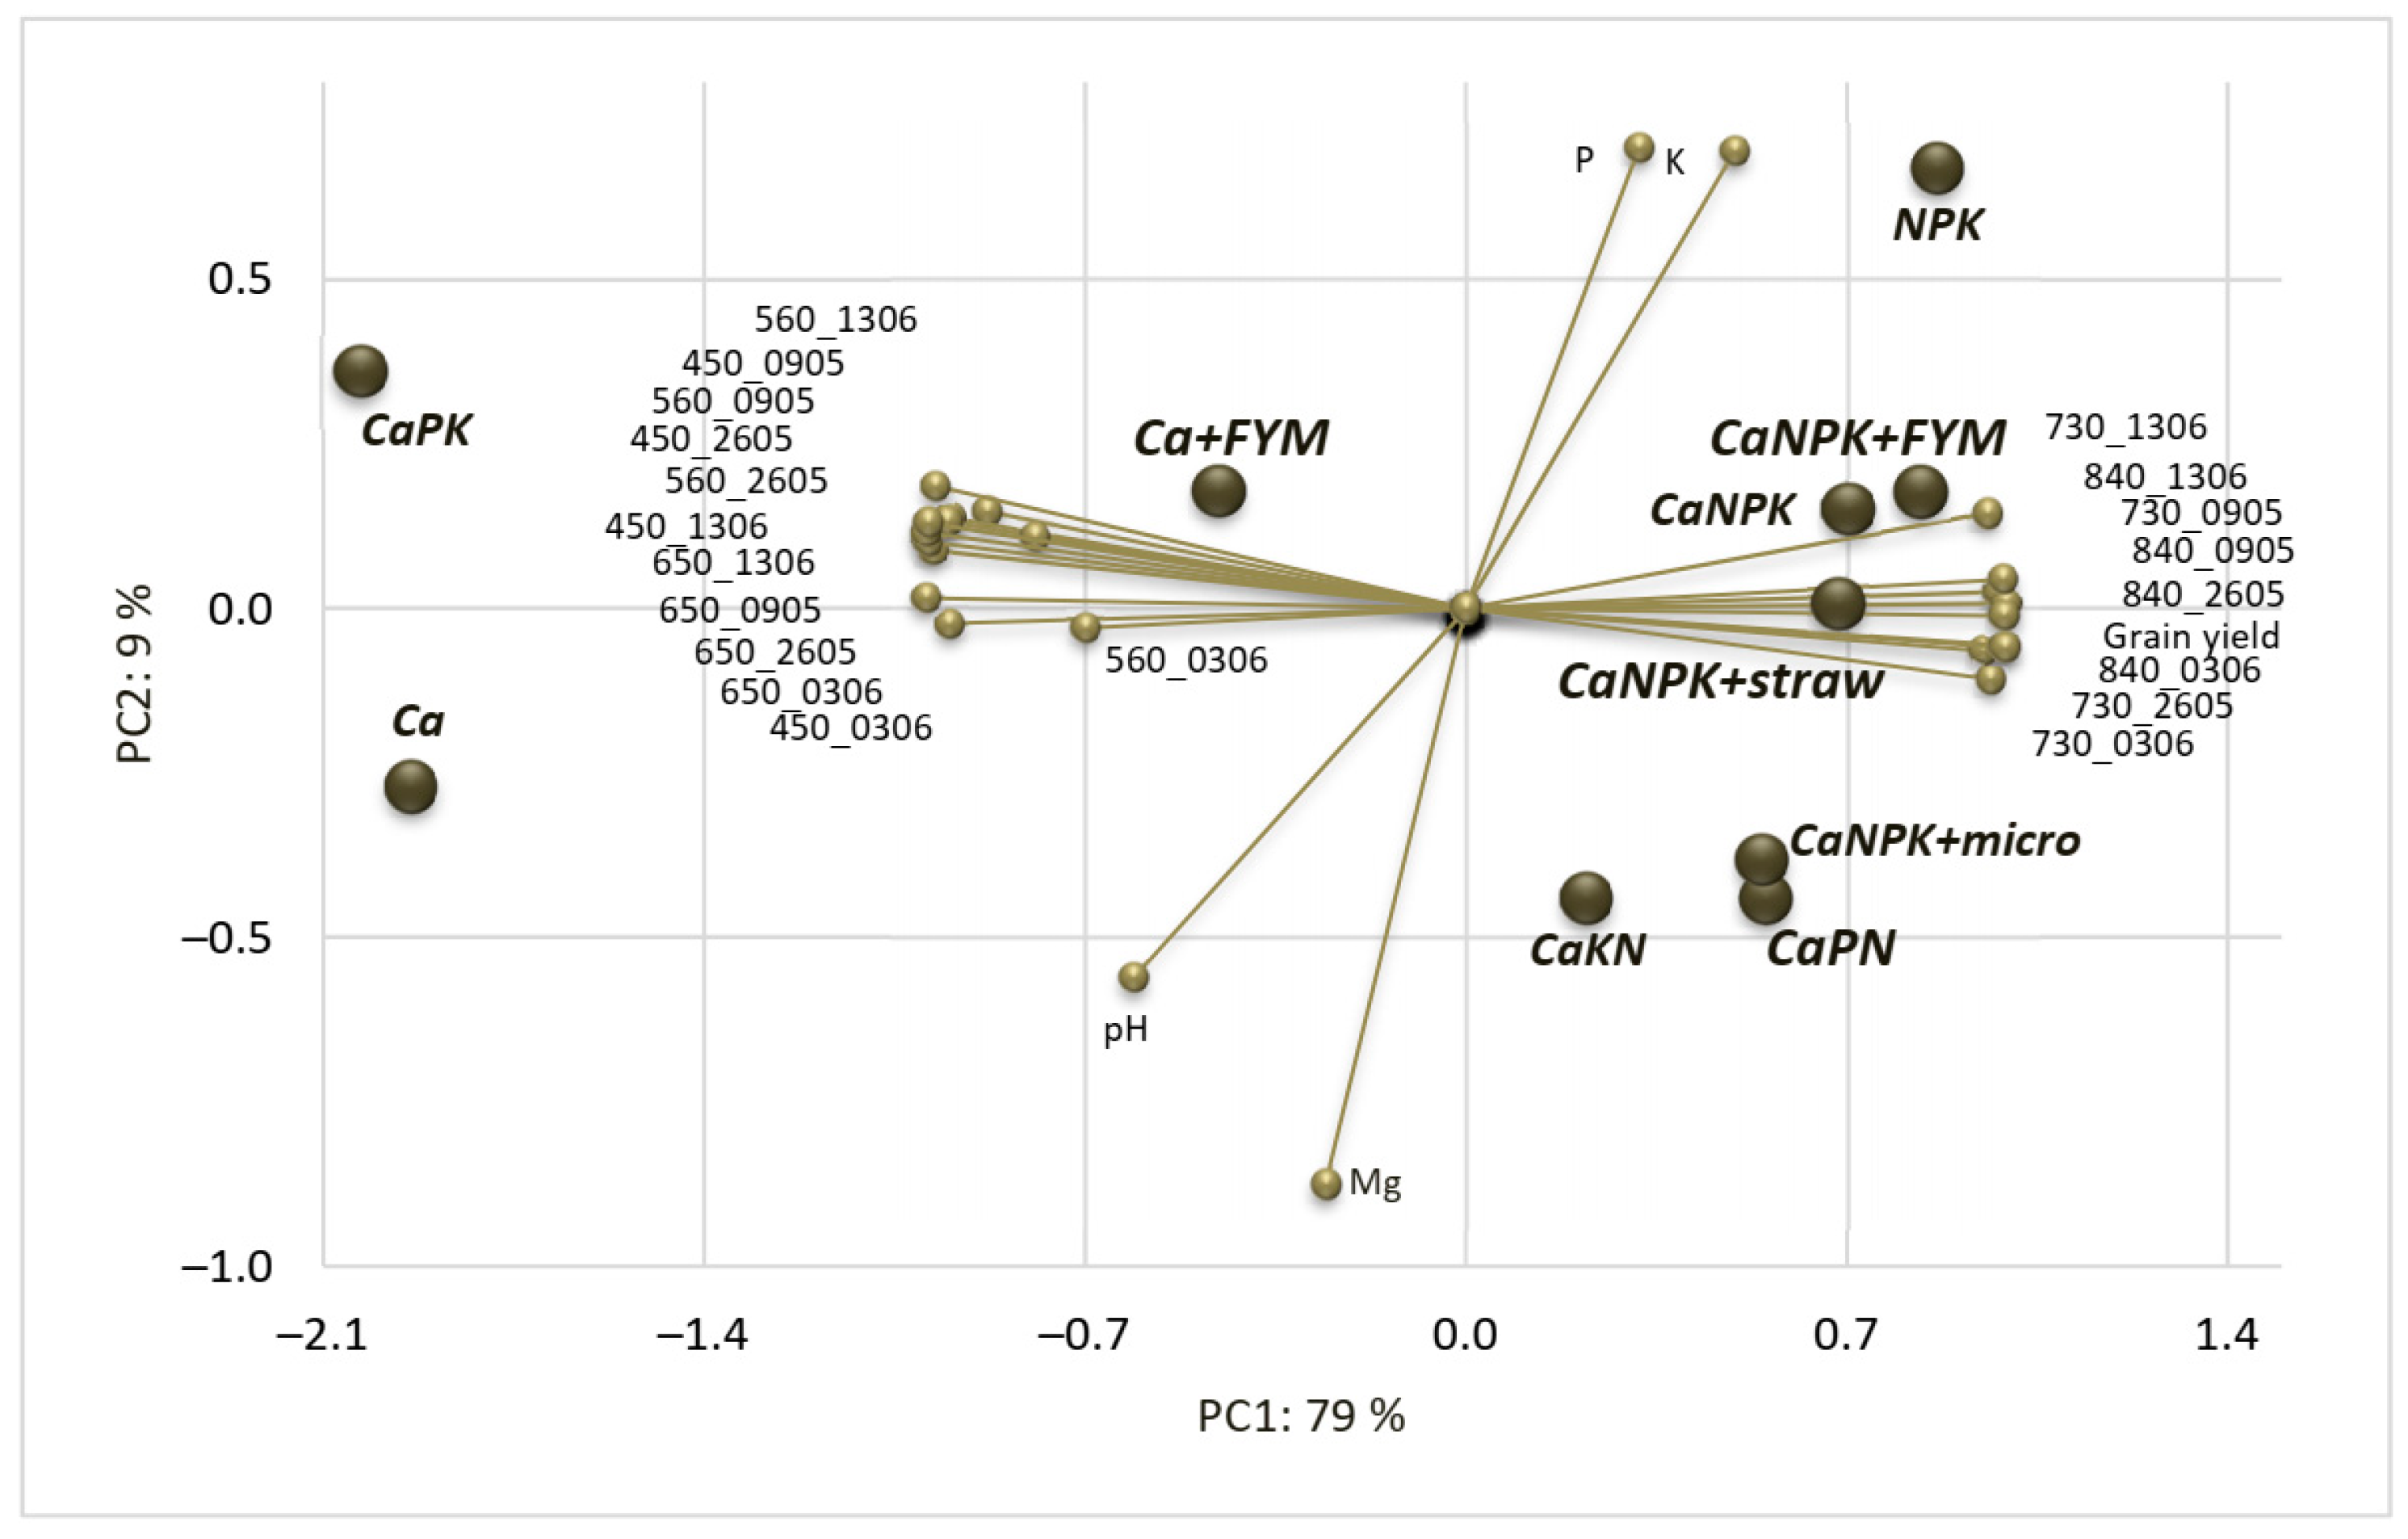
3.3. Multivariate Characteristics of the Treatments Based on PCA

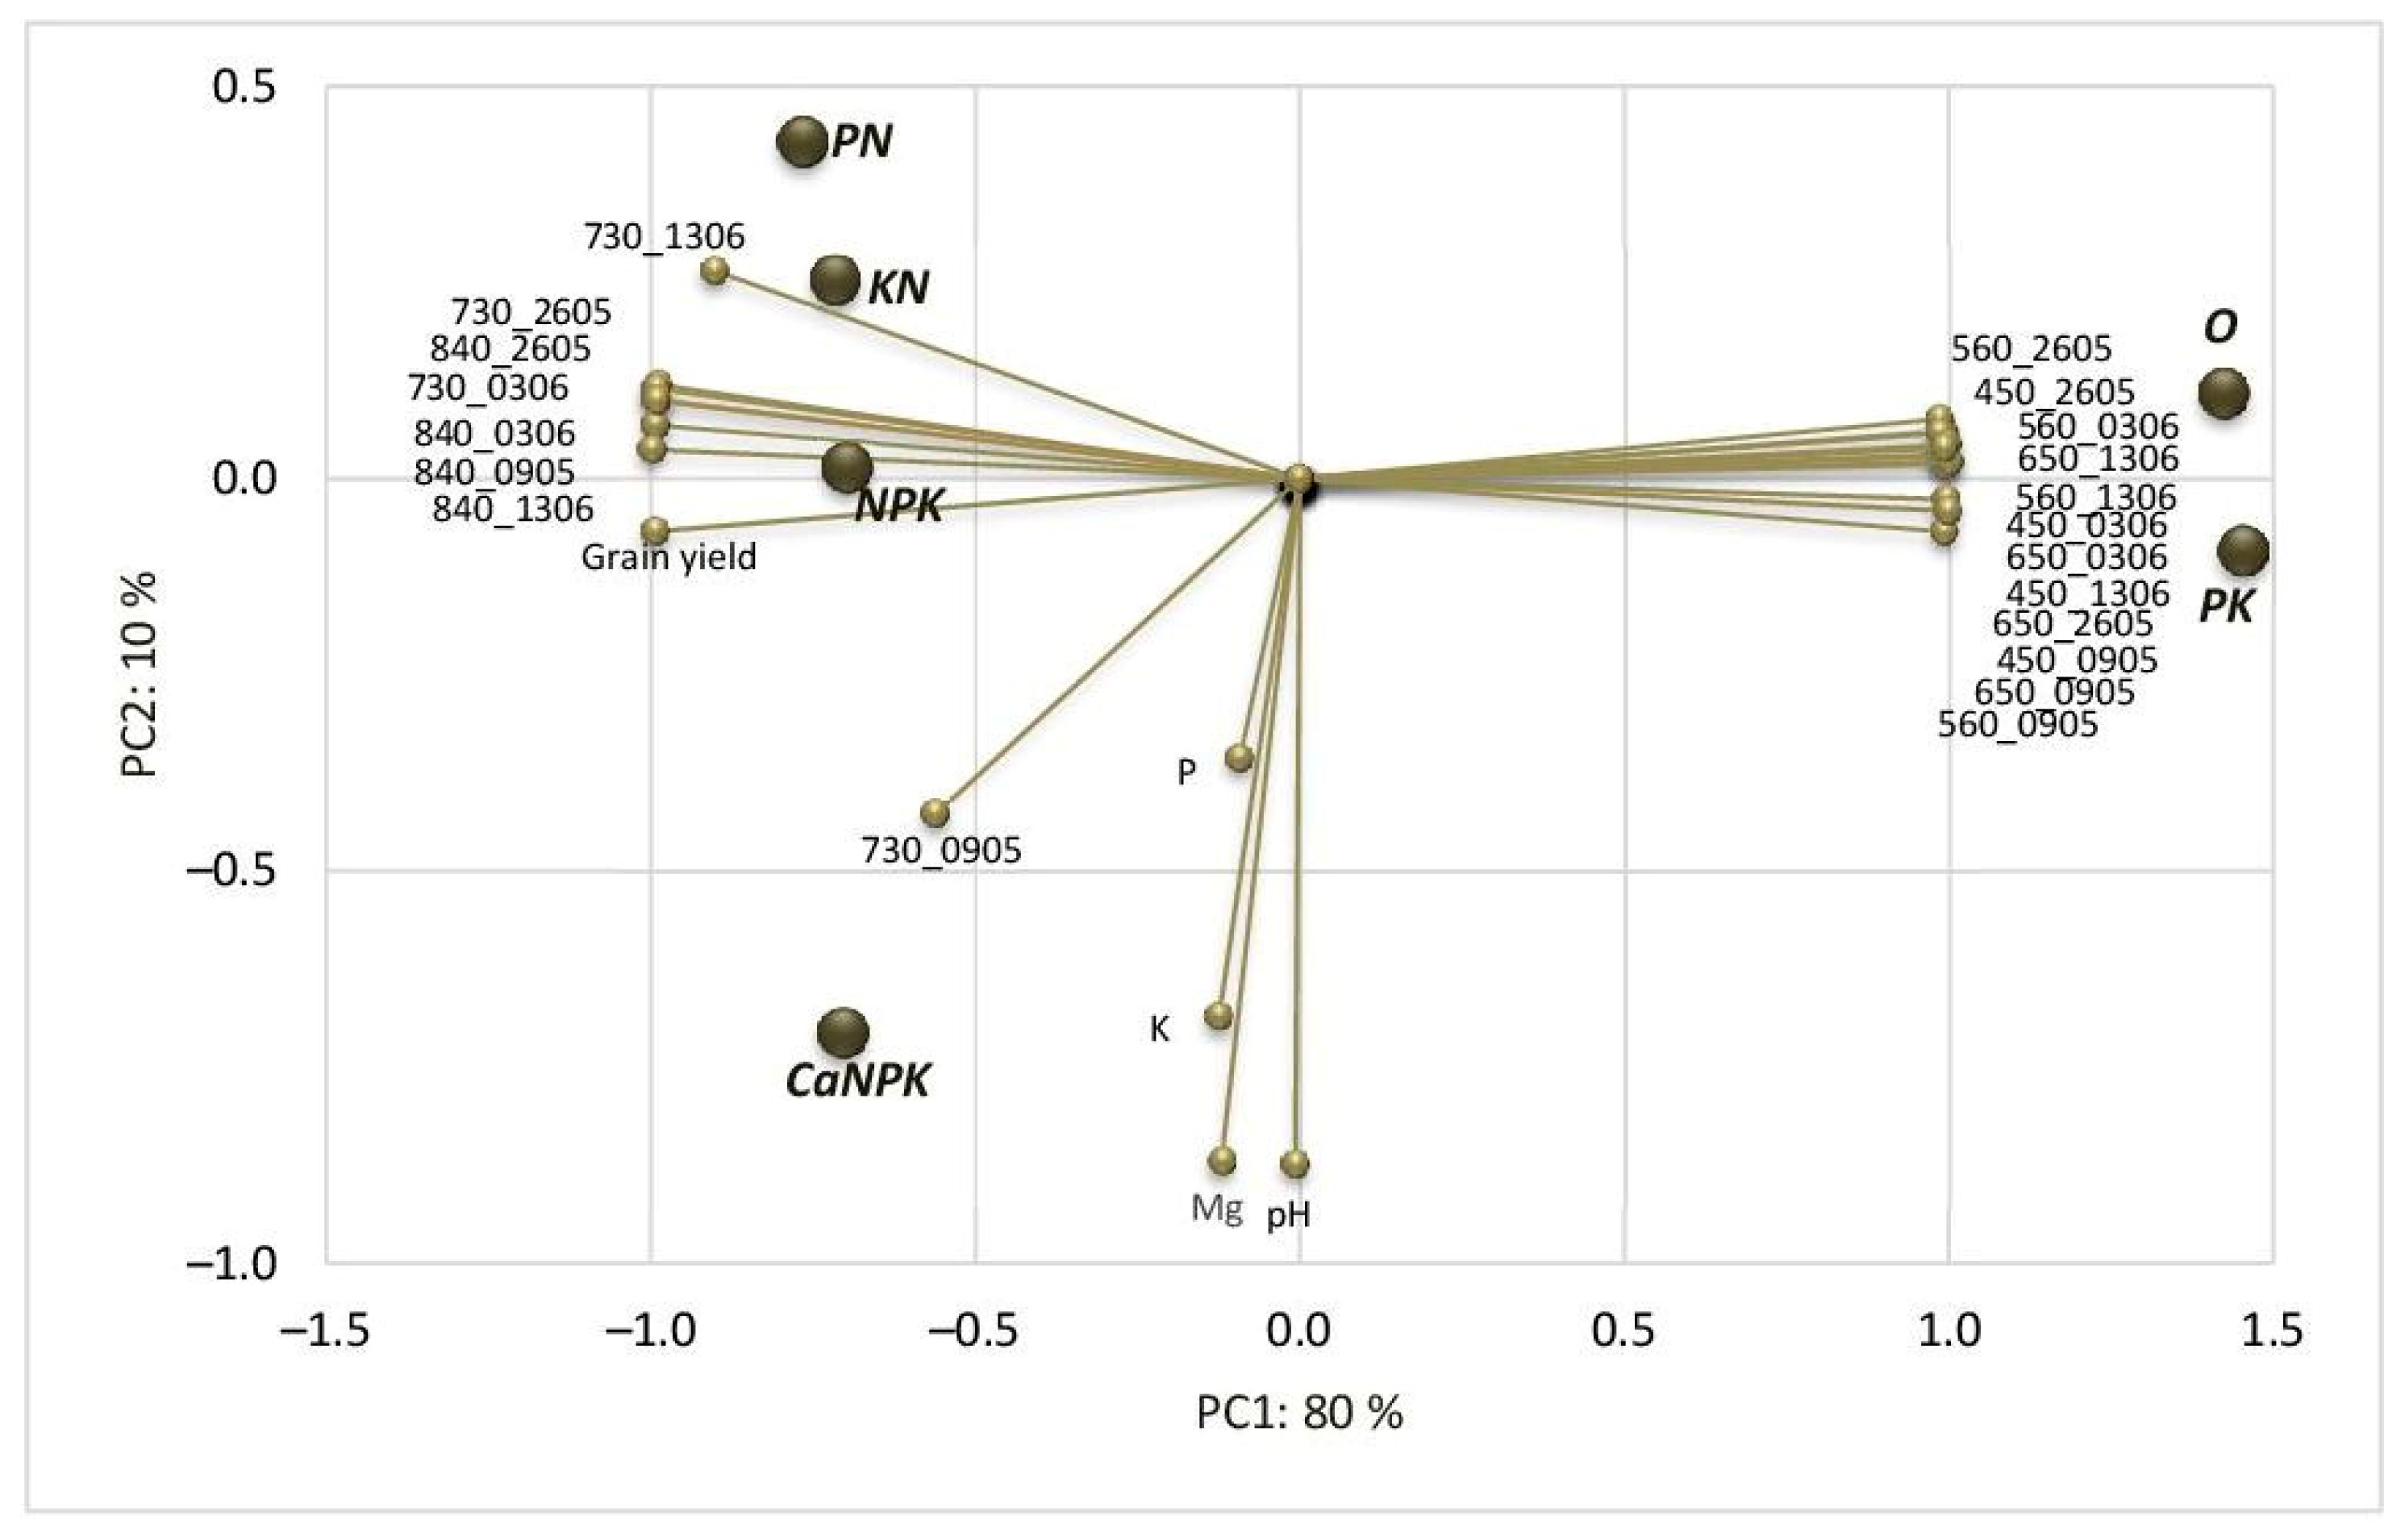
In order to evaluate the treatments in a multidimensional way, a PCA was performed, and the results of the analysis are presented as biplots in Figure 4 for experiment 1 (with crop rotation) and in Figure 5 for experiment 2 (monoculture of winter rye). For both experiments, the first principal component (PC1) explains most of the total variability of the multivariate data (80% and 81% for experiments 1 and 2, respectively). This means that the differences in Figure 4 and Figure 5 are most important along the vertical axis.
In experiment 1, all spectral reflectances were strongly correlated, either positively or negatively, because they were parallel to PC1. Two bands, 730 nm (red edge) and 840 nm (near-infrared), were strongly positively correlated, and all other spectral bands (450 nm—blue, 560 nm—green, and 650 nm—red) were negatively correlated. All treatments with nitrogen fertilization (KN, PN, NPK, and CaNPK) were characterized by similar PC1 values and had high values of reflectance for three spectral bands (blue, green, and red) and low values of the two others (red edge and near-infrared). Both treatments without nitrogen fertilization (PK and O) are very similar in the biplot of PCA.
In experiment 2 (monoculture of rye), the relationships between spectral reflectance were similar to those obtained in experiment 1, i.e., red edge and near-infrared bands were strongly positively correlated and negatively correlated with all other spectral bands (blue, green, and red). The two treatments without nitrogen fertilization (Ca and CaPK) were very far apart in terms of all studied spectral reflectances, as they had much greater values of blue, green, and red reflectance and much lower values of red edge and near-infrared reflectance. The treatment with Ca + FYM fertilization was between Ca and CaPK fertilizations and all other treatments where nitrogen fertilization was applied. This is because FYM contains, among other nutrients, a certain amount of nitrogen, and the effect of that fertilization is quite complex but weaker in comparison to treatments with nitrogen applied as mineral fertilizer. The treatment without phosphorus (CaKN fertilization) was located in the biplot at a certain distance from the other treatments where nitrogen fertilization was applied. This confirms that the effect of phosphorus fertilization on the spectral reflectance is stronger than that of potassium fertilization (CaPN treatment was similar to other treatments with nitrogen).

4. Discussion

The results obtained in the study proved a stronger effect of potassium and phosphorus deficiency in experiment 2, where winter rye was cultivated in monoculture. This is due to the uptake of the same nutrients for a very long time when growing rye in monoculture. The effect of potassium fertilization was stronger than the effect of phosphorus fertilization. Potassium uptake by winter rye (about 4–5 g K per 1 kg of dry matter of grain and 12–13 g per 1 kg of dry matter of straw) [33] is much higher than phosphorus uptake (about 3 g K per 1 kg of dry matter of grain and 0.6 g per 1 kg of dry matter of straw) [34]. Depending on the cultivar, environmental conditions, and crop management, the grain yield is usually similar to straw yield [35]. In this case, the uptake of phosphorus by grains is about five times higher than that taken up by straw. In the case of potassium, the situation is the opposite, i.e., the uptake of potassium is about three times higher in the case of straw compared to the uptake by grain. The content of mineral potassium in soil is much higher than phosphorus [36,37], but it is slowly transformed from mineral forms to non-exchangeable forms and then to exchangeable forms of potassium that can be available for plants [38].
In fully controlled growth conditions, the spectral reflectance of cereal leaves is very different if a strong deficiency of phosphorus or potassium occurs [39]. For wheat plants with a phosphorus or potassium deficiency, a much higher reflectance is observed for wavelength in the near-infrared range. In field conditions, even after several decades without phosphorus or potassium fertilization, these elements are available to plants. The study on wheat conducted in field conditions showed moderate correlations (from 0.2 to 0.6) between spectral reflectance in the range of near-infrared and phosphorus and potassium concentration in plants [40]. However, the reflectance profile for a deficiency of potassium and phosphorus was very similar to the reflectance profiles for plants with a deficiency of nitrogen and potassium. This means that it is difficult to recognize which nutrient deficiency caused the change in spectral reflectance. In the same study, the correlations between nutrient concentrations (including phosphorus and potassium) and selected spectral vegetation indices were evaluated. In the case of phosphorus, all studied correlations were not significant, while for potassium, significant but relatively weak correlations (r about 0.3) were observed for selected vegetation indices (e.g., OSAVI and GNVDI). Another study [41], in which the relationships between spectral reflectance and potassium content in wheat were examined, proved strong relationships with leaf potassium content for wavelengths in the range of 1900–2300 nm. The spectral data in this study were obtained with a handheld spectrometer. In recent years, more studies have focused on the usage of UAV-derived spectral data for the evaluation of crop deficiency, but most of them have focused on the nitrogen nutritional status of crops [42]. This type of research on the evaluation of potassium or phosphorus nutritional status is not very common due to the weaker effect of these nutrients and hardly visible symptoms of their deficiency. Our previous study [10] evaluated the relationships between UAV-derived vegetation indices for rye and the effect of various fertilization, including treatments with and without phosphorus and potassium. These relationships were rather weak, but some of them were significant, especially for rye monoculture. Comparing spectral reflectance profiles has some advantages in discriminating nutrient deficiency over a study that compared spectral indices. This is because spectral indices are based only on selected spectral bands. However, comparing spectral reflectance profiles demands a more detailed analysis and can be more difficult in agronomic practice. In the study by Furlanetto et al. on maize [24], promising results were obtained for the evaluation of potassium deficiency based on UAV–derived spectral data. This was probably due to the very strong and visible effect of potassium deficiency on maize leaves. In the study by Le et al. on rice [43], a strong relationship was shown between UAV–derived hyperspectral data and plant potassium accumulation. In the study by Garcia-Romero et al. on maize [44], UAV-derived vegetation indices based on RGB and multispectral data were used to detect phosphorus deficiency in the early growth stage. A significant effect was proven between plants grown in conditions with different levels of phosphorus fertilization. Significant differences were demonstrated for individual spectral bands of wavelengths in red and near-infrared reflectance. In general, if the deficiency is very severe and applies to only one nutrient (potassium or phosphorus), it can be detected using spectral reflectance by comparing the reflectance of plants that are in optimal nutritional conditions. If the deficiency is more complex involving two or more nutrients, it is difficult to discern which nutrient is causing the different spectral reflectance. A more complex comparison of multivariate differences between treatments with different soil nutrient availability is possible using multivariate statistical methods such as PCA, which was applied in this study. The advantage of such an analysis is a more complex comparison based on multiple spectral bands. Since most of the studied spectral reflectances are strongly correlated, most of the variability between treatments was explained by the first principal component (PC1). The deficiency of potassium or phosphorus resulted in a relatively small multivariate difference compared to NPK treatments and complete fertilization. However, if the deficiency of potassium or phosphorus is severe, as was the case with rye monoculture, it is possible to discriminate this deficiency on the basis of spectral reflectance, which may be important in the future in agronomic practice, especially when precision farming technologies are applied.

5. Conclusions

Deficiencies of phosphorus and potassium in long-term experiments with winter rye are difficult to detect based on the comparison of spectral reflectance profiles. The results of this study proved that a stronger effect of P and K deficiency is observed in the monoculture rye cultivation experiment compared to rye cultivated in crop rotation. This confirms that one crop grown for many years in the same place can strongly deplete the available nutrients from the soil, and therefore the effect on spectral reflectance is stronger. Under such conditions, the effect of potassium and phosphorus deficiency manifests itself in different reflectance in the red, red edge, and NIR ranges. One of the main limitations of this study is the lack of spectral data from the early stages of rye growth. Future studies can be extended by observations from the early stages of rye growth, as well as the use of hyperspectral images.

Author Contributions

Conceptualization, P.M., D.G., W.S. and E.W.-G.; methodology, P.M., D.G., W.S. and E.W.-G.; validation, P.M., D.G., W.S. and E.W.-G.; investigation, P.M. and W.S.; data curation, P.M., D.G. and E.W.-G.; writing—original draft preparation, P.M., D.G. and E.W.-G.; writing—review and editing, P.M., D.G., W.S. and E.W.-G.; visualization, D.G. and E.W.-G.; supervision, D.G.; project administration, W.S. and E.W.-G.; funding acquisition, E.W.-G. All authors have read and agreed to the published version of the manuscript.

Funding

The study was supported by Warsaw University of Life Sciences within the System of Financial Support for Scientists and Research Teams No. 853-2-80-45-700500-S22004.

Data Availability Statement

Data are available on request from the corresponding author.

Conflicts of Interest

The authors declare no conflict of interest.

References

  1. Mee, C.Y.; Bala, S.K.; Mohd, A.H. Detecting and Monitoring Plant Nutrient Stress Using Remote Sensing Approaches: A Review. Asian J. Plant Sci. 2016, 16, 1–8. [Google Scholar] [CrossRef]
  2. Bansod, B.; Singh, R.; Thakur, R.; Singhal, G. A comparision between satellite based and drone based remote sensing technology to achieve sustainable development: A review. J. Agric. Environ. Int. Dev. 2017, 111, 383–407. [Google Scholar] [CrossRef]
  3. Sishodia, R.P.; Ray, R.L.; Singh, S.K. Applications of Remote Sensing in Precision Agriculture: A Review. Remote Sens. 2020, 12, 3136. [Google Scholar] [CrossRef]
  4. Rustioni, L.; Grossi, D.; Brancadoro, L.; Failla, O. Iron, magnesium, nitrogen and potassium deficiency symptom discrimination by reflectance spectroscopy in grapevine leaves. Sci. Hortic. 2018, 241, 152–159. [Google Scholar] [CrossRef]
  5. Das, B.; Mahajan, G.R.; Singh, R. Hyperspectral Remote Sensing: Use in Detecting Abiotic Stresses in Agriculture. In Advances in Crop Environment Interaction; Bal, S.K., Mukherjee, J., Choudhury, B.U., Dhawan, A.K., Eds.; Springer Singapore: Singapore, 2018; pp. 317–335. ISBN 9789811318603. [Google Scholar]
  6. Chancia, R.; Bates, T.; Heuvel, J.V.; van Aardt, J. Assessing Grapevine Nutrient Status from Unmanned Aerial System (UAS) Hyperspectral Imagery. Remote Sens. 2021, 13, 4489. [Google Scholar] [CrossRef]
  7. Zheng, H.; Cheng, T.; Li, D.; Yao, X.; Tian, Y.; Cao, W.; Zhu, Y. Combining Unmanned Aerial Vehicle (UAV)-Based Multispectral Imagery and Ground-Based Hyperspectral Data for Plant Nitrogen Concentration Estimation in Rice. Front. Plant Sci. 2018, 9, 936. [Google Scholar] [CrossRef]
  8. Misbah, K.; Laamrani, A.; Khechba, K.; Dhiba, D.; Chehbouni, A. Multi-Sensors Remote Sensing Applications for Assessing, Monitoring, and Mapping NPK Content in Soil and Crops in African Agricultural Land. Remote Sens. 2021, 14, 81. [Google Scholar] [CrossRef]
  9. Chowhan, P.; Chakraborty, A.P. Remote Sensing Technology—A New Dimension in Detection, Quantification and Tracking of Abiotic and Biotic Stresses. In Plant Stress: Challenges and Management in the New Decade; Roy, S., Mathur, P., Chakraborty, A.P., Saha, S.P., Eds.; Advances in Science, Technology & Innovation; Springer International Publishing: Cham, Switzerland, 2022; pp. 445–457. ISBN 978-3-030-95364-5. [Google Scholar]
  10. Wójcik-Gront, E.; Gozdowski, D.; Stępień, W. UAV-Derived Spectral Indices for the Evaluation of the Condition of Rye in Long-Term Field Experiments. Agriculture 2022, 12, 1671. [Google Scholar] [CrossRef]
  11. Severtson, D.; Callow, N.; Flower, K.; Neuhaus, A.; Olejnik, M.; Nansen, C. Unmanned aerial vehicle canopy reflectance data detects potassium deficiency and green peach aphid susceptibility in canola. Precis. Agric. 2016, 17, 659–677. [Google Scholar] [CrossRef]
  12. Nguyen, H.D.D.; Pan, V.; Pham, C.; Valdez, R.; Doan, K.; Nansen, C. Night-based hyperspectral imaging to study association of horticultural crop leaf reflectance and nutrient status. Comput. Electron. Agric. 2020, 173, 105458. [Google Scholar] [CrossRef]
  13. Caballero, D.; Calvini, R.; Amigo, J.M. Hyperspectral Imaging in Crop Fields: Precision Agriculture. In Data Handling in Science and Technology; Elsevier: Amsterdam, The Netherlands, 2019; Volume 32, pp. 453–473. ISBN 978-0-444-63977-6. [Google Scholar]
  14. Padilla, F.M.; Gallardo, M.; Peña-Fleitas, M.T.; de Souza, R.; Thompson, R.B. Proximal Optical Sensors for Nitrogen Management of Vegetable Crops: A Review. Sensors 2018, 18, 2083. [Google Scholar] [CrossRef]
  15. Jasim, A.; Zaeen, A.; Sharma, L.; Bali, S.; Wang, C.; Buzza, A.; Alyokhin, A. Predicting Phosphorus and Potato Yield Using Active and Passive Sensors. Agriculture 2020, 10, 564. [Google Scholar] [CrossRef]
  16. Fu, Y.; Yang, G.; Pu, R.; Li, Z.; Li, H.; Xu, X.; Song, X.; Yang, X.; Zhao, C. An overview of crop nitrogen status assessment using hyperspectral remote sensing: Current status and perspectives. Eur. J. Agron. 2021, 124, 126241. [Google Scholar] [CrossRef]
  17. Tao, H.; Feng, H.; Xu, L.; Miao, M.; Long, H.; Yue, J.; Li, Z.; Yang, G.; Yang, X.; Fan, L. Estimation of Crop Growth Parameters Using UAV-Based Hyperspectral Remote Sensing Data. Sensors 2020, 20, 1296. [Google Scholar] [CrossRef] [PubMed]
  18. Berger, K.; Verrelst, J.; Féret, J.-B.; Wang, Z.; Wocher, M.; Strathmann, M.; Danner, M.; Mauser, W.; Hank, T. Crop nitrogen monitoring: Recent progress and principal developments in the context of imaging spectroscopy missions. Remote Sens. Environ. 2020, 242, 111758. [Google Scholar] [CrossRef]
  19. Zha, H.; Miao, Y.; Wang, T.; Li, Y.; Zhang, J.; Sun, W.; Feng, Z.; Kusnierek, K. Improving Unmanned Aerial Vehicle Remote Sensing-Based Rice Nitrogen Nutrition Index Prediction with Machine Learning. Remote Sens. 2020, 12, 215. [Google Scholar] [CrossRef]
  20. Jay, S.; Maupas, F.; Bendoula, R.; Gorretta, N. Retrieving LAI, chlorophyll and nitrogen contents in sugar beet crops from multi-angular optical remote sensing: Comparison of vegetation indices and PROSAIL inversion for field phenotyping. Field Crops Res. 2017, 210, 33–46. [Google Scholar] [CrossRef]
  21. Burns, B.W.; Green, V.S.; Hashem, A.A.; Massey, J.H.; Shew, A.M.; Adviento-Borbe, M.A.A.; Milad, M. Determining nitrogen deficiencies for maize using various remote sensing indices. Precis. Agric. 2022, 23, 791–811. [Google Scholar] [CrossRef]
  22. Li, F.; Li, D.; Elsayed, S.; Hu, Y.; Schmidhalter, U. Using optimized three-band spectral indices to assess canopy N uptake in corn and wheat. Eur. J. Agron. 2021, 127, 126286. [Google Scholar] [CrossRef]
  23. Basso, B.; Fiorentino, C.; Cammarano, D.; Schulthess, U. Variable rate nitrogen fertilizer response in wheat using remote sensing. Precis. Agric. 2016, 17, 168–182. [Google Scholar] [CrossRef]
  24. Furlanetto, R.H.; Nanni, M.R.; Crusiol, L.G.T.; Silva, G.F.C.; Junior, A.D.O.; Sibaldelli, R.N.R. Identification and quantification of potassium (K+) deficiency in maize plants using an unmanned aerial vehicle and visible / near-infrared semi-professional digital camera. Int. J. Remote Sens. 2021, 42, 8783–8804. [Google Scholar] [CrossRef]
  25. Peng, X.; Chen, D.; Zhou, Z.; Zhang, Z.; Xu, C.; Zha, Q.; Wang, F.; Hu, X. Prediction of the Nitrogen, Phosphorus and Potassium Contents in Grape Leaves at Different Growth Stages Based on UAV Multispectral Remote Sensing. Remote Sens. 2022, 14, 2659. [Google Scholar] [CrossRef]
  26. Siedliska, A.; Baranowski, P.; Pastuszka-Woźniak, J.; Zubik, M.; Krzyszczak, J. Identification of plant leaf phosphorus content at different growth stages based on hyperspectral reflectance. BMC Plant Biol. 2021, 21, 28. [Google Scholar] [CrossRef]
  27. Chen, S.; Hu, T.; Luo, L.; He, Q.; Zhang, S.; Lu, J. Prediction of Nitrogen, Phosphorus, and Potassium Contents in Apple Tree Leaves Based on In-Situ Canopy Hyperspectral Reflectance Using Stacked Ensemble Extreme Learning Machine Model. J. Soil Sci. Plant Nutr. 2022, 22, 10–24. [Google Scholar] [CrossRef]
  28. Oliveira, M.; Queiroz, T.R.G.; Teixeira, A.D.S.; Moreira, L.C.J.; Leão, R.A.D.O. Reflectance spectrometry applied to the analysis of nitrogen and potassium deficiency in cotton. Rev. Ciênc. Agron. 2020, 51, 1–10. [Google Scholar] [CrossRef]
  29. Beck, H.E.; Zimmermann, N.E.; McVicar, T.R.; Vergopolan, N.; Berg, A.; Wood, E.F. Present and future Köppen-Geiger climate classification maps at 1-km resolution. Sci. Data 2018, 5, 180214. [Google Scholar] [CrossRef] [PubMed]
  30. Zbíral, J. Determination of plant-available micronutrients by the Mehlich 3 soil extractant—A proposal of critical values. Plant Soil Environ. 2016, 62, 527–531. [Google Scholar] [CrossRef]
  31. Thomas, G.W. Soil PH and Soil Acidity. In SSSA Book Series; Sparks, D.L., Page, A.L., Helmke, P.A., Loeppert, R.H., Soltanpour, P.N., Tabatabai, M.A., Johnston, C.T., Sumner, M.E., Eds.; Soil Science Society of America, American Society of Agronomy: Madison, WI, USA, 1996; pp. 475–490. ISBN 978-0-89118-866-7. [Google Scholar]
  32. Statistica (Data Analysis Software System), Version 13; TIBCO Software Inc.: Palo Alto, CA, USA, 2017. Available online: Http://Statistica.Io (accessed on 25 November 2022).
  33. Jørgensen, J.R.; Deleuran, L.C.; Wollenweber, B. Prospects of whole grain crops of wheat, rye and triticale under different fertilizer regimes for energy production. Biomass Bioenergy 2007, 31, 308–317. [Google Scholar] [CrossRef]
  34. Selles, F.; Campbell, C.A.; Zentner, R.P. Effect of Cropping and Fertilization on Plant and Soil Phosphorus. Soil Sci. Soc. Am. J. 1995, 59, 140–144. [Google Scholar] [CrossRef]
  35. Kottmann, L.; Wilde, P.; Schittenhelm, S. How do timing, duration, and intensity of drought stress affect the agronomic performance of winter rye? Eur. J. Agron. 2016, 75, 25–32. [Google Scholar] [CrossRef]
  36. Mouhamad, R. Behavior of Potassium in Soil: A Mini Review. Chem. Int. 2016, 2, 58–69. [Google Scholar] [CrossRef]
  37. Sims, J.T.; Pierzynski, G.M. Chemistry of Phosphorus in Soils. In SSSA Book Series; Tabatabai, M.A., Sparks, D.L., Eds.; Soil Science Society of America: Madison, WI, USA, 2018; pp. 151–192. ISBN 978-0-89118-892-6. [Google Scholar]
  38. Martin, H.W.; Sparks, D.L. On the behavior of nonexchangeable potassium in soils. Commun. Soil Sci. Plant Anal. 1985, 16, 133–162. [Google Scholar] [CrossRef]
  39. Ayala-Silva, T.; Beyl, C.A. Changes in spectral reflectance of wheat leaves in response to specific macronutrient deficiency. Adv. Space Res. 2005, 35, 305–317. [Google Scholar] [CrossRef] [PubMed]
  40. Mahajan, G.R.; Sahoo, R.N.; Pandey, R.N.; Gupta, V.K.; Kumar, D. Using hyperspectral remote sensing techniques to monitor nitrogen, phosphorus, sulphur and potassium in wheat (Triticum aestivum L.). Precis. Agric. 2014, 15, 499–522. [Google Scholar] [CrossRef]
  41. Yang, T.; Lu, J.; Liao, F.; Qi, H.; Yao, X.; Cheng, T.; Zhu, Y.; Cao, W.; Tian, Y. Retrieving potassium levels in wheat blades using normalised spectra. Int. J. Appl. Earth Obs. Geoinf. 2021, 102, 102412. [Google Scholar] [CrossRef]
  42. Li, X.; Ata-Ui-Karim, S.T.; Li, Y.; Yuan, F.; Miao, Y.; Yoichiro, K.; Cheng, T.; Tang, L.; Tian, X.; Liu, X.; et al. Advances in the estimations and applications of critical nitrogen dilution curve and nitrogen nutrition index of major cereal crops. A review. Comput. Electron. Agric. 2022, 197, 106998. [Google Scholar] [CrossRef]
  43. Lu, J.; Li, W.; Yu, M.; Zhang, X.; Ma, Y.; Su, X.; Yao, X.; Cheng, T.; Zhu, Y.; Cao, W.; et al. Estimation of rice plant potassium accumulation based on non-negative matrix factorization using hyperspectral reflectance. Precis. Agric. 2021, 22, 51–74. [Google Scholar] [CrossRef]
  44. Gracia-Romero, A.; Kefauver, S.C.; Vergara-Díaz, O.; Zaman-Allah, M.; Prasanna, B.M.; Cairns, J.; Araus, J.L. Comparative Performance of Ground vs. Aerially Assessed RGB and Multispectral Indices for Early-Growth Evaluation of Maize Performance under Phosphorus Fertilization. Front. Plant Sci. 2017, 8, 2004. [Google Scholar] [CrossRef] [Green Version]
Figure 1. The design of long-term field experiments covered by the study together with the RGB map for 9 May 2022. 1—field experiment with crop rotation; 2—field experiment with monoculture of rye; 3—map of Europe presenting the location of the study (Skierniewice).
Agronomy 13 00446 g001
Figure 2. Spectral reflectance profiles for winter rye in experiment 1 (with crop rotation) in four growth stages.
Agronomy 13 00446 g002
Figure 3. Spectral reflectance profiles for winter rye in experiment 2 (monoculture) in four growth stages.
Agronomy 13 00446 g003
Figure 4. Results of principal component analysis presenting multivariate differences between the treatments of winter rye in experiment 1 (crop rotation).
Agronomy 13 00446 g004
Figure 5. Results of principal component analysis presenting multivariate differences between the treatments of winter rye in experiment 2 (monoculture).
Agronomy 13 00446 g005
Table 1. Content of soil particles of various sizes in %.
Soil HorizonDiameter of Soil Particle (mm)
1–0.50.5–0.250.25–0.10.1–0.050.05–0.020.02–0.0050.005–0.002<0.002
Experiment 1 (with crop rotation).
Ap4.325.236.5117718
Eet427.737.3126526
Bt3.219.729.11287516
Experiment 2 (monoculture of rye)
Ap4.826.331.9137539
Eet529.333.7118445
Bt4.520.224.31397715
Table 2. Description of the treatments of the experiments (1) with crop rotation and with rye monoculture (2).
Treatments of the experiment (1) with crop rotation
0without mineral fertilization
CaNPKnitrogen, phosphorus, and potassium fertilization + lime application
KNpotassium and nitrogen fertilization
NPKnitrogen, phosphorus, and potassium fertilization
PKphosphorus and potassium fertilization
PNphosphorus and nitrogen fertilization.
Treatments of the experiment with rye monoculture (2)
Calime application
Ca + FYMfarmyard manure fertilization + lime application
CaKNpotassium and nitrogen fertilization+ lime application
CaNPKnitrogen, phosphorus, and potassium fertilization + lime application
CaNPK + FYMnitrogen, phosphorus, potassium, and farmyard manure fertilization + lime application
CaNPK + micronitrogen, phosphorus, potassium, and micronutrients fertilization + lime application
CaNPK + strawnitrogen, phosphorus, potassium fertilization + lime application and straw left in the field
CaPKphosphorus and potassium fertilization + lime application
CaPNphosphorus and nitrogen fertilization + lime application
NPKnitrogen, phosphorus, and potassium fertilization
Table 3. Content of N, P, K in grain and straw in g kg−1 in experiment 1 (with crop rotation) in 2017.
CaNPKNPKPKPNKNO
grainN18.116.619.117.116.9517.96
P2.782.582.942.812.42.61
K7.026.627.225.457.035.71
strawN5.235.074.885.325.294.99
P1.421.381.501.481.011.29
K16.215.917.19.0217.99.22
Table 4. Content of N, P, K in grain and straw in g kg−1 in experiment 2 (monoculture) in 2017.
CaCaKNCaPNCaPKNPKCaNPKCaNPK + MicroCaNPK + StrawCa + FYMCaNPK + FYM
grainN16.215.415.716.016.417.016.816.317.317.6
P2.562.212.662.702.482.612.552.512.632.74
K5.516.585.066.886.126.496.516.706.556.74
strawN4.354.414.384.294.374.434.404.374.514.55
P1.120.891.211.290.921.191.171.151.301.33
K9.1717.58.9418.816.817.116.617.215.817.9
Table 5. Means for relative spectral reflectance, soil pH and available nutrients, and grain yield for the treatments in experiment 1 (with crop rotation). Results of ANOVA and t-test for comparisons between the treatments.
Wavelength and Date *TreatmentsResults of ANOVAResults of t-Test
CaNPKNPKPKPNKNOFpp (PN vs. NPK)p (KN vs. NPK)
450_09050.110.110.210.100.110.2051.2<0.0010.2230.817
560_09050.130.130.230.120.130.2242.9<0.0010.2730.754
650_09050.080.070.220.060.070.21103.2<0.0010.1590.953
730_09050.390.380.380.380.390.370.60.7000.9840.330
840_09050.630.630.480.660.650.4645.0<0.0010.0340.458
450_26050.080.080.110.080.080.1141.9<0.0010.6960.671
560_26050.110.110.130.110.110.1316.4<0.0010.4450.633
650_26050.060.070.120.060.060.12113.3<0.0010.6120.398
730_26050.310.320.240.320.320.2433.6<0.0010.9660.938
840_26050.480.510.310.530.520.31105.2<0.0010.5320.779
450_03060.080.080.110.080.080.1026.2<0.0010.9290.859
560_03060.090.100.120.090.100.1217.8<0.0010.6900.777
650_03060.060.060.110.060.060.1058.5<0.0010.8530.826
730_03060.280.300.220.300.290.2148.3<0.0010.8870.832
840_03060.450.480.290.490.480.27153.2<0.0010.3310.691
450_13060.100.100.150.100.090.1546.2<0.0010.6980.462
560_13060.120.120.160.120.110.1631.8<0.0010.8590.124
650_13060.080.090.150.090.080.1670.9<0.0010.7560.133
730_13060.260.270.250.260.260.252.10.1380.8850.389
840_13060.410.410.320.410.410.3332.4<0.0010.8660.748
pH6.434.704.434.174.275.3025.0<0.0010.0070.015
P (g/kg)244.0341.0309.0212.381.987.346.4<0.0010.0180.000
K (g/kg)169.3172.0167.766.3113.964.244.2<0.0010.0010.014
Mg (g/kg)71.224.720.419.420.137.359.0<0.0010.0680.419
Grain yield (t/ha)4.764.611.574.684.271.6058.4<0.0010.7980.484
* wavelength in nm and date as day and month, e.g., 450_0905 means 450 nm (blue reflectance) on 9 May.
Table 6. Means for relative spectral reflectance, soil pH and available nutrients, and grain yield for the treatments in experiment 2 (monoculture of rye). Results of ANOVA and t-test for comparisons between the treatments.
Wavelength and Date *TreatmentsResults of ANOVAResults of t-Test
CaCaKNCaPNCaPKNPKCaNPKCaNPK + MicroCaNPK + StrawCa + FYMCaNPK + FYMFpp (CaPN vs. CaNPK)p (CaKN vs. CaNPK)
450_09050.120.100.100.130.100.100.100.100.100.1013.5<0.0010.6620.426
560_09050.150.130.120.160.120.120.120.120.130.1214.0<0.0010.3740.277
650_09050.120.070.060.130.060.060.060.060.070.0660.8<0.0010.3810.030
730_09050.310.370.390.320.390.380.380.370.340.399.9<0.0010.6720.658
840_09050.430.620.650.420.690.650.650.660.530.6836.2<0.0010.9740.203
450_26050.080.080.080.090.080.080.080.080.080.083.50.0030.6200.296
560_26050.120.110.110.120.110.110.110.110.130.115.8<0.0010.7370.245
650_26050.090.060.060.090.060.060.060.060.080.0650.3<0.0010.9390.287
730_26050.260.350.340.260.350.350.350.360.340.3530.3<0.0010.9560.595
840_26050.360.580.580.360.600.590.600.620.510.6070.0<0.0010.5740.571
450_03060.080.080.070.080.070.070.070.070.080.073.30.0040.6390.094
560_03060.110.110.090.110.100.100.100.100.110.103.00.0080.5400.137
650_03060.090.060.060.090.060.060.060.060.070.0521.0<0.0010.7100.166
730_03060.220.310.300.220.300.300.320.320.290.3133.1<0.0010.4170.556
840_03060.290.500.490.290.520.510.520.530.420.5381.6<0.0010.3980.843
450_13060.110.080.080.120.080.080.080.080.090.0837.6<0.0010.8510.057
560_13060.120.110.100.130.110.100.100.100.120.1022.0<0.0010.3480.087
650_13060.120.080.080.120.080.080.080.070.100.0762.4<0.0010.6920.073
730_13060.200.240.230.210.250.240.240.240.230.2440.8<0.0010.0190.599
840_13060.270.370.360.280.390.370.380.380.330.39139.1<0.0010.0860.421
pH7.367.186.887.026.447.007.006.747.146.948.0<0.0010.4250.145
P (g/kg)79.273.0137.8129.8176.8125.8108.7133.8188.6165.618.0<0.0010.265<0.001
K (g/kg)79.1136.487.2124.0167.4163.4110.5122.8134.2155.25.8<0.0010.0040.357
Mg (g/kg)81.687.693.575.554.560.985.569.975.769.35.2<0.0010.0010.011
Grain yield (t/ha)2.093.994.132.004.564.624.654.473.364.6466.9<0.0010.0210.002
* wavelength in nm and date as day and month, e.g., 450_0905 means 450 nm (blue reflectance) on 9 May.
Table 7. Correlation coefficients (and p-values) between spectral reflectance and soil pH, available nutrients, and grain yield for the treatments in experiment 1 (crop rotation). Significant correlations (p < 0.05) are in red font.
Wavelength and Date *pHP (g/kg)K (g/kg)Mg (g/kg)Grain Yield (t/ha)
450_0905−0.01 (0.955)−0.04 (0.876)−0.03 (0.910)−0.15 (0.556)−0.96 (<0.001)
560_09050.03 (0.903)−0.07 (0.794)−0.02 (0.935)−0.11 (0.667)−0.97 (<0.001)
650_09050.02 (0.940)−0.06 (0.811)−0.05 (0.842)−0.11 (0.652)−0.98 (<0.001)
730_09050.08 (0.742)0.03 (0.901)0.22 (0.386)0.03 (0.898)0.21 (0.407)
840_0905−0.08 (0.764)0.09 (0.737)0.09 (0.729)0.02 (0.929)0.95 (<0.001)
450_2605−0.05 (0.830)−0.02 (0.931)−0.09 (0.716)−0.20 (0.416)−0.96 (<0.001)
560_2605−0.06 (0.812)0.02 (0.948)−0.07 (0.778)−0.23 (0.360)−0.92 (<0.001)
650_2605−0.01 (0.955)−0.03 (0.907)−0.10 (0.705)−0.16 (0.534)−0.97 (<0.001)
730_2605−0.10 (0.687)0.15 (0.553)0.09 (0.732)−0.02 (0.930)0.94 (<0.001)
840_2605−0.10 (0.689)0.10 (0.699)0.06 (0.799)0.01 (0.981)0.97 (<0.001)
450_0306−0.04 (0.873)0.01 (0.964)−0.04 (0.880)−0.21 (0.392)−0.95 (<0.001)
560_0306−0.04 (0.863)0.03 (0.912)−0.06 (0.821)−0.23 (0.349)−0.93 (<0.001)
650_0306−0.02 (0.928)−0.04 (0.871)−0.09 (0.718)−0.18 (0.472)−0.97 (<0.001)
730_0306−0.09 (0.714)0.18 (0.483)0.12 (0.637)−0.02 (0.936)0.95 (<0.001)
840_0306−0.10 (0.699)0.12 (0.647)0.10 (0.699)0.00 (0.996)0.97 (<0.001)
450_13060.02 (0.936)−0.08 (0.746)−0.12 (0.636)−0.13 (0.594)−0.96 (<0.001)
560_13060.02 (0.943)−0.04 (0.871)−0.13 (0.596)−0.14 (0.574)−0.93 (<0.001)
650_13060.00 (0.999)−0.08 (0.756)−0.14 (0.571)−0.15 (0.553)−0.96 (<0.001)
730_1306−0.08 (0.747)0.21 (0.394)0.03 (0.897)−0.08 (747)0.65 (<0.001)
840_1306−0.01 (0.969)0.11 (0.652)0.13 (0.603)0.08 (0.754)0.96 (<0.001)
pH 0.05 (0.845)0.29 (0.235)0.89 (<0.001)0.06 (0.824)
P (g/kg)0.05 (0.845) 0.70 (<0.001)0.01 (0.983)0.15 (0.543)
K (g/kg)0.29 (0.235)0.70 (<0.001) 0.25 (0.325)0.14 (0.588)
Mg (g/kg)0.89 (<0.001)0.01 (0.983)0.25 (0.325) 0.20 (0.434)
Grain yield (t/ha)0.06 (0.824)0.15 (0.543)0.14 (0.588)0.20 (0.434)
* wavelength in nm and date as day and month, e.g., 450_0905 means 450 nm (blue reflectance) on 9 May; Different colors indicate strength of correlation.
Table 8. Correlation coefficients (and p-values) between spectral reflectance and soil pH, available nutrients, and grain yield for the treatments in experiment 2 (monoculture of rye). Significant correlations (p < 0.05) are in red font.
Wavelength and Date *pHP (g/kg)K (g/kg)Mg (g/kg)Grain Yield (t/ha)
450_09050.21 (0.145)−0.27 (0.057)−0.35 (0.013)0.03 (0.826)−0.68 (<0.001)
560_09050.30 (0.032)−0.20 (0.157)−0.38 (0.007)0.10 (0.507)−0.75 (<0.001)
650_09050.38 (0.006)−0.27 (0.056)−0.37 (0.008)0.09 (0.524)−0.88 (<0.001)
730_0905−0.44 (0.001)0.24 (0.088)0.19 (0.188)−0.09 (0.053)0.82 (<0.001)
840_0905−0.51 (<0.001)0.24 (0.089)0.28 (0.047)−0.15 (0.313)0.92 (<0.001)
450_26050.23 (0.105)−0.10 (0.494)−0.19 (0.177)0.04 (0.770)−0.57 (<0.001)
560_26050.38 (0.005)−0.19 (0.193)−0.25 (0.077)0.09 (0.525)−0.81 (<0.001)
650_26050.43 (0.002)−0.17 (0.238)−0.30 (0.031)0.09 (0.554)−0.90 (<0.001)
730_2605−0.36 (0.010)0.32 (0.022)0.38 (0.007)−0.11 (0.430)0.86 (<0.001)
840_2605−0.45 (0.001)0.26 (0.066)0.36 (0.010)−0.14 (0.349)0.93 (<0.001)
450_03060.31 (0.028)−0.25 (0.084)−0.13 (0.377)0.04 (0.794)−0.60 (<0.001)
560_03060.31 (0.029)−0.05 (0.754)0.00 (0.979)0.03 (0.840)−0.44 (<0.001)
650_03060.45 (0.001)−0.24 (0.089)−0.26 (0.067)0.10 (0.501)−0.87 (<0.001)
730_0306−0.37 (0.008)0.25 (0.084)0.36 (0.009)−0.11 (0.448)0.87 (<0.001)
840_0306−0.45 (0.001)0.24 (0.098)0.37 (0.009)−0.15 (0.304)0.92 (<0.001)
450_13060.38 (0.006)−0.21 (0.137)−0.30 (0.031)0.06 (0.667)−0.89 (<0.001)
560_13060.36 (0.011)−0.16 (0.267)−0.22 (0.126)0.01 (0.936)−0.85 (<0.001)
650_13060.40 (0.004)−0.20 (0.167)−0.31 (0.028)0.07 (0.618)−0.91 (<0.001)
730_1306−0.48 (<0.001)0.29 (0.039)0.49 (<0.001)−0.27 (0.054)0.87 (<0.001)
840_1306−0.50 (<0.001)0.26 (0.066)0.40 (0.004)−0.20 (0.170)0.95 (<0.001)
pH −0.31 (0.027)−0.22 (0.129)0.40 (0.004)−0.44 (0.001)
P (g/kg)−0.31 (0.027) 0.29 (0.040)−0.30 (0.031)0.28 (0.047)
K (g/kg)−0.22 (0.129)0.29 (0.040) −0.63 (<0.001)0.31 (0.030)
Mg (g/kg)0.40 (0.004)−0.30 (0.031)−0.63 (<0.001) −0.16 (0.282)
Grain yield (t/ha)−0.44 (0.001)0.28 (0.047)0.31 (0.030)−0.16 (0.282)
* wavelength in nm and date as day and month, e.g., 450_0905 means 450 nm (blue reflectance) on 9 May; Different colors indicate strength of correlation.
Disclaimer/Publisher’s Note: The statements, opinions and data contained in all publications are solely those of the individual author(s) and contributor(s) and not of MDPI and/or the editor(s). MDPI and/or the editor(s) disclaim responsibility for any injury to people or property resulting from any ideas, methods, instructions or products referred to in the content.

