Article

Rotary Ripper: A Possible Solution to Increase the Efficiency of Tillage Operations

by
Massimiliano Varani
* and
Michele Mattetti
Department of Agricultural and Food Sciences, Alma Mater Studiorum, Università di Bologna, 40127 Bologna, Italy
*
Author to whom correspondence should be addressed.
Agronomy 2023, 13(2), 365; https://doi.org/10.3390/agronomy13020365
Submission received: 4 January 2023 / Revised: 20 January 2023 / Accepted: 23 January 2023 / Published: 26 January 2023
(This article belongs to the Section Farming Sustainability)

Abstract

:
Manufacturers are looking for innovative solutions to improve the sustainability of their products in terms of environmental, economic, and social issues. Many studies demonstrate that conservative tillage techniques can be more advantageous for the environment and farmer profits than conventional tillage techniques. However, conservative tillage tools have certain disadvantages, including challenging weed control and stagnation issues in humid conditions due to low soil porosity at depth. In this study, field tests were conducted comparing the performances of a conventional tillage technique, using a ripper and a rotary tiller, and the usage of an innovative rotary ripper (Rotoripper). The comparison was performed in terms of energy requirements, through data acquisition during tillage operations, tilled soil quality, through soil sieving and cone penetration tests, and ownership costs, through acquired field data and literature databases. The results indicate that increased porosity of the soil in the deepest layer and increased cost-effectiveness are the main advantages attainable with the use of the Rotoripper instead of conventional tillage equipment. However, because of the low soil segregation level achieved with the Rotoripper, additional tillage activities are required before planting.

1. Introduction

Global food production must increase to feed the growing world population, but this should not come at the expense of reducing greenhouse gas (GHG) emissions [1]. In order to enhance productivity while reducing farming’s environmental impact, researchers and policymakers have been attempting to identify solutions that would promote the sustainable intensification of current farming systems [2]. Strategies to accomplish this aim were suggested by the European Commission (EC) in 2020, including “Farm-to-Fork,” “Biodiversity Strategies,” and the “European Green Deal.” The aforementioned policies state that sustainable food production should be based on agricultural practices that can lower GHG emissions through the reduction of inputs (such as water, fertilizers, and chemical pesticides) and direct energy use (mainly coming from fossil fuels) [3]. Moreover, nowadays there is a more holistic concept of sustainability; indeed, it is not restricted to the protection of the environment. For example, a widely spread accounting framework is the triple bottom line (TBL), which includes in addition to the environmental aspect also economic and social scopes [4,5,6]. The greatest energy-consuming agricultural practice is tillage, which is used in primary production. According to Borin et al. [7], tillage contributes to around 25% of the overall energy input for crop production, and 92% of this energy is currently provided by fossil fuels [8]. Several studies have extensively characterized the energy consumption of the tractor-implemented system under various operating parameters (i.e., working depth and speed), as well as various soil types and moisture levels [9,10,11,12]. Conventional tillage practices include a sequence of soil tillage operations before seeding. Firstly, a primary deep tillage operation is performed with ploughs or rippers to increase the soil porosity and to carry out the removal of most of the plant residue from the previous crop. Then, to obtain the desired size of soil aggregates in the topsoil, secondary tillage operations are conducted, typically with harrows or rotary tillers [13]. In the last few decades, the adoption of conventional tillage has declined worldwide due to its high energy demand and soil degradation issues leading to compacted soil composed of fine particles with low levels of soil organic matter [14]. This increased environmental consciousness in the agricultural sector pushed the development of innovative eco-friendly machines by researchers and manufacturers [15,16,17,18,19] and the broader adoption of conservative tillage (CT) techniques by farmers [20]. Conservation tillage (CT) is a tillage system that creates a suitable soil environment for growing a crop and that conserves soil, water, and energy resources mainly through a reduction in the intensity of tillage and the retention of plant residues [13]. There are considerable amounts of evidence that CT practices require less direct energy and can provide a wide range of benefits to the environment and wildlife compared with conventional tillage practices [21,22,23]. Regarding the economic aspect, the cost shares in a farm are divided according to its typology; for example, a significant portion of field crop farm costs come from machinery, which includes assets with depreciation and resource consumption components [24,25,26]. The less intensive use of machinery in CT procedures compared with conventional tillage practices leads to significant tillage cost savings, under the assumption that the tillage methodology is the sole variable input cost (i.e., absence of yield penalties or differences in other input cost variables) [27]. However, the efficiency and the sustainability of CT strongly depend on the considered world region and the type of crop. Indeed, throughout the wetter parts of northern Europe, conventional tillage with ploughing is still very widely used and is a particularly effective method of seedbed preparation on poorly drained soils because it can provide surface drainage and aeration for the topsoil, especially in spring, control weeds, and remediate surface compaction [28]. In addition, CT tools alter soil porosity only in the first 15–25 cm of the topsoil, thus hindering the cultivation of crops with deep root systems [29]. Moreover, most CT implements are passive, so the energy required to till the soil is granted by the tow force developed by the tractor during the operation. This implies that to minimize losses due to wheel slip and rolling resistance, the tillage operation can only be carried out when the trafficability of the soil is acceptable. This is not strictly necessary in active implements actuated by a tractor PTO such as rotary tillers or power harrows, the operation of which requires limited towing forces [17,30]. So, theoretically the adoption of a low-energy-demand active implement that can work deep into the soil would solve many of the problems listed above. The tillage implement manufacturers Selvatici Srl (San Lazzaro di Savena, Italy) and Bertoni Srl (Castel Bolognese, Italy) tried to overcome these issues by jointly developing the Rotoripper, a ripper that has a rod and crank mechanisms actuated by the tractor PTO that permit the rotation of its working elements as on a standard rotary tiller. One can note that the main differences between the two implements are the shape of the working elements and especially the feasible working depth. Indeed, typically on a standard rotary tiller the working depth never exceeds 25 cm, while the Rotoripper could work at up to 40 cm working depth [31]. Theoretically, the Rotoripper would be able to alter the in-depth soil porosity to reduce the drainage issues in CT and simultaneously ensure a much smaller soil aggregate dimension than a traditional ripper operation. To the authors’ knowledge, currently there are no tillage implements with these specifications on the market, and no performance evaluations were conducted on it. This paper aims to evaluate the performance in terms of energy requirements, tilled soil quality, and economic aspects of a tillage operation conducted with a Rotoripper compared with the combined operation of a conventional ripper and a conventional rotary tiller.

2. Materials and Methods

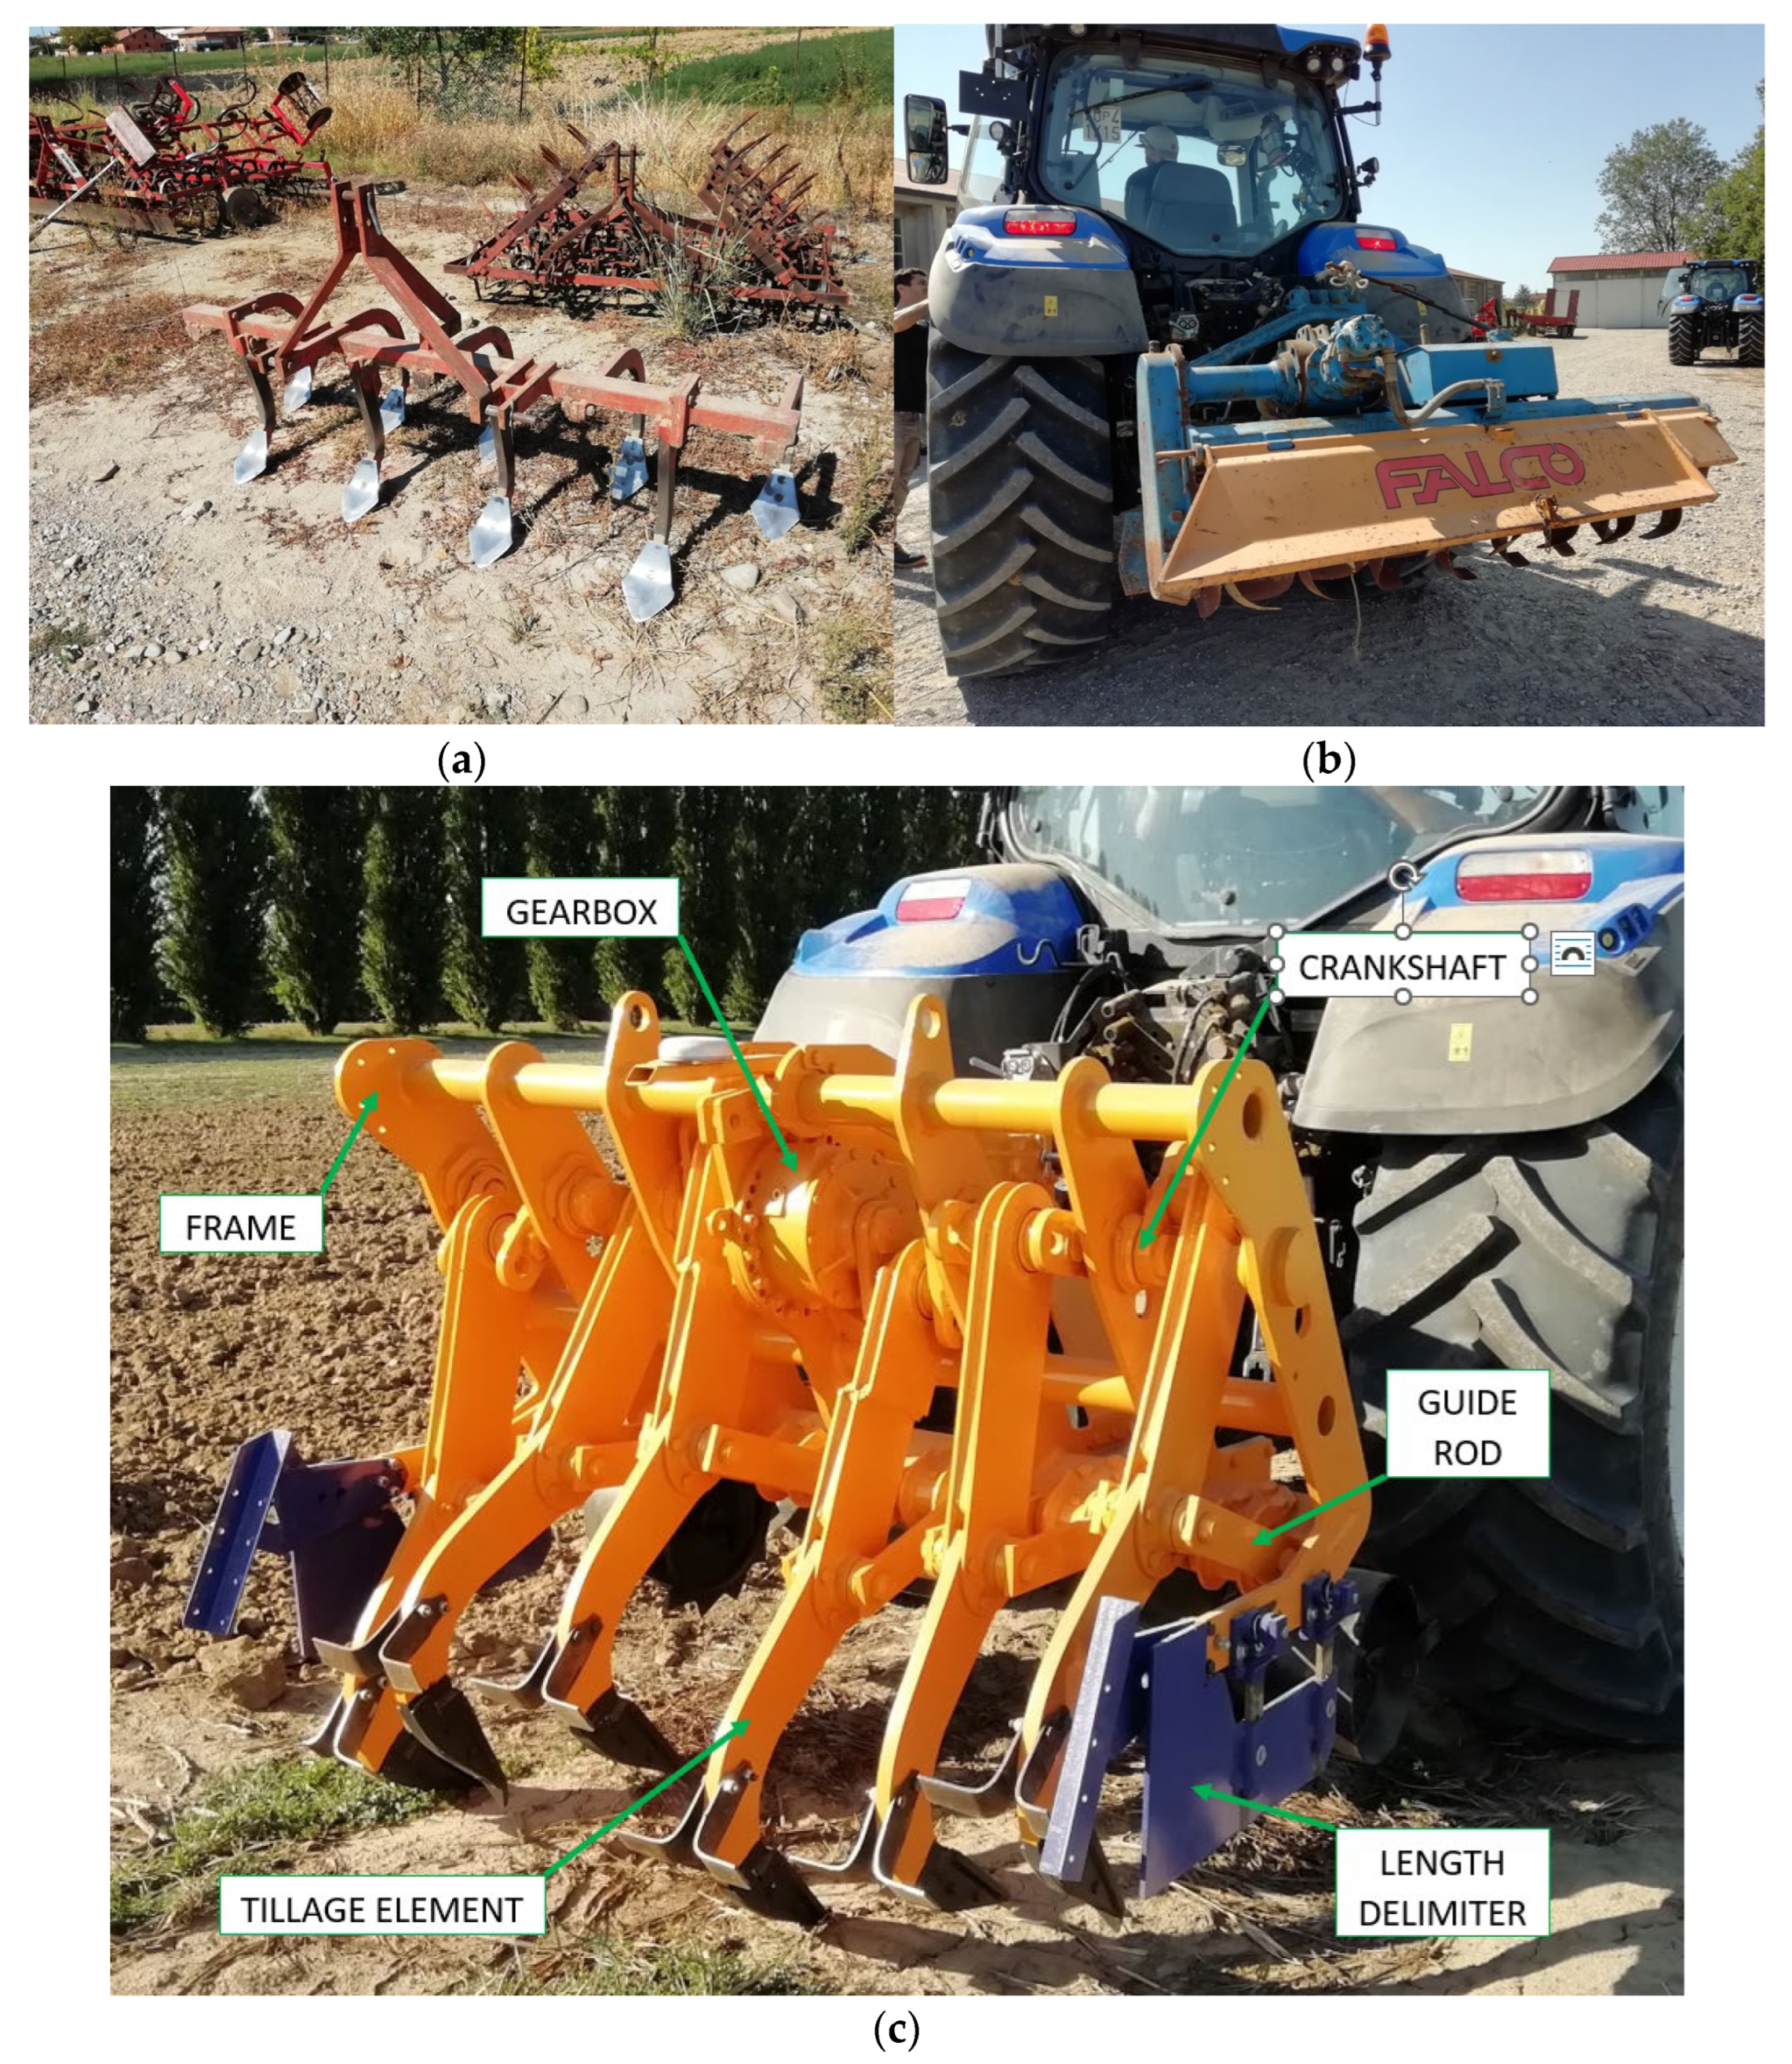
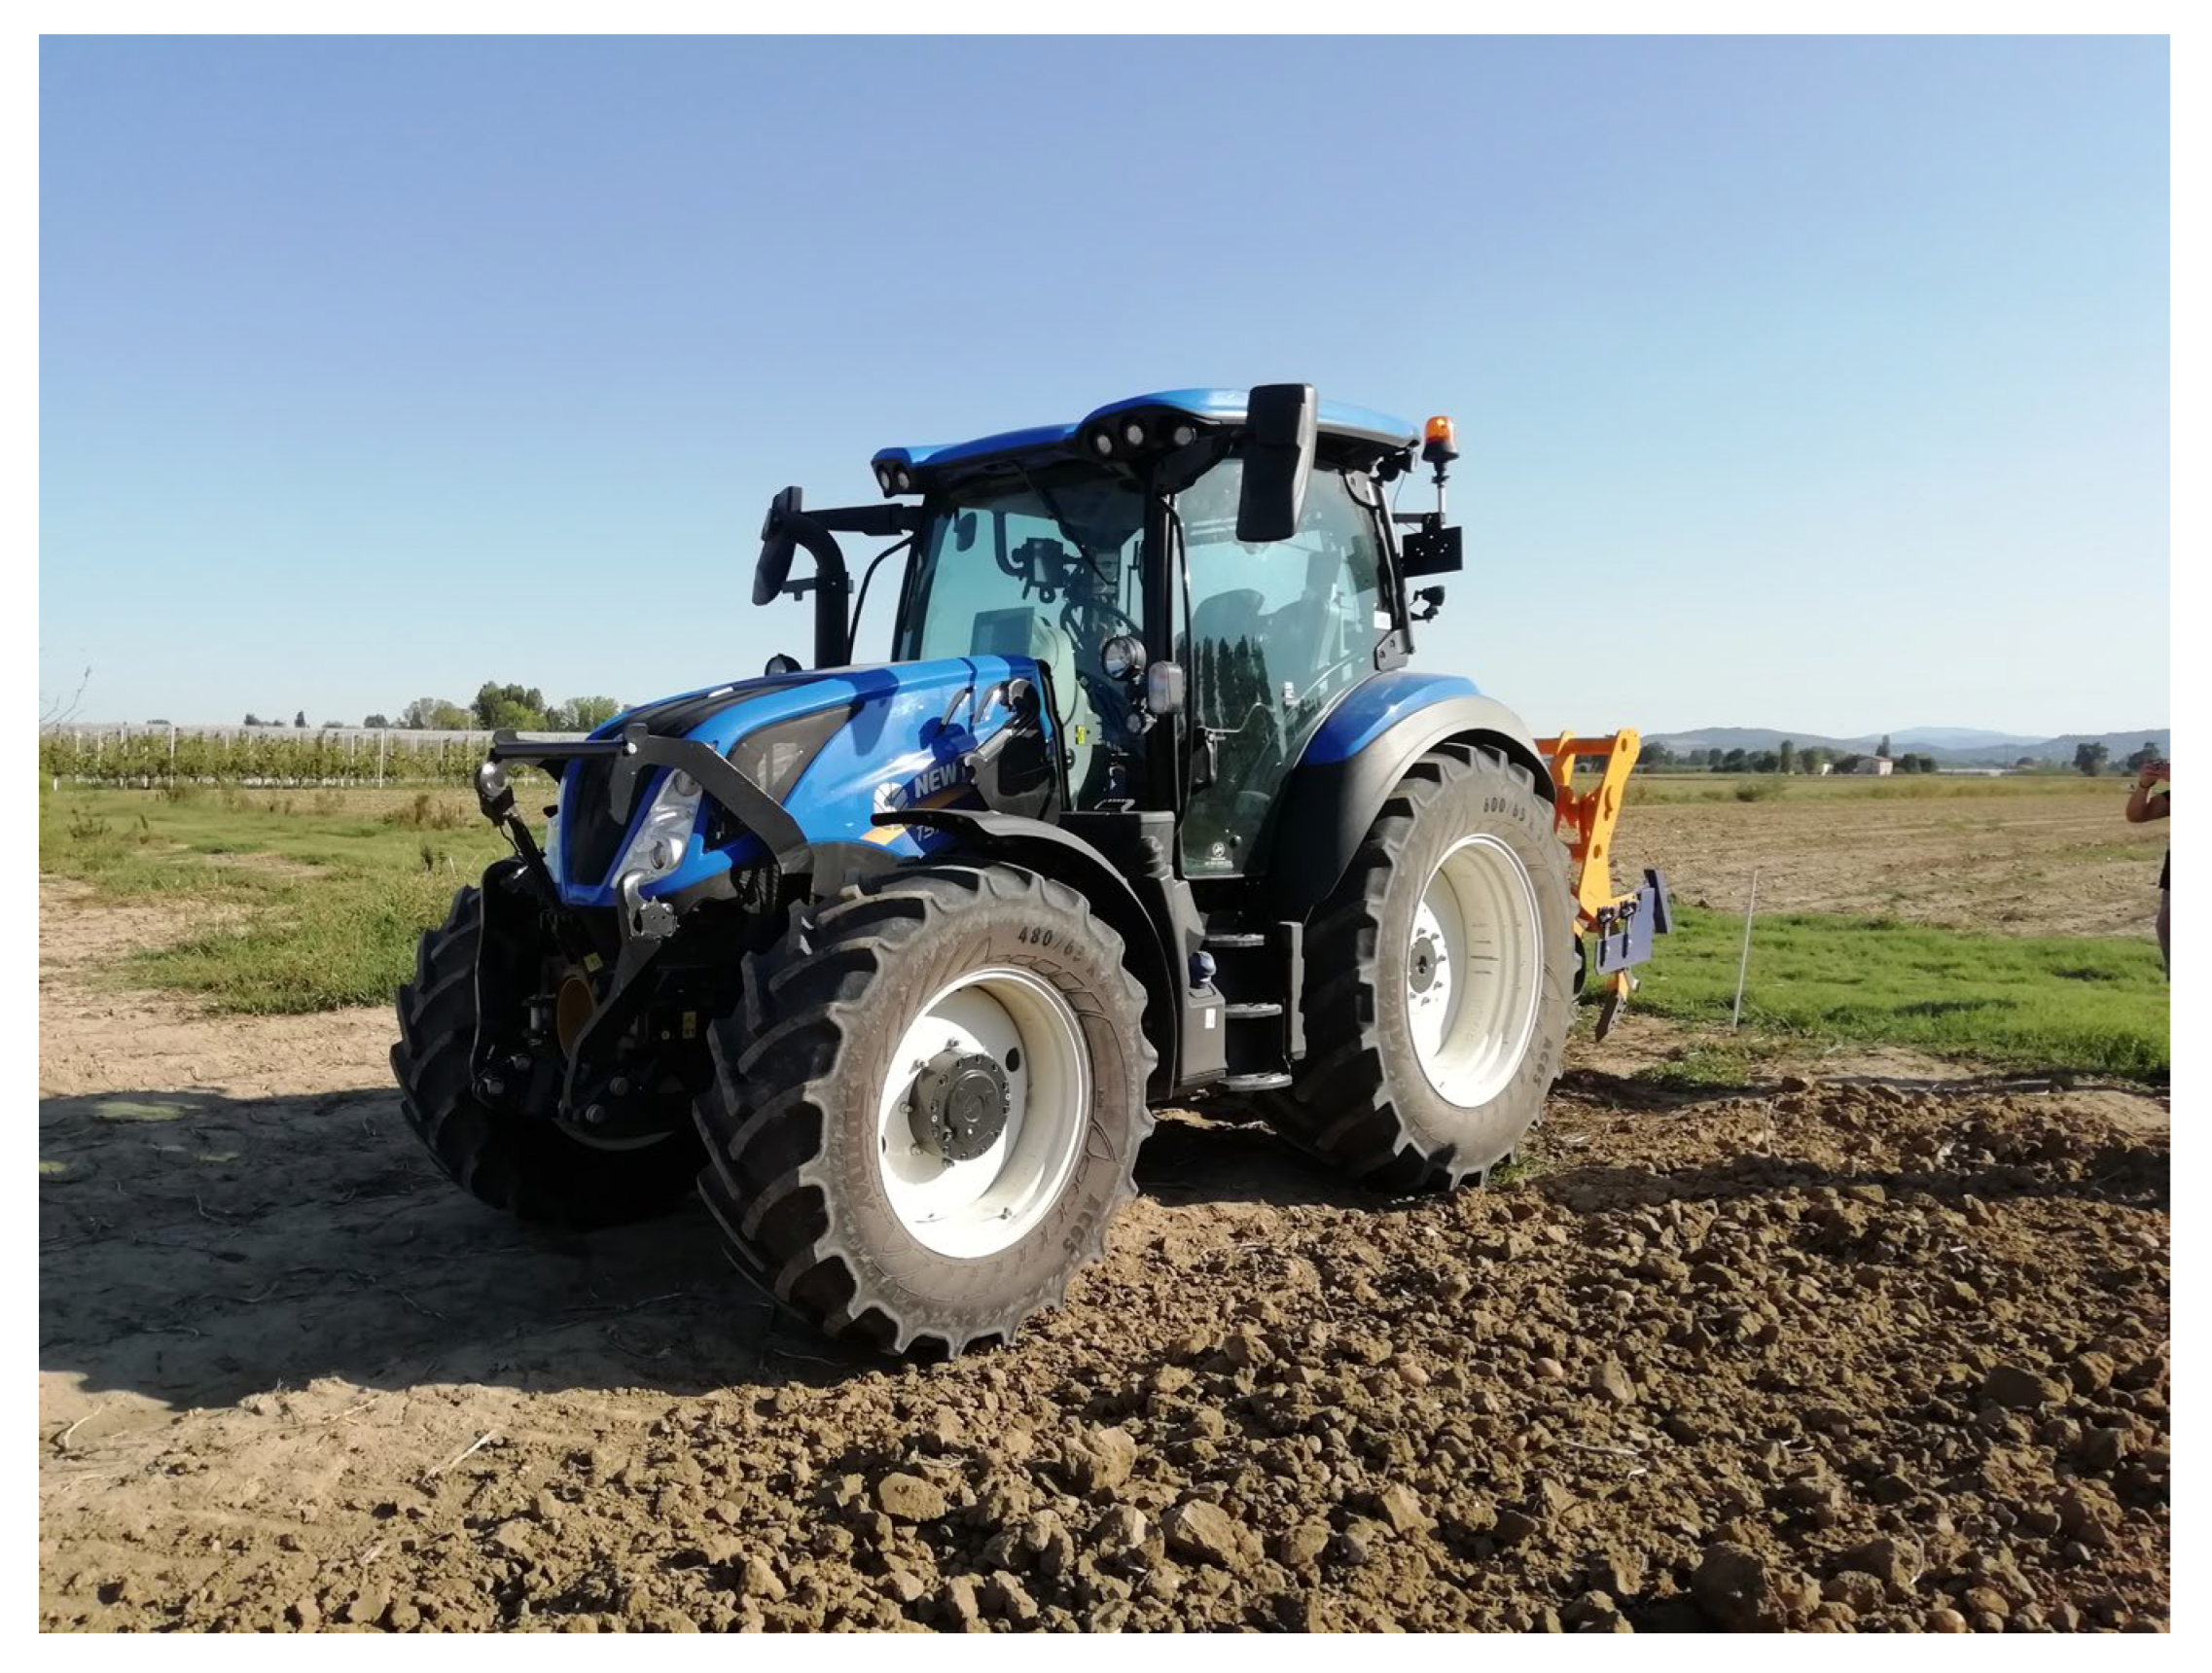
2.1. Tractor and Implements

The tests were performed by directly comparing tillage operations employing a conventional tillage methodology using a ripper and a rotary tiller available at the experimental farm of the University of Bologna and a tillage operation adopting solely the Rotoripper (Selvatici Srl, San Lazzaro di Savena, Italy; Bertoni Srl, Castel Bolognese, Italy). The latter had a working width of 1.8 m, while the ripper and the rotary tiller had widths of 2.1 m and 1.8 m, respectively. The width of the conventional tillage implements was chosen to be similar to that of the Rotoripper and to permit their usage with the same model of tractor. The main specifications of the implements are reported in Table 1, while their photos are reported in Figure 1.
All the implements were pulled by a four-wheel-drive row crop tractor; Table 2 presents the tractor specifications, while Figure 2 shows the tractor during the tests with the Rotoripper.

2.2. Sensors and Acquisition System

The tractor parameters were acquired through the tractor’s controller area network (CAN) SAE J1939 diagnostic port and recorded with a Kvaser Memorator 2 datalogger (Kvaser Inc., Mission Viejo, CA, USA) using the following suspect parameter numbers (SPNs) and parameter group numbers (PGNs):
  • SPN 544 and PGN 65251: ‘Engine Reference Torque’ reports the maximum engine torque available (Mr) at a sampling rate of 0.2 Hz.
  • SPN 513 and PGN 61444: ‘Actual Engine—Percent Torque’ reports the torque (Me) as a percentage of Mr at a sampling rate of 50 Hz.
  • SPN 513 and PGN 5398: ‘Nominal Friction—Per cent Torque’, denoted as Mf, reports the sum of the engine frictional and thermodynamic loss, pumping torque loss, and losses of fuel, oil, and cooling pumps as a percentage of Mr at a sampling rate of 20 Hz.
  • SPN 190 and PGN 61444: ‘Engine Speed’ reports the revolution speed of the engine crankshaft (ne) at a sampling rate of 10 Hz.
  • SPN 1883 and PGN 65090: ‘Rear PTO Output Shaft Speed’ reports the speed of the rear PTO (npto) at a sampling rate of 10 Hz.
  • SPN 183 and PGN 65266: ‘Engine Fuel Rate’ reports the fuel consumed by the engine per unit of time (f) at a sampling rate of 10 Hz.
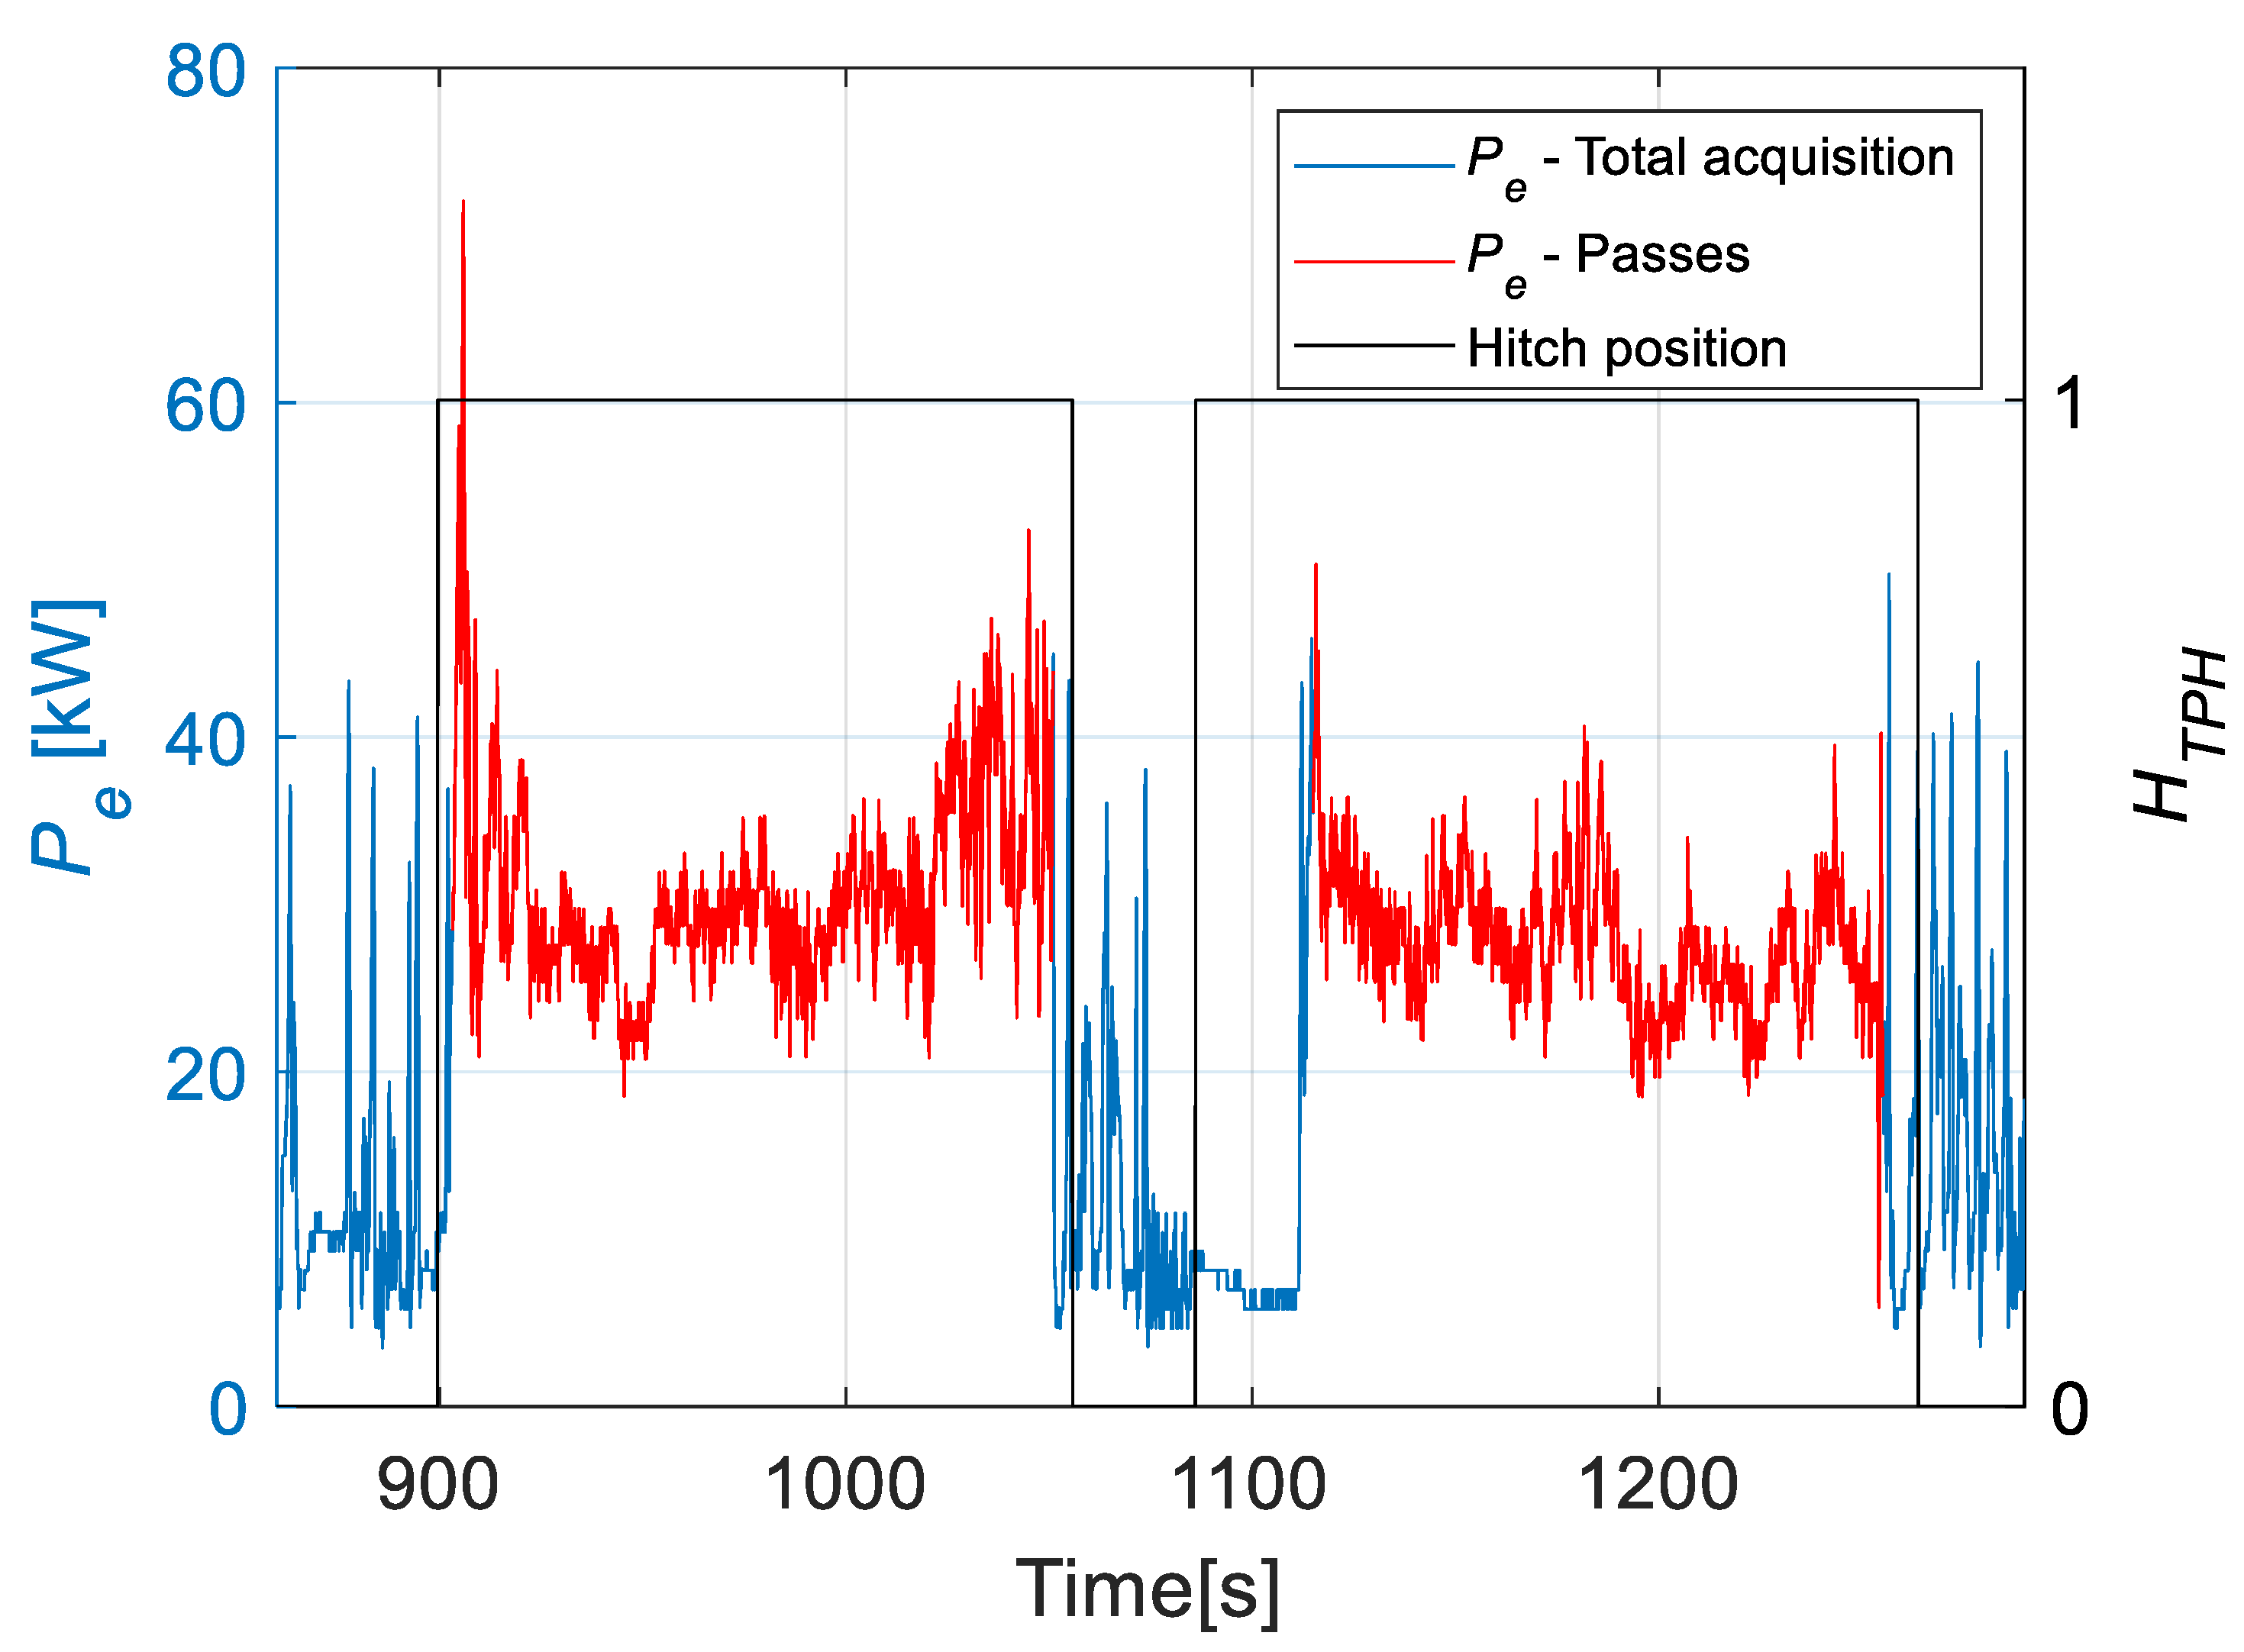
  • SPN 1873 and PGN 65093: ‘Rear Hitch Position’ reports the position of the rear three-point hitch at a sampling rate of 10 Hz.
  • SPN 8768 and PGN 8960, ‘Hitch Information—Rear in Work’ reports the status of the rear three-point linkage (TPH), which is equivalent to 1 when the TPH is in working position and 0 when the TPH is lifted. It is denoted as Htph and measured at a sampling rate of 10 Hz.
The ground speed of the tractor (Vt) and its geolocation were measured using a global navigation satellite system (GNSS) receiver (IPEspeed, Ipetronik GmbH & Co. KG, Baden-Baden, Germany) with a 10 Hz sampling rate and a circular error probable (CEP) of 2.5 m. The output signal of the GNSS receiver was in the CAN bus protocol, so it was directly connected to the datalogger to record Vt during the tests.

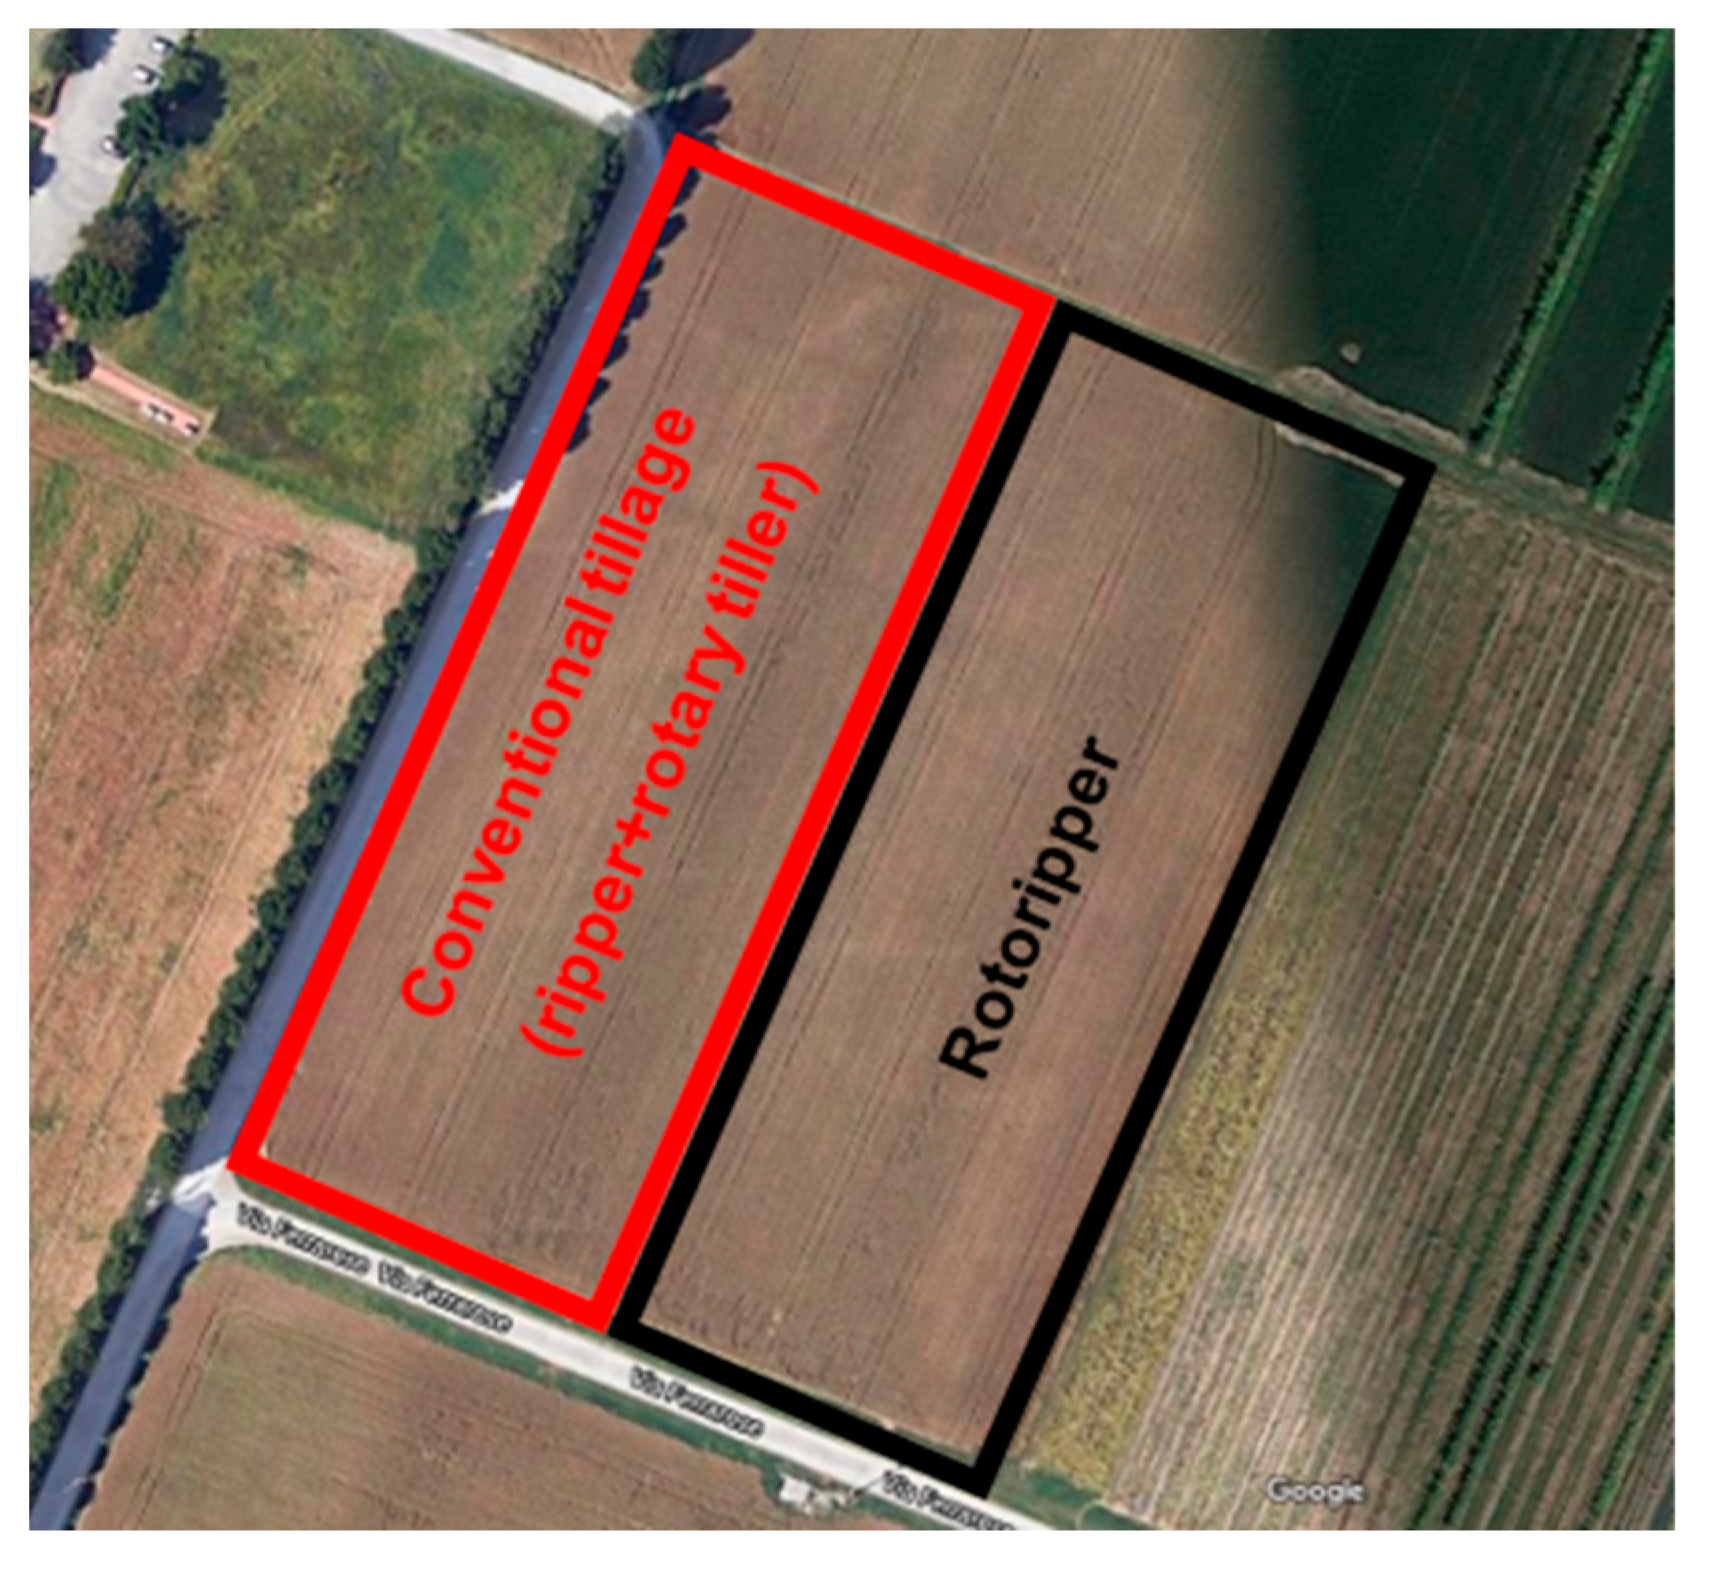
2.3. Experimental Sites and Soil Characteristics

Tests were conducted in the summer of 2020 at the experimental farm of the University of Bologna located in Cadriano (latitude 44°33′27.6624″ and longitude 11°24′35.3844″, Emilia Romagna Region, north-central Italy). The climate is classified as humid subtropical (Cfa) according to the Köppen-Geiger climate classification [32], and is characterised by hot summers and two main rainy periods in spring and autumn. Before tillage operations, we performed an in-depth analysis of the available fields at the University of Bologna experimental farm to find the most homogeneous one in terms of moisture content and penetration resistance. Firstly we chose an untilled field with no crop residues. Then, to verify its homogeneity, the 150 m long and 100 m wide chosen field was divided into four parcels. For each parcel, three samples of soil were taken for moisture measurement, and three cone penetration tests [33] were performed. The obtained data were processed with one-way analysis of variance (ANOVA), and the results showed that no parcels have means significantly different from each other, both for moisture and penetration resistance. This led to the conclusion that the field was sufficiently homogeneous and that the two parcels described in Section 2.4 did not have significantly different untilled conditions. The field used was classified as loam soil according to the USDA textural soil classification [34]. The liquid limit (LL) and the plastic limit (PL) of the soil were 18% and 29%, respectively [35]. On the day of the tests, the mean value and the standard deviation of the soil moisture content (based on the dry mass) over the field were 14.4% and 2.7%, respectively.

2.4. Test Conditions and Experimental Design

Field tests were conducted to perform a performance comparison between the Rotoripper and the same field operation performed by the combined operation of the traditional ripper and the rotary tiller. Half of the field (first parcel) described in Section 2.3 was tilled firstly with the ripper and secondarily with the rotary tiller, while the other half (second parcel) was tilled only with the Rotoripper (Figure 3). The working depth of the ripper and the Rotoripper was fixed at 35 cm, while for the rotary tiller it was around 20 cm. The tests were performed at a target Vt of around 7.3 km h−1, 3.6 km h−1, and 3.4 km h−1 for the ripper, the rotary tiller and the Rotoripper, respectively. Moreover, both the rotary tiller and Rotoripper were powered by the tractor PTO shaft in 540E mode. All these settings were chosen because they reflected a realistic working environment, as they permit a good compromise between fuel consumption and soil arrangement.

2.5. Field Operation Data Analysis

The acquired signals were interpolated at 10 Hz with a cubic spline in Matlab® (Natick, MA, USA) to standardise all of the signals to the same sampling rate. The tractor’s actual engine power (Pe) was calculated by:
Pe = Mr [(MeMf)/100] ne (2π/60)
The passes were separated from the headland turns for each implement observing the rate of change of Pe calculated with signal differentiation. Moreover, to exclude the misleading rate of change of Pe obtained during the headland turns, the value of the signal Htph was also considered, as shown in Figure 4.
The mean values and the standard deviations of Vt, ne, npto, Pe, and f acquired during the passes were calculated. Then, to obtain a global overview of the results, the mean values and standard deviations of the mean values along passes were calculated for each configuration. These means were denoted with an overbar; to clarify, for example, Vt represents the raw signal, and V ¯ t represents the mean value of the mean values along passes.
The field capacity (Fc) and the fuel consumption per hectare (fha) were also calculated by:
Fc = bim Vt
fha = f/Fc
where bim is the width of the considered implements. Using the oxidation reaction and assuming complete combustion, which is a good approximation for this type of calculation in diesel engines where the amount of air is considerably higher than the stoichiometric value, it can be found that for each litre of fuel burned, approximately 2.624 kg of CO2 is produced [36,37]. Thus, the mass of CO2 emissions per hectare (Cmha) was calculated by:
Cmha = fha 2.624
In order to have an estimation of the real usage of the implements, in the estimation of the mean values of the operational and environmental indexes Fc, fha, and Cmha all the data acquired in a parcel were registered, so even the headland turns were considered.
After the tillage operations, following ASTM D2488 [38] procedure, about 60 kg of dry-tilled soil was collected at a depth range of 0–250 mm from 6 different points of each of the two parcels to determine the aggregate size distribution. Soil samples were sieved following the ASTM D6913/D6913M-17 [39] procedures, using seven BS ISO 3310-2 [40] sieves with nominal hole sizes ( d i ) of 2, 4, 8, 16, 31.5, 63, and 75 mm. The percentage of soil mass retained ( W i , j r % ) in the ith sieve collected in the jth parcel was calculated by:
W i , j r % = ( W i , j r / i = 1 n s W i , j r )   100
where W i , j r is the mass of soil collected in the jth parcel retained by the ith sieve and ns is the number of sieves (7). Moreover, the percentage of soil mass passed ( W i , j p % ) in each sieve was calculated by subtracting from 100% the W i , j r % retained by the sieves positioned over the ith sieve, as shown in Equation (6).
W i , j p % = 100 i = 1 i t h W i 1 , j r %
The MWD and the GMD [41] of the aggregates were calculated for each parcel as follows:
M W D = i = 1 n s d i   W i , j r %
G M D = exp [ i = 1 n s ln ( d i )   W i , j r % ]
Then, the obtained W i , j p % results were plotted in the form of granulometric curves to enable a more direct comparison between the tested configurations. Moreover, to evaluate the grade of soil compaction, cone penetration tests using a FieldScout SC 900 (Spectrum Technologies, Aurora, IL, USA) were performed before and after tillage operations in six different points homogeneously spread over each parcel following the methodology described in the ASTM D 3441 [33] standard.
To highlight any significant difference between the data obtained with the convention tillage and the ones obtained with the Rotoripper, the results were processed with one-way ANOVA using the Matlab software function anova1 (Natick, MA, USA)

2.6. Economic Evaluation

From the obtained operational indexes, a yearly economic estimation for each implement was performed by adapting the equations presented by Bodria et al. [42]. In particular, the fixed costs (Qfix) are composed of the sum of the depreciation cost (Qd), the passive interest cost (Qi), and the miscellaneous cost (Qm) (such as shelter and insurance costs), calculated by:
Qd = (ViVf)/n
Qi = [(Vi + Vf)/2] r
Qm = 0.01 Vi
Qfix = Qd + Qi + Qm
where Vi is the initial equipment investment in euros obtained from the purchase bill for the ripper and the rotary tiller, and from the manufacturer quotation for the Rotoripper, and Vf is the salvage value after n years in euros, equal to 20% of the initial investment. n is the economic life in years; its value is fixed by:
If (LS/h) > nlimn = nlim
If (LS/h) < dnlimn = LS/h
where LS is the estimated lifespan of the implements in hours, obtained from ASAE D497.7 [43] and fixed at 2000 h for the ripper and 1400 h for the rotary tiller and the Rotoripper. One can note that the Rotoripper is not present in the current literature, so the parameters and coefficients used in this analysis were considered equal to the ones listed for the rotary tiller, as the two implements are similar in terms of their kinematics. h is the annual working hours; this measure was estimated by considering for each implement the tillage of a field with a certain extension (E).
h   =   E / F c ¯
nlim has been fixed at 12 years for the ripper and 8 years for the rotary tiller and the Rotoripper, in line with the available literature [44,45], according to which active implements have generally shorter lifespans. Moreover, r is the annual interest rate, assumed to be equal to 3%, in line with Kay et al. [46]. One can note from Equation (10) that because Qm highly depends on the characteristics of the farm, a good approximation of this quota for tillage implements could be 1% of Vi [42].
Regarding the operational costs (Qop), these are composed of the restoration and maintenance cost (Qrm), labour cost (Ql), and fuel consumption cost (Qf), calculated by:
Qrm = RF1 Vi (h/1000)RF2
Ql = s h
Q   =   ( f ¯ h a   E )   /   p
Qop = Qrm + Ql + Qf
Equation (14) was obtained from ASAE 496.3 [47], and the coefficients RF1 and RF2 were derived from ASAE 497.7 [43]. In particular, for the ripper RF1 and RF2 are equal to 0.28 and 1.4, respectively; for the other two implements, RF1 and RF2 are equal to 0.36 and 2.0, respectively. An hourly salary (s) of 19.60 EUR h−1 was considered for labour costs, in line with projects funded by the EU Rural Development Programme in the Emilia-Romagna region (Italy). The cost of diesel fuel per litre (p) was fixed at 0.89 EUR L−1, the Italian market price on the day of the tests.
Then, the total cost per year (Cy), the total cost per hour (Ch), and the total cost per hectare (Cha) were calculated by:
Cy = Qfix + Qop
Ch = Cy/h
Cha = Cy/E
To highlight the impact of Qop on global ownership costs, the coefficient α was calculated by:
α = Qop/Cy

3. Results

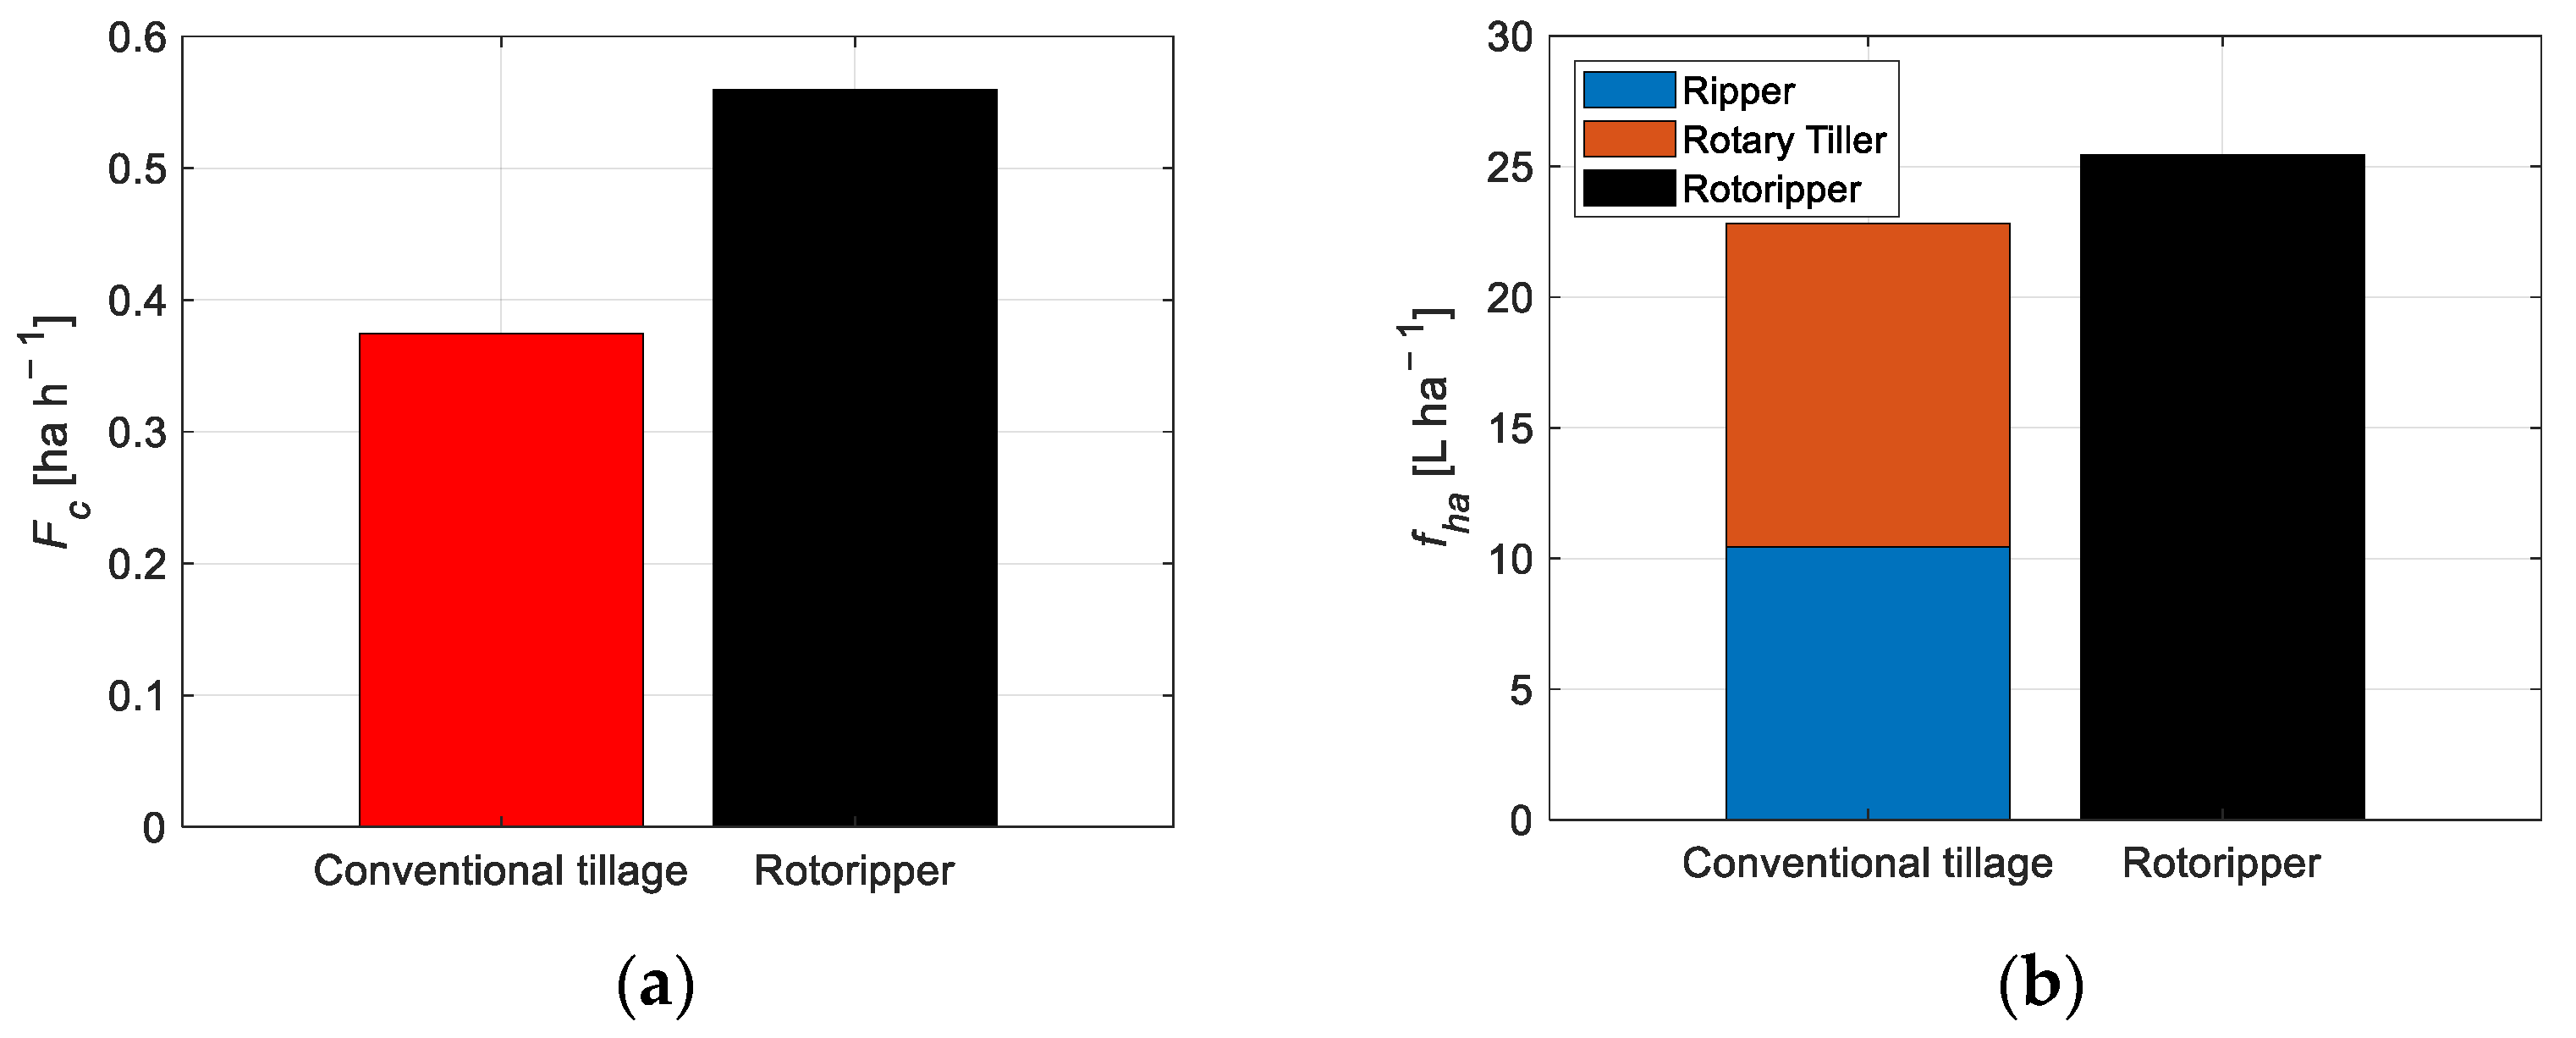
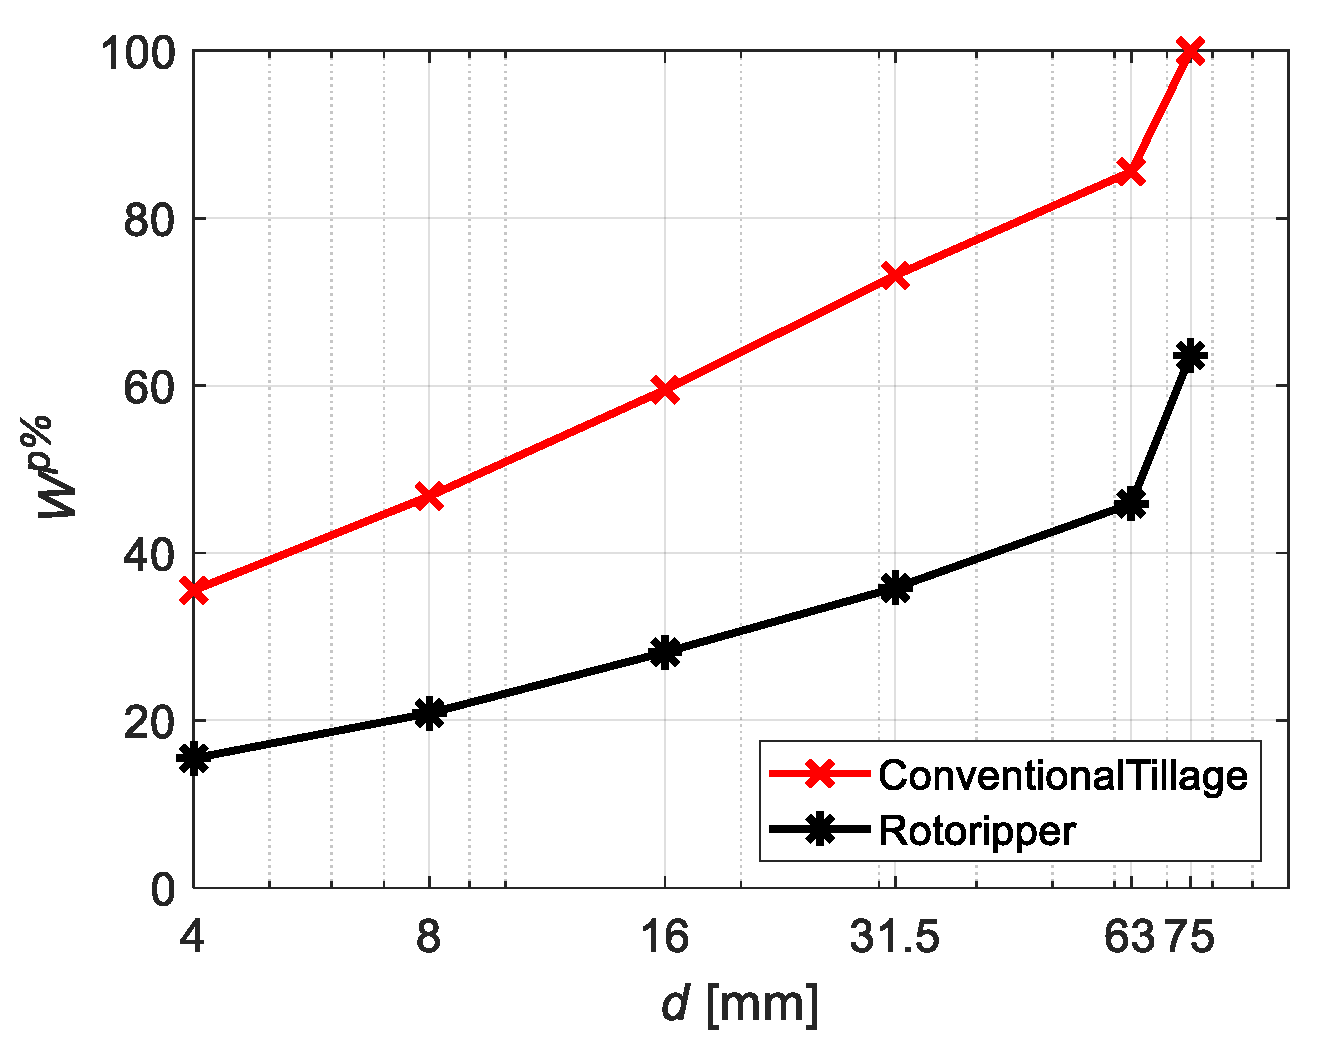
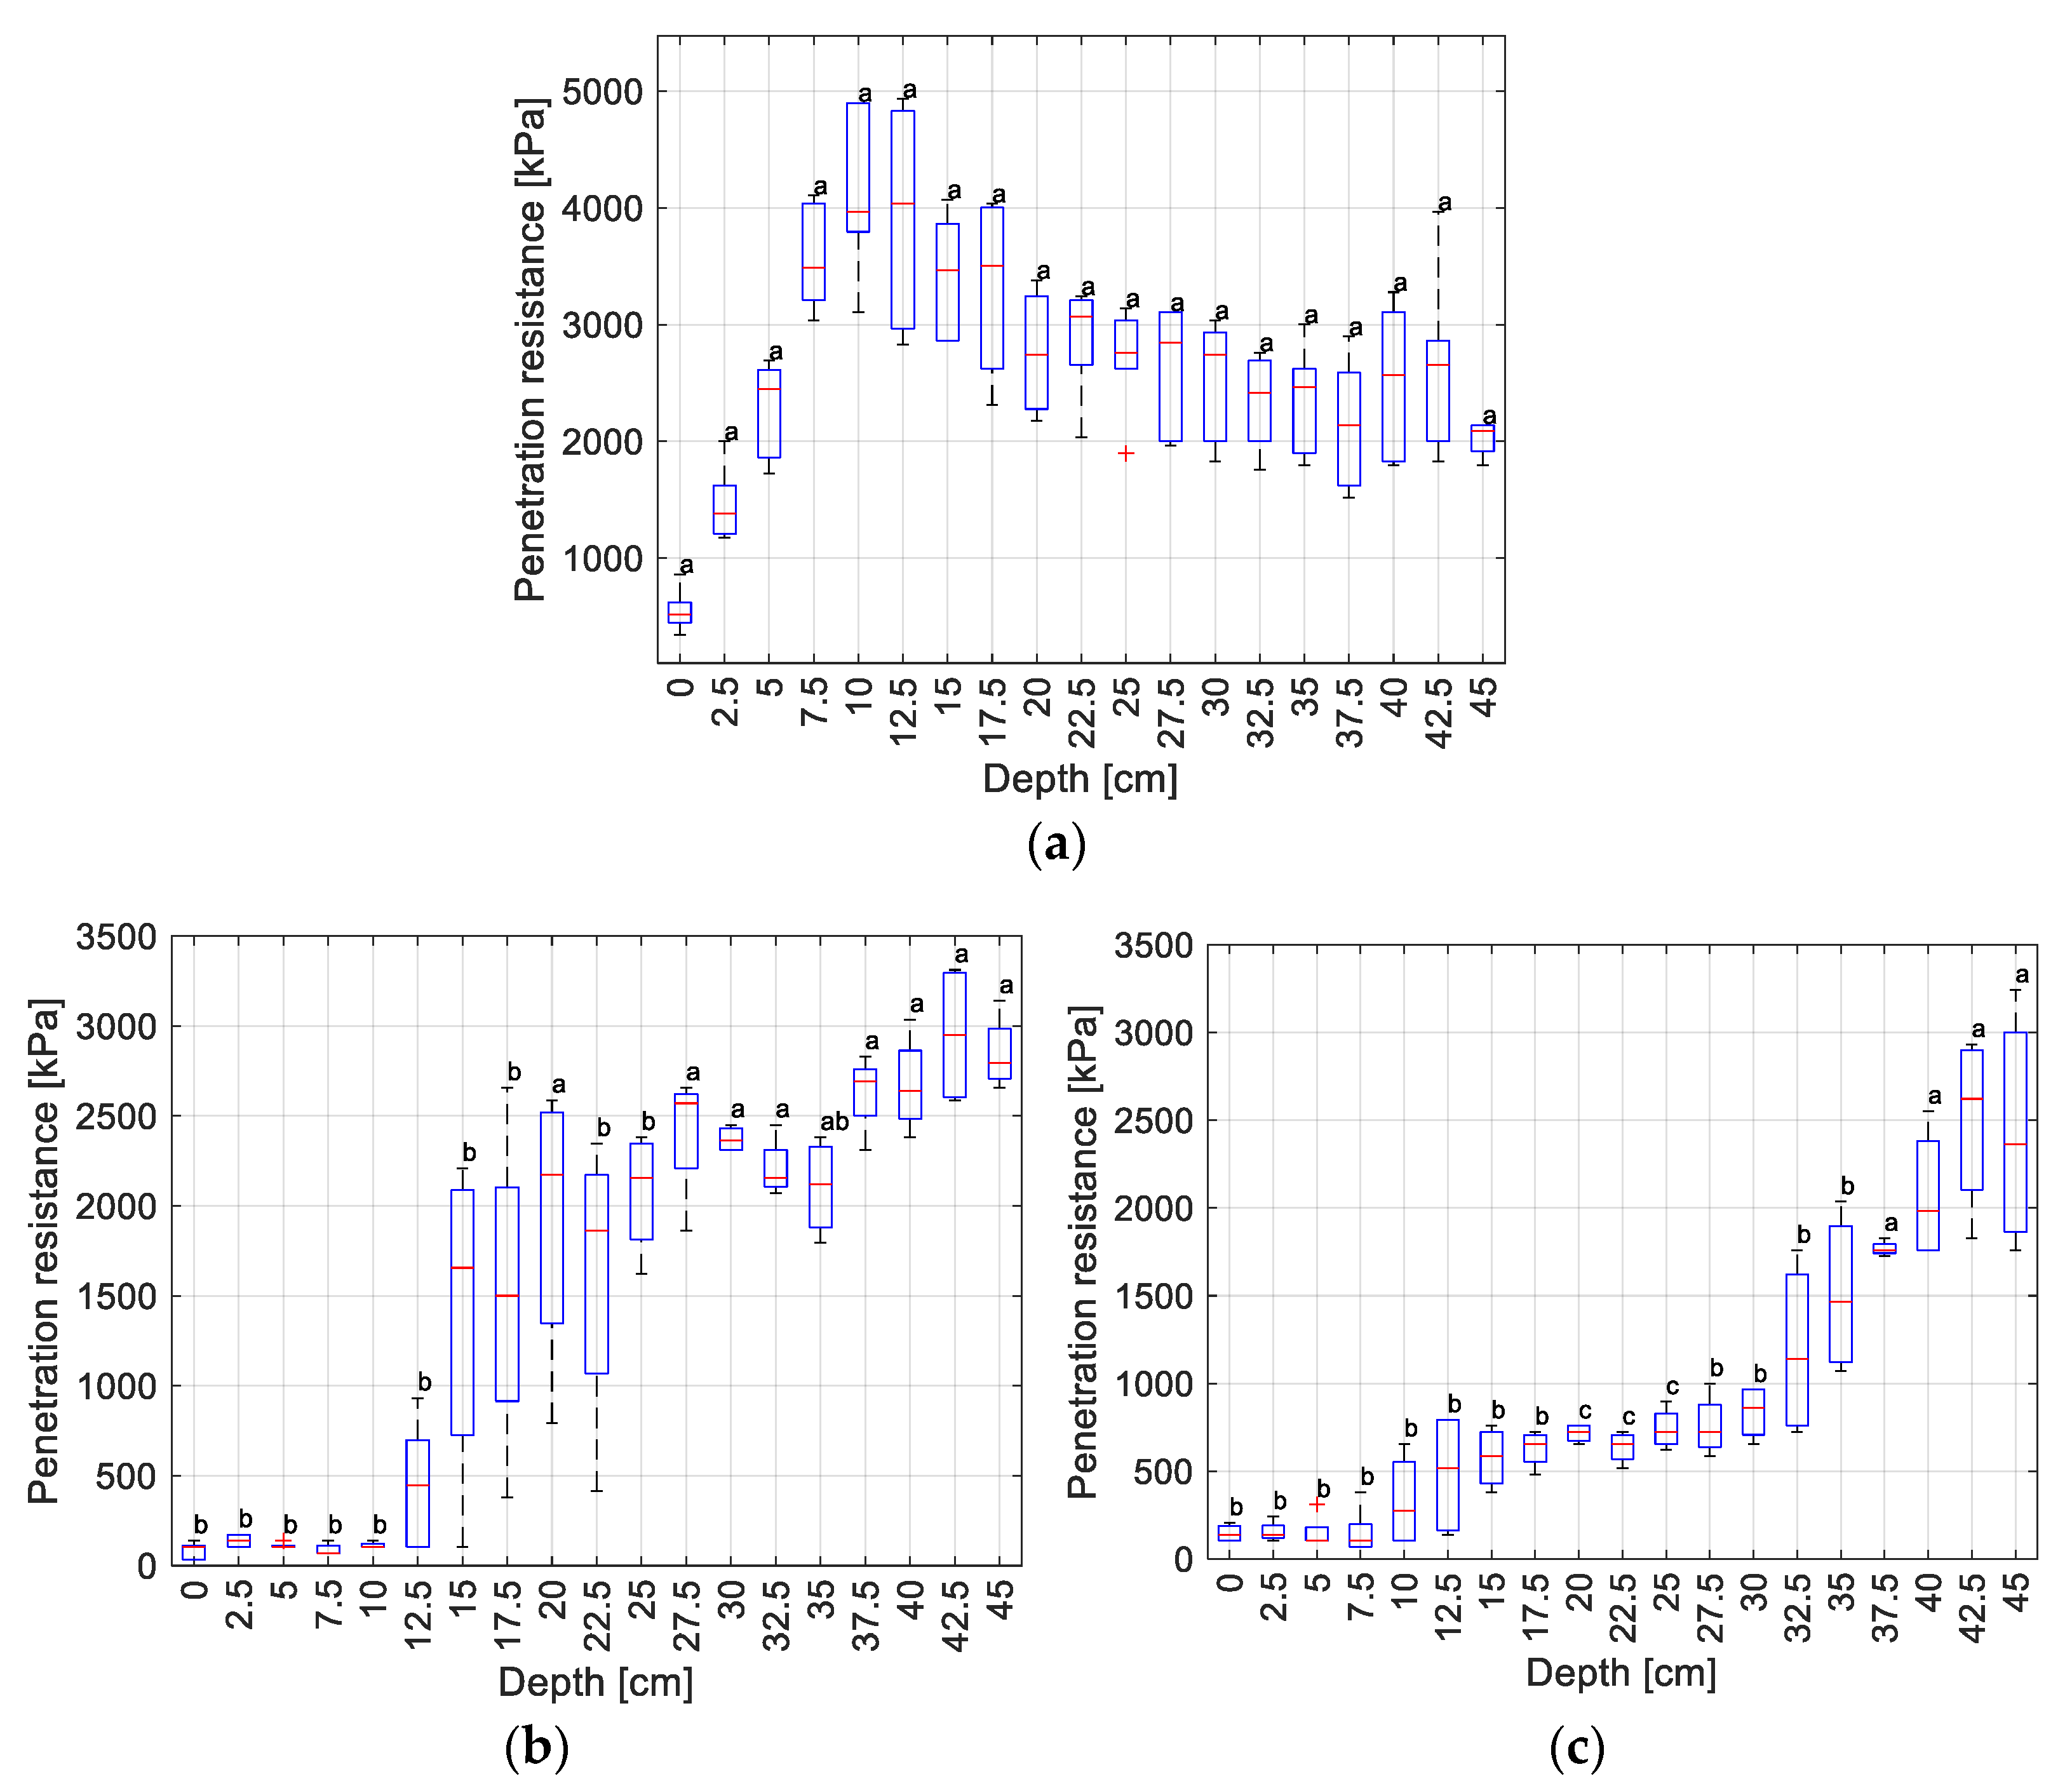
3.1. Field Tests Results

The mean values of the performance parameters obtained during the passes are reported in Table 3.
One can note that the values of n ¯ e , n ¯ p t o , and V ¯ t are compliant with those designed for the tests. Moreover, their low standard deviation values show that the test conditions were maintained almost constantly all over the parcels. The Rotoripper showed the highest P ¯ e of 69.0 kW, which is not significantly different from the value registered by the ripper but around 2.4 times higher than the value obtained with the rotary tiller. The f ¯ followed the trend shown by P ¯ e , and indeed both the Ripper and Rotoripper showed a value of 16.6 L h−1, while the rotary tiller had a value 53% lower. As a consequence, the combined f ¯ to perform conventional tillage resulted in 24.4 L h−1, which is 52% higher than the value registered with the usage of solely the Rotoripper.
The estimation of the mean values of the operational and environmental indexes Fc and fha are reported in Figure 5.
The Rotoripper and the rotary tiller registered very similar values of Fc, 0.56 and 0.57 ha h−1, respectively. On the other hand, the ripper showed a much higher value of 1.08 ha h−1 due to higher values of V ¯ t and bim. However, the global value of Fc for the conventional tillage operation was found to be 0.37 ha h−1, which is 33% lower than the one registered by the Rotoripper. This is because the same extension must be tilled with two implements rather than only one, thus lengthening the working time. Regarding fha, the Rotoripper showed the highest value of 25.4 L ha−1, which is more than double the values measured by the ripper and the rotary tiller. So, even the global fha for the conventional tillage was shown to be 2.6 L ha−1 lower than that for the tillage operation performed only with the Rotoripper. This is also reflected in the Cmha, where the Rotoripper emits 66.8 kg ha−1 of CO2, which is 6.9 kg ha−1 more than the conventional tillage emission.
Figure 6 shows the granulometric curves obtained in the parcels after the tillage.
One can note that the parcel tilled with conventional tillage showed finer soil aggregates, mainly because only 63.6% of the soil tilled by the Rotoripper passed the first 75 mm sieve. This is further evidenced by the obtained values of MWD and GMD, which are 16.7 mm and 6.2 mm for the conventional tillage and 43.7 mm and 22.0 mm for the Rotoripper, respectively.
Cone penetration test results presented in Figure 7 show that before tillage there was the presence of a soil hardpan layer between 7.5 cm and 17.5 cm of depth, with values of penetration resistance over 4000 kPa. One can note that after tillage this hard layer was no longer present in both tillage configurations; however, the parcel tilled with the Rotoripper had lower penetration resistance values than the other one. Indeed, the combination of the ripper and rotary tiller produced big spikes in the soil penetration resistance around 15–22.5 cm of depth due to the distinctive movement of the hoes that created a harder layer at its nominal working depth. In fact, the Rotoripper does not present any big spikes in terms of penetration resistance in that depth range. Moreover, in the range of 20–32.5 cm, the values registered by the Rotoripper were always significantly lower than the ones obtained with the conventional tillage implements. One can note that both tillage methodologies have similar values past 35 cm of depth because neither of them can till at that depth.

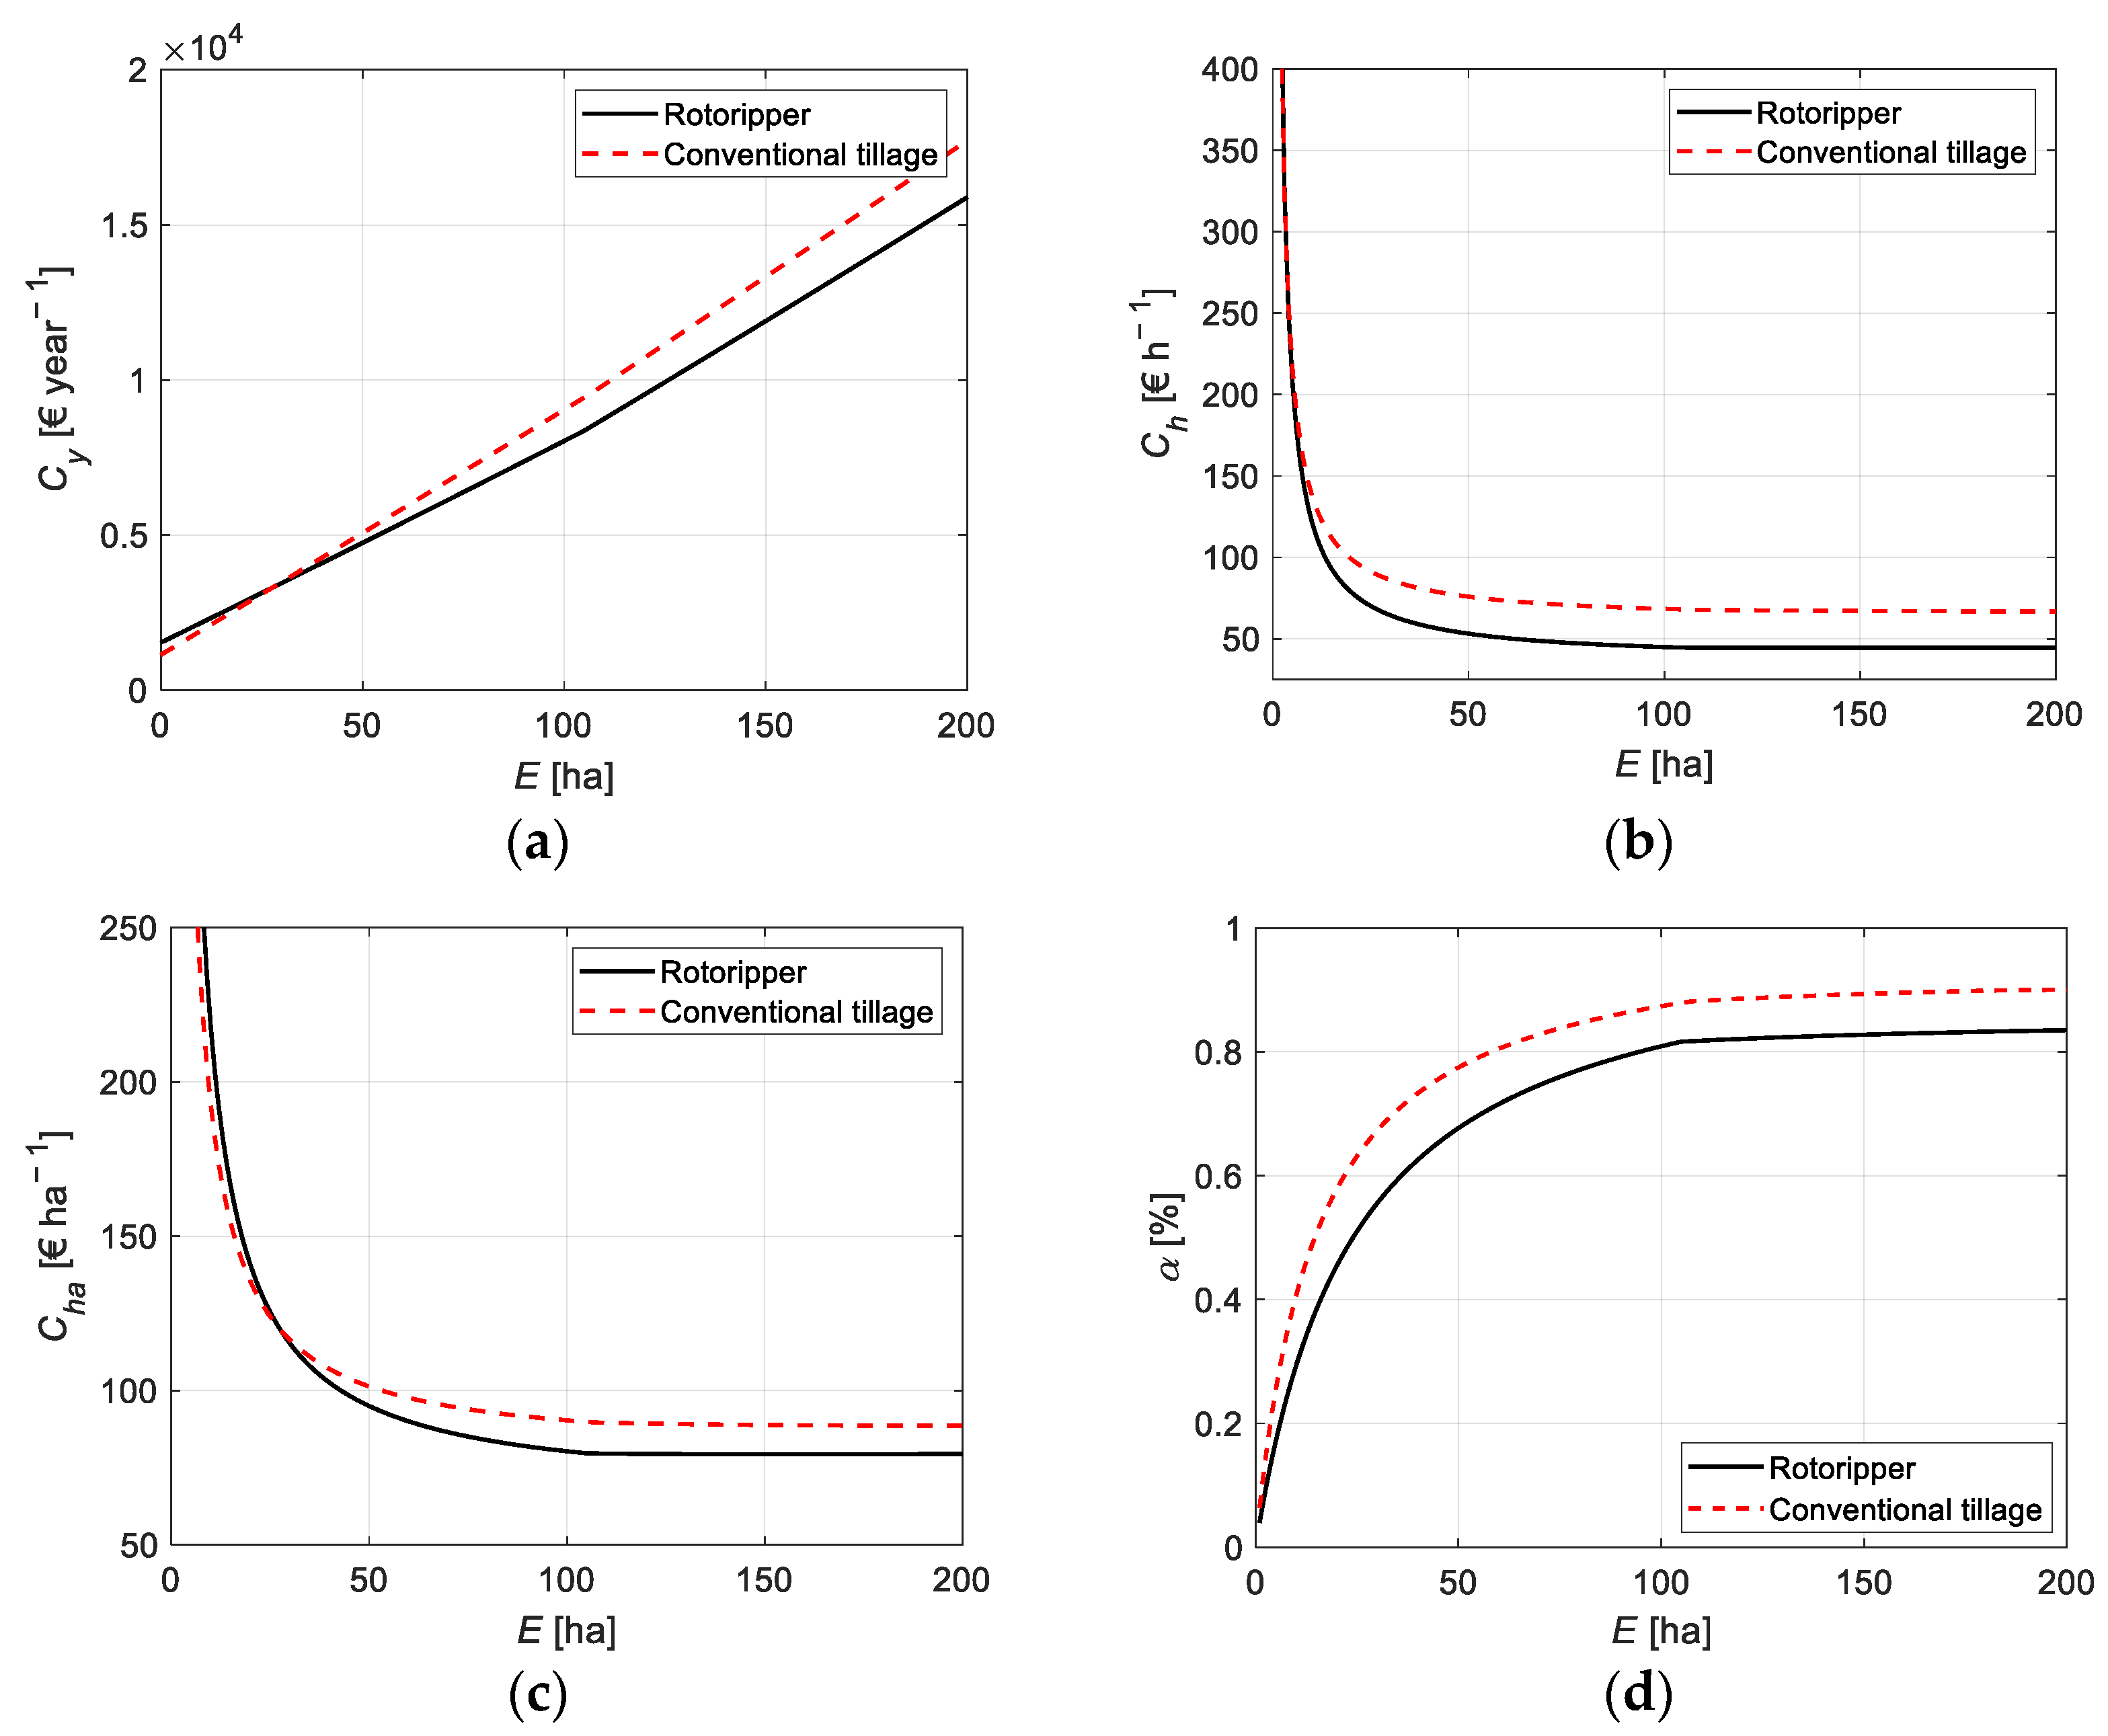
3.2. Economic Evaluation

The behaviours of Cy, Ch, Cha, and α in function of E are reported in Figure 8.
The initial value of Cy for the Rotoripper at E = 0 ha, that is, Qfix, is EUR 1536, which is 34% higher than the value obtained with conventional tillage. Then, Cy increases with the increase of E for both conventional tillage and the Rotoripper; however, in the latter case, the rate is lower. So, with extensions over E = 27 ha, the Rotoripper becomes more economically convenient. Ch showed a hyperbolic behaviour with horizontal asymptotes fixed around 44.48 EUR h−1 and 66.84 EUR h−1 for the Rotoripper and the conventional tillage, respectively. One can note that from an hourly cost point of view, the Rotoripper became more convenient than the conventional tillage after just 3 ha of tilled field. Even Cha showed hyperbolic behaviour, with the horizontal asymptotes fixed around 79.46 EUR ha−1 and 88.64 EUR ha−1 for the Rotoripper and the conventional tillage, respectively. As already observed for Cy, the use of the Rotoripper become more convenient than the conventional tillage from a cost-per-hectare point of view after E = 27 ha. Regarding α, one can note that in both tillage methodologies, it increases with the increase of E. In particular, the conventional tillage always has higher values of α than the Rotoripper due to higher values of Ql, as longer tillage times are required for a given extension.

4. Discussion and Conclusions

The necessity to decrease the impact of agricultural practices is pushing manufacturers in their search for novel solutions to increase the sustainability of their products in environmental, economic, and social terms. There is considerable evidence that conservative tillage practices can provide environmental and economic benefits compared to conventional tillage practices. However, the usage of conservative tillage implements has some drawbacks, such as difficult weed management and stagnation problems in humid climates due to low soil porosity at depth. In this study, a field and economic performance analysis was conducted on an innovative rotational ripper (Rotoripper; Selvatici Srl, San Lazzaro di Savena; Bertoni Srl, Castel Bolognese, Italy) that could solve these issues. In particular, field tests were conducted directly comparing the performances in terms of energy requirements, tilled soil quality, and ownership costs of a conventional tillage technique, using a ripper and a rotary tiller, and the usage of solely the Rotoripper. The results show that the power requirements of the conventional implements line up with the data available in the current literature if differences due to soil type and working widths are considered [48,49,50]. Moreover, the Rotoripper required 69.0 kW of engine power to be used, which is similar to the value registered by the ripper but around 2.4 times higher than the value obtained with the rotary tiller. This significant difference from the rotary tiller is mainly due to the two different working depths [51], which are 20 cm and 35 cm for the rotary tiller and the Rotoripper, respectively. Moreover, even though the ripper works at the same depth and is a passive implement—a type of machine which usually requires less energy to run [22,48]—it required almost the same amount of power because the operation was performed at more than double the tillage speed of the Rotoripper [51]. As expected, the hourly fuel consumption followed the trend shown by the power required by each implement, so the combined consumption to perform conventional tillage was 52% higher than the value registered with the usage of solely the Rotoripper. However, the fuel consumption per hectare for the conventional tillage was shown to be 2.6 L ha−1 lower than for the tillage operation performed only with the Rotoripper, despite the field capacity of the latter being 0.18 ha h−1 higher. This is also reflected in the CO2 emissions, where the Rotoripper emits 6.9 kg ha−1 more than the conventional tillage implements. However, an important factor that is not considered in these results is the fuel used (and consequently the CO2 emitted) during the transport of the implements from the depot to the field. In fact, the adoption of the Rotoripper does not require an implement swap to fulfil the field operation. This aspect increases its importance with the increase of the distance between the field and the depot [52]. Both the granulometric curves and the MWD and GMD indexes show that the field parcel worked with the conventional tillage has sufficient characteristics for a subsequent seeding operation, agreeing with the results obtained by Adam et al. [53] and Braunack et al. [54]. On the other hand, in the parcel tilled with only the Rotoripper, sowing is not possible without further tillage operations. This is mainly due to the high percentage (63.6%) of soil aggregates with diameters over 75 mm that resulted in the latter parcel. Cone penetration test results show that the usage of the Rotoripper induced greater soil porosity than the conventional tillage in the depth range of 20–35 cm, reducing the possibility of water stagnation issues [55]. Indeed, ripping the soil is one of the most common methods presented in the literature to remove soil compaction by physical means [56]. Regarding the economic evaluation, the use of the Rotoripper becomes more convenient than conventional tillage from both yearly cost and cost-per-hectare points of view after only 27 ha of tilled field. In particular, the Rotoripper is more convenient beyond that field area mainly because longer tillage times are required for conventional tillage, so the labour costs become increasingly onerous. This agrees with current literature, where it is remarked that the impact of labour costs on conventional tillage is one of the causes of its lower use in recent years [57,58,59]. It is important to remark that even these results do not include time and fuel used during the transport of the implements from the depot to the field. Moreover, to produce a more detailed cost analysis, a wide-time-frame data acquisition activity should be performed to monitor even accessories’ operational activities such as idling times due to attachment and adjustment of implements [60]. In conclusion, the major benefits obtainable with the adoption of the Rotoripper instead of conventional tillage implements are the increased porosity of the soil in the deepest layer and the increased cost-effectiveness. However, the latter may be affected by the low soil segregation level obtained with the Rotoripper, which means further tillage operations are necessary before planting. A possible solution to this issue could be the usage of a planter with integrated tillage tools, such as disk harrows, that would allow seeding without additional steps. Moreover, the adoption of the methodology proposed by Varani et al. [61] when using the Rotoripper might yield optimal combinations of forward tractor speed and rotational speed of the working elements that allow good soil refinement with reasonable energy expenditure.

Author Contributions

Conceptualization, M.V. and M.M.; methodology, M.V. and M.M.; software, M.V.; validation, M.V. and M.M.; formal analysis, M.V.; investigation, M.V. and M.M.; resources, M.V. and M.M.; data curation, M.V.; writing—original draft preparation, M.V.; writing—review and editing, M.V. and M.M.; visualization, M.V.; supervision, M.M.; project administration, M.M.; funding acquisition, M.V. and M.M. All authors have read and agreed to the published version of the manuscript.

Funding

This research received no external funding.

Data Availability Statement

The data presented in this study are available on request from the corresponding author.

Acknowledgments

This research was supported by Selvatici Srl (San Lazzaro di Savena, Italy) and Bertoni Srl (Castel Bolognese, Italy), which provided the Rotoripper used for the experimental activities.

Conflicts of Interest

The authors declare no conflict of interest.

References

  1. Beckman, J.; Ivanic, M.; Jelliffe, J.L.; Baquedano, F.G.; Scott, S.G. Economic and Food Security Impacts of Agricultural Input Reduction Under the European Union Green Deal’s Farm to Fork and Biodiversity Strategies; Economic Research Service: Washington, DC, USA, 2020. [Google Scholar]
  2. Garnett, T.; Appleby, M.C.; Balmford, A.; Bateman, I.J.; Benton, T.G.; Bloomer, P.; Burlingame, B.; Dawkins, M.; Dolan, L.; Fraser, D.; et al. Sustainable Intensification in Agriculture: Premises and Policies. Science 2013, 341, 33–34. [Google Scholar] [CrossRef]
  3. Balázs, B.; Kelemen, E.; Centofanti, T.; Vasconcelos, M.W.; Iannetta, P.P.M. Integrated policy analysis to identify transformation paths to more sustainable legume-based food and feed value-chains in Europe. Agroecol. Sustain. Food Syst. 2021, 45, 931–953. [Google Scholar] [CrossRef]
  4. Zanin, A.; Dal Magro, C.B.; Bugalho, D.K.; Morlin, F.; Afonso, P.; Sztando, A. Driving Sustainability in Dairy Farming from a TBL Perspective: Insights from a Case Study in the West Region of Santa Catarina, Brazil. Sustainability 2020, 12, 6038. [Google Scholar] [CrossRef]
  5. Singh, S.; Srivastava, S.K. Decision support framework for integrating triple bottom line (TBL) sustainability in agriculture supply chain. Sustain. Account. Manag. Policy J. 2021. ahead of print. [Google Scholar] [CrossRef]
  6. Elkington, J. Towards the Sustainable Corporation: Win-Win-Win Business Strategies for Sustainable Development. Calif. Manag. Rev. 1994, 36, 90–100. [Google Scholar] [CrossRef]
  7. Borin, M.; Menini, C.; Sartori, L. Effects of tillage systems on energy and carbon balance in north-eastern Italy. Soil Tillage Res. 1997, 40, 209–226. [Google Scholar] [CrossRef]
  8. Choudhary, S.; Upadhyay, G.; Patel, B.; Sihag, N.; Jain, M. Energy Requirements and Tillage Performance Under Different Active Tillage Treatments in Sandy Loam Soil. J. Biosyst. Eng. 2021, 46, 353–364. [Google Scholar] [CrossRef]
  9. Balsari, P.; Biglia, A.; Comba, L.; Sacco, D.; Alcatrão, L.E.; Varani, M.; Mattetti, M.; Barge, P.; Tortia, C.; Manzone, M.; et al. Performance analysis of a tractor—Power harrow system under different working conditions. Biosyst. Eng. 2020, 202, 28–41. [Google Scholar] [CrossRef]
  10. Godwin, R. A review of the effect of implement geometry on soil failure and implement forces. Soil Tillage Res. 2007, 97, 331–340. [Google Scholar] [CrossRef]
  11. Mattetti, M.; Varani, M.; Molari, G.; Morelli, F. Influence of the speed on soil-pressure over a plough. Biosyst. Eng. 2017, 156, 136–147. [Google Scholar] [CrossRef]
  12. Natsis, A.; Papadakis, G.; Pitsilis, J. The Influence of Soil Type, Soil Water and Share Sharpness of a Mouldboard Plough on Energy Consumption, Rate of Work and Tillage Quality. J. Agric. Eng. Res. 1999, 72, 171–176. [Google Scholar] [CrossRef]
  13. OECD. Environmental Indicators for Agriculture—Volume 3: Methods and Results; OECD Publishing: Berlin, Germany, 2001. [Google Scholar]
  14. Biswas, M.R. Agricultural Production and Environment: A Review. Environ. Conserv. 1984, 11, 253–259. [Google Scholar] [CrossRef]
  15. Varani, M.; Mattetti, M.; Maraldi, M.; Molari, G. Mechanical Devices for Mass Distribution Adjustment: Are They Really Convenient? Agronomy 2020, 10, 1820. [Google Scholar] [CrossRef]
  16. Varani, M.; Mattetti, M.; Molari, G. Performance Evaluation of Electrically Driven Agricultural Implements Powered by an External Generator. Agronomy 2021, 11, 1447. [Google Scholar] [CrossRef]
  17. Scarlett, A.J. Integrated control of agricultural tractors and implements: A review of potential opportunities relating to cultivation and crop establishment machinery. Comput. Electron. Agric. 2001, 30, 167–191. [Google Scholar] [CrossRef]
  18. Mohammadi, F.; Maleki, M.R.; Khodaei, J. Control of variable rate system of a rotary tiller based on real-time measurement of soil surface roughness. Soil Tillage Res. 2021, 215, 105216. [Google Scholar] [CrossRef]
  19. Riegler-Nurscher, P.; Moitzi, G.; Prankl, J.; Huber, J.; Karner, J.; Wagentristl, H.; Vincze, M. Machine vision for soil roughness measurement and control of tillage machines during seedbed preparation. Soil Tillage Res. 2019, 196, 104351. [Google Scholar] [CrossRef]
  20. Knowler, D.; Bradshaw, B. Farmers’ adoption of conservation agriculture: A review and synthesis of recent research. Food Policy 2007, 32, 25–48. [Google Scholar] [CrossRef]
  21. Holland, J.M. The environmental consequences of adopting conservation tillage in Europe: Reviewing the evidence. Agric. Ecosyst. Environ. 2004, 103, 1–25. [Google Scholar] [CrossRef]
  22. Lal, R. Carbon emission from farm operations. Environ. Int. 2004, 30, 981–990. [Google Scholar] [CrossRef]
  23. Rusu, T. Energy efficiency and soil conservation in conventional, minimum tillage and no-tillage. Int. Soil Water Conserv. Res. 2014, 2, 42–49. [Google Scholar] [CrossRef] [Green Version]
  24. Hunt, D.; Wilson, D. Farm Power and Machinery Management, 11th ed.; Waveland Press: Long Grove, IL, USA, 2015; ISBN 978-1-4786-3177-4. [Google Scholar]
  25. Vozka, P. Comparison of Alternative Tillage Systems. Master’s Thesis, Cranfield University School of Applied Sciences, Cranfield, UK, 2007. [Google Scholar]
  26. Weersink, A.; Walker, M.; Swanton, C.; Shaw, J. Economic Comparison of Alternative Tillage Systems under Risk. Can. J. Agric. Econ. Can. d′Agroeconomie 1992, 40, 199–217. [Google Scholar] [CrossRef]
  27. Sijtsma, C.H.; Campbell, A.J.; McLaughlin, N.B.; Carter, M.R. Comparative tillage costs for crop rotations utilizing minimum tillage on a farm scale. Soil Tillage Res. 1998, 49, 223–231. [Google Scholar] [CrossRef]
  28. Soane, B.D.; Ball, B.C.; Arvidsson, J.; Basch, G.; Moreno, F.; Roger-Estrade, J. No-till in northern, western and south-western Europe: A review of problems and opportunities for crop production and the environment. Soil Tillage Res. 2012, 118, 66–87. [Google Scholar] [CrossRef] [Green Version]
  29. Pagliai, M.; Vignozzi, N.; Pellegrini, S. Soil structure and the effect of management practices. Soil Tillage Res. 2004, 79, 131–143. [Google Scholar] [CrossRef]
  30. Chen, Y.; Cavers, C.; Tessier, S.; Monero, F.; Lobb, D. Short-term tillage effects on soil cone index and plant development in a poorly drained, heavy clay soil. Soil Tillage Res. 2005, 82, 161–171. [Google Scholar] [CrossRef]
  31. Rotoripper—Ripuntatore Rotativo | SELVATICI Srl. Available online: https://www.selvatici.com/ita/products/rotoripper---ripuntatore-rotativo-cat-14.html (accessed on 22 December 2022).
  32. Köppen, W. Das Geographische System Der Climate; Gebrü der Borntraeger: Berlin, Germany, 1936. [Google Scholar]
  33. ASTM. ASTM D3441-16 Standard Test Method for Mechanical Cone Penetration Testing of Soils; ASTM International: West Conshohocken, PA, USA, 2018. [Google Scholar]
  34. USDA. Soil Mechanichs Level I.; U.S. Department of Agriculture: Washington, DC, USA, 1987.
  35. ASTM. ASTM D4318-17e1 Test Methods for Liquid Limit, Plastic Limit, and Plasticity Index of Soils; ASTM International: Washington, DC, USA, 2018. [Google Scholar]
  36. Geerlings, H.; van Duin, R. A new method for assessing CO2-emissions from container terminals: A promising approach applied in Rotterdam. J. Clean. Prod. 2011, 19, 657–666. [Google Scholar] [CrossRef]
  37. Mattetti, M.; Beltramin, A.; Estevez, M.A.P.; Varani, M.; Renzi, M.; Alberti, L. Start and stop systems on agricultural tractors as solution for saving fuel and emissions. Biosyst. Eng. 2022, 216, 108–120. [Google Scholar] [CrossRef]
  38. ASTM. D2488—Practice for Description and Identification of Soils (Visual-Manual Procedure); ASTM International: Washington, DC, USA, 2009. [Google Scholar]
  39. ASTM. ASTM D6913/D6913M-17—Standard Test Methods for Particle-Size Distribution (Gradation) of Soils Using Sieve Analysis; ASTM International: Washington, DC, USA, 2021. [Google Scholar]
  40. BS ISO 3310-2:2013 Test Sieves—Technical Requirements and Testing. Civ. Environ. Res. 2013, 14, 7.
  41. Van Bavel, C.H.M. Mean Weight-Diameter of Soil Aggregates as a Statistical Index of Aggregation. Soil Sci. Soc. Am. J. 1950, 14, 20–23. [Google Scholar] [CrossRef] [Green Version]
  42. Bodria, L.; Pellizzi, G.; Piccarolo, P. Meccanica agraria; Edagricole: Bologna, Italy, 2006; ISBN 978-88-506-5131-3. [Google Scholar]
  43. ASAE. D497.7 Agricultural Machinery Management Data; American Society of Association Executives: Washington, DC, USA, 2015. [Google Scholar]
  44. Edwards, W. Machinery Management: Estimating Farm Machinery Costs. Ag Decis. Mak. 2015, A3–29. [Google Scholar]
  45. Medici, M.; Canavari, M. Addressing Risk Associated to ICT-Based Technology: Estimation of Financial Parameters; IGI Global: Hershey, PA, USA, 2021; pp. 174–184. ISBN 978-1-79984-850-9. [Google Scholar]
  46. Kay, R.; Edwards, W.; Duffy, P. Farm Management, 9th ed.; McGraw-Hill Education: New York, NY, USA, 2020; ISBN 978-1-260-00219-5. [Google Scholar]
  47. ASAE. ASAE D496.3—Agricultural Machinery Management; ASAE Standard: St. Joseph, MI, USA, 2006. [Google Scholar]
  48. Kheiralla, A.; Yahya, A.; Zohadie, M.; Ishak, W. Modelling of power and energy requirements for tillage implements operating in Serdang sandy clay loam, Malaysia. Soil Tillage Res. 2004, 78, 21–34. [Google Scholar] [CrossRef]
  49. Fanigliulo, R.; Pochi, D.; Servadio, P. Conventional and Conservation Seedbed Preparation Systems for Wheat Planting in Silty-Clay Soil. Sustainability 2021, 13, 6506. [Google Scholar] [CrossRef]
  50. Smith, L.A.; Williford, J.R. Power Requirements of Conventional, Triplex, and Parabolic Subsoilers. Trans. Am. Soc. Agric. Eng. 1988, 31, 1685–1688. [Google Scholar] [CrossRef]
  51. ASAE. ASAE D497.7—Agricultural Machinery Management Data; ASAE Standard: St. Joseph, MI, USA, 2011; pp. 1–15. [Google Scholar]
  52. Weise, G.; Engelhardt, D. The Use of Trucks for Agricultural Transport. In Proceedings of the 2000 ASAE Annual International Meeting, Milwaukee, WI, USA, 9–12 July 2000; Volume 1, pp. 2527–2540. [Google Scholar]
  53. Adam, K.M.; Erbach, D.C. Secondary Tillage Tool Effect on Soil Aggregation. Trans. ASAE 1992, 35, 1771–1776. [Google Scholar] [CrossRef]
  54. Braunack, M.V.; Dexter, A.R. Soil aggregation in the seedbed: A review. I. Properties of aggregates and beds of aggregates. Soil Tillage Res. 1989, 14, 259–279. [Google Scholar] [CrossRef]
  55. Osunbitan, J.A.; Oyedele, D.J.; Adekalu, K.O. Tillage effects on bulk density, hydraulic conductivity and strength of a loamy sand soil in southwestern Nigeria. Soil Tillage Res. 2005, 82, 57–64. [Google Scholar] [CrossRef]
  56. Hamza, M.A.; Anderson, W.K. Soil compaction in cropping systems: A review of the nature, causes and possible solutions. Soil Tillage Res. 2005, 82, 121–145. [Google Scholar] [CrossRef]
  57. Weersink, A.; Walker, M.; Swanton, C.; Shaw, J.E. Costs of Conventional and Conservation Tillage Systems. J. Soil Water Conserv. 1992, 47, 328–334. [Google Scholar]
  58. Šařec, O.; Šařec, P.; Hájek, P. Evaluation of Different Soil Tillage Technologies of Grain Maize Production; Swedish University of Agricultural Sciences: Uppsala, Sweden, 2013; pp. 562–566. [Google Scholar]
  59. Wang, X.-B.; Cai, D.-X.; Hoogmoed, W.B.; Oenema, O.; Perdok, U.D. Potential Effect of Conservation Tillage on Sustainable Land Use: A Review of Global Long-Term Studies1 1Project Supported by the National Natural Science Foundation of China (No 40571151), the Beijing Key Lab of Resources Environment and GIS at Capital Normal University, and the National High Technology Research and Development Program of China (863 Program) (Nos. 2002AA2Z4311 and 2002AA2Z4021). Pedosphere 2006, 16, 587–595. [Google Scholar] [CrossRef]
  60. Mattetti, M.; Medici, M.; Canavari, M.; Varani, M. CANBUS-enabled activity-based costing for leveraging farm management. Comput. Electron. Agric. 2022, 194, 106792. [Google Scholar] [CrossRef]
  61. Varani, M.; Mattetti, M.; Molari, G.; Biglia, A.; Comba, L. Correlation between power harrow energy demand and tilled soil aggregate dimensions. Biosyst. Eng. 2023, 225, 54–68. [Google Scholar] [CrossRef]
Figure 1. Pictures of the conventional tillage implements ripper (a) and rotary tiller (b) used for the tests. Pictures highlighting the main components of the Rotoripper (c), a ripper with a crankshaft actuated by the tractor PTO that permits the rotation of its working elements as on a standard rotary tiller (Selvatici Srl, San Lazzaro di Savena, Italy; Bertoni Srl, Castel Bolognese, Italy).
Agronomy 13 00365 g001
Figure 2. Picture of the New Holland T5.140 (CNH Industrial N.V., Amsterdam, Netherlands) during the tests with the Rotoripper.
Agronomy 13 00365 g002
Figure 3. Field used for the tests. Half of the field, the one marked in red colour, was tilled with both ripper and rotary tiller, while the other half, the one marked in light blue colour, was tilled only with the Rotoripper.
Agronomy 13 00365 g003
Figure 4. Separation of the passes from the headland turns observing the rate of change of Pe, calculated with signal differentiation, and the value of the signal Htph that is equal to 1 when the TPH is in working position and 0 when it is lifted from the ground.
Agronomy 13 00365 g004
Figure 5. Mean values of operational and environmental indexes Fc (a) and fha (b).
Agronomy 13 00365 g005
Figure 6. Granulometric curves obtained with conventional tillage and the Rotoripper.
Agronomy 13 00365 g006
Figure 7. Cone penetration test results before the tillage (a), after the tillage in the parcel worked with conventional tillage (b), and after the tillage in the parcel worked with the Rotoripper (c). Each boxplot shows the median values of the repetitions with a red line, the 25th–75th percentile with a blue box, the maximum/minimum with whiskers, and the outliers with red crosses. Values with the same letter on the same depth do not differ statistically (p > 0.05) by the ANOVA test.
Agronomy 13 00365 g007
Figure 8. The total cost per year (Cy) (a), the total cost per hour (Ch) (b), the total cost per hectare (Cha) (c), and the impact of the operational costs on the global ownership costs (α) (d).
Agronomy 13 00365 g008
Table 1. Implement specifications claimed by the manufacturers. The purchase cost was obtained from the purchase bill for the ripper and the rotary tiller, and from the manufacturer quotation for the Rotoripper.
SpecificationConventional TillageRotoripper
RipperRotary Tiller
Mass (kg)450600950
Width (bim) (m)2.11.81.8
Nominal working depth (mm)Up to 400Up to 200From 200 up to 400
Linkage categoryCat. 2Cat. 2Cat. 2
Nominal PTO speed (rpm)540 + 540E540 + 540E540 + 540E
Purchase cost (Vi) (euros)2600700012,000
Table 2. Main specifications of the tractor used for the tests claimed by the manufacturer.
SpecificationValue/Description
ManufacturerCNH Industrial N.V. (Amsterdam, Netherlands)
ModelNew Holland T5.140
Nominal engine power (kW) 96 @ 2200 rpm
Max torque (Nm)630 @1300 rpm
Unballasted mass (kg)5500
Rear PTO transmission ratio in 540E mode (τPTO)2.86
Table 3. Mean values of the performance parameters obtained during the passes, standard deviations in brackets. Means with the same apex letter (a, b or c) on the same row do not differ statistically (p > 0.05) by the ANOVA test.
ParameterConventional TillageRotoripper
RipperRotary Tiller
Engine Speed ( n ¯ e ) (rpm)’1805 (24) a1554 (6) b1574 (24) b
PTO speed ( n ¯ p t o ) (rpm)-543 (2) a550 (8) a
Tractor speed ( V ¯ t ) (km/h)’7.3 (0.03) a3.6 (0.13) b3.4 (0.06) c
Engine Power ( P ¯ e ) (kW)’66.1 (6.0) a29.1 (1.3) b69.0 (2.4) a
Hourly Fuel Consumption f ¯ ) (L h−1)16.6 (1.4) a7.8 (0.3) b16.6 (0.6) a
Combined 24.4
Disclaimer/Publisher’s Note: The statements, opinions and data contained in all publications are solely those of the individual author(s) and contributor(s) and not of MDPI and/or the editor(s). MDPI and/or the editor(s) disclaim responsibility for any injury to people or property resulting from any ideas, methods, instructions or products referred to in the content.

