Article

Introgression of Seedling Plant Resistance to Leaf Rust from Agropyron cristatum into Wheat by Induced Homoeologous Recombination

by
Adoración Cabrera
1,*,
Rafael Porras
2,
Carmen Palomino
1 and
Josefina Carmen Sillero
2
1
Departamento de Genética, Escuela Técnica Superior de Ingeniería Agronómica y de Montes, Edificio Gregor Mendel, Campus de Rabanales, Universidad de Córdoba, CeiA3, 14071 Córdoba, Spain
2
Instituto de Investigación y Formación Agraria y Pesquera, (IFAPA) Alameda del Obispo, Area of Plant Breeding and Biotechnology, Avda. Menéndez Pidal s/n, 14004 Córdoba, Spain
*
Author to whom correspondence should be addressed.
Agronomy 2023, 13(2), 334; https://doi.org/10.3390/agronomy13020334
Submission received: 19 December 2022 / Revised: 17 January 2023 / Accepted: 20 January 2023 / Published: 24 January 2023
(This article belongs to the Special Issue Modern Biotechnologies and Improvement Breeding for Cereals Crop)

Abstract

:
Agropyron cristatum (P genome) is a Triticeae species from the wheat tertiary gene pool which has economic importance as forage and also displays traits beneficial to wheat. Resistance to leaf rust was previously mapped to the short arm of chromosome 1P (1PS) in A. cristatum by the development of a compensating Robertsonian translocation involving chromosome arm 1PS and the long arm of wheat chromosome 1B (1BL). In this study, chromosome arm 1PS was engineered using the ph1b mutation to induce 1BS/1PS homoeologous recombination and to obtain new translocations with shortened fragments of chromosome arm 1PS. Two translocations with different alien fragment sizes were identified by genomic in situ hybridization, wheat 1BS- and 1PS-specific molecular markers and gene-specific markers for glutenin, Glu-B3 and gliadin Gli-B1 seed storage protein. One translocation (called type 1) replaces a proximal segment of 1PS chromatin, and the other (called type 2) replaces a distal 1PS segment and introduces the Glu-B3 and Gli-B1 wheat storage protein loci. Six specific EST-STS markers for chromosome arm 1PS amplified PCR products in the recombinant type 2 translocation line. Resistance analysis showed that the type 2 translocation was highly resistant to a virulent race of leaf rust pathogen. The new wheat–A. cristatum translocations obtained yield material with seedling plant resistance to leaf rust and seed storage protein loci.

1. Introduction

Wheat (Triticum aestivum L., 2n = 6x = 42, AABBDD) is one of the leading food crops, providing approximately 20% of all food calories consumed by humans worldwide. The rapidly growing human population requires an increased wheat yield to meet their rising food demand, without compromising the environment [1]. On the other hand, wheat yields are limited by both biotic stresses, mainly those caused by fungal pathogens, and abiotic stresses, such as drought, and other extreme weather events. In particular, fungal diseases cause yield losses of over 20% on average [2]; it has been suggested that cereal rusts are the main biotic constraint on wheat, causing major yield losses globally [3]. In this context, plant breeders are continuously trying to incorporate new resistance traits into new cultivars by using the genetic diversity of domesticated wheat and its related species as a sustainable and nonchemical approach to tackle wheat diseases in the short- and long-term [4].
Leaf rust (also known as brown rust), caused by the biotrophic fungus Puccinia triticina Erikss., is one of the most widespread and harmful rusts of wheat worldwide, its outbreaks being both more frequent and more widespread than those of other rusts [5]. Numerous genes for resistance to P. triticina have been isolated, identified and named Lr genes [6]. Unfortunately, most of these genes introgressed into commercially bread cultivars and have become ineffective due to the emergence of new virulent strains of the pathogen [5,7]. Therefore, screening for new sources of genetic resistance is essential to increase the genetic variability in wheat. Crested wheatgrass (Agropyron cristatum L. Gaertn.) is a Triticeae species included in the tertiary wheat gene pool with diploid (2n = 2x = 14), tetraploid (2n = 4x = 28) and hexaploid (2n = 6x = 42) forms, all based on the P genome [8]. This species is widely cultivated in North America as a forage crop [9] and has already been considered as a valuable donor of important agronomic traits for wheat improvement. In particular, traits that it displays that might be beneficial to wheat include resistance to diseases such as leaf rust [10,11,12], stripe rust [13] and powdery mildew [14,15], as well as tolerance to drought [16], salt [17] and low temperatures [18]. Genes controlling grain hardness [19] and vernalization response [20] have been also identified in A. cristatum.
Introgression of favourable alien genes is accompanied by the replacement of large chromosome segments of wheat by an alien chromosome segment. The size of the introgression segment needs to be reduced to minimize undesired effects caused by linkage drag. In particular, the development of wheat–alien recombinants with small alien segments should be able to substantially decrease linkage drag, and thus, increase the use of alien introgressions in wheat breeding programmes. In common wheat, pairing between homologous chromosomes is controlled by the Ph1b gene, mapped on the long arm of chromosome 5B [21,22]. Deletion mutants of the Ph1b locus have been developed [22,23] and used to induce pairing and recombination between the alien chromatin and its homoeologous counterpart, leading to the introgression of important genes from wild relatives of wheat [24,25].
In a previous study we developed a wheat line which carries a Robertsonian translocation involving the long arm of wheat chromosome 1B and the short arm of A. cristatum chromosome 1P that confers partial resistance to P. triticina [10]. The A. cristatum chromosome arm 1PS translocated into wheat replaces the short arm of wheat chromosome 1B which carries several loci encoding the gluten fraction of the storage proteins [26]. Unfortunately, the loss of the low molecular weight glutenins (encoded by the Glu-B3 locus) in the wheat and the related gliadins (encoded by the Gli-B1 locus) located in the distal region of chromosome arm 1BS was associated with a reduced dough strength [27]. The objectives of this study were (1) to induce homoeologous recombination between chromosome arms 1BS and 1PS involved in the wheat–A. cristatum 1PS·1BL translocation using the ph1b mutant, (2) to identify 1BS/1PS recombinant lines using both molecular markers and in situ hybridization and (3) to select recombinants carrying Glu-B3/Gli-B1 loci displaying resistance to leaf rust conferred by A. cristatum.

2. Materials and Methods

2.1. Plant Material

The plant material used in this study included a stable fertile wheat line (called TH4) carrying the aforementioned compensating Robertsonian translocation involving common wheat chromosome arm 1BL and A. cristatum chromosome arm 1PS which confers resistance to leaf rust [10]. The TH4 line was pollinated with the T. aestivum Chinese Spring (CS) ph1b mutant (CS ph1b mutant) [22] and the F1 was backcrossed with the same mutant. The BC1F1 progeny was selfed to obtain BC1F2, BC1F3 and BC1F4 progenies. The CS common wheat (2n = 6x = 42, AABBDD), the A. cristatum accession PI 222957 (2n = 4x = 28; PPPP) used to obtain TH4 line, the TH4 line, the CS/A. cristatum disomic addition line 1P (CS + 1P) and the ditelosomic addition line 1PS (CS + 1PS) [28] were used for chromosome arm location of the expressed sequence tag-sequence-tagged site (EST-STS) molecular markers.

2.2. DNA Markers Analysis

Genomic DNA was extracted from young frozen 3- or 4-leaf stage leaves using the cetyltrimethylammonium bromide method [29]. Samples were stored at −20 °C until PCR amplification was carried out. A Nano-Drop 1000 Spectrophotometer (Thermo Scientific, Waltham, MA, USA) was used to estimate the concentration of DNA in each sample. Twenty-eight A. cristatum EST-STS markers specific for A. cristatum chromosome 1P [30] were screened for polymorphism between CS common wheat and the TH4 line (Supplementary Table S1).
PCR was performed using a TGradient thermocycler (Biometra, Göttingen, Germany) with 40 ng of template DNA in 25 µL of reaction mixture containing 1× Buffer, 1.5 mM of MgCl2, 0.32 mM of dNTPs, 0.48 µM of each primer and 0.625 U of Taq DNA Polymerase (Promega, Madison, WI, USA). PCR conditions for these markers were as follows: 4 min at 94 °C followed by 35 cycles of 45 s at 94 °C, 50 s at 58 °C, then 50 s at 72 °C followed by a final extension of 72 °C for 7 min. The PCR products were electrophoretically separated in 2% agarose gel and visualized by ethidium bromide (EtBr) staining.
In addition, for genotyping, we used 18 wheat chromosome 1BS-specific single sequence repeats (SSRs) markers (Supplementary Table S2) [31,32,33,34,35,36,37,38], three gene-specific PCR markers for low molecular weight glutenin subunits Glu-B3a, Glu-B3b and Glu-B3c [33] and a Xpsp3000-specific STS marker for detecting the gliadin Gli-B1 gene [34,35]. Primer sequences and PCR conditions for all markers were taken from the references cited in Supplementary Table S2.
The absence of Ph1b was verified using a PCR assay described by Wang et al. [39]. Each 30 μL PCR sample contained 1× PCR buffer with MgCl2 (Bioline USA, Taunton, MA, USA), 0.25 mM of dNTP, 0.17 μM of primers, 0.02 U/μL of Taq DNA polymerase (Bioline USA) and 20 ng of template. The reaction was first denatured (94 °C/5 min) and then subjected to 35 cycles of 94 °C/60 s, 51 °C/60 s and 72 °C/60 s, followed by a final extension (72 °C/7 min). The PCR products were electrophoretically separated through a 1% agarose gel and visualized by EtBr staining.

2.3. Fluorescence In Situ Hybridization

Somatic chromosome spreads were prepared from root tip cells. Seeds were germinated on moistened filter paper in a glass Petri dish at 25 °C in the dark for 3–4 days. Root tips from germinating seeds were excised and treated in ice water for 24 h and then fixed in a freshly prepared ethanol–acetic acid solution (3:1 v/v) and stored at 4 °C for at least 1 month. The in situ hybridization protocol was carried out as described by Cabrera et al. [40]. Genomic DNA from A. cristatum and the pTa71 sequence containing one unit of 18S-5.8S-26S rDNA (8.9 Kb) from T. aestivum [41] were used as probes. Total genomic DNA of A. cristatum was labelled with biotin-16-dUTP (Boehringer Mannheim Biochemicals, Mannheim, Germany) and the pTa71 sequence was labelled with digoxigenin-11-dUTP (Roche Applied Science, Indianapolis, IN, USA), in both cases using nick translation. Chromosome preparations were hybridized with an A. cristatum genomic DNA probe or simultaneously with both pTa71 and A. cristatum genomic DNA probes. The final concentration of each probe was 5 ng/μL in the hybridization mix (50% formamide, 2× saline-sodium citrate, 5 ng of each digoxigenin and biotin-labelled probes, 10% dextran sulfate, 0.14 μg of yeast tRNA, 0.1 μg of sonicated salmon sperm DNA and 5 ng of glycogen). Post-hybridization washes were conducted twice with 2× saline-sodium citrate (5 min each) at 37 °C plus one extra wash in 1× saline-sodium citrate at room temperature. Biotin- and digoxigenin-labelled probes were detected with streptavidin-Cy3 conjugates (Sigma, St. Louis, MO, USA) and antidigoxigenin fluorescein isothiocyanate antibodies (Roche Diagnostics, Meylan, France), respectively. The chromosomes were counterstained with 4′,6-diamidino-2-phenylindole (DAPI) and mounted in Vectashield mounting medium (Vector Laboratories, Burlingame, CA, USA). Hybridization signals were visualized using a Leica DMRB epifluorescence microscope, the images were captured with a Leica DFC7000T camera equipped with a Leica Wild MPS 52 exposure meter and the images were processed with LEICA application suite version 4.0 (Leica, Munich, Germany).

2.4. Evaluation of Leaf Rust Resistance

The resistance response of TH4 translocation line, CS wheat and BC1F4 genotypes (see Section 2.1) were tested against a local isolate of leaf rust under controlled conditions in growth chambers. The bread wheat variety Califa Sur was included as the reference susceptible control of the disease.

2.5. Fungal Material

The rust isolate of P. triticina used in this experiment was collected in a naturally infected field at Santaella (Córdoba, Spain). The isolate was multiplied under controlled conditions on uninfected plants of the susceptible variety, Califa Sur. Then, a single-pustule isolate was obtained and multiplied to be used in this study. This isolate showed virulence/avirulence on the following Lr genes: Lr1, Lr2c, Lr3, Lr3bg, Lr3ka, Lr10, Lr11, Lr12, Lr14a, Lr14b, Lr18, Lr20, Lr22a, Lr23, Lr30, Lr33, Lr34, Lr35, Lr37, Lr45, LrB/Lr2a, Lr2b, Lr9, Lr13, Lr15, Lr16, Lr17, Lr19, Lr21, Lr24, Lr25, Lr26, Lr28, Lr32, Lr36 and LrW.

2.6. Inoculation Assays

Inoculation was carried out as described by Porras et al. [42] with minor modifications. Seeds from TH4, CS and BC1F4 genotypes, together with Califa Sur as the susceptible control, were sown in 30 × 20 × 7 cm3 trays with a mix of commercial compost and sand (1:1 v/v). Trays were maintained in growth chambers at 21 °C with a 14 h photoperiod for 21 days. When the third leaf of the plants had fully unfolded, these leaves were fixed on cork pedestals with metal clips (21 leaves in total). Each tray was inoculated with 4 mg of leaf rust spores mixed with pure talc (1:20 w/w) using a settling tower for uniform inoculation, leading to a spore deposition of approximately 300 spores per cm2. Plants were then incubated in a moisture chamber at 21 °C and 100% relative humidity in darkness for 24 h. Finally, plants were transferred to growth chambers for 9 days under the controlled conditions described above. Each genotype was tested in three plants per repetition and tray. Macroscopic and microscopic experiments were performed three times each, displaying similar results among repetitions.

2.7. Characterization of Macroscopic Components of Resistance

Five days post inoculation, 3 cm long segments were marked before the appearance of pustules. Then, the number of visible pustules breaking the leaf epidermis in the marked segments was recorded at different time intervals. The latency period (LP50) was recorded as the number of hours from the day of inoculation to the time at which 50% of the pustules had broken through the leaf epidermis. In addition, the third leaf of each plant fixed on cork pedestals was detached, placed on black sheets of cardboard and digitally scanned at a resolution of 1200 ppi at 9 days post inoculation, when no new uredinia appeared on the leaf epidermis according to Porras et al. [42]. Fiji image analysis software [43] was used for analysing 2.5 cm2 of three leaves per accession. Three macroscopical parameters were recorded: infection type (IT), infection frequency (IF, expressed as pustules/cm2) and pustule size (PS, in mm2). The IT of scanned leaves was classified on a scale of 0 to 9 [44], where 0 = no visible disease symptoms (immune), 1 = minor chlorotic and necrotic flecks, 2 = chlorotic and necrotic flecks without sporulation, 3–4 = chlorotic and necrotic areas with limited sporulation, 5–6 = chlorotic and necrotic areas with moderate sporulation, 7 = abundant sporulation with moderate chlorosis and 8–9 = abundant and dense sporulation without notable chlorosis and necrosis. ITs between 7 and 9 indicated a compatible interaction (sporulating uredinia with little or no chlorosis), whereas ITs from 0 to 6 indicated an incompatible interaction (from no visible symptoms and chlorotic and necrotic flecks to uredinia surrounded by smaller areas of chlorosis or necrosis compared to a compatible interaction). The IT value was recorded for each accession. Occasionally, in some colonies, the plant’s resistance response was overcome by the pathogen. This secondary IT value was observed at a low frequency and was indicated in brackets after the main IT score. The mean relative latency period (RLP), relative infection frequency (RIF) and relative pustule size (RPS) values were calculated and expressed as percentages relative to the values obtained in Califa Sur (=100%) for each replicate.

2.8. Characterization of Microscopic Components of Resistance

Central leaf segments (~6 cm) of the third leaves placed on cork pedestals, as mentioned above, were cut at 5 days post inoculation. Samples were processed as described by Porras et al. [42] and then examined under a Nikon epifluorescence microscope equipped with a V-2A excitation filter (380–420 nm, barrier filter 430 nm). Both fungal development and the associated plant responses were classified as in Soleiman et al. [45]. Spores developing a substomatal vesicle, a primary infection hypha and no more than six haustorial mother cells were considered early aborted infection units (EA), whereas spores which finally developed more than six haustorial mother cells were considered established infection units (EST). In addition, the presence (+) or absence (−) of plant cell responses to infection in the form of necrosis were recorded. Together, these assessments yielded a fungal stage of EA−, EA+, EST− or EST+. All these microscopic parameters were expressed as percentages of all infection units observed. A total of 120 to 150 infection units in three leaves per accession were evaluated according to their development stage. Spores that failed to form an appressorium over a stoma were excluded. In addition, the infection unit length (L) and width (W) were measured using a micrometer for 30 established infection units in three leaves per accession. Using the geometric mean of L and W, the colony size was calculated as √ (1/4 × π × L × W) [46] and the relative colony size (RCS) was obtained by expressing the mean values relative to those in the susceptible control Califa Sur (=100%).

2.9. Statistical Analysis

The experiment was conducted using a random block design. Relative values were used for macroscopic and microscopic parameters, except for the percentages of microscopic infection units (EA−, EA+, EST− and EST+). Data were analyzed using analysis of variance and least significant difference tests. All groups had the same or similar variance, but data which did not show equal variances among genotypes (namely RIF data in macroscopic experiments and EA, EA+, EST and EST+ data in microscopic experiments) were transformed according to the formula y = √(x) for statistical analysis and back transformed for presentation. Data processing, statistical analysis and figures were performed and constructed using R software [47] and Fiji [43].

3. Results

3.1. Screening for Chromosome Arm 1PS-Specific Molecular Markers

A total of 28 EST-STS markers specific for chromosome 1P were tested for amplification on chromosome arm 1PS present in the 1PS·1BL translocation line (TH4) (Supplementary Table S1). Twenty-three (81.1%) out of twenty-eight markers amplified a product on the A. cristatum accession used to obtain the TH4 line, and of those, ten (35.7%) markers were polymorphic between wheat and A. cristatum. Of these ten markers, six amplified products on both disomic CS + 1P and 1PS·1BL translocation lines, indicating that they were located on chromosome arm 1PS (Supplementary Table S1).

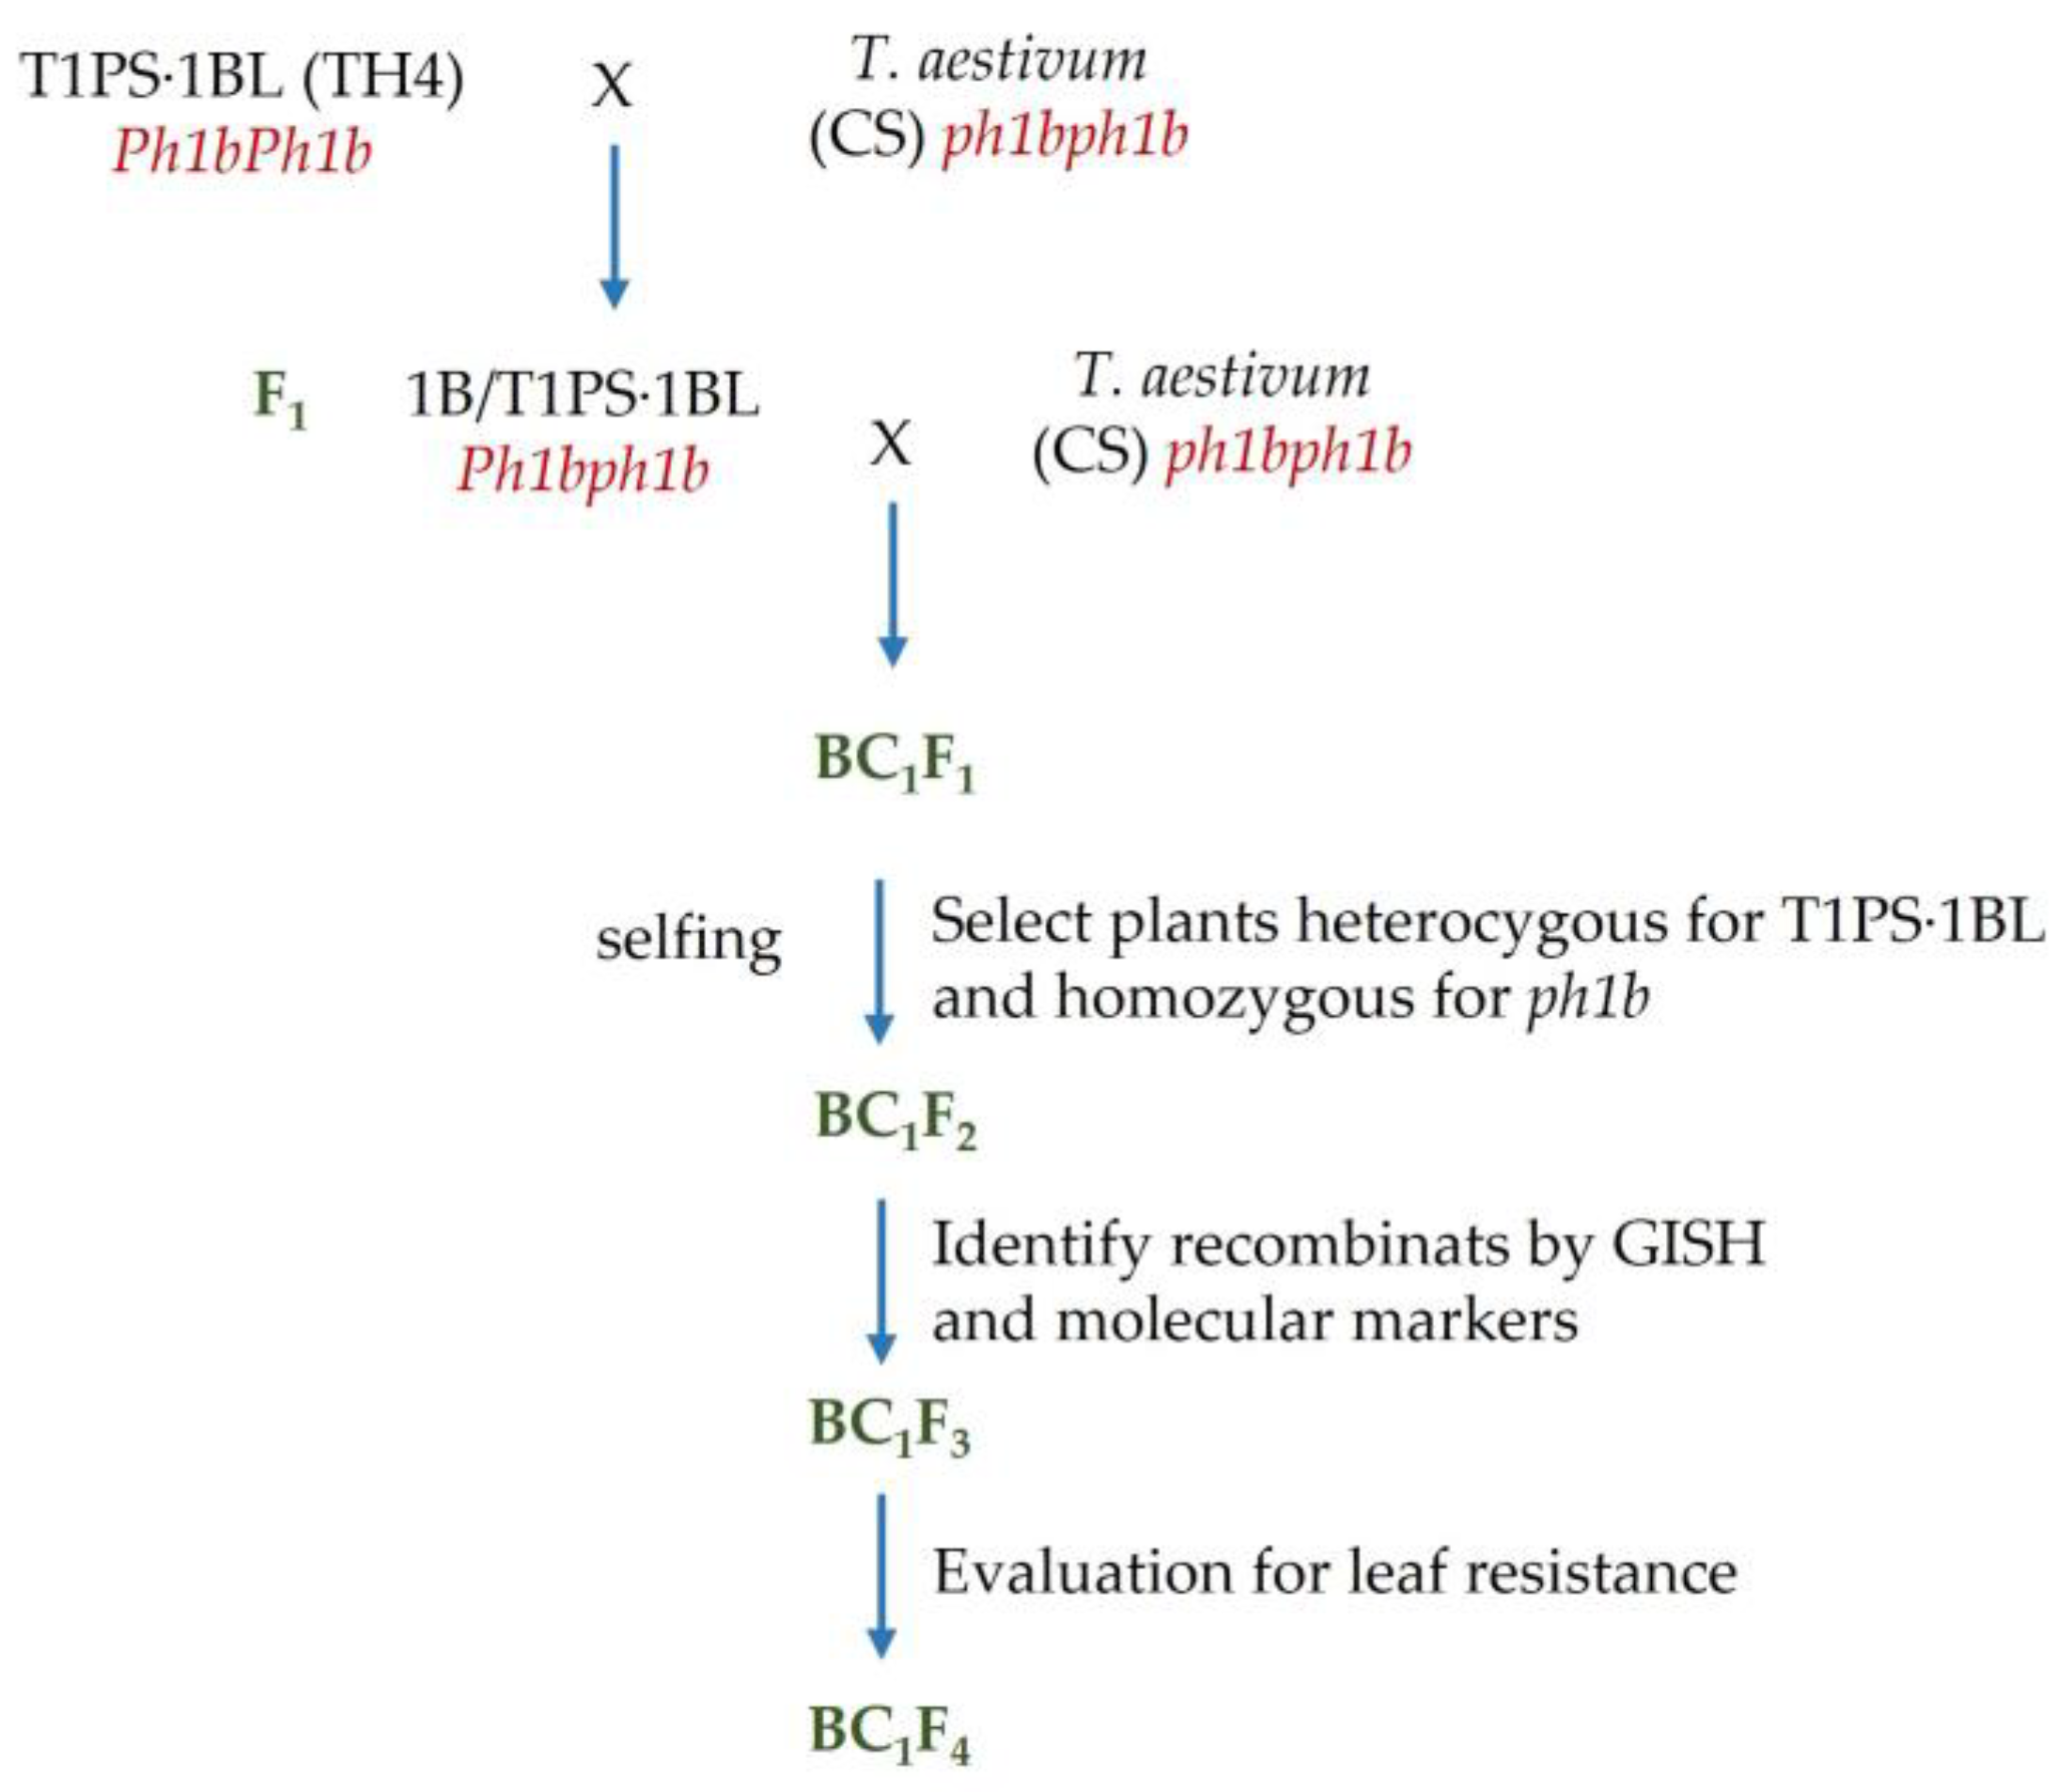
3.2. Identification of Individuals with a Single 1PS·1BL Translocation and Homozygous for the ph1b Mutation

The F1 hybrid progeny from the cross between the homozygous 1PS·1BL translocation line (TH4) and CS ph1b mutant were backcrossed to the ph1b mutant to establish individuals heterozygous for chromosome arms 1PS and 1BS in a ph1bph1b genetic background (Figure 1). The F1 hybrid progenies were genotyped by PCR using two 1PS specific markers to ensure that they retained chromosome arm 1PS (Supplementary Figure S1). A total of 71 BC1F1 plants were established, and of them, 35 (49.3%) contained the 1PS·1BL translocation.
Zygosity at the Ph1b locus was predicted using a PCR assay. The diagnostic ABC920 sequence characterized amplified region (SCAR) marker is present in CS and missing in the CS ph1b mutant, allowing the identification of homozygous ph1b genotypes [39]. The ABC920 marker was used to screen BC1F1 progeny to identify individuals with the ph1bph1b genotype. Among the 35 BC1F1 plants with a single 1PS·1BL chromosome, 17 (48.6%) were homozygous ph1bph1b (Supplementary Figure S2).

3.3. Wheat-A. cristatum Translocations Involving 1PS

The BC1F1 plants with a single 1PS·1BL chromosome and homozygous ph1bph1b were selfed, and a total of 91 BC1F2 plants were established. The BC1F2 plants were analyzed by both molecular markers and genomic in situ hybridization (GISH) to identify the induced wheat–A. cristatum recombinants. For molecular marker analysis, eighteen wheat chromosome 1BS-specific SSR markers were tested for polymorphisms between CS and TH4 genotypes and of those, seven (38.9%) markers were found to be polymorphic and amplified reliable products in CS wheat (Supplementary Table S2). Genetic characterization of BC1F2 plants was carried out using a total of fifteen molecular markers: the seven polymorphic 1BS-specific SSR markers, the gene-specific marker for low molecular weight glutenin subunit GS Glu-B3, the Xpsp3000-specific STS marker to detect gliadin gene and, finally, six chromosome 1PS-specific EST-STS markers (Supplementary Table S3).
Combining the results of PCR analysis and GISH (Figure 2, Supplementary Table S3), it was found that 12 (13.2%) BC1F2 plants were homozygous for the 1PS·1BL chromosome (Figure 2a), 36 plants (39.5%) were heterozygous for the 1PS·1BL translocation (Figure 2b) and 41 plants (45.1%) carried no introgression of the chromosome arm 1PS. Finally, two different (2.2%) 1BS/1PS recombinant plants were recovered. One of them contained a small 1PS terminal fragment in the heterozygous condition (called recombinant type 1) (Figure 2c). All 1BS-specific SSR markers amplified PCR products in this line. On the other hand, molecular marker analysis demonstrated that this plant did not carry the distal Glu-B3a and Gli-B1 loci as demonstrated by the lack of amplification of the specific markers (Glu-B3a and Xpsp3000, respectively) for these loci (Figure 3, Supplementary Table S3). As the recombinant type 1 plant carried one 1PS·1BL chromosome in the heterozygous condition, all six specific EST-STS markers for chromosome arm 1PS amplified a PCR product in this plant. The second 1BS/1PS recombinant plant (called recombinant type 2) was homozygous for a 1PS proximal translocation (Figure 2d) and amplified specific markers for the Glu-B3a and Gli-B1 loci (Figure 3, Supplementary Table S3), indicating that it carried a distal fragment of chromosome arm 1BS. None of the 1BS-specific SSR markers amplified product in this line. The six specific EST-STS markers for chromosome arm 1PS amplified PCR products in this plant, indicating that the 1PS-specific markers were located on the proximal end of chromosome arm 1PS (Figure 2, Supplementary Table S3). PCR amplification profiles of both 1BS-specific and 1PS-specific markers on BC1F2 plants are shown in Figure 3.
By GISH and PCR analyses of the derived BC1F3 and BC1F4 plants, homozygous translocation lines for the 1PS proximal translocation carrying both the Glu-B3a and Gli-B1 loci were confirmed. Nonetheless, no homozygous plants were recovered for the recombinant type 1 in the BC1F3 and BC1F4 progenies. All lines obtained were fertile and vigorous. The spike morphology of BC1F4 plants carrying homozygous translocations from A. cristatum is shown in Figure 4.

3.4. Macroscopic Components of Resistance to Leaf Rust Infection

The macroscopic components of resistance to leaf rust observed are reported in Table 1. The BC1F4 lines evaluated were two lines homozygous for the 1PS·1BL translocation (BC1F4-15-10-2 and BC1F4-37-2-21), both carrying complete chromosome arm 1PS, one line homozygous for the 1PS proximal translocation carrying the Glu-B3a and Gli-B1 loci (recombinant type 2) (BC1F4-43-2-4) and one line with no introgression from A. cristatum (BC1F4-45-2-7). The macroscopic latency period (LP50) in the evaluated genotypes was calculated by assessing (at regular intervals in vivo) the emergence of new pustules on the leaf epidermis. The LP50 measurements were expressed relative to Califa Sur, as the susceptible control, with an RLP of 100%. Only the BC1F4-45-2-7 line showed a shorter latency period than Califa Sur, with an RLP value of 94.92%.
The remaining lines showed significantly higher RLPs values than the susceptible control. Once leaves had been detached and scanned, the macroscopic parameters of interest (IT, RIF and RPS) were measured. Three genotypes showed a fully compatible infection, displaying an IT of 9 (the susceptible control Califa Sur, CS and the BC1F4-45-2-7 line) (Figure 5a,b,g). The TH4 line showed a partially susceptible reaction with an IT of 6(9) (Figure 5c), characterized by the appearance of pustules surrounded by chlorosis. The recombinant type 2 line (BC1F4-43-2-4) had an IT similar to that of the TH4 line, with more necrotic flecks (IT 5(6)) (Figure 5f). Both the BC1F4-15-10-2 and BC1F4-37-2-21 lines, which carry the homozygous 1PS·1BL translocation, presented an IT of 2(6) (Figure 5d,e), characterized by necrotic flecks with a few pustules which were surrounded by chlorosis. Regarding RIF values, CS and BC1F4-45-2-7 showed the highest values compared to Califa Sur. In contrast, TH4, BC1F4-43-2-4, BC1F4-37-2-21 and BC1F4-15-10-2 lines expressed significantly lower values of infection frequency than the susceptible check. Finally, similarly to RIF, RPS values were high in CS and BC1F4-45-2-7 lines. The other lines expressed significantly lower RPS values than the susceptible control, the lowest RPS value being observed in the TH4 line (33.48%).

3.5. Microscopic Components of Resistance to Leaf Rust Infection

The microscopic components of resistance were assessed based on studying the infection sites, classified according to their fungal development stage. At 5 days post inoculation, we calculated the percentage of EA colonies and EST colonies, recording the presence or absence of plant cell necrosis at each stage (EA−, EA+, EST− and EST+), as well as measuring the RCS. Mean percentages of each fungal stage among all the infection sites observed in the genotypes evaluated are shown in Table 2 and Figure 6. Concerning the microscopic RCS, measurements were expressed relative to the colony size of the susceptible control, Califa Sur (RCS = 100%). The highest RCS values were observed in CS followed by the BC1F4-45-2-7 line. The other genotypes displayed significantly smaller colonies than the control, with those formed on the TH4 line being the smallest. Regarding the total percentage of EA (regardless of the presence of host cell necrosis), the highest values were observed in the TH4 line, followed by the BC1F4-37-2-21 and BC1F4-15-10-2 lines. By contrast, the susceptible control Califa Sur displayed the lowest percentage of EA colonies, not significantly different to the percentages observed in CS and both BC1F4-43-2-4 and BC1F4-45-2-7 lines. Logically, the overall percentages of EST colonies displayed the opposite trend, the lowest values being observed in the genotypes with the highest EA percentages. The susceptible control Califa Sur showed the highest EST percentage, with 90.53% of the colonies being successfully established.
Data on the presence or absence of plant cell necrosis are presented in Figure 6. The percentage of EA colonies not associated with necrotic cells (EA−) was significantly higher in the TH4 line (46.78%) than in the other genotypes (ranging from 1.03 to 6.58%, with non-significant differences between genotypes). On the other hand, the percentages of EA colonies associated with necrotic cells (EA+) were significantly higher in the BC1F4-37-2-21 and BC1F4-15-10-2 lines (28.33 and 25.67%, respectively) than in the other studied lines. The lines BC1F4-43-2-4 and BC1F4-45-2-7 also had higher percentages of EA+ (13.66 and 13.07%, respectively) than the susceptible control Califa Sur and both CS and TH4 (4.90%, 5.17% and 5.75%, respectively).
The highest percentages of EST not associated with host cell necrosis (EST−, Figure 7A), were found in the susceptible control Califa Sur (90.43%) and CS (87.42%). This parameter was also significantly higher in both the BC1F4-43-2-4 (50.88%) and TH4 (47.47%) lines than in the other lines. Finally, the percentages of EST colonies associated with necrotic plant cells (EST+, Figure 7B) were significantly higher in the BC1F4-45-2-7 (58.15%), BC1F4-37-2-21 (55.78%) and BC1F4-15-10-2 (48.56%) lines, followed by the BC1F4-43-2-4 (32.30%) line. None or very few (from 0.0% to 0.83%) of the EST colonies in the CS wheat, TH4 line and the control Califa Sur were associated with necrotic cells.

4. Discussion

A. cristatum is a valuable donor of genes and many germplasm resources have been developed to use the variability present in this species in wheat breeding [48,49,50,51,52,53]. Previously, we mapped leaf resistance gene(s) from A. cristatum on the chromosome arm 1PS in a wheat–A. cristatum introgression line called TH4 [10]. A possible negative effect of the 1PS·1BL translocation may be a reduction in the number of the gluten-encoding loci (low molecular weight glutenins and gliadins encoded by the Glu-B3 and the Gli-B1 loci, respectively) and the resulting reduced dough strength in the A. cristatum–wheat translocation line. In the current study, the chromosome arm 1PS from A. cristatum was engineered by using the ph1b mutation to induce homoeologous recombination of 1BS/1PS and to introduce a distal segment of wheat with the wheat Glu-B3/Gli-B1 loci without losing the resistance against leaf rust from A. cristatum.
The Glu-B3a, Xpsp3000 and Xwmc798 markers were physically mapped to deletion bin 5_1BS.sat18-0.50-1.00 [32]. The amplification of both Glu-B3a and Xpsp3000 markers, but not the Xwmc798 marker, in the recombinant type 2 plant indicated that the breakpoint in this wheat–A. cristatum recombinant line was located in bin 5. Similarly, the Xwmc798 marker amplified product in recombinant type 1 plant, but neither the Glu-B3a nor the Xpsp3000 markers did, indicating that the breakpoint in this wheat–A. cristatum recombinant was also in bin 5. These results agree with the findings of a previous study [54], which showed that translocation break points between homoeologous chromosomes are mostly concentrated in the distal parts of the chromosomes.
The production of new recombinants between chromosome arm 1PS from A. cristatum and chromosome arm 1BS from wheat suggests that synteny is conserved between these two homoeologous chromosome arms. This result is consistent with previous findings which showed that synteny is conserved between A. cristatum and wheat genomes. For example, a high transferability of conserved orthologous set molecular markers has been found between wheat and A. cristatum [14,55] and a high sequence similarity between wheat and A. cristatum genes has been reported by sequencing the transcriptome of A. cristatum [56]. Synteny between A. cristatum and wheat has also been found by mapping agronomically important genes [19,20] and FISH with tandem repeats and wheat single-gene probes [57].
Species belonging to the grass tribe Triticeae represent a valuable reservoir of genes for the improvement of resistance to disease, tolerance to adverse environmental conditions or quality characteristics in wheat. The main sources of new genetic variants are species of the primary and secondary gene pools of wheat (see [24,25] for a review) but the tertiary wheat gene pool also includes species which have been successfully used in wheat breeding.
One of the best examples of introgression of chromatin from a species belonging to the tertiary gene pool in wheat is the 1RS·1BL translocation. The 1RS chromosome from rye (Secale cereale L.) carries several genes providing race-specific disease resistance to major rust diseases [58]. Nonetheless, the 1RS translocation was found to negatively affect bread wheat end-use quality in terms of poor gluten strength [27]. A recombinant wheat–rye chromosome was engineered using induced homoeologous recombination that contained two small intercalary insertions, the desired Gli-B1 + Glu-B3 alleles and the resistance genes from rye [59]. Other examples of Ph1b-induced homoeologous recombination successfully used for the introgression into common wheat background of resistant genes from the tertiary gene pool of wheat are the introgression of resistance to stem rust from Aegilops geniculata [60], Thinopyrum ponticum [61] and Dasypyrum villosum [62]; powdery mildew from D. villosum [63] and Triticum timopheevii [64]; wheat yellow mosaic virus from D. villosum [65]; and Th. intermedium [66] and fusarium head blight from Th. elongatum [67].
The assessment of macro- and microscopic components of resistance to P. triticina showed diverse disease infection patterns amongst the studied genotypes. Firstly, there were genotypes with a clear susceptible response to leaf rust that showed similar values to the susceptible control Califa Sur in various infection parameters. The CS common wheat and BC1F4-45-2-7 line, which did not carry introgressions from A. cristatum, showed this susceptible response due to their values of macroscopic parameters IT (9), IF, PS and LP50 being close to those of Califa Sur. Moreover, these two genotypes also expressed similar values to the Califa Sur for microscopic parameters (RCS, EA and EST), though it should be noted that the BC1F4-45-2-7 line had higher EST+ values than both CS and Califa Sur, even though this hypersensitive reaction was not strong enough to prevent the fungal colonization of plant tissues according to final IT and IF values at 9 days post inoculation.
By contrast, the other lines, all of which carried introgressions from A. cristatum, developed some patterns of resistance against leaf rust disease. The TH4 parental line showed low values of IF and PS compared to Califa Sur, which is in line with the low disease severity value reported by Ochoa et al. [10] and was consistent with a partial resistance response. In addition, the long LP50 value found in the TH4 line in this study, together with a low RCS value (microscopic component) and a significantly higher EA- value (prehaustorial component of resistance [46,68,69]), confirmed the partial resistance of the TH4 line.
Both BC1F4-15-10-2 and BC1F4-37-2-21 lines developed lower IF and PS values than Califa Sur and, even lower IF and IT values than the TH4 line. GISH analysis showed that, similar to the TH4 parental line, these two BC1F4 lines carry the 1PS·1BL translocation from A. cristatum, which explains the resistant response to the leaf rust infection displayed by these two lines. On the other hand, in microscopic terms, both BC1F4-15-10-2 and BC1F4-37-2-21 lines showed higher RCS and EST values, together with significantly different EA+ and EST+ values from those of the TH4 line, indicating that both lines displayed mainly a hypersensitive resistance (HR) response. These results suggest a possible change in the type of resistance in these two lines compared with their parental line TH4. The different type of resistance displayed by the TH4 parental line compared with that of the two derived BC1F4 lines could be due to wheat genes also involved in the resistance to leaf rust. We cannot rule out the possibility that wheat genes affecting resistance could be segregating in BC1F4 progenies. This could explain why the BC1F4-15-10-2 and BC1F4-37-2-21 lines showed elevated values in components of resistance which expressed an HR response (EA+ and EST+), a characteristic of posthaustorial resistance [70], compared to their parental line, TH4, which expressed components more related to prehaustorial resistance [46,71].
Finally, the recombinant type 2 line (BC1F4-43-2-4), which contains a proximal segment of chromosome arm 1PS from A. cristatum and a distal segment of wheat chromosome arm 1BS containing the Glu-B3a/Gli-B1 loci, showed a resistance response to leaf rust infection, indicating that gene(s) controlling the resistance to leaf rust are in the proximal region of the chromosome arm 1PS. All six A. cristatum molecular markers mapped on chromosome arm 1PS amplified a product in the recombinant type 2 line (BC1F4-43-2-4), showing that these markers were physically located in the proximal segment of this chromosome arm.
Nevertheless, the resistance displayed by the recombinant type 2 line was different to that shown by the TH4 parental line and somewhat similar to the resistance exhibited by the BC1F4-15-10-2 and BC1F4-37-2-21 lines regarding the components of resistance studied. The recombinant type 2 line showed macroscopic components similar to those of the TH4 line in the case of IF and PS, but not in LP50 or IT values. At the microscopic level, this IT value could correspond to the higher RCS observed in the BC1F4-43-2-4 line, which means greater development of necrotic lesions compared to in the TH4 line. The other microscopic results of line BC1F4-43-2-4 indicated, firstly, that there was a higher percentage of EST colonies and, secondly, that a substantially higher fraction of these EST colonies had a HR comparable with that of the TH4 line. This may mean that there was greater fungal development (RCS) before these colonies were enclosed by HR, which would indicate a delayed expression of this HR that that might be defined by spatiotemporal analyses [72,73].

5. Conclusions

In the present study, we have demonstrated the usefulness of the ph1b mutation for inducing recombination between the wheat chromosome arms 1BS and 1PS from A. cristatum. Decreasing the segment size allowed the introgression of resistance against leaf rust from A. cristatum without the loss of wheat Glu-B3/Gli-B1 loci. The new recombinant plants were fertile and vigorous. The genetic stock developed in this work may add an accessible source of leaf resistance gene(s) to the wheat gene pool without the loss of important genes controlling quality characteristics.

Supplementary Materials

The following supporting information can be downloaded at: https://www.mdpi.com/article/10.3390/agronomy13020334/s1, Figure S1: Electrophoretic patterns of 1PS-specific EST-STS markers Agc29588 (a) and Agc69174 (b) in parts of BC1F1 progenies derived from T1PS·1BL/CS ph1b//CS ph1b. Black arrows show specific bands of 1PS; M, Marker; CS, Chinese Spring, T1PS·1BL translocation line (TH4); Ac, Agropyron cristatum, 1–15, part of plants in the BC1F1 population; Figure S2: Genotypic assays for the presence of Ph1. The absence of Ph1b is marked by the ABC920 SCAR marker (individuals 1, 2, 3 and 4). M: size marker; CS: Triticum aestivum cv Chinese Spring; Ph1b+: wild-type wheat CS; ph1b−: the parental ph1 mutant; Table S1: EST-STS markers specific for chromosome 1P from A. cristatum used in this study; Table S2: Molecular markers used to detect wheat 1BS chromosome arm; Table S3: Genetic characterization of BC1F2 plants using both 1BS and 1PS specific chromosome markers. 1BS/1PS recombination events are indicated as recombinant type 1 and type 2, respectively.

Author Contributions

Conceptualization, A.C. and J.C.S.; methodology, A.C., J.C.S., C.P. and R.P.; formal analysis, C.P. and R.P.; investigation, A.C. and J.C.S.; writing—original draft preparation, A.C., R.P. and J.C.S.; writing—review and editing, A.C.; funding acquisition, A.C. All authors have read and agreed to the published version of the manuscript.

Funding

This research was funded by the Spanish State Research Agency (Spanish Ministry of Science and Innovation), co-financed by the European Regional Development Fund (FEDER) from the European Union, grant numbers RTI2018-093367-B-I00 and PID2021-122530OB-I00.

Data Availability Statement

The datasets generated and/or analyzed during the current study are available in the manuscript text and/or Supplementary Materials.

Conflicts of Interest

The authors declare no conflict of interest.

References

  1. The Wheat Initiative. Available online: https://www.wheatinitiative.org/ (accessed on 1 June 2022).
  2. Savary, S.; Willocquet, L.; Pethybridge, S.J.; Esker, P.; McRoberts, N.; Nelson, A. The global burden of pathogens and pests on major food crops. Nat. Ecol. Evol. 2019, 3, 430–439. [Google Scholar] [CrossRef] [PubMed]
  3. Ellis, J.G.; Lagudah, E.S.; Spielmeyer, W.; Dodds, P.N. The past, present and future of breeding rust resistant wheat. Front. Plant Sci. 2014, 5, 641. [Google Scholar] [CrossRef] [PubMed] [Green Version]
  4. Pérez-Méndez, N.; Miguel-Rojas, C.; Jimenez-Berni, J.A.; Gomez-Candon, D.; Pérez-de-Luque, A.; Fereres, E.; Catala-Forner, M.; Villegas, D.; Sillero, J.C. Plant breeding and management strategies to minimize the impact of water scarcity and biotic stress in cereal crops under Mediterranean conditions. Agronomy 2022, 12, 75. [Google Scholar] [CrossRef]
  5. Huerta-Espino, J.; Singh, R.P.; Germán, S.; McCallum, B.D.; Park, R.F.; Chen, W.Q.; Bhardwaj, S.C.; Goyeau, H. Global status of wheat leaf rust caused by Puccinia triticina. Euphytica 2011, 179, 143–160. [Google Scholar] [CrossRef]
  6. McIntosh, R.; Dubcovsky, J.; Rogers, W.; Morris, C.; Appels, R.; Xia, X. Catalogue of gene symbols for wheat 2020 Supplement. 2017. Available online: https://wheat.pw.usda.gov/GG3/Wheat_Gene_Catalog_Documents (accessed on 11 June 2022).
  7. Omara, R.I.; Nehela, Y.; Mabrouk, O.I.; Elsharkawy, M.M. The emergence of new aggressive leaf rust races with the potential to supplant the resistance of wheat cultivars. Biology 2021, 10, 925. [Google Scholar] [CrossRef] [PubMed]
  8. Dewey, D.R. The genomic system of classification as a guide to intergeneric hybridization with the perennial Triticeae. In Gene Manipulation in Plant Improvement; Gustafson, J.P., Ed.; Springer: Boston, MA, USA, 1984; pp. 209–279. [Google Scholar]
  9. Asay, K.H.; Dewey, D.R.; Gomm, F.B.; Horton, W.H.; Jensen, K.B. Genetic progress through hybridization of induced and natural tetraploids in crested wheatgrass. J. Range Manag. 1986, 39, 261–263. [Google Scholar] [CrossRef]
  10. Ochoa, V.; Madrid, E.; Said, M.; Rubiales, D.; Cabrera, A. Molecular and cytogenetic characterization of a common wheat-Agropyron cristatum chromosome translocation conferring resistance to leaf rust. Euphytica 2015, 201, 89–95. [Google Scholar] [CrossRef]
  11. Jiang, B.; Liu, T.; Li, H.; Han, H.; Li, L.; Zhang, J.; Yang, X.; Zhou, S.; Li, X.; Liu, W. Physical mapping of a novel locus conferring leaf rust resistance on the long arm of Agropyron cristatum chromosome 2P. Front Plant Sci. 2018, 9, 817. [Google Scholar] [CrossRef] [Green Version]
  12. Ji, X.; Liu, T.; Xu, S.; Wang, Z.; Han, H.; Zhou, S.; Guo, B.; Zhang, J.; Yang, X.; Li, X.; et al. Comparative transcriptome analysis reveals the gene expression and regulatory characteristics of broad-spectrum immunity to leaf rust in a wheat-Agropyron cristatum 2P addition line. Int. J. Mol. Sci. 2022, 23, 7330. [Google Scholar] [CrossRef]
  13. Zhang, Z.; Song, L.; Han, H.; Zhou, S.; Zhang, J.; Yang, X.; Li, X.; Liu, W.; Li, L. Physical localization of a locus from Agropyron cristatum conferring resistance to stripe rust in common wheat. Int. J. Mol. Sci. 2017, 18, 2403. [Google Scholar] [CrossRef]
  14. Copete, A.; Cabrera, A. Chromosomal location of genes for resistance to powdery mildew in Agropyron cristatum and mapping of conserved orthologous set molecular markers. Euphytica 2017, 213, 189. [Google Scholar] [CrossRef]
  15. Li, H.; Jiang, B.; Wang, J.; Lu, Y.; Zhang, J.; Pan, C.; Yang, X.; Li, X.; Liu, W.; Li, L. Mapping of novel powdery mildew resistance gene(s) from Agropyron cristatum chromosome 2P. Theor. Appl. Genet. 2017, 130, 109–121. [Google Scholar] [CrossRef] [PubMed]
  16. Bayat, H.; Nemati, H.; Tehranifar, A.; Gazanchian, A. Screening different crested wheatgrass (Agropyron cristatum (L.) Gaertner.) accessions for drought stress tolerance. Arch. Agron. Soil Sci. 2016, 62, 769–780. [Google Scholar] [CrossRef]
  17. Dewey, D.R. Breeding crested wheatgrass for salt tolerance. Crop Sci. 1962, 2, 403–407. [Google Scholar] [CrossRef]
  18. Limin, A.E.; Fowler, D.B. Cold hardiness of forage grasses grown on the Canadian prairies. Can, J. Plant Sci. 1987, 67, 1111–1115. [Google Scholar] [CrossRef]
  19. Cabrera, A.; Castellano, L.; Recio, R.; Alvarez, J.B. Chromosomal location and molecular characterization of three grain hardness genes in Agropyron cristatum. Euphytica 2019, 215, 165. [Google Scholar] [CrossRef]
  20. Cabrera, A.; Copete-Parada, A.; Madrid, E. Cloning and characterization of a putative orthologue of the wheat vernalization (VRN1) gene in perennial wheatgrass (Agropyron cristatum). Plant Breed. 2020, 139, 1290–1298. [Google Scholar] [CrossRef]
  21. Riley, R.; Chapman, V. Genetic control of the cytologically diploid behaviour of hexaploid wheat. Nature 1958, 182, 713–715. [Google Scholar] [CrossRef]
  22. Sears, E.R. An induced mutant with homoeologous pairing in common wheat. Can. J. Genet. Cytol. 1977, 19, 585–593. [Google Scholar] [CrossRef]
  23. Sears, E.R. A wheat mutation conditioning an intermediate level of homoeologous chromosome pairing. Can. J. Genet. Cytol. 1982, 24, 715–719. [Google Scholar] [CrossRef]
  24. Qi, L.; Friebe, B.; Zhang, P.; Gill, B.S. Homoeologous recombination, chromosome engineering and crop improvement. Chromosome Res. 2007, 15, 3–19. [Google Scholar] [CrossRef] [PubMed]
  25. Hao, M.; Zhang, L.; Ning, S.; Huang, L.; Yuan, Z.; Wu, B.; Yan, Z.; Dai, S.; Jiang, B.; Zheng, Y.; et al. The resurgence of introgression breeding, as exemplified in wheat improvement. Front Plant Sci. 2020, 6, 252. [Google Scholar] [CrossRef] [PubMed] [Green Version]
  26. Payne, P.I. Genetics of wheat storage proteins and the effects of allelic variation on bread-making quality. Annu. Rev. Plant Physiol. 1987, 38, 141–153. [Google Scholar] [CrossRef]
  27. Graybosch, R.A.; Peterson, C.J.; Hansen, L.E.; Worral, D.; Shelton, D.R. and Lukaszewski, A.J. Comparative flour quality and protein characteristics of 1BL/1RS and 1AL/1RSwheat-rye translocations. J. Cereal Sci. 1993, 17, 95–106. [Google Scholar] [CrossRef]
  28. Jubault, M.; Tanguy, A.M.; Abélard, P.; Coriton, O.; Dusautoir, J.C.; Jahier, J. Attempts to induce homoeologous pairing between wheat and Agropyron cristatum genomes. Genome 2006, 49, 190–193. [Google Scholar] [CrossRef]
  29. Murray, M.G.; Thompson, W.F. Rapid isolation of high molecular weight plant DNA. Nucleic Acid Res. 1980, 8, 4321–4325. [Google Scholar] [CrossRef] [PubMed] [Green Version]
  30. Zhang, J.; Liu, W.; Lu, Y.; Liu, Q.; Yang, X.; Li, X. A resource of large-scale molecular markers for monitoring Agropyron cristatum chromatin introgression in wheat background based on transcriptome sequences. Sci. Rep. 2017, 7, 11942. [Google Scholar] [CrossRef] [Green Version]
  31. Zhao, C.; Sun, H.; Guan, C.; Cui, J.; Zhang, Q.; Liu, M.; Zhang, M.; Guo, Q.; Hou, Y.; Xiang, M.; et al. Physical information of 2705 PCR-based molecular markers and the evaluation of their potential use in wheat. J. Genet. 2019, 98, 69. [Google Scholar] [CrossRef]
  32. Raats, D.; Frenkel, Z.; Krugman, T.; Dodek, I.; Sela, H.; Šimková, H.; Mage, F.; Cattonaro, F.; Vautrin, S.; Fahima, T.; et al. The physical map of wheat chromosome 1BS provides insights into its gene space organization and evolution. Genome Biol. 2013, 14, R138. [Google Scholar] [CrossRef]
  33. Wang, L.H.; Zhao, X.L.; He, Z.H.; Ma, W.; Appels, R.; Peña, R.J.; Xia, X.C. Characterization of low-molecular-weight glutenin subunit Glu-B3 genes and development of STS markers in common wheat (Triticum aestivum L.). Theor. Appl. Genet. 2009, 118, 525–539. [Google Scholar] [CrossRef]
  34. Devos, K.M.; Bryan, G.J.; Collins, A.J.; Stephenson, P.; Gale, M.D. Application of two microsatellite sequences in wheat storage proteins as molecular markers. Theor. Appl. Genet. 1995, 90, 247–252. [Google Scholar] [CrossRef] [PubMed]
  35. Howell, T.; Hale, I.; Jankuloski, L.; Bonafede, M.; Gilbert, M.; Dubcovsky, J. Mapping a region within the 1RS.1BL translocation in common wheat affecting grain yield and canopy water status. Theor. Appl. Genet. 2014, 127, 2695–2709. [Google Scholar] [CrossRef] [Green Version]
  36. Sourdille, P.; Singh, P.; Cadalen, T.; Brown-Guedira, G.L.; Gay, G.; Qi, L.; Gill, B.S.; Dufour, P.; Murigneux, A.; Bernard, M. Microsatellite-based deletion bin system for the establishment of genetic-physical map relationships in wheat (Triticum aestivum L.). Func. Integr. Genomics 2004, 4, 12–25. [Google Scholar] [CrossRef] [PubMed]
  37. Somers, D.J.; Isaac, P.; Edwards, K. A high-density microsatellite consensus map for bread wheat (Triticum aestivum L.). Theor. Appl. Genet. 2004, 109, 1105–1114. [Google Scholar] [CrossRef]
  38. Röder, M.S.; Korzun, V.; Wendehake, K.; Plaschle, J.; Tixier, M.H.; Leroy, P.; Ganal, M.W. A microsatellite map of wheat. Genetics 1998, 149, 2007–2023. [Google Scholar] [CrossRef] [PubMed]
  39. Wang, X.; Lai, J.; Liu, G.; Chen, F. Development of a Scar marker for the Ph1 locus in common wheat and its application. Crop Sci. 2002, 42, 1365–1368. [Google Scholar] [CrossRef]
  40. Cabrera, A.; Martin, A.; Barro, F. In-situ comparative mapping (ISCM) of Glu-1 loci in Triticum and Hordeum. Chromosome Res. 2002, 10, 49–54. [Google Scholar] [CrossRef]
  41. Gerlach, W.L.; Bedbrook, J.R. Cloning and characterization of ribosomal RNA genes from wheat and barley. Nucleic Acids Res. 1979, 7, 1869–1885. [Google Scholar] [CrossRef]
  42. Porras, R.; Miguel-Rojas, C.; Pérez-de-Luque, A.; Sillero, J.C. Macro- and microscopic characterization of components of resistance against Puccinia striiformis f. sp. tritici in a collection of Spanish bread wheat cultivars. Agronomy 2022, 12, 1239. [Google Scholar] [CrossRef]
  43. Schindelin, J.; Arganda-Carreras, I.; Frise, E.; Kaynig, V.; Longair, M.; Pietzsch, T.; Preibisch, S.; Rueden, C.; Saalfeld, S.; Schimid, B.; et al. Fiji: An open-source platform for biological-image analysis. Nat. Methods 2012, 9, 676–682. [Google Scholar] [CrossRef]
  44. McNeal, F.H.; Konzak, C.F.; Smith, E.P.; Tate, W.S.; Russell, T.S. A uniform system for recording and processing cereal research data. US Agric. Res. Serv. 1971, 42, 34–121. [Google Scholar]
  45. Soleiman, N.H.; Solis, I.; Sillero, J.C.; Herrera-Foesel, S.A.; Ammar, K.; Martínez, F. Evaluation of macroscopic and microscopic components of partial resistance to leaf rust in durum wheat. J. Phytopathol. 2014, 162, 359–366. [Google Scholar] [CrossRef]
  46. Rubiales, D.; Niks, R.E. Characterization of Lr34, a major gene conferring non hypersensitive resistance to wheat leaf rust. Plant Dis. 1995, 79, 1208–1212. [Google Scholar] [CrossRef]
  47. R Core Team. R: A Language and Environment for Statistical Computing; R Found. Stat. Comput.: Vienna, Austria, 2022; Available online: https://www.r-project.org/ (accessed on 1 April 2022).
  48. Chen, Q.; Jahier, J.; Cauderon, Y. Production and cytogenetic analysis of BC1, BC2 and BC3 progenies of an intergeneric hybrid between Triticum aestivum (L.) Thell. and tetraploid Agropyron cristatum (L.) Gaerth. Theor. Appl. Genet. 1992, 94, 698–703. [Google Scholar] [CrossRef]
  49. Martín, A.; Cabrera, A.; Esteban, E.; Hernández, P.; Ramírez, M.C.; Rubiales, D. A fertile amphiploid between diploid wheat (Triticum tauschii) and crested wheatgrass (Agropyron cristatum). Genome 1999, 42, 519–524. [Google Scholar] [CrossRef]
  50. Soliman, M.H.; Rubiales, D.; Cabrera, A. A fertile amphiploid between durum wheat (Triticum turgidum) and the Agroticum amphiploid (Agropyron cristatum x T. tauschii). Hereditas 2001, 135, 183–186. [Google Scholar] [CrossRef] [Green Version]
  51. Soliman, M.H.; Cabrera, A.; Sillero, J.C.; Rubiales, D. Genomic constitution and expression of disease resistance in Agropyron cristatum x durum wheat derivatives. Breed. Sci. 2007, 57, 17–21. [Google Scholar] [CrossRef] [Green Version]
  52. Zhang, J.; Ma, H.; Zhang, J.; Zhou, S. Molecular cytogenetic characterization of an Agropyron cristatum 6PL chromosome segment conferring superior kernel traits in wheat. Euphytica 2018, 214, 198. [Google Scholar] [CrossRef]
  53. Copete-Parada, A.; Palomino, C.; Cabrera, A. Development and characterization of wheat-Agropyron cristatum introgression lines induced by gametocidal genes and Ph1 mutant. Agronomy 2021, 11, 277. [Google Scholar] [CrossRef]
  54. Lukaszewski, A.J. Physical distribution of translocation breakpoints in homoeologous recombinants induced by the absence of the Ph1 gene in wheat and triticale. Theor. Appl. Genet. 1995, 90, 714–719. [Google Scholar] [CrossRef]
  55. Said, M.; Copete Parada, A.; Gaál, E.; Molnár, I.; Cabrera, A.; Doležel, J.; Vrána, J. Uncovering homeologous relationships between tetraploid Agropyron cristatum and bread wheat genomes using COS markers. Theor. Appl. Genet. 2019, 132, 2881–2898. [Google Scholar] [CrossRef] [PubMed]
  56. Zhou, S.; Yan, B.; Li, F.; Zhang, J.; Zhang, J.; Ma, H.; Liu, W.; Lu, Y.; Yang, X.; Liu, X.; et al. RNA-Seq analysis provides first insights into the phylogenetic relationships and interespecific variation between Agropyron cristatum and wheat. Front. Plant Sci. 2017, 8, 1644. [Google Scholar] [CrossRef] [PubMed] [Green Version]
  57. Said, M.; Hřibová, E.; Danilova, T.V.; Karafiátová, M.; Čížková, J.; Friebe, B.; Doležel, J.; Gill, B.S.; Vrána, J. The Agropyron cristatum karyotype, chromosome structure and cross-genome homeology as revealed by fluorescence in situ hybridization with tandem repeats and wheat single-gene probes. Theor. Appl. Genet. 2018, 131, 2213–2227. [Google Scholar] [CrossRef] [PubMed] [Green Version]
  58. Mago, R.; Miah, H.; Lawrence, G.J.; Wellings, C.R.; Spielmeyer, W.; Bariana, H.S.; McIntosh, R.A.; Pryor, A.J.; Ellis, J.G. High-resolution mapping and mutation analysis separate the rust resistance genes Sr31, Lr26 and Yr9 on the short arm of rye chromosome 1. Theor. Appl. Genet. 2005, 112, 41–50. [Google Scholar] [CrossRef]
  59. Lukaszewski, A.J. Manipulation of the 1RS.1BL translocation in wheat by induced homologous recombination. Crop Sci. 2000, 40, 216–225. [Google Scholar] [CrossRef]
  60. Liu, W.X.; Rouse, M.; Friebe, B.; Jin, Y.; Gill, B.; Pumphrey, M.O. Discovery and molecular mapping of a new gene conferring resistance to stem rust, Sr53, derived from Aegilops geniculata and characterization of spontaneous translocation stocks with reduced alien chromatin. Chromosome Res. 2011, 19, 669–682. [Google Scholar] [CrossRef]
  61. Niu, Z.; Klindworth, D.L.; Yu, G.; Friesen, T.L.; Chao, S.; Jin, Y.; Cai, X.; Xu, S.S. Development and characterization of wheat lines carrying stem rust resistance gene Sr43 derived from Thinopyrum ponticum. Theor. Appl. Genet. 2014, 127, 969–980. [Google Scholar] [CrossRef]
  62. Li, H.; Dong, Z.; Ma, C.; Tian, X.; Qi, Z.; Wu, N.; Friebe, B.; Xiang, Z.; Xia, Q.; Liu, W.; et al. Physical mapping of stem rust resistance gene Sr52 from Dasypyrum villosum based on ph1b-induced homoeologous recombination. Int. J. Mol. Sci. 2019, 20, 4887. [Google Scholar] [CrossRef] [Green Version]
  63. Lukaszewski, A.J.; Cowger, C. Re-engineering of the Pm21 transfer from Haynaldia villosa to bread wheat by induced homoeologous recombination. Crop Sci. 2017, 57, 2590–2594. [Google Scholar] [CrossRef]
  64. Wan, W.; Xiao, J.; Li, M.; Tang, X.; Wen, M.; Cheruiyot, A.K.; Li, Y.; Wang, H.; Wang, X. Fine mapping of wheat powdery mildew resistance gene Pm6 using 2B/2G homoeologous recombinants induced by the ph1b mutant. Theor. Appl. Genet. 2020, 133, 1265–1275. [Google Scholar] [CrossRef]
  65. Zhao, R.; Wang, H.; Xiao, J.; Bie, T.; Cheng, S.; Jia, Q.; Yuan, C.; Zhang, R.; Cao, A.; Chen, P.; et al. Induction of 4VS chromosome recombination using the CS ph1b mutant and mapping of the yellow mosaic virus resistance gene from Haynaldia villosa. Theor. Appl. Genet. 2013, 126, 2921–2930. [Google Scholar] [CrossRef] [PubMed]
  66. Danilova, T.V.; Zhang, G.; Liu, W.; Friebe, B.; Gill, B.S. Homoeologous recombination-based transfer and molecular cytogenetic mapping of a wheat streak mosaic virus and Triticum mosaic virus resistance gene Wsm3 from Thinopyrum intermedium to wheat. Theor. Appl. Genet. 2017, 130, 549–556. [Google Scholar] [CrossRef] [PubMed]
  67. Fedak, G.; Chi, D.; Wolfe, D.; Oullet, T.; Cao, W.; Han, F.; Xue, A. Transfer of fusarium head blight resistance from Thinopyrum elongatum to bread wheat cultivar Chinese Spring. Genome 2021, 64, 959–968. [Google Scholar] [CrossRef] [PubMed]
  68. Kolmer, J.A. Genetics of resistance to wheat leaf rust. Annu. Rev. Phytopathol. 1996, 34, 435–455. [Google Scholar] [CrossRef] [PubMed]
  69. Martínez, F.; Niks, R.E.; Singh, R.P.; Rubiales, D. Characterization of Lr46, a gene conferring partial resistance to wheat leaf rust. Hereditas 2001, 135, 111–114. [Google Scholar] [CrossRef] [Green Version]
  70. Kloppers, F.J.; Pretorius, Z.A. Effects of combinations amongst genes Lr13, Lr34 and Lr37 on components of resistance in wheat to leaf rust. Plant Pathol. 1997, 46, 737–750. [Google Scholar] [CrossRef]
  71. Martínez, F.; Sillero, J.C.; Rubiales, D. Effect of host plant resistance on haustorium formation in cereal rust fungi. J. Phytopathol. 2004, 152, 381–382. [Google Scholar] [CrossRef]
  72. Wang, X.; McCallum, B.D.; Fetch, T.; Bakkeren, G.; Marais, G.F.; Saville, B.J. Comparative microscopic and molecular analysis of Thatcher near-isogenic lines with wheat leaf rust resistance genes Lr2a, Lr3, LrB or Lr9 upon challenge with different Puccinia triticina races. Plant Pathol. 2013, 62, 698–707. [Google Scholar] [CrossRef]
  73. Saleem, K.; Sørensen, C.K.; Labouriau, R.; Hovmøller, M.S. Spatiotemporal changes in fungal growth and host responses of six yellow rust resistant near-isogenic lines of wheat. Plant Pathol. 2019, 68, 1320–1330. [Google Scholar] [CrossRef]
Figure 1. The crossing scheme used in this study.
Agronomy 13 00334 g001
Figure 2. The FISH/GISH on mitotic metaphase chromosome spreads in BC1F2 plants of (a) homozygous T1PS·1BL translocation line; (b) heterozygous T1PS·1BL translocations line; (c) heterozygous recombinant type 1; (d) homozygous recombinant type 2. In (a,b), double hybridization signals using both genomic A. cristatum DNA (red, white arrows) and pTa71 probe (green, red arrows) are shown; in (c,d), genomic A. cristatum DNA (red) is shown. Bar = 10 µm.
Agronomy 13 00334 g002
Figure 3. PCR amplification profiles of 1BS-specific markers (GluB3a, Xpsp3000, Xwmc798 and Xwmc406) and 1PS-specific markers (Agc29588, Agc69174 and Agc26797) on BC1F2 plants. Lanes M: marker; CS: ’Chinese Spring’; TH4: T1PS·1BL translocation line; 1–2: heterozygous plants for 1PS·1BL translocation; 3–4: homozygous plants for 1PS·1BL translocation; 5: 1BS/1PS recombinant type 1; 6: 1PS/1BS recombinant type 2; 7–8: wheat plants with no introgression from A. cristatum. Arrows indicate the diagnostic amplification product.
Agronomy 13 00334 g003
Figure 4. Spike morphology of (a) CS; (b) the TH4 line; (c) the BC1F4-15-10-2 line (homozygous for T1PS·1BL translocation); (d) the BC1F4-43-2-4 line (homozygous recombinant type 2).
Agronomy 13 00334 g004
Figure 5. Infection type (IT) observed in the studied lines: Califa Sur ((a), IT 9); CS ((b), IT 9); TH4 ((c), IT 6(9)); BC1F4-15-10-2 ((d), IT 2(6)); BC1F4-37-2-21 ((e), IT 2(6)); BC1F4-43-2-4 ((f), IT 5(6)); and BC1F4-45-2-7 ((g), IT 9). IT values in parenthesis correspond to the secondary IT observed at a low frequency. Scale, 0.5 cm.
Agronomy 13 00334 g005
Figure 6. Microscopic stages of P. triticina development (early aborted (EA) and established (EST) colonies with presence (+) or absence (−) of plant cell necrosis) in the BC1F4 and TH4 lines and the common wheat varieties CS and Califa Sur, expressed as mean percentages. Error bars represent the standard error (SE) calculated from three independent experiments. For each fungal stage, data with the same letter are not significantly different (least significant difference test, p < 0.05).
Agronomy 13 00334 g006
Figure 7. Microscopically observed established colonies (EST) of P. triticina showing the absence (A) or presence (B) of necrotic (autofluorescence) plant cells. Scale, 50 µm.
Agronomy 13 00334 g007
Table 1. Macroscopic components of resistance (RLP, relative latency period; IT, infection type; RIF, relative infection frequency; RPS, relative pustule size) to leaf rust in BC1F4 genotypes.
GenotypeRLP (Hours)IT 3RIF (Pustules/cm2)RPS (mm2)
Califa Sur100.00 ± 0.00 [163 1] c 29100.00 (10.00 ± 0.00) [68] a100.00 ± 0.00 [0.132] a
CS104.42 ± 2.55 b997.70 (9.87 ± 0.67) a88.33 ± 5.17 b
TH4118.41 ± 0.65 a6 (9)18.58 (4.28 ± 0.58) c33.48 ± 4.81 e
BC1F4-15-10-2 4106.43 ± 1.45 b2 (6)10.47 (3.23 ± 0.23) d35.72 ± 5.70 e
BC1F4-37-2-21 4104.52 ± 0.81 b2 (6)11.79 (3.43 ± 0.23) d38.47 ± 7.04 de
BC1F4-43-2-4 5105.27 ± 2.26 b5 (6)19.39 (4.37 ± 0.63) c47.34 ± 9.32 d
BC1F4-45-2-7 694.92 ± 0.13 d973.87 (8.59 ± 0.24) b76.17 ± 2.83 c
1 The actual average values for ‘Califa Sur’ are shown between brackets. 2 Values are means ± standard deviation for three leaves evaluated through image analysis in three independent experiments. Values between parentheses are transformed data ± standard deviation. In each column, data with the same letter are not significantly different (least significant difference, p < 0.05). 3 When a secondary IT was observed at a low frequency, the value is indicated in parenthesis. 4 Homozygous for T1PS·1BL translocation. 5 Homozygous recombinant type 2. 6 No A. cristatum introgression.
Table 2. Microscopic components of resistance (RCS, relative colony size; EA, total percentage of early aborted colonies; EST, total percentage of established colonies) to leaf rust in BC1F4 genotypes.
GenotypeRCS (mm2)EAEST
Califa Sur100.00 ± 0.00 [0.455 1] a 29.47 (3.06 ± 0.42) c90.53 (3.06 ± 0.42) a
CS100.97 ± 5.95 a11.75 (3.42 ± 0.25) c88.25 (3.42 ± 0.25) a
TH429.81 ± 3.95 e52.53 (7.24 ± 0.29) a47.47 (7.24 ± 0.29) c
BC1F4-15-10-2 356.27 ± 1.91 d29.20 (5.32 ± 1.13) b70.80 (5.32 ± 1.13) b
BC1F4-37-2-21 357.32 ± 3.22 d31.31 (5.54 ± 0.99) b68.69 (5.54 ± 0.99) b
BC1F4-43-2-4 467.59 ± 1.22 c16.82 (4.09 ± 0.43) c83.18 (4.09 ± 0.43) a
BC1F4-45-2-7 592.61 ± 5.62 b14.10 (3.75 ± 0.20) c85.90 (3.75 ± 0.20) a
1 The actual average values for ‘Califa Sur’ are shown between brackets. 2 Values are means ± standard deviation for three leaves evaluated through image analysis in three independent experiments. Values between parentheses are transformed data ± standard deviation. In each column, data with the same letter are not significantly different (least significant difference, p < 0.05). 3 Homozygous for T1PS·1BL translocation. 4 Homozygous recombinant type 2. 5 No A. cristatum introgression.
Disclaimer/Publisher’s Note: The statements, opinions and data contained in all publications are solely those of the individual author(s) and contributor(s) and not of MDPI and/or the editor(s). MDPI and/or the editor(s) disclaim responsibility for any injury to people or property resulting from any ideas, methods, instructions or products referred to in the content.

