Article

Effects of Water and Nitrogen Regulation on Cotton Growth and Hydraulic Lift under Dry Topsoil Conditions

1
College of Agricultural Science and Engineering, Hohai University, Nanjing 210098, China
2
Changjiang Survey, Planning, Design and Research Co., Ltd., Wuhan 430010, China
3
State Key Laboratory of Hydrology Water Resources and Hydraulic Engineering, Hohai University, Nanjing 210098, China
4
College of Hydrology and Water Resources, Hohai University, Nanjing 210098, China
*
Author to whom correspondence should be addressed.
Agronomy 2023, 13(12), 3022; https://doi.org/10.3390/agronomy13123022
Submission received: 11 November 2023 / Revised: 27 November 2023 / Accepted: 7 December 2023 / Published: 9 December 2023

Abstract

:
Dry topsoil and relatively moist subsoil can occur in specific areas and times, limiting plant growth but creating conditions for hydraulic lift (HL). There is a lack of a rational water and nitrogen (N) strategy to improve cotton growth and maintain HL. This study investigated the effects of three topsoil water conditions (W0.6: 60–70%, W0.5: 50–60%, and W0.4: 40–50% of field capacity) and three N rates (N120-120, N240-240, and N360-360 kg N ha−1) plus one control treatment on cotton growth and HL under dry topsoil conditions in 2020 and 2021. The results showed that plant height and leaf area increased with increasing N rate, but the differences among topsoil water conditions were relatively small, except for leaf area in 2021. The HL water amount of all treatments increased gradually and then continued to decline during the observation period. There was a trend that the drier the topsoil or the more N applied, the greater the amount of HL water. Additionally, topsoil water conditions and N rate significantly affected the total HL water amount and root morphological characteristics (root length, surface area, and volume). Seed and lint cotton yield tended to decrease with increasing topsoil dryness at N240 or N360, except for lint yield in 2021, or with decreasing N rate, especially under W0.6. As topsoil became drier, the total evapotranspiration (ET) decreased, while with the increase in N rate, ET showed small differences. Water use efficiency increased with a higher N rate, while N partial factor productivity (PFPN) did the opposite. Furthermore, the PFPN under W0.4 was significantly lower than that under W0.6 at N240 or N120. These findings could be useful for promoting the utilization of deep water and achieving sustainable agricultural development.

1. Introduction

Climate change, arising from natural causes, human activities, and land use changes, can lead to a range of adverse impacts, including global warming [1], which is reflected in the current trend of an increase of 2 to 3 °C or at best, slightly less than 2 °C [2]. Rising air temperatures would bring about hot and dry conditions, potentially threatening global crop production [3]. In specific areas and times, due to high land surface temperature, low precipitation, and high evapotranspiration (ET), the topsoil may face dryness or even drought [4,5,6], while the subsoil would be relatively moist [7]. In this particular case, cotton, as the most important fiber crop and a major source of seed oil and protein around the world [8,9], can survive by extending its roots into the moist subsoil to absorb water. However, the topsoil layer often accumulates a large amount of nutrients required for plant growth [10]. When the topsoil layer is under dry conditions, the vitality of related microorganisms decreases, the ion mobility is weakened, and a serious spatial mismatch of water and nutrient profiles is formed.
Soil water restriction and low soil nitrogen (N) concentration are increasingly serious problems [11], and water and N supply and regulation can play a critical role in cotton growth and development. It was found that among all treatments with different drought stress (367, 618, and 917 mm) and N application levels (0, 150, 225, and 300 kg N ha−1), the N application of 225 kg N ha−1 with moderate drought treatment of 618 mm would achieve the highest yield and high N use efficiency [12]. Hou et al. [13] reported that the optimal dry matter, seed cotton yield, N recovery efficiency, and total N accumulation were obtained in treatment where irrigation was 100% of crop ET and N application was 350 kg N ha−1. Zhang et al. [11] evaluated the effects of four irrigation schedules and two dressing ratios and concluded that increased water consumption in deep soil layers resulted in increased seed cotton yield and water use efficiency (WUE). However, few studies have been conducted on the rational regulation of soil water and N in the topsoil layer to improve cotton growth under the condition of relatively moist subsoil.
Particularly, in situations where topsoil is dry and subsoil is moist, the plant root system has the potential to passively transfer water upward according to the water potential gradient, which is known as hydraulic lift (HL) and has been found in many woody plants including cotton [14,15,16,17,18]. This involves water redistribution within the plant and water release from roots to topsoil and usually occurs at night when plant transpiration rates are low. The addition of water to topsoil through HL could reduce the rate of water consumption, delay the embolism of shallow roots, and enhance root survival on the one hand, and on the other hand, could increase the rate of ion diffusion to roots, improve the nutritional status during arid periods and extend the growing season of crops [19,20,21]. It has been reported that HL was driven by the difference in soil water potential between the upper and lower layers, and different fertilizer strategies also impacted HL [22]. Thus, maintaining relatively high HL in cotton also needs to be considered when regulating water and N in the topsoil layer.
This study aimed to analyze the effects of water and N regulation on cotton growth and HL under dry topsoil conditions using the specially constructed split-root system. The specific objectives were to (1) illustrate the growth dynamics of cotton plants, including plant height, leaf area, leaf photosynthetic characteristics, and root morphological characteristics; (2) investigate the changes in the amount of water from root HL at different periods and the HL water amount for the whole test period; and (3) explore the yield, WUE, and N use efficiency of cotton in response to different water and N levels in topsoil. This research will contribute to our understanding of how to rationally regulate water and N in dry topsoil layers to promote cotton growth and maintain high HL.

2. Materials and Methods

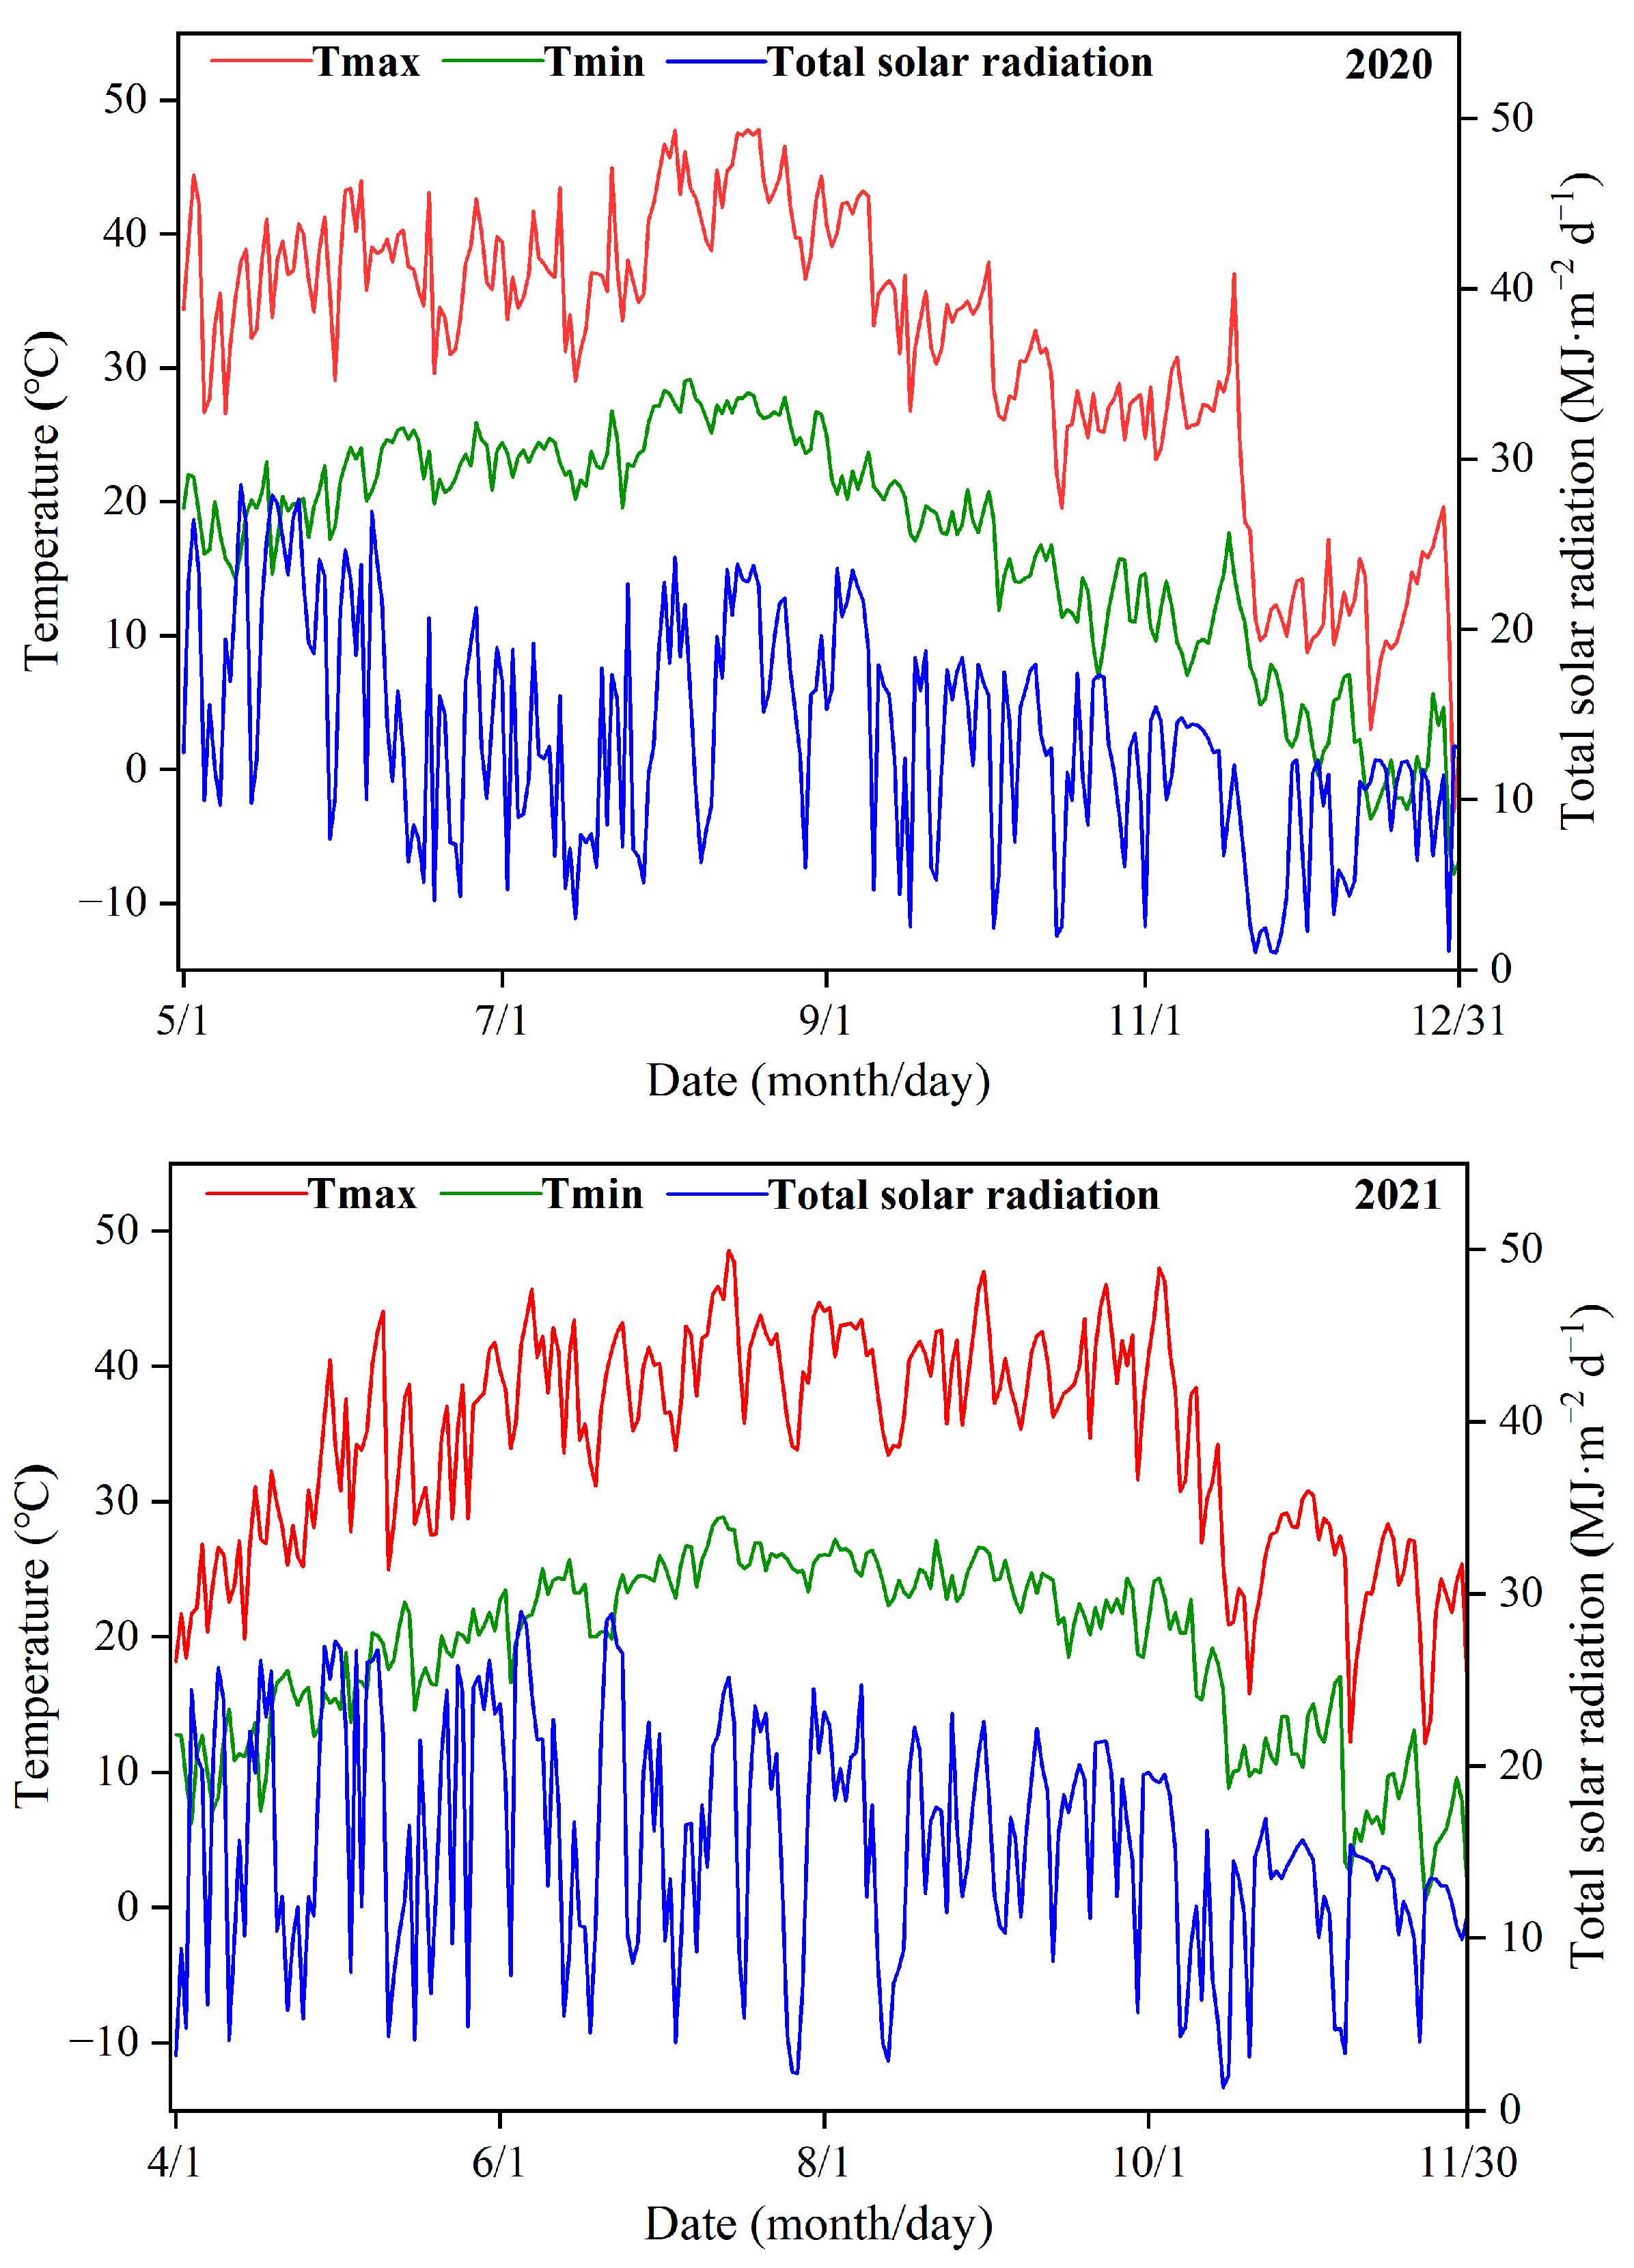
2.1. Experimental Site

The experiment was conducted in a plastic greenhouse for two successive years (2020–2021) at the campus of Hohai University, Nanjing, China (31°57′ N, 118°50′ E). The site has a subtropical and humid monsoon climate, with an average annual temperature and rainfall of 15.7 °C and 1061.1 mm, respectively. An automatic weather station (FT-XY09, Weifang, China) was installed in the rain-sheltered greenhouse, recording meteorological parameters such as temperature, relative humidity, and total solar radiation at intervals of 2 min. The daily values of maximum and minimum air temperature and total solar radiation during the experiment are illustrated in Figure 1. The initial topsoil (0–30 cm) at the experimental site was classified as clay loam according to the World Reference Base (WRB) 2022 [23], with available N, P, and K of 16.2, 9.9 and 20.4 mg kg−1, respectively. Soil-available N content was determined photometrically from on-site KCl extractions using a continuous flow analyzer (SAN Plus, Skalar, Breda, The Netherlands) [24]. Soil-available P content was determined with NaHCO3 extraction and measured using the continuous flow analyzer (Auto Analyzer-III, Bran Luebbe, Norderstedt, Germany), and soil-available K content was determined with NH4OAc extraction and measured using an atomic absorption spectrophotometer (AA370MC, Yiyou, Shanghai, China) [25]. Soil organic carbon (SOC), measured via wet oxidation with KCr2O7 + H2SO4 and titrated with FeSO4 [26], was 12.43 g kg−1, and soil total N, measured using the Kjeldahl method [26], was 0.98 g kg−1. The soil bulk density was 1.34 g·cm−3.

2.2. Experimental Setup

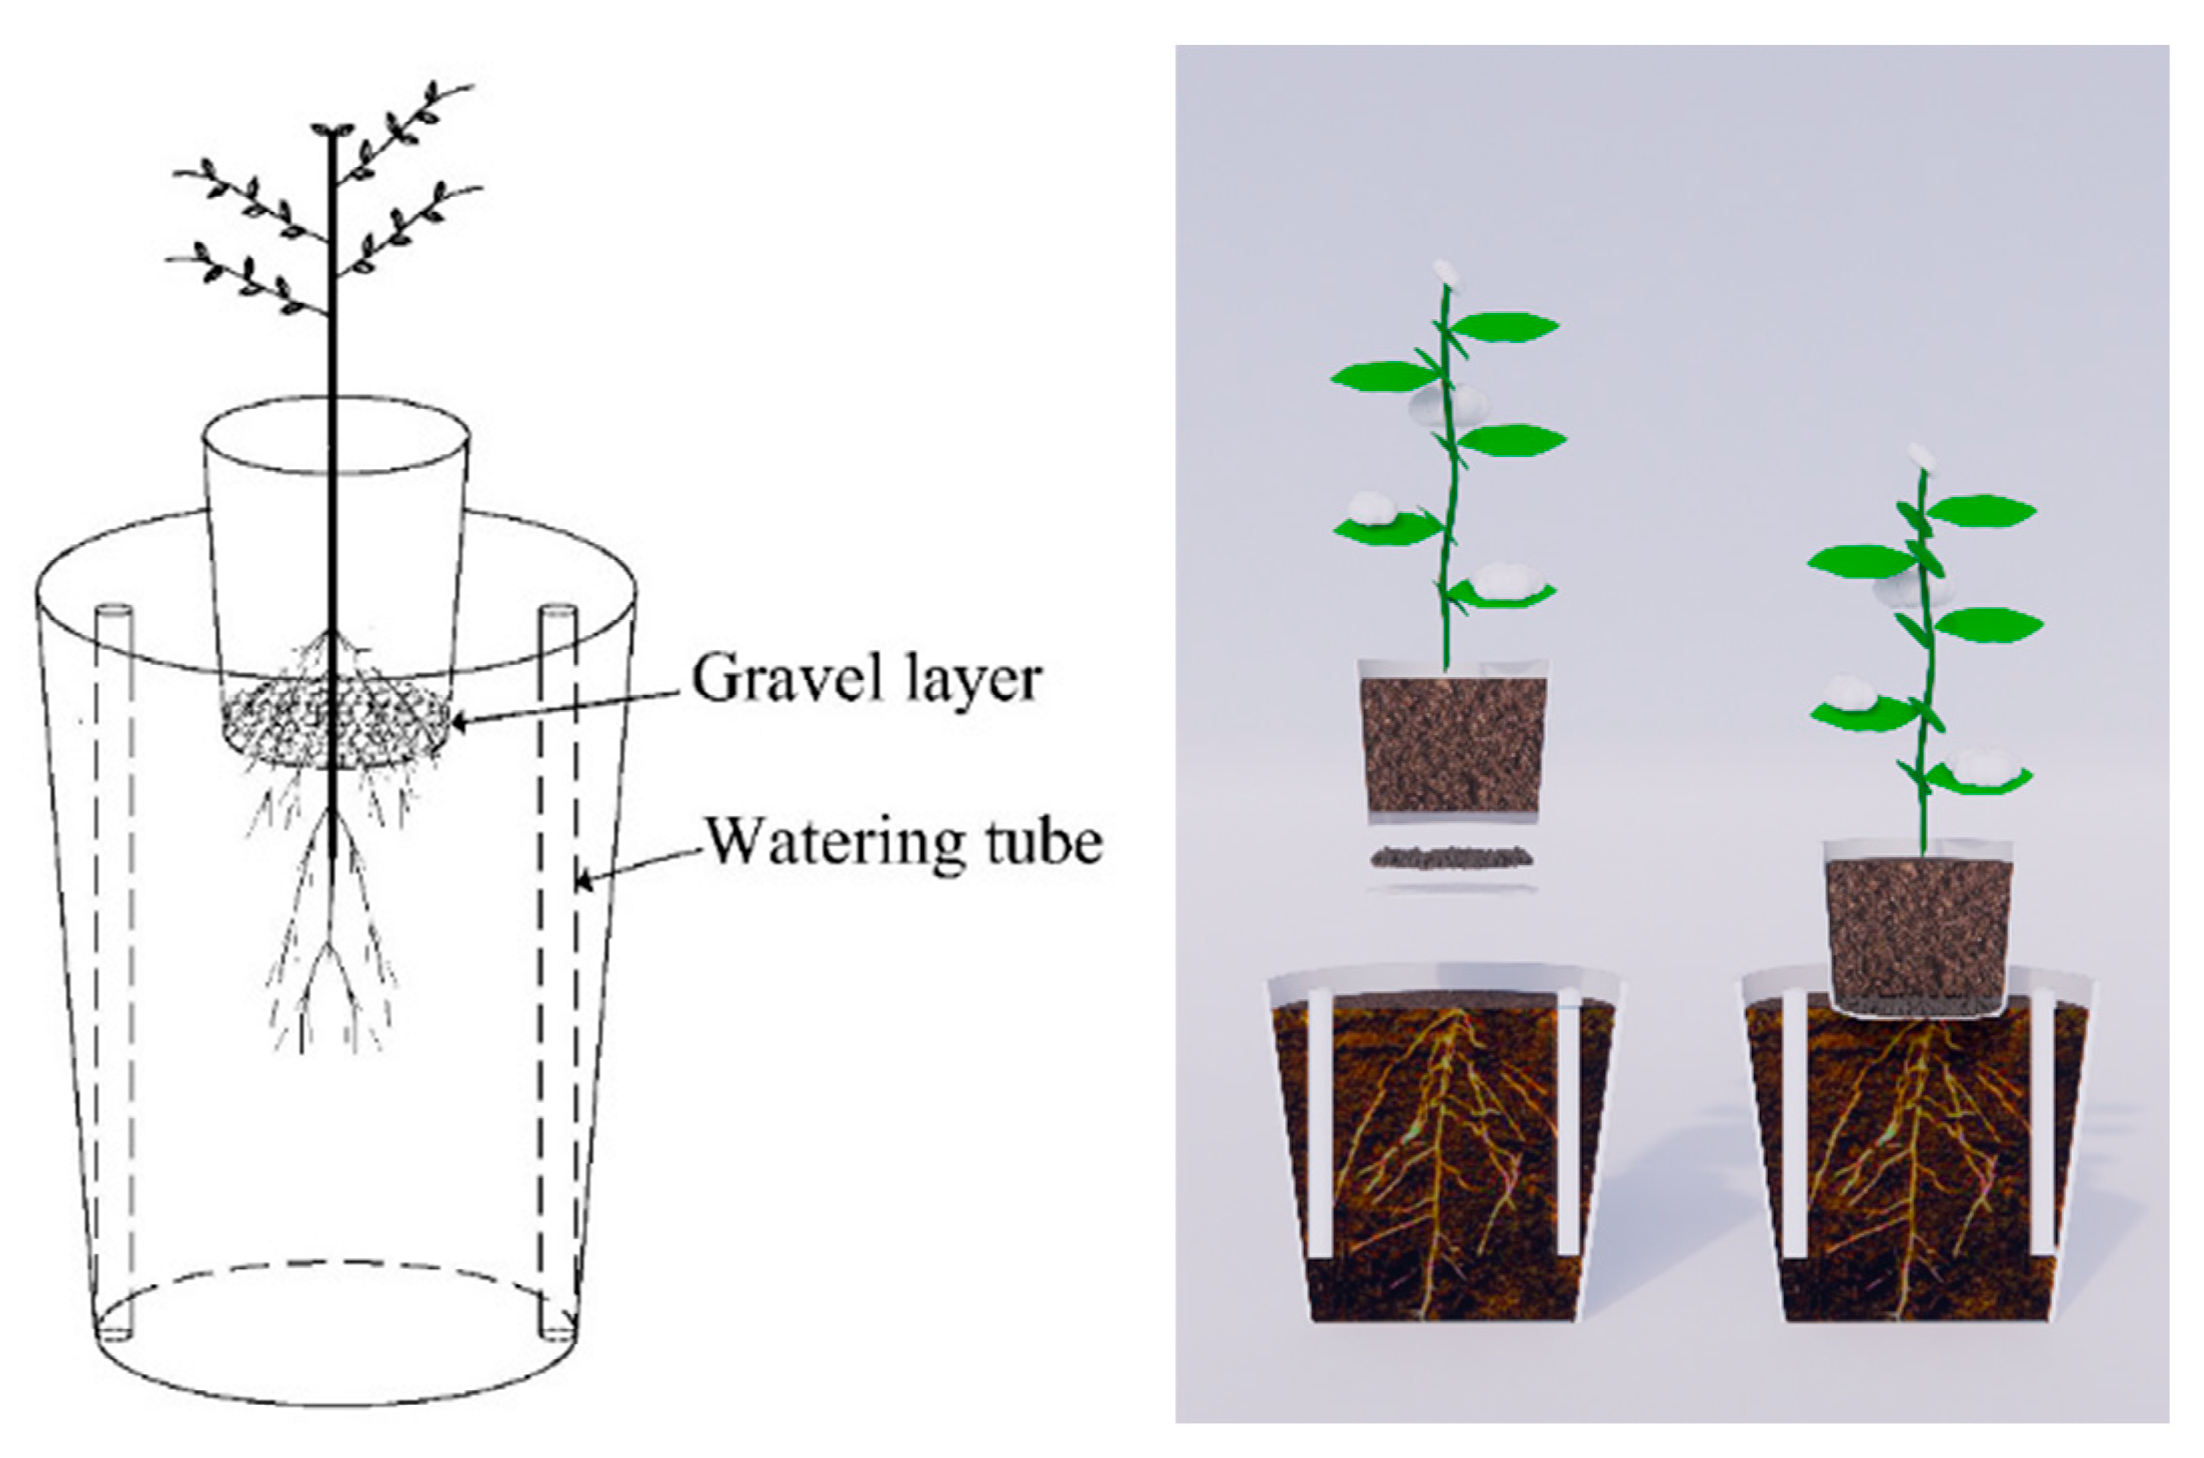
2.2.1. Split-Root System

A split-root system consisted of two compartments for roots (a 26 cm top diameter, 23 cm bottom diameter, 22 cm deep upper compartment, and a 48 cm top diameter, 36 cm bottom diameter, and 45 cm deep lower compartment) was specially constructed for this study (Figure 2). To cut off capillary water transmission between the soil of the upper and lower compartments and ensure that the roots penetrate successfully into the soil of the lower compartment, round holes of 1 cm in diameter were punched evenly in the bottom of the upper compartment, and above the bottom, a 1.5 cm thick layer of gravel with a grain size of 1–2 cm was uniformly filled. Then, the upper compartment was filled with 20 cm of sieved dry topsoil (0–30 cm) from the experimental site (i.e., topsoil layer) and the lower compartment was filled with 40 cm of the same dry soil (i.e., subsoil layer), both of which had initial bulk density, field capacity, and saturated moisture content of 1.30 g·cm−3, 27.37% (w/w), and 39.23 (w/w), respectively. During the filling process, two 35 cm long, 30 mm inner-diameter mesh hollow steel pipes (i.e., watering tube) wrapped with water-permeable gauze on the outside were buried vertically and symmetrically near the outer edges of the lower compartment to irrigate the subsoil evenly. And the bare soil surface of each lower compartment and the watering tube (when not irrigated) were covered with white polyethylene plastic film to reduce soil evaporation.

2.2.2. Experimental Design

The completely randomized experiment was adopted for the cotton cultivation in a greenhouse and consisted of three topsoil water conditions (soil water content at 60–70%, 50–60%, and 40–50% of field capacity, designated as W0.6, W0.5, and W0.4, respectively) and three N rates (conventional farmers’ fertilization of 360 kg N·ha−1; one-third N reduction at 240 kg·N ha−1; and two-thirds N reduction at 120 kg·N ha−1; designated as N360, N240, and N120, respectively). Meanwhile, an additional control treatment (CK) was set up with the soil water content controlled at 60–70% of field capacity and no N fertilizer applied. The N fertilizer used was urea, which was uniformly mixed into topsoil before transplanting. All treatments were set up for the topsoil layer with three replications (30 in total). For subsoil, the soil water content was controlled at 70 to 80% of field capacity until harvest, and no more N fertilizer was applied. In order to ensure the survival of cotton seedlings after transplanting, the topsoil water was kept at 70–80% of field capacity during the seedling stage, while the water treatment was started at the end of the seedling period.

2.2.3. Plant Management

The cotton (Gossypium hirsutum L. cv. Zhongmian 117) was sown in peat pots on 10 May 2020 and 18 April 2021 in the greenhouse, respectively. The relatively late sowing of cotton in 2020 was mainly due to the coronavirus pandemic. At the four-leaf stage, the cotton seedlings with good growth and consistent traits were selected and transplanted into topsoil one plant per split-root system on 20 June 2020 and 29 May 2021, and the cotton was harvested on 16 December 2020 and 20 November 2021, respectively. Prior to transplanting, a phosphorus fertilizer (Ca(H2PO4)2) at the rate of 180 kg P2O5 ha−1 and a potassium fertilizer (K2SO4) at the rate of 180 kg K2O ha−1 were mixed evenly into topsoil as a base fertilizer, and the corresponding N fertilizer was also applied. Other agronomic practices, such as weed control and pesticide application, were the same as the local traditional cotton cultivation, but cotton was not topped in either growing season.

2.3. Measurements

2.3.1. Soil Water and HL Water

During the experiment, the soil water content of topsoil and subsoil was measured every 2–3 d using a calibrated TDR 350 soil moisture meter (Spectrum Technologies, Inc., Aurora, IL, USA), and irrigation was applied only when soil water reached the low thresholds. The TDR was fitted with a pair of probes with a diameter of 0.5 cm and a spacing of 3 cm. We used 12 cm long and 20 cm long probes to measure the soil water content of the upper and lower compartments, respectively. When measuring, a narrow trench was first dug, then the probes were inserted vertically into the tested soil. The measurements were made at different locations. For HL, the nocturnal variation of the volumetric water content of the topsoil (at 8:00 p.m. and 6:00 a.m. of the following day) was monitored approximately every five days by taking multiple measurements at multiple points using a TDR 350 soil moisture meter, as an indirect way of calculating the amount of water lifted and released by roots at night. It was noted that the monitoring of HL did not start until the intermediate period of cotton growth. This was because, on the one hand, in this experiment, the roots of the cotton plants needed to penetrate through the gravel layer and the holes in the bottom of the upper compartment before they could enter the subsoil, which often took longer, as obtained from the destructive pre-test. In addition, we hypothesized that root HL would occur only when the cotton plant was established to a certain stage. This meant that the roots should be elongated to a longer length in the lower compartment in this case. The amount of water released by roots in the topsoil was calculated using the following formula:
G = Δ W
where G is the amount of HL water, mm, and ΔW is the variation of soil water in the root zone between 6:00 a.m. on the next day and 8:00 p.m. on the previous day, mm. Nighttime soil evaporation and plant transpiration were negligible because they were usually small.

2.3.2. Growth Dynamics

The plant height and leaf area were recorded about once a week. In addition, leaf photosynthetic characteristics were performed on the third fully expanded leaf at 10:00 a.m. on a clear and cloudless day at the flowering stage (11 August) in 2020 and at the flowering stage (21 July) in 2021, including the net photosynthetic rate (Pn, μmol CO2 m−2 s−1) and transpiration rate (Tr, mmol H2O m−2 s−1). Measurements were conducted using an LI-6800 photosynthesis system with photosynthetic active radiation of 1000 μmol m−2 s−1, a flow rate of 500 μmol s−1, and a CO2 concentration of 400 μmol mol−1, respectively.
After the cotton harvest, we collected cotton roots from the soil of the split-root system. Then, the collected roots were washed slowly, air dried, and scanned using the Epson Perfection 4990 Photo scanner. The scan images of root morphology were analyzed using the WinRHIZO software (WinRHIZO Pro 2012b, Regent Instruments, Québec, QC, Canada) to obtain the total root length, total root surface area, and total root volume.

2.3.3. Yield and Water-N Utilization

At the boll opening stage, the seed cotton was harvested immediately by hand-picking, weighed to obtain seed cotton yield, and then partially ginned to determine the lint percentage. The lint yield was determined by multiplying the average lint percentage by the respective seed cotton yield [27].
WUE was determined as follows [28]:
W U E = Y / E T
where Y is the seed cotton yield (g plant−1), and ET is the total evapotranspiration for the whole season (mm). Since the experiment was conducted with pot planting in a greenhouse sheltered from the rain, there was no effective precipitation, the upward capillary flow into the root zone, the runoff, and the downward drainage. According to the water balance equation, the ET for cotton plants can be simplified as follows [29]:
E T = I + Δ W
where I is the cumulative irrigation depth, mm, and ΔW is the variation of soil water in the root zone between the two soil water measurements, mm.
Nitrogen partial factor productivity (PFPN) was determined as follows [30]:
P F P N = Y / T N
where Y is the seed cotton yield (g plant−1), and TN is the total application of the N fertilizer (g plant−1).

2.4. Statistical Analysis

A three-way analysis of variance (ANOVA) was performed for the year, topsoil water condition, and N rate, including two- and three-way interactions. A one-way ANOVA and the least significant difference test (LSD) were used to test for significant differences between treatments in the same year. Statistics were performed using SPSS software (version 23.0; IBM SPSS Statistics, Chicago, IL, USA), and the tests were conducted at an alpha level of 0.05. All data were expressed as mean ± standard error (n = 3), and all figures were drawn using Origin 9.1 software (OriginLab Corporation, Northampton, MA, USA).

3. Results

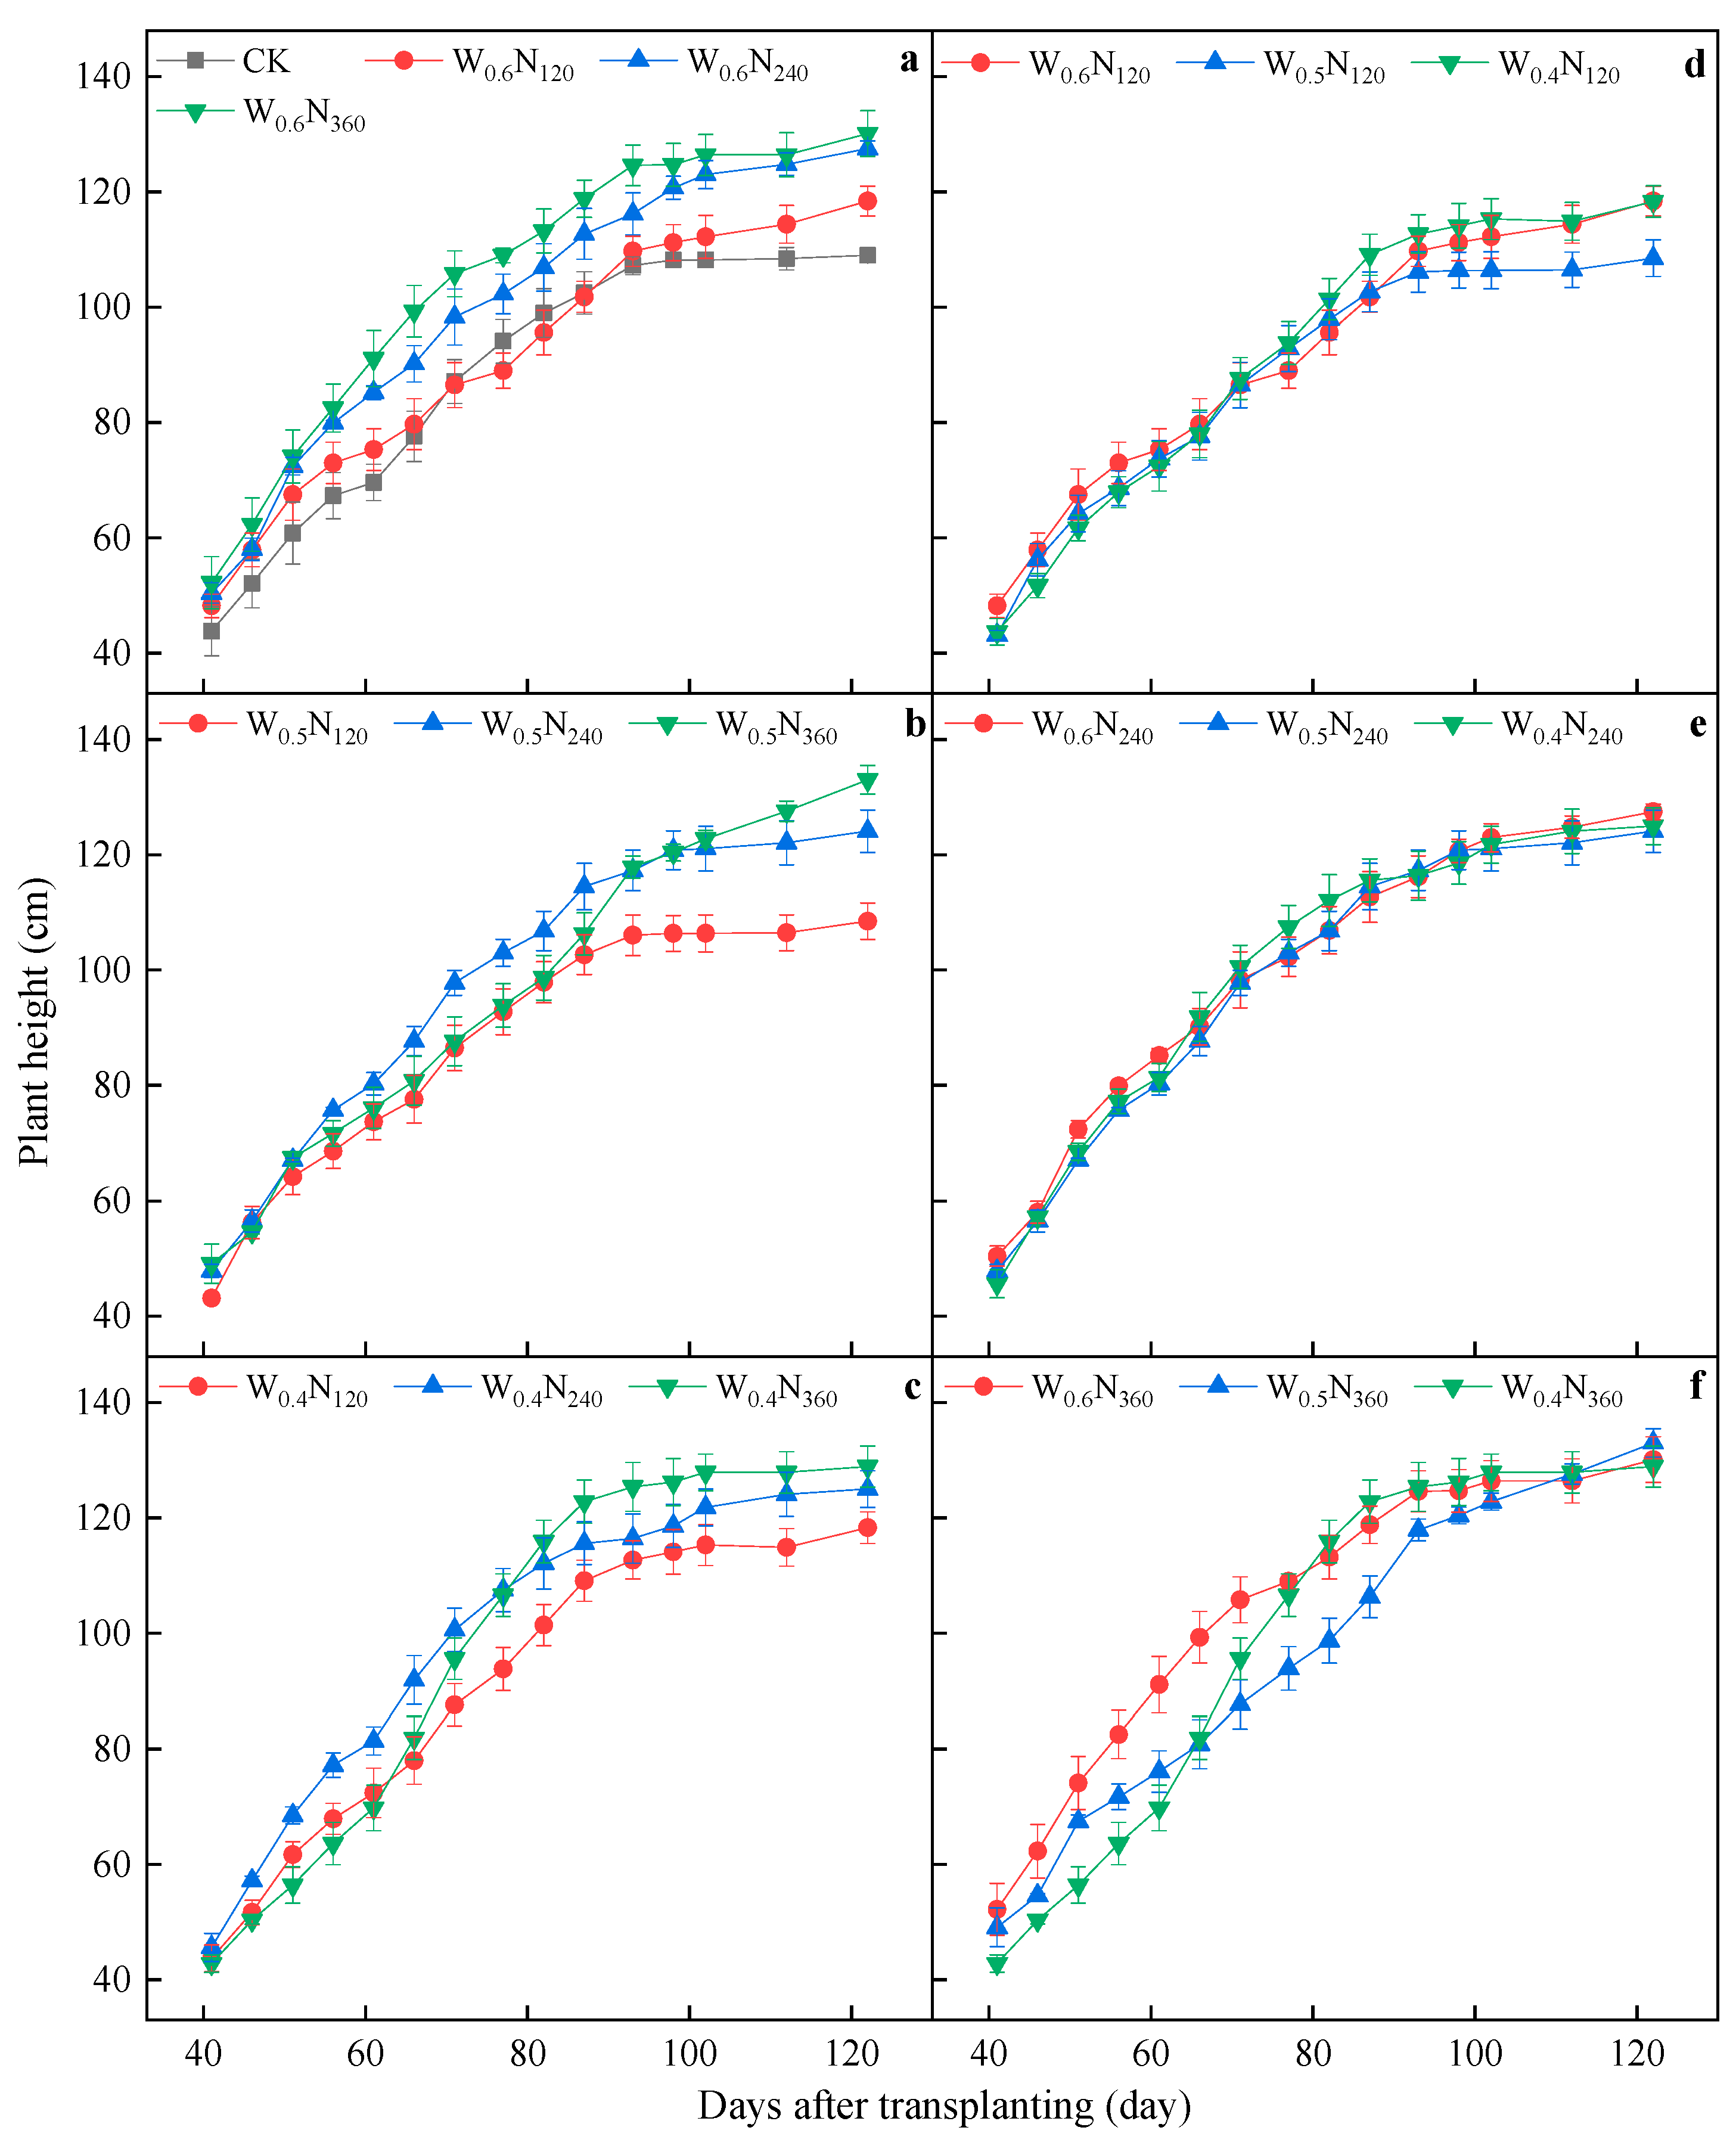
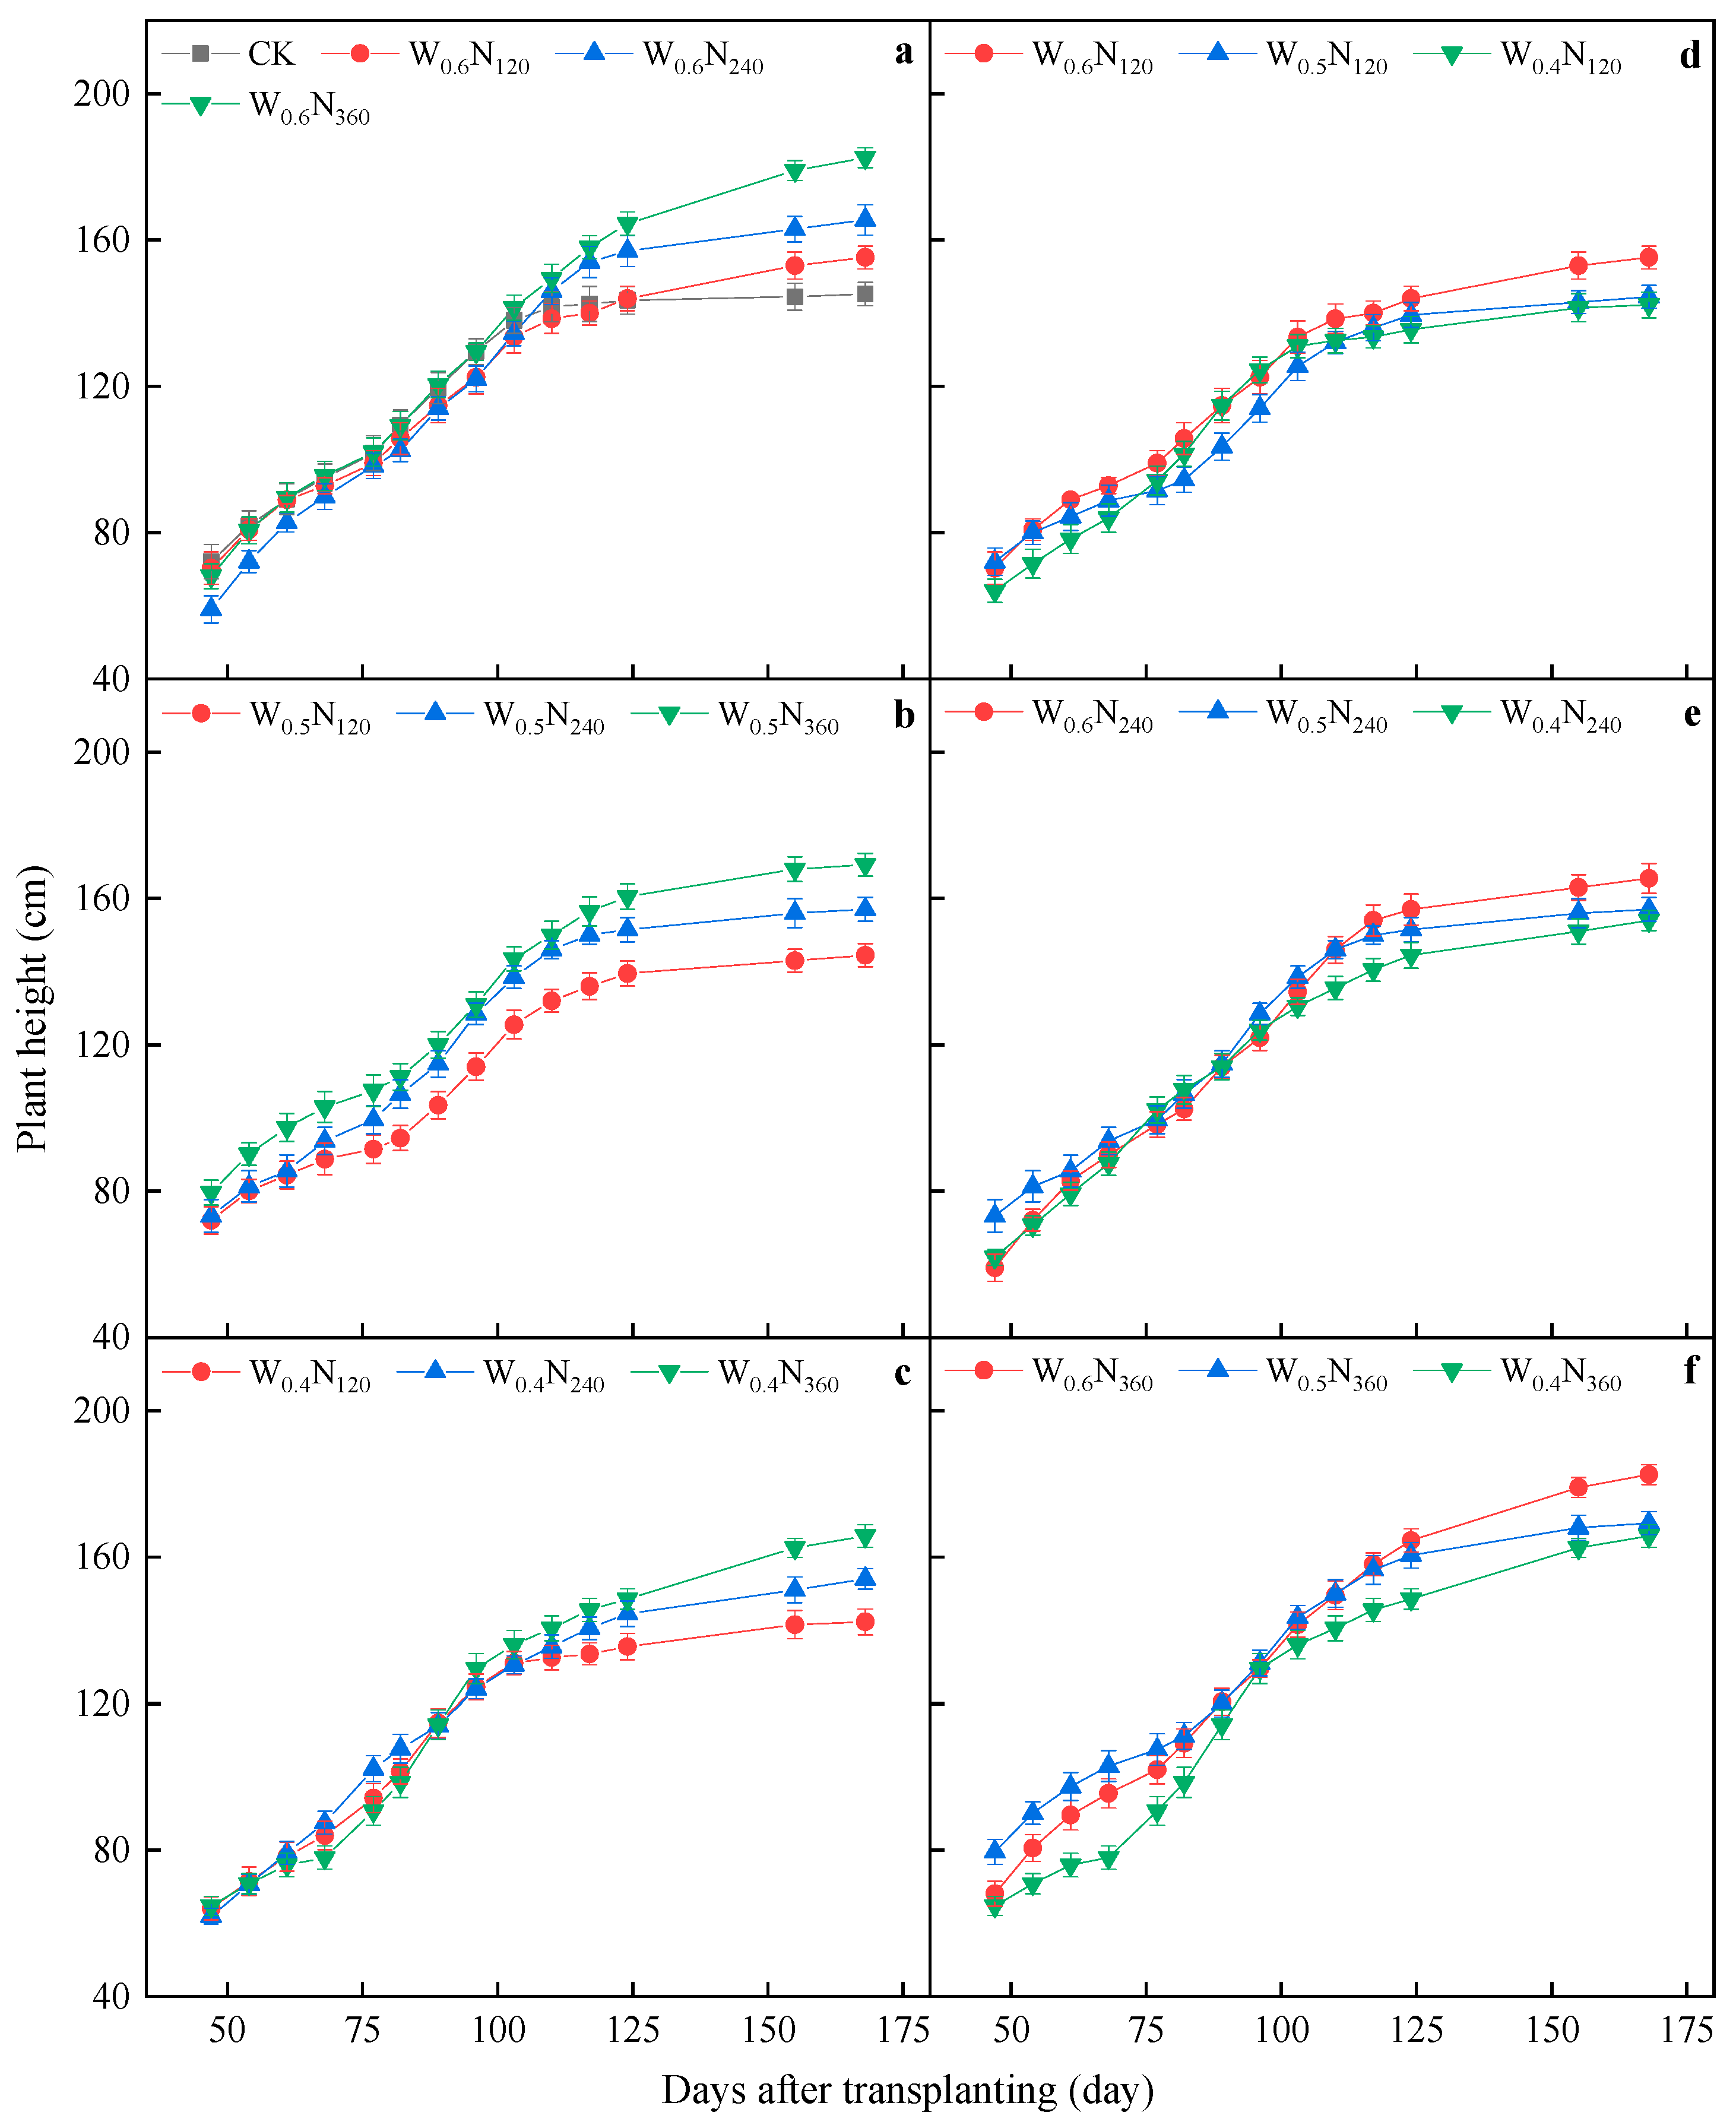
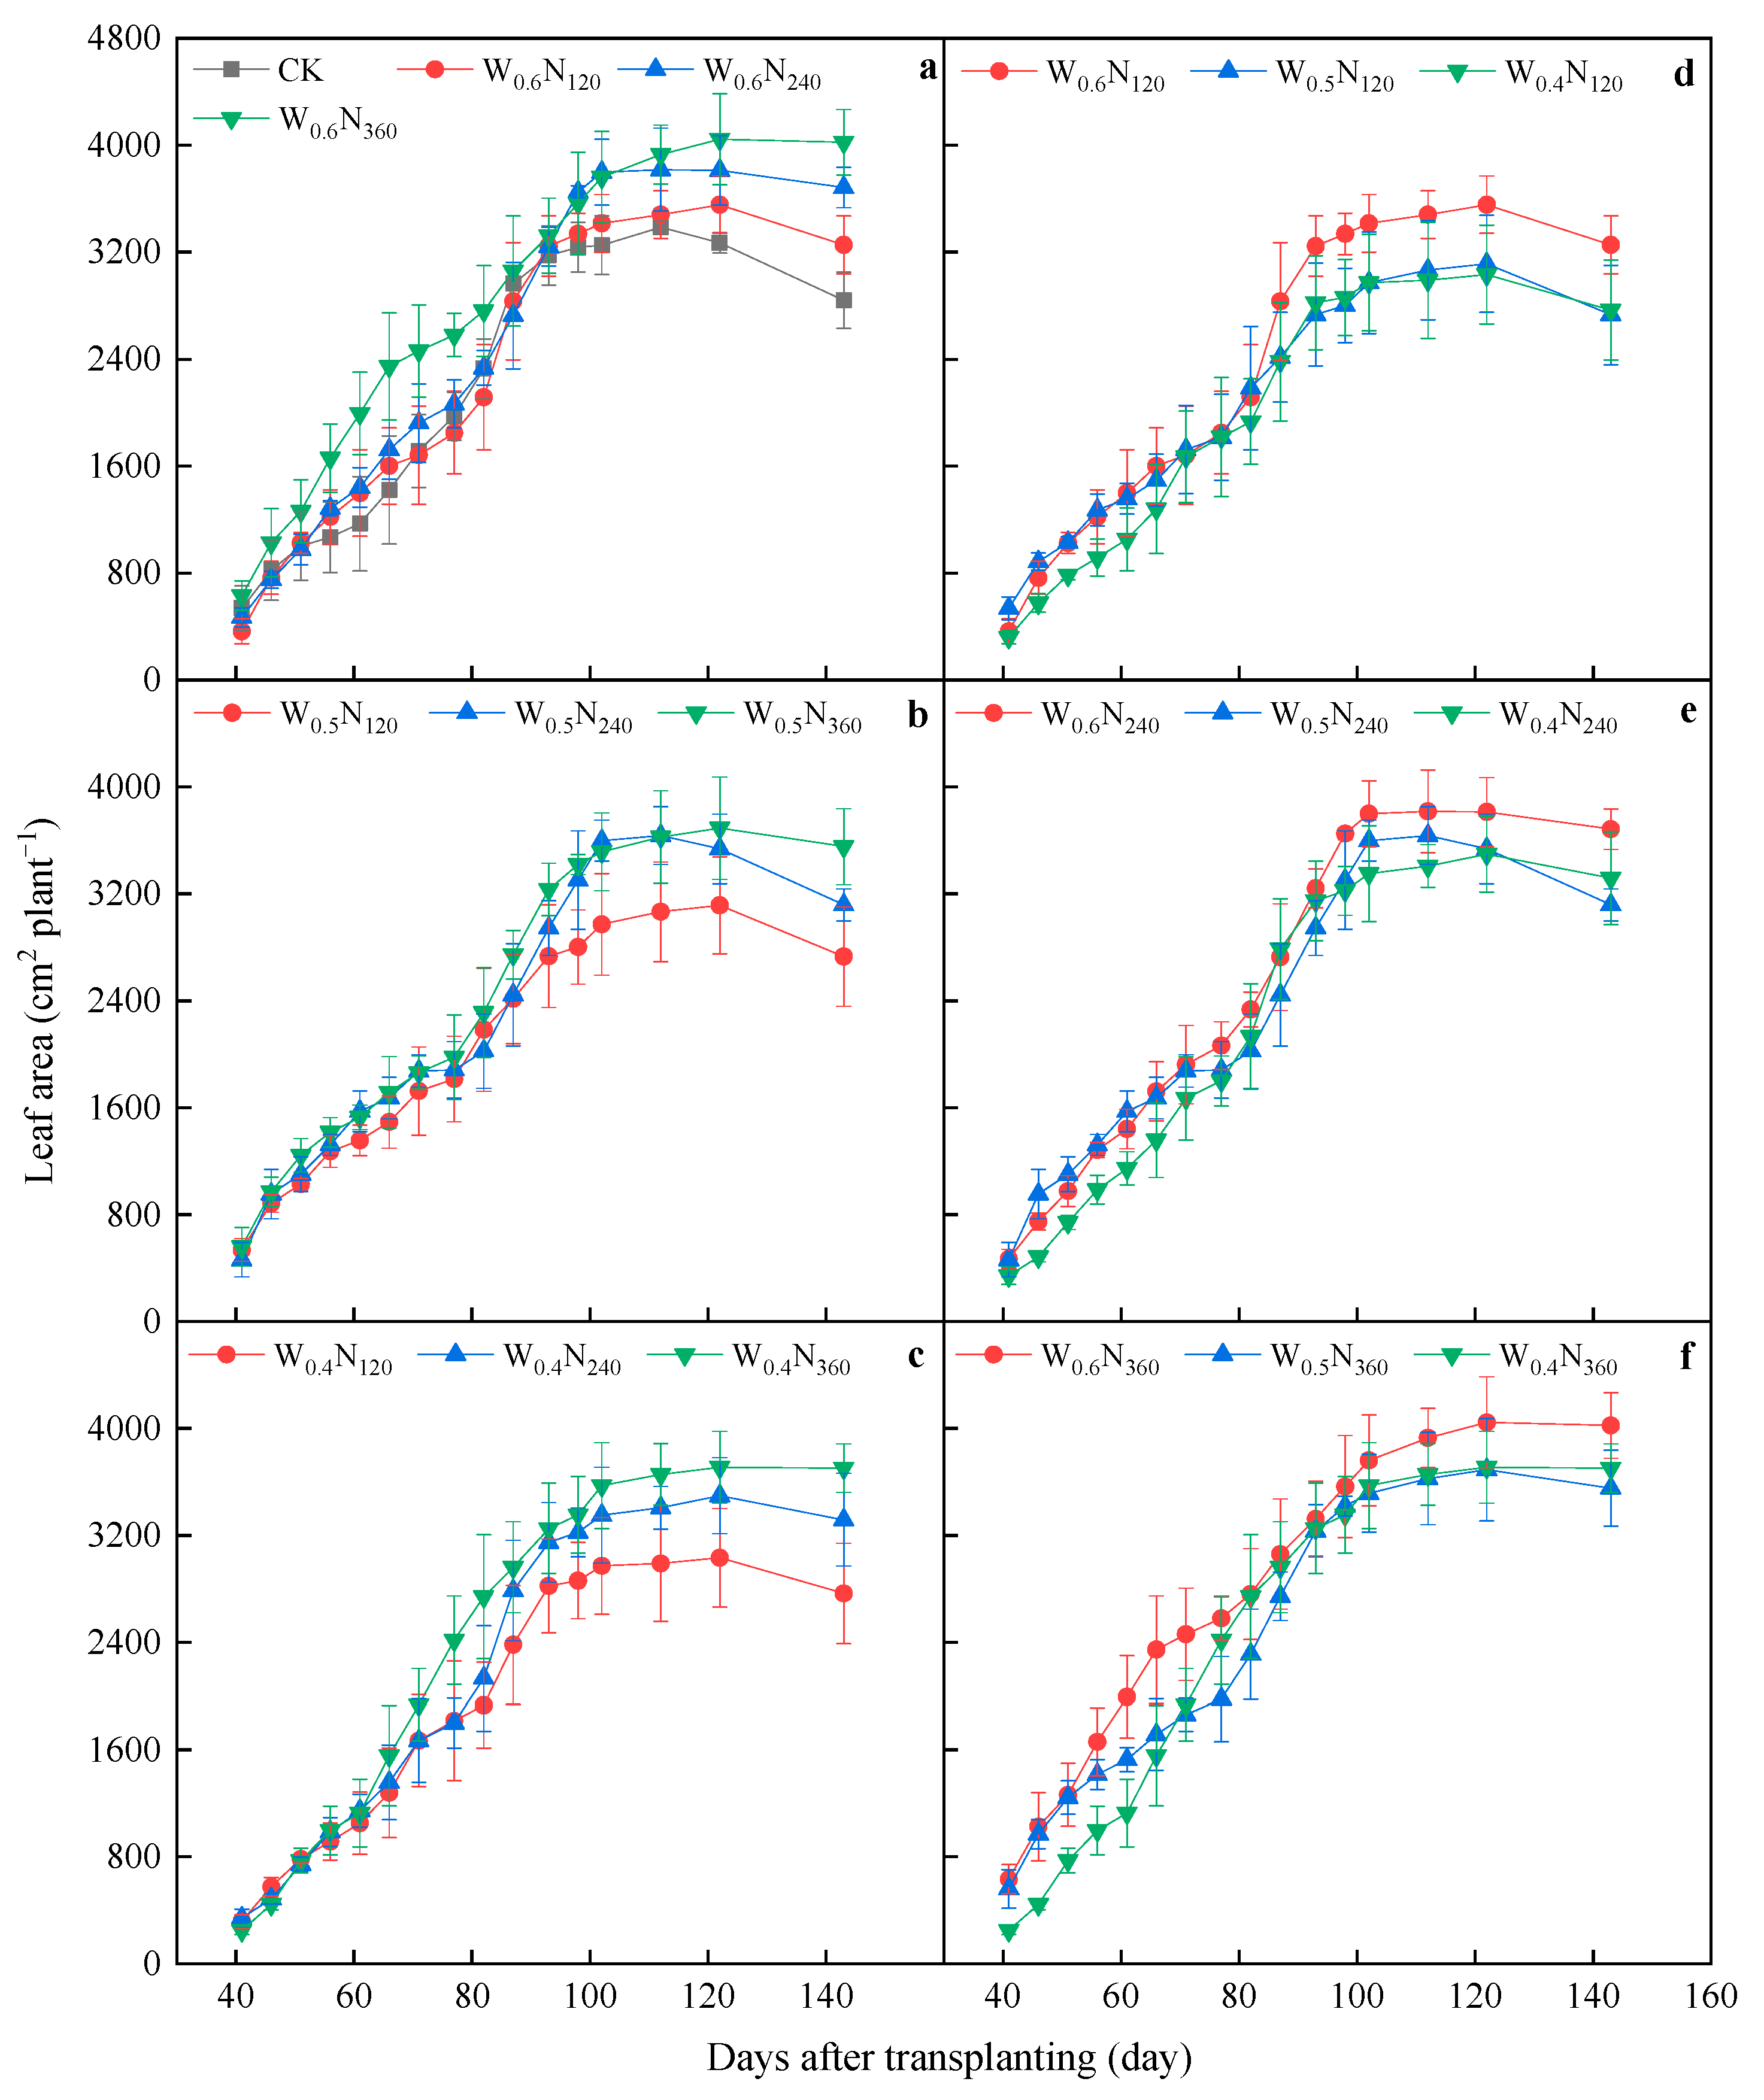
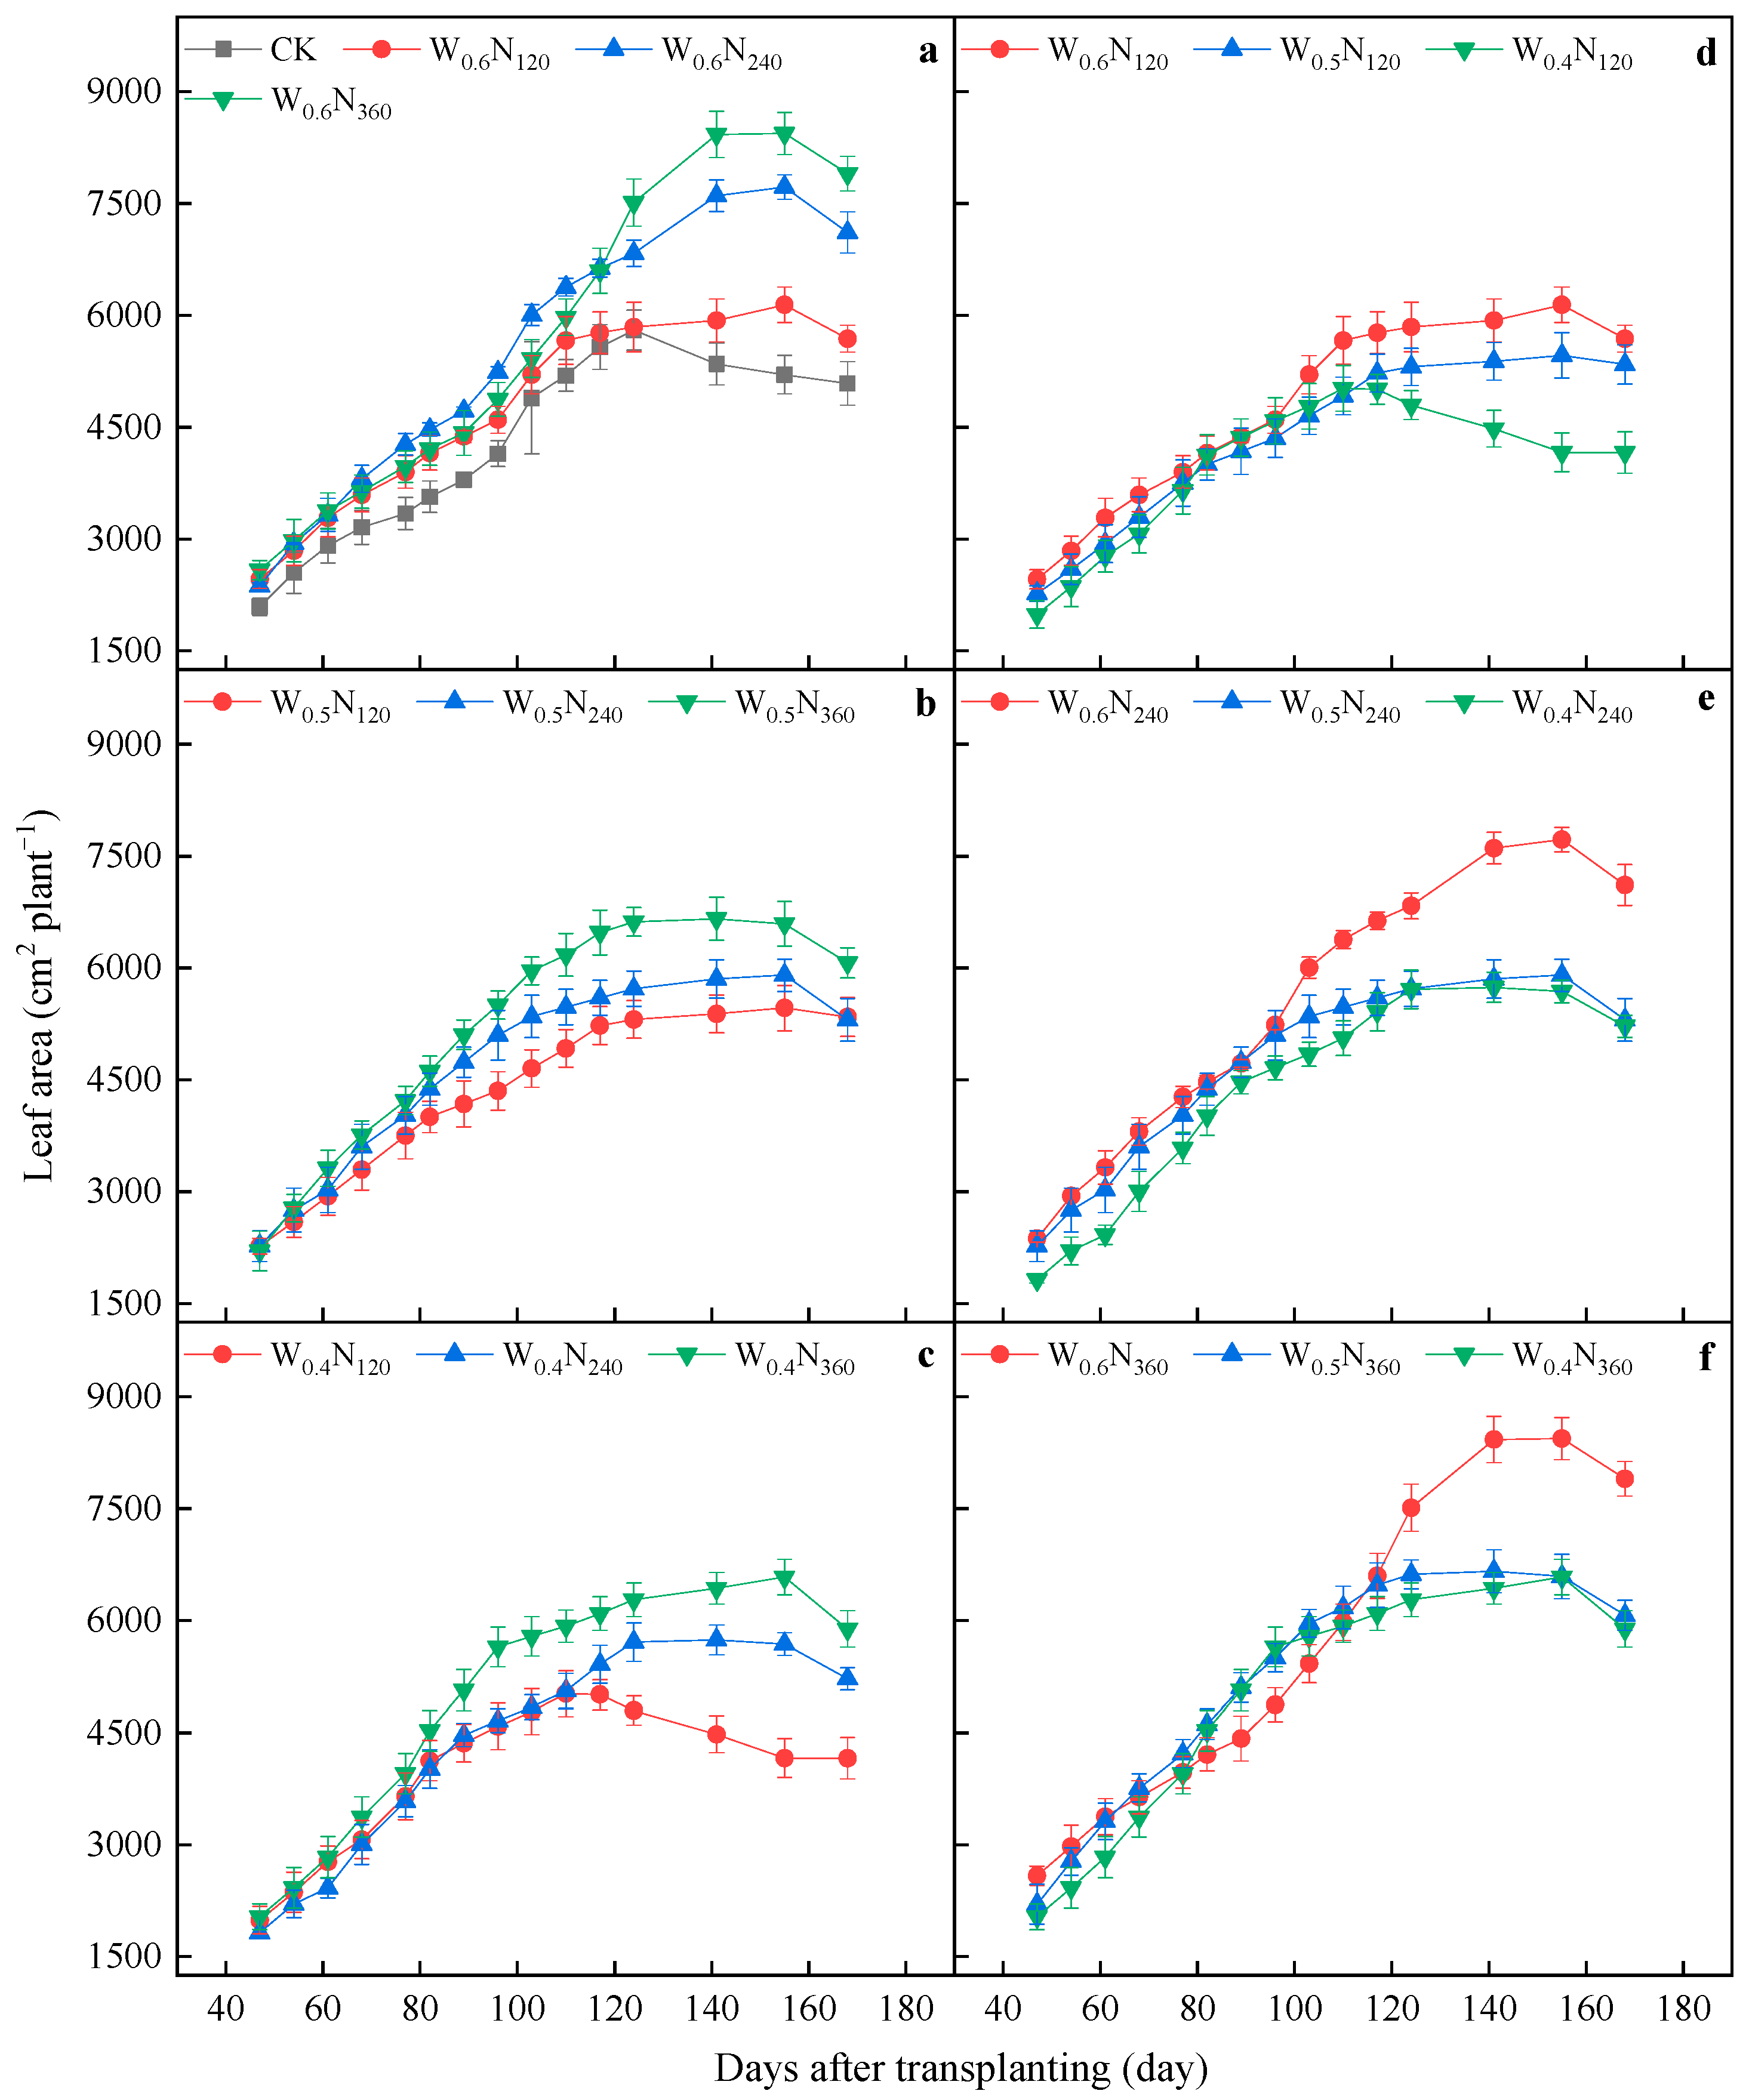
3.1. Growth Parameters

Figure 3 illustrates the dynamics of cotton plant height over time in 2020. When the topsoil layer was under W0.6, the plant height of cotton basically increased with the increase in N application rate, and the growth rate of the CK and N120 slowed down after 61 d while that of N240 and N360 slowed down after 71 d. When the topsoil layer was under W0.5, the growth rate of plant height was greater at N240 than at N120 and N360 from 41 to 82 d, but after 82 d, N360 accelerated and finally exceeded N240. This pattern of change was more notable under W0.4. Unlike the significant differences among N application rates under the same topsoil water conditions, the differences among topsoil water conditions at the same N application rate were not significant, except for N360. At N360, the plant height of W0.6 was greater than that of W0.5 and W0.4 until 82 d after transplanting, whereas W0.4 showed a substantial increase in growth rate from about 61 d and finally arrived at the same plant height as W0.6 and W0.5. The dynamics of cotton plant height over time in 2021 (Figure 4) were broadly similar to those in 2020, but with some differences, i.e., the early plant height was slightly higher under W0.5 than under W0.6 at N240 and N360, and there was a tendency that the drier the topsoil layer, the lower the final plant height.
Figure 5 presents the dynamics of the cotton leaf area in 2020. When the topsoil layer was under W0.6, the leaf area grew fastest at N360 during the first 66 d and then slowed down, and at this time, the cotton leaf area at CK, N120, and N240 began to increase rapidly and reached the same value as that of N360 near 90 d, after which the leaf area of N240 and N360 continued to show a significant increase. In contrast, the leaf area divergence across N rates under W0.5 and W0.4 appeared relatively late, which was consistent with the dynamics of cotton plant height in 2020 (Figure 3a–c), but the relative magnitude of leaf area across treatments was the same as under W0.6. The leaf area of W0.6 was normally larger than that of W0.5 and W0.4, and the leaf area divergence across topsoil water conditions at N120 and N240 appeared later than at N360. For the dynamics of the cotton leaf area in 2021 (Figure 6), under the same topsoil water condition, the leaf area size of each N rate showed CK < N120 < N240 < N360, and at the same N rate, the leaf area of W0.6 was normally larger than that of W0.5 and W0.4, especially in the later stage of the experiment.
According to Table 1, the effects of topsoil water condition, N rate, and their interaction on Pn and Tr at the flowering stage were not significant. However, the effect of the year on Pn or Tr was significant. This was mainly due to the large difference in sowing and transplanting dates between the two years of the trial. Trends in plant height and leaf area in both years also indicated that the difference between these two growing seasons was very large.

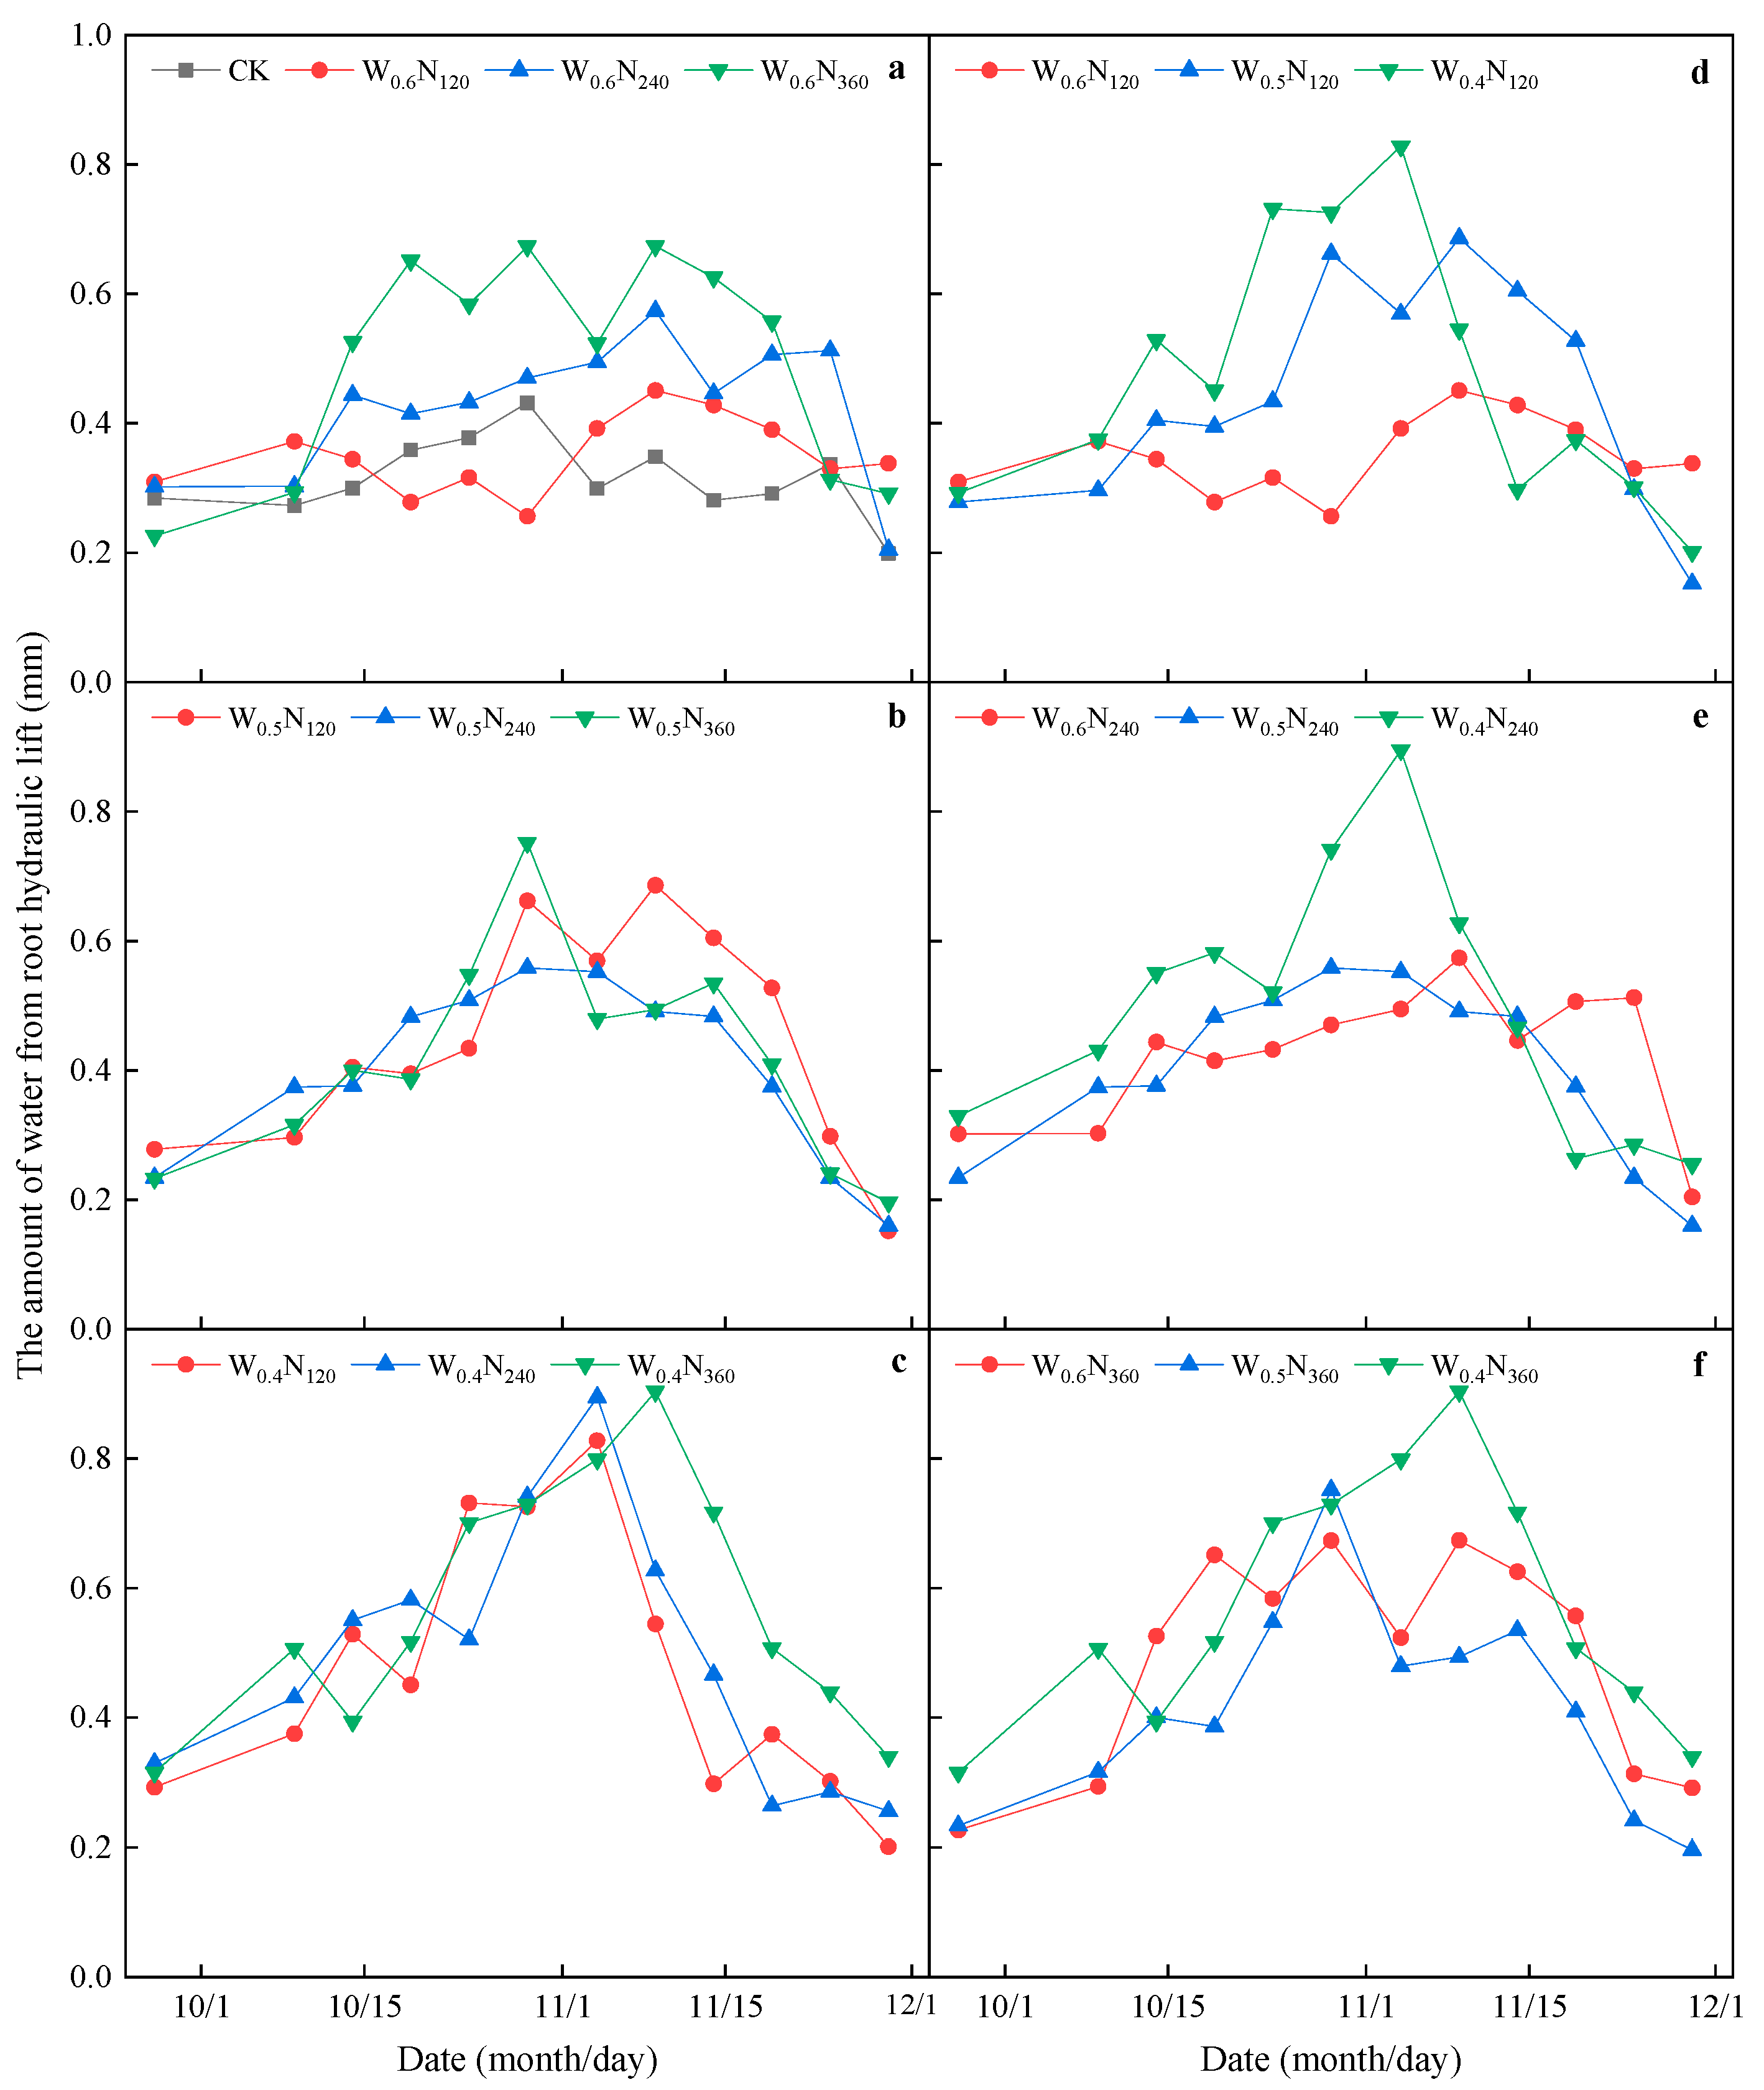
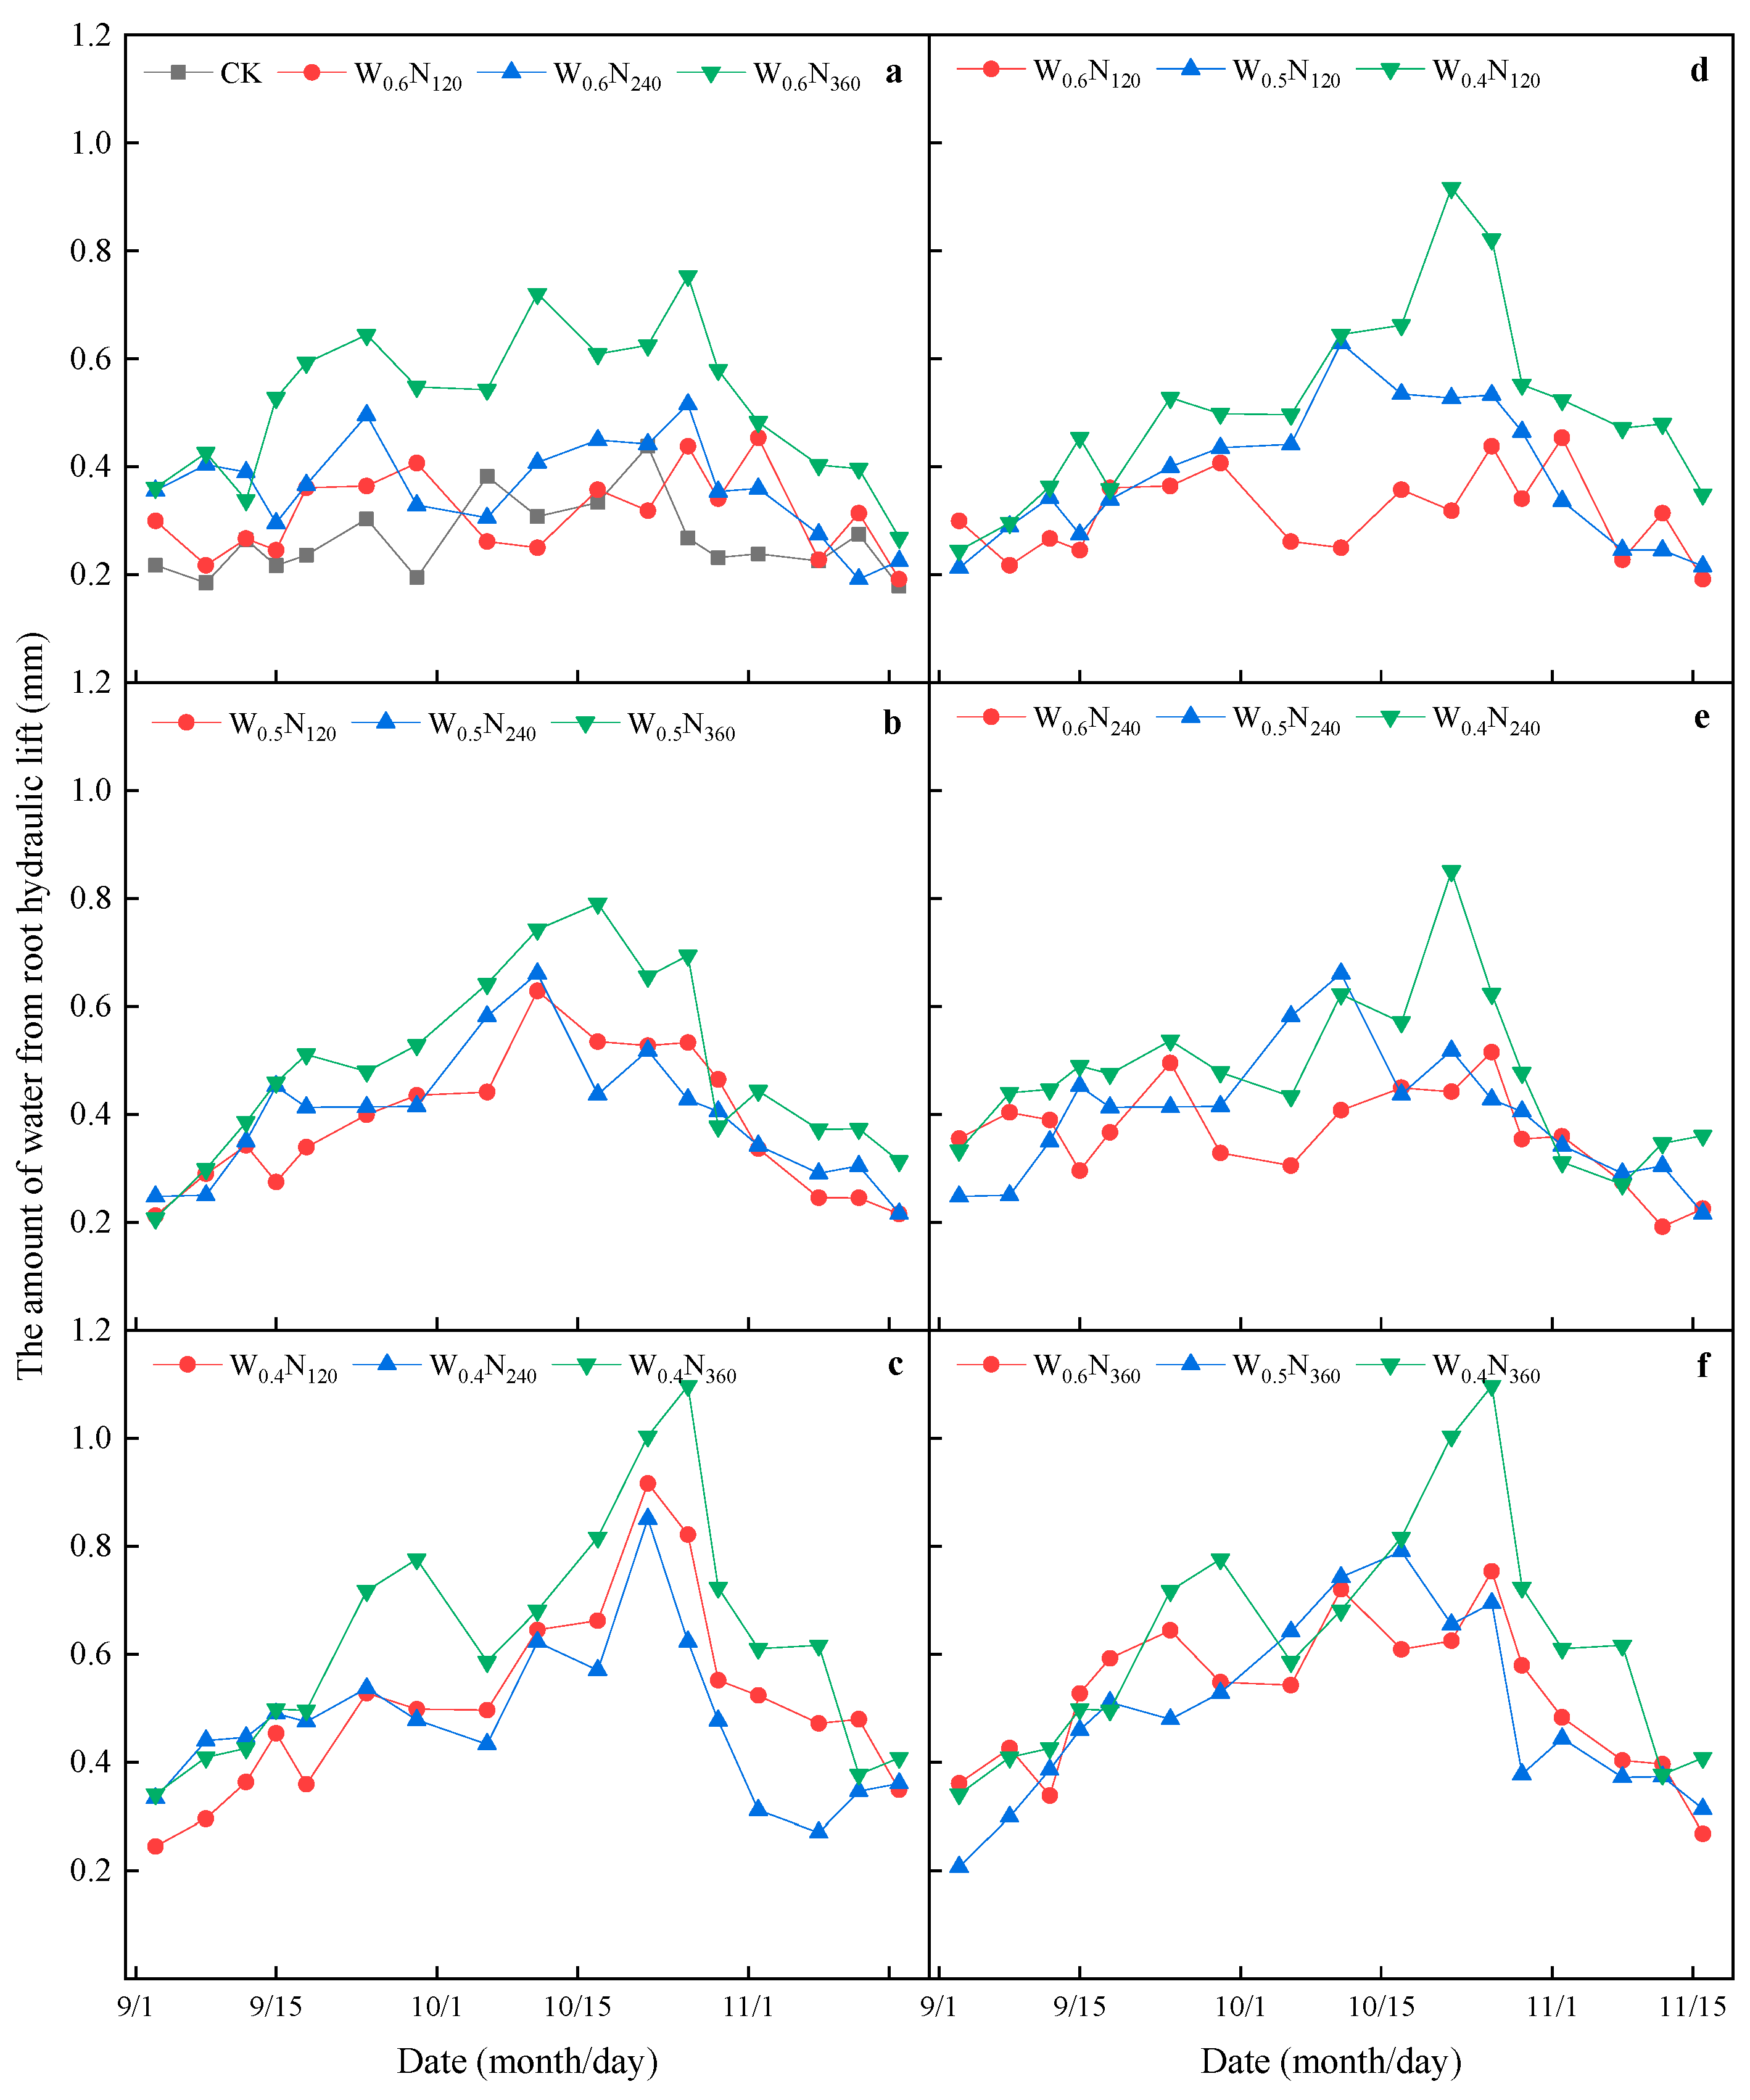
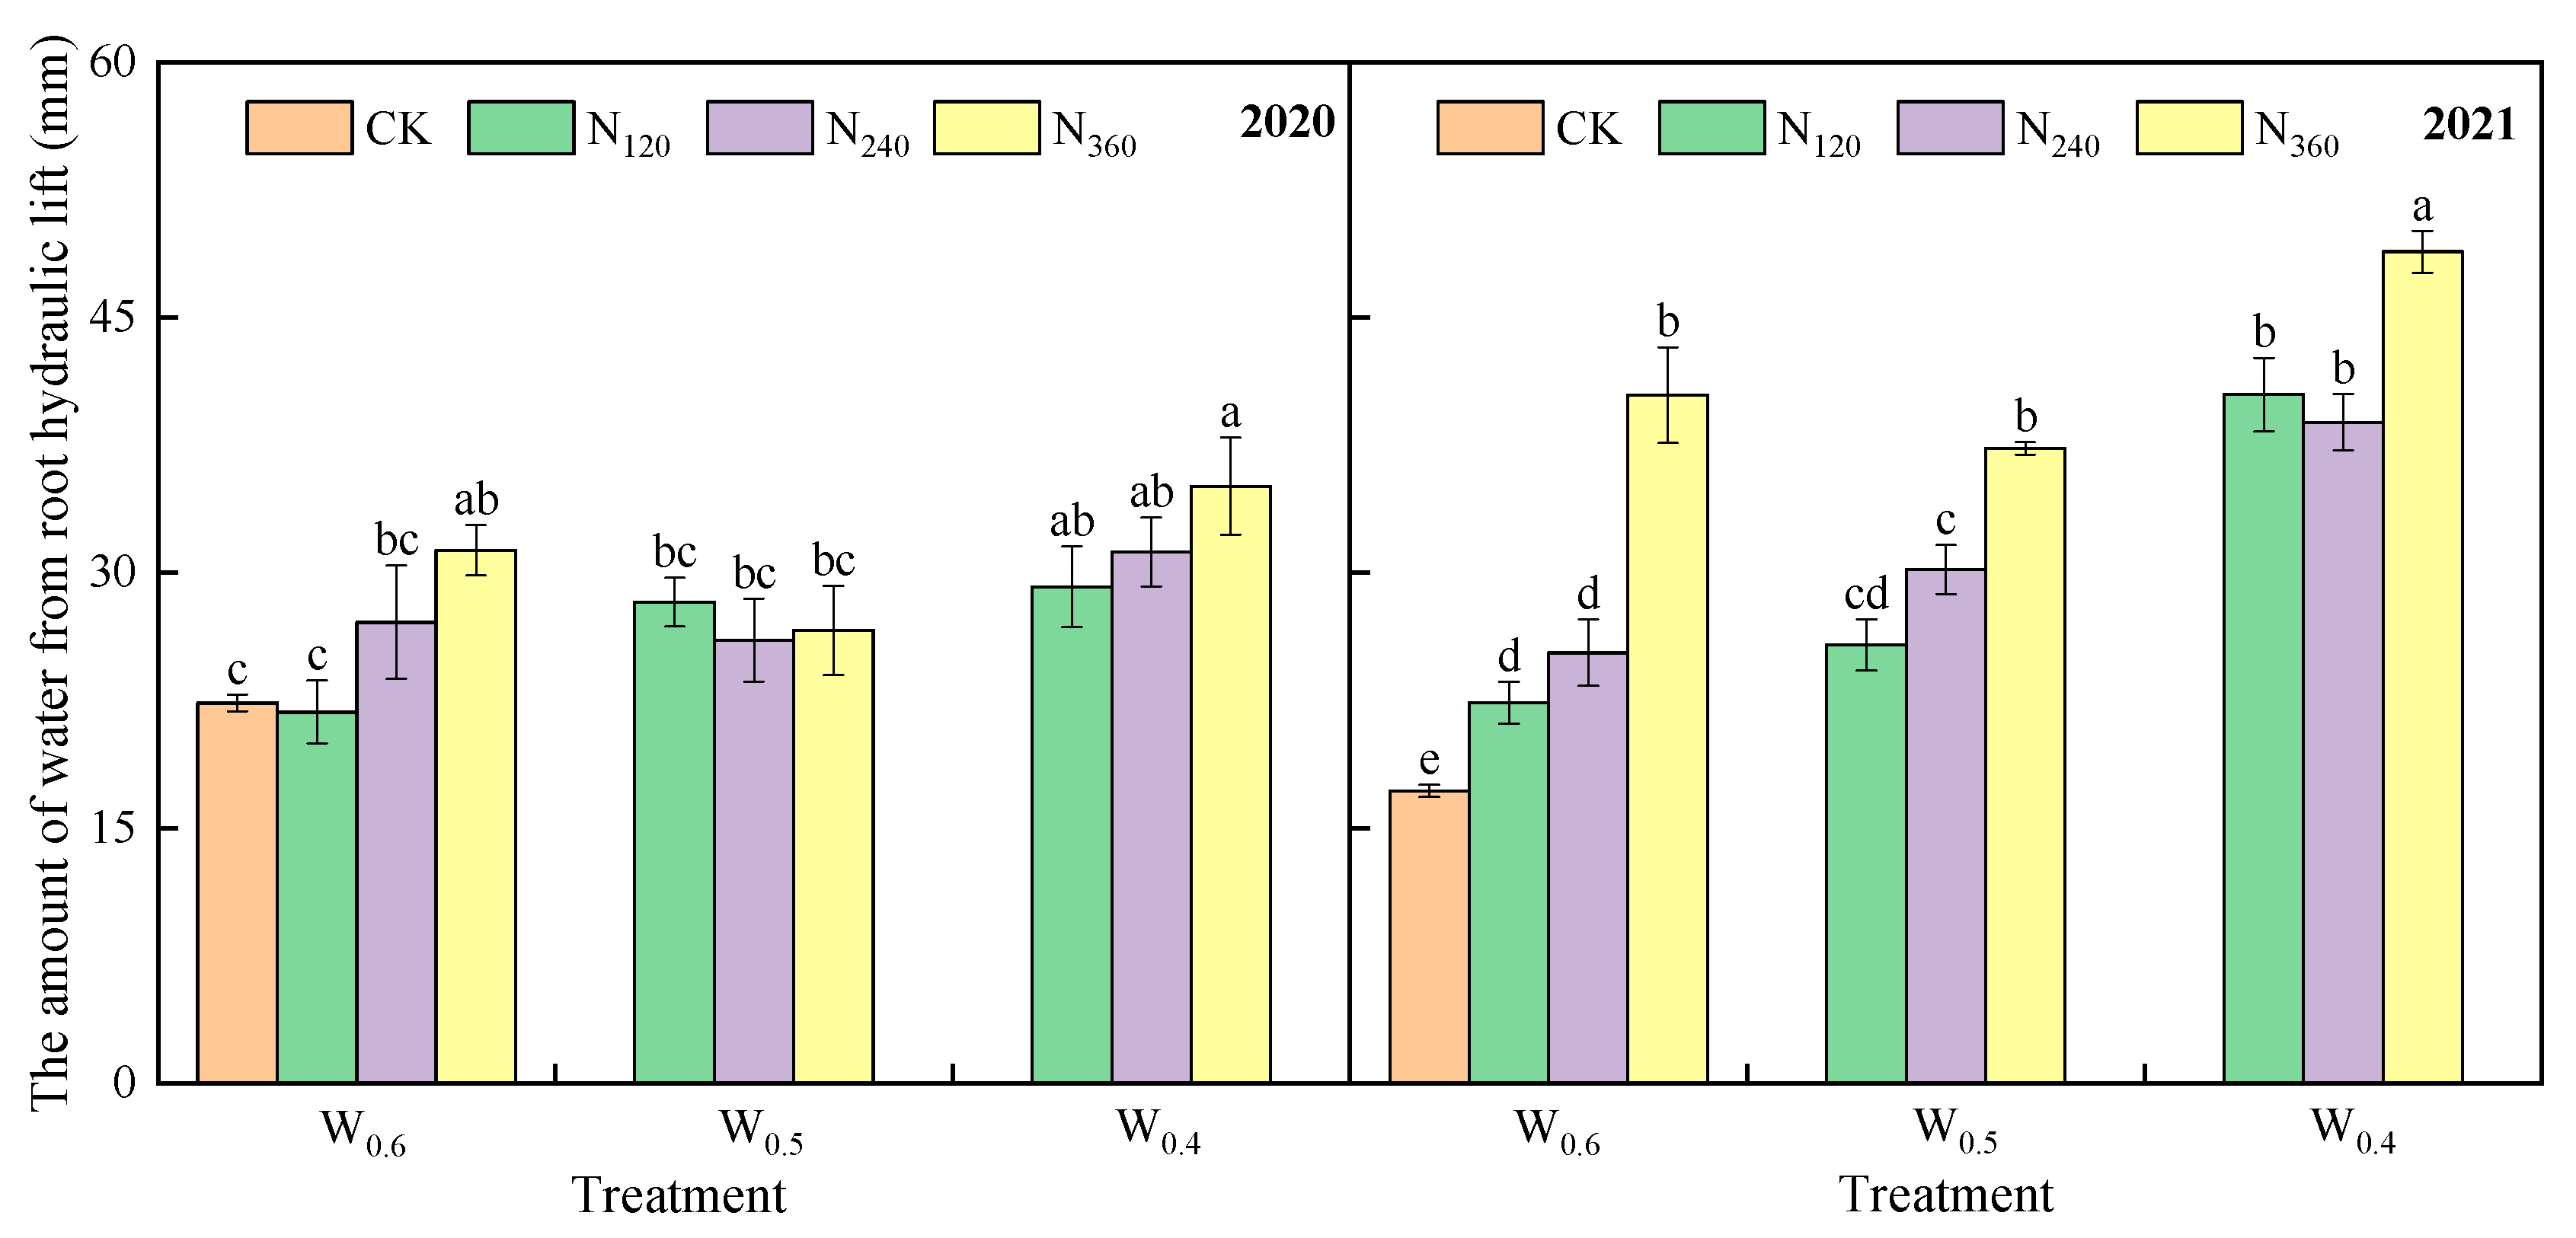
3.2. Root Hydraulic Lift and Root Morphological Characteristics

Figure 7 displays the changes in the amount of water from HL during the observation period in 2020. Generally, the HL water amount of all treatments increased gradually and then continued to decline. When the topsoil layer was under W0.6, there was a trend that the more N applied, the more the HL water amount except for CK in the mid-observation period (Figure 7a). In contrast, relatively high variability of HL water amount during the observation period was shown at N120 and N360 under W0.5, but the difference among N rates was small under W0.5 (Figure 7b). The greatest magnitude of changes in HL water amount of each N rate appeared under W0.4, and the order of HL water amount was roughly N120 < N240 < N360 (Figure 7c). For the variation of HL water amount under different topsoil water conditions (see Figure 7d–f), there was a trend that the drier the topsoil at N120 and N240, the greater the amount of HL water in the early stage of observation, and at N360 the HL water amount was generally high under all topsoil water conditions.
Data in Figure 8 suggest that changes in HL water amounts were approximately similar to those in 2020 throughout the test period. Differently, under W0.4, the order of HL water amount was roughly N120 < N240 < N360 in the early stage of observation and N240 < N120 < N360 in the late stage of observation, and the HL was significantly enhanced at N360 (Figure 8c). In addition, the amount of HL water under different topsoil water conditions at the same N rate did not differ much at the beginning and the end of the test, and the highest amount of HL water at any N rate was gained under W0.4 at the middle of the test. It was noted that at the same N rate, the HL water amount peaked later under W0.4 than W0.6 and W0.5, which may be due to the fact that a higher degree of dryness in the topsoil layer had a stronger inhibitory effect on shallow root growth and water release.
By linearly interpolating the amount of HL water measured on each two adjacent time points, the amount of HL water for the whole test period was roughly calculated (Figure 9). The results of the two-year experiment showed that the effects of year, topsoil water condition, N rate, year × water, year × N rate, and water × N rate on the total HL water amount were significant (Table 2). When the same N rate was applied, the highest total HL water was obtained under W0.4, and the amount of total HL water basically showed an increasing trend with the increase in topsoil dryness. In 2020, when the topsoil water condition was under W0.4 or W0.6, the amount of total HL water showed a decreasing trend as the N rate decreased, but there was no difference among different N rates under W0.5. In 2021, the amount of total HL water at N360 was the highest under all topsoil water conditions, but no significant difference was found between the amount of total HL water at N120 and N240.
Roots are the most active organs in plants for absorbing water and nutrients. The root morphology characteristics, including total root length, root surface area, and root volume, would change in response to changes in the external growing environment. The effects of topsoil water condition, N rate, year × water, and water × N rate on root length were significant (Table 3). When the N rate was N120, the topsoil water condition did not affect root length, but when the N rate was N240 or N360, the total root length decreased as the topsoil water condition became poor. In 2020, under any given designed topsoil water condition, total root length did not change depending on the N rate except for promotion by W0.6N360 relative to CK. However, in 2021, root length at N240 or N360 was significantly improved compared to root length at N120 or CK when W0.6 was applied.
Year, topsoil water condition, and N rate had significant effects on root surface area (Table 3). When the topsoil water condition was the same, there was no difference in root surface area among the three N rates in 2020. When the N rate was N120, the root surface area of W0.6 was significantly greater than those of W0.5 and W0.4, and when the N rate was N240, the root surface area of W0.4 was significantly lower than that of W0.6. In 2021, when W0.6 was applied, root surface area increased with increasing N rate, but no difference was found under W0.5 or W0.4. At N360, the root surface area under W0.6 was significantly higher than those under W0.5 and W0.4. And when the N rate was N240, the root surface area of W0.4 was significantly lower than that of W0.6.
The effects of topsoil water condition and N rate on root volume were significant (Table 3). When topsoil water condition was the same, there was no significant difference among the three N rates except for a greater root volume of W0.4N360 relative to W0.4N120, and when the N rate was the same, there was no significant difference among three topsoil water conditions in 2020. In 2021, the root volume at N360 was greater than those at N120 and N240 under W0.6, and the root volume at N360 was greater than that at N120 under W0.5. The root volume of W0.6N360 was the greatest.

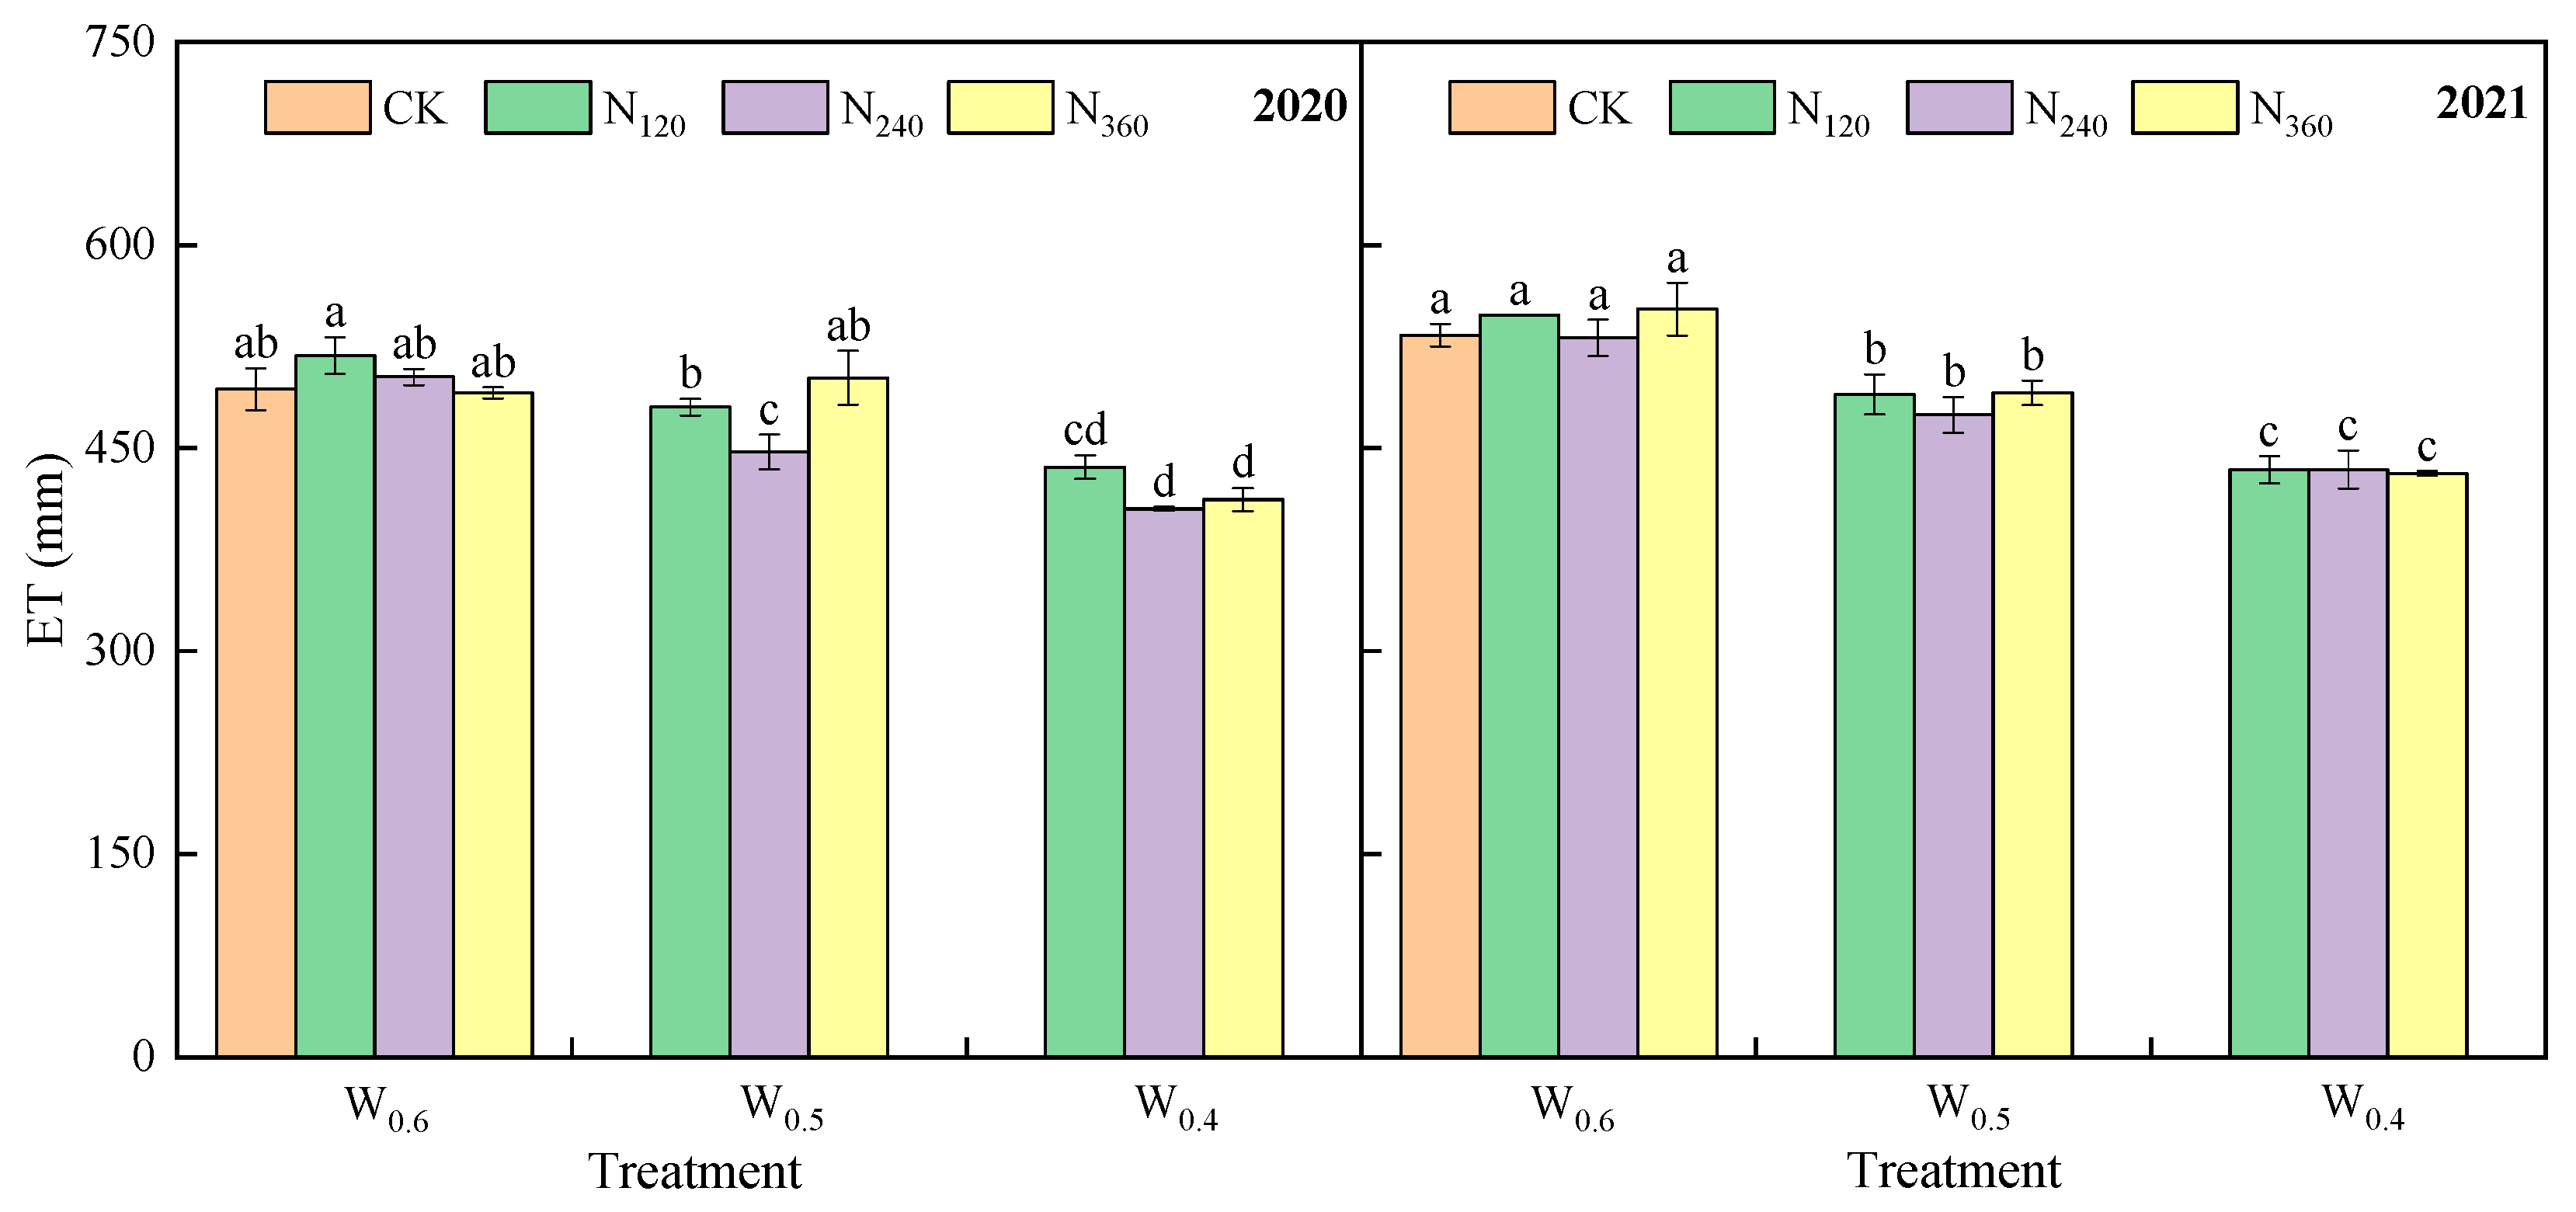
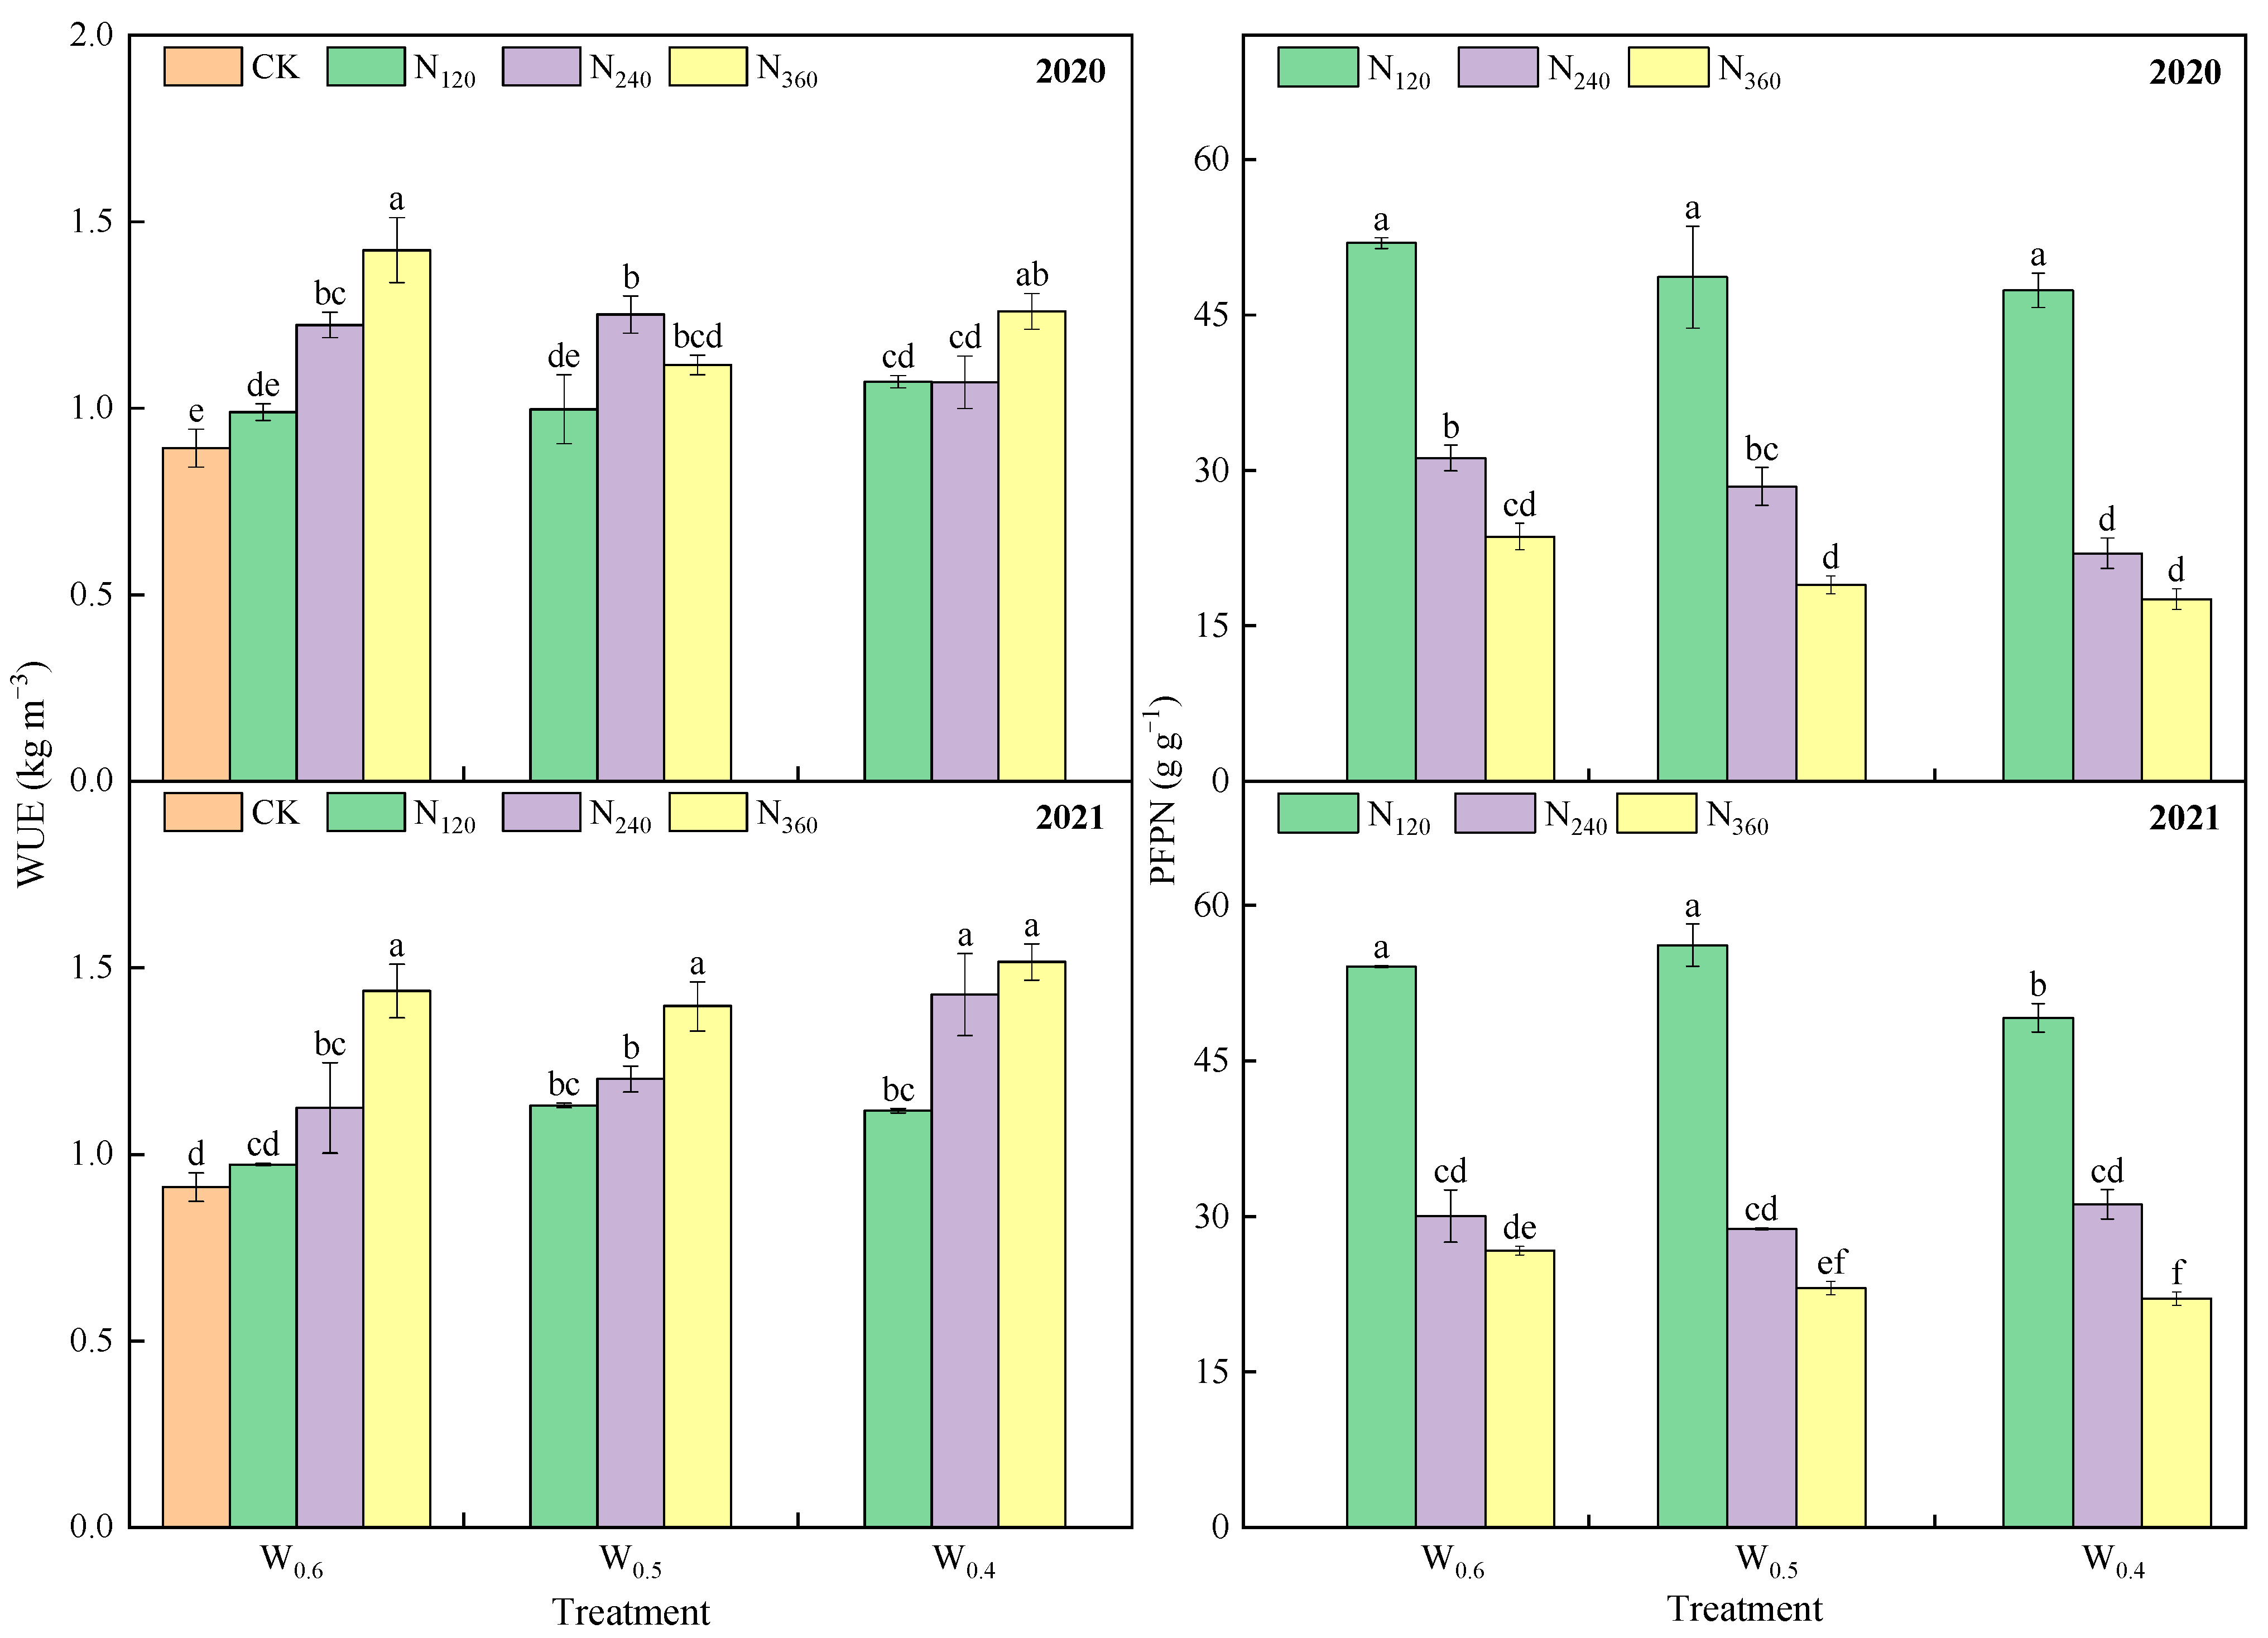
3.3. Yield, WUE, and PFPN

Year, topsoil water condition, N rate, year × water, water × N rate, and year × water × N rate had significant effects on seed cotton yield (Table 4). In 2020, under W0.6, seed cotton yield increased with the increasing N rate, but under W0.5 and W0.4, there was no significant difference in seed cotton yield among all N rates. However, in 2021, seed cotton yield increased with the increasing N rate under all topsoil water conditions, and seed cotton yield at N360 was significantly higher than at N120 and N240 under W0.6 and W0.5 while seed cotton yield at N360 and N240 were significantly higher than at N120 under W0.4. In addition, seed cotton yield tended to decrease with increasing topsoil dryness at N240 and N360 in 2020 and N360 in 2021.
The effects of year, topsoil water condition, N rate, and year × water on lint cotton yield were significant (Table 4). In 2020, lint cotton yield tended to decrease as topsoil became drier except at N120. In addition, under W0.6 and W0.5, lint cotton yield increased with the increasing N rate, but under W0.4, there was no significant difference among all N rates, and the lint cotton yield of all treatments was higher than that of CK. In 2021, lint cotton yield was less influenced by topsoil water conditions, but there was an obvious increasing trend in lint cotton yield as the N rate increased under all topsoil conditions. The highest lint cotton yield was obtained with W0.6N360, and the lowest was roughly obtained with CK or W0.4N120.
Lint percentage was not significantly affected by topsoil water conditions or N rate (Table 4). Cotton lint percentage in 2020 and 2021 ranged from 36.89% to 42.48%. When the W0.5N240 or CK was applied, the lint percentage achieved the highest value in 2021. However, in 2020, there was no significant difference among treatments. It appeared that the differences in lint percentage among treatments had little effect on lint cotton yield.
The ET in the full life cycle of cotton in 2020 and 2021 were examined to analyze the effect of water and N regulation on cotton ET under dry topsoil conditions, as summarized in Figure 10. Overall, year, topsoil water condition, and N rate significantly affected cotton ET, whereas the interaction between topsoil water condition and N rate showed a nonsignificant effect on ET (Table 5). In 2020, at a given designed N rate, ET decreased with the increasing topsoil dryness, and under W0.6 and W0.4, the differences among N rates in ET were not significant, whereas under W0.5, ET at N240 was significantly lower than those at N120 and N360. In 2021, as the topsoil became drier, the ET throughout the growth stages showed an obvious decreasing trend, but with the increase in the N rate, the differences in the ET of cotton were relatively small.
Since WUE and PFPN reflect the relationship between crop consumption of water and N fertilizer and yield, the WUE and PFPN for treatments in 2020 and 2021 were investigated and compared (see Figure 11). The effects of year, N rate, year × water, water × N rate, and year × water × N rate on WUE were significant (Table 5). When the W0.6 was applied, cotton WUE trended upward with more N rate in topsoil in 2020. This trend was obvious under any given designed topsoil water condition in 2021. The increase in N rate under W0.6 increased the WUE of cotton, which increased by 10.77%, 36.98%, and 59.45% in 2020 and increased by 6.59%, 23.08%, and 58.24% in 2021 at N120, N240, and N360, respectively, compared to CK.
Year, topsoil water condition, and N rate had significant effects on PFPN (Table 5). In terms of N rate, the PFPN data reported the exact opposite of the WUE data, i.e., a decreasing trend with an increasing N rate. In 2020, the effect of topsoil water conditions on PFPN was not significant at N120 or N360, but at N240, the PFPN under W0.4 was significantly lower than those under W0.6 and W0.5. However, in 2021, the effect of topsoil water condition on PFPN was not significant at N240, but at N120, the PFPN under W0.4 was significantly lower than those under W0.6 and W0.5, and at N360, the PFPN under W0.4 was significantly lower than that under W0.6.

4. Discussion

In areas or periods of low precipitation, the topsoil layer would sometimes saturate (because of precipitation or irrigation) and always dry up (because of heat and wind) compared to the subsoil layer [7]. This study investigated the effects of water and N regulation on cotton growth and HL under dry topsoil conditions using the specially constructed split-root system.
Understanding the growth dynamics of cotton plants is essential for balancing water conservation and N reduction as well as root HL enhancement. The results showed that cotton plant height and leaf area increased with increasing N application under the same topsoil water condition, but relatively small differences existed among topsoil water conditions at the same N application rate except for leaf area in 2021 (Figure 3, Figure 4, Figure 5 and Figure 6). These may be due to the fact that the N content of the topsoil increased with the increase in N rate, which promoted the growth and development of early root tips and N uptake and utilization by shallow roots [31], while the subsoil layer set up in this study was deeper than the topsoil layer, somewhat mitigating the effects of topsoil dryness on cotton. Particularly, the sharp increase in plant height at N360 and the leaf area divergence across N rates under W0.5 or W0.4 appeared later, but the plant height and leaf area of N360 finally became the highest. These may be related to the inhibited N uptake resulting from declined root productivity in topsoil from higher N application under severe water deficit conditions in the early stages [32], and the relief of restricted root systems and the improvement of topsoil water condition via HL when cotton roots rooted into moist subsoil at a later stage. The latter may also explain why the plant height and leaf area of W0.4N360 were first lower than those of W0.6N360 and W0.5N360 and then gradually increased to nearly the same plant height and leaf area.
As a desirable process, HL would improve the water adsorption efficiency in deep roots, provide additional water to enhance plant transpiration rates, and increase the rate of N mineralization in topsoil [19,20]. HL is influenced by differences in water potential between root and soil systems, and any force driving differences in water potential, such as the depth and vertical distribution of roots, may alter HL [18,33]. In this study, as the root system entered the moist subsoil at progressively longer depths and greater densities, the amount of water lifted hydraulically by the deep roots became greater, promoting water release from shallow roots to the drier topsoil and growth of shallow roots. On the contrary, in the later stages of cotton growth, deep roots began to senesce and draw relatively less water from the subsoil, limiting water release and the viability of shallow roots [16]. In turn, gaps may form in the root–soil interface, further compromising water release. However, it was reasonable that the senescence of shallow roots and a decrease in new root growth could also reduce net outward flow [21].
Prior work has observed that root HL occurred at night when the water content of the center compartment was reduced to a certain level, and the drier the soil, the greater the amount of water lifted [15]. In contrast to the lateral water transfer from the root system, the present study investigated the vertical water transfer and obtained the same conclusion. In addition, it was shown that the more N applied, the greater the HL water amount, which was in general agreement with the study of Shen and Li [34]. Briefly, both mentioned results were related to the larger water potential difference between the topsoil and the cotton shallow root system. Additionally, the morphological characteristics of the root system as affected by water conditions and N rate can also affect HL. It was reported that micro-meteorological conditions such as air temperature, relative humidity, and the vapor pressure deficit also influenced HL [20]. The combined effects of water and N treatments, dynamics of root development, and micro-meteorological factors are complex, which may have contributed to some fluctuations in the observed results (Figure 7 and Figure 8). Although the later monitoring of HL and the neglect of nighttime evapotranspiration may have resulted in the underestimated amount of HL water throughout the test period relative to actual values, the rough estimate indicated that topsoil water condition and N rate both had significant effects on total HL water amount, suggesting that potential for cotton root HL can be regulated by optimizing water and N supply. Further, control of the relative depths of the dry topsoil layer and the moist subsoil layer may also have an impact on the amount of HL water. This needs to be explored in the future.
In this study, the significantly lower cotton yields in 2020 than in 2021 should be related to the delay in sowing and transplanting cotton because of the coronavirus pandemic. For treatments, our current findings that seed cotton yield and lint cotton yield tended to decrease with increasing dryness and increase with higher N rate were compatible with the common sense that cotton yields are strongly influenced by water and N availability, and yields can increase with increasing water and N supply within a certain range [35]. Significantly, the seed and lint cotton yield of W0.6N360 in 2020 and 2021 were significantly higher than that of W0.5N360 or W0.4N360, but the differences between W0.5N360 and W0.4N360 were not significant except for lint cotton yield in 2021. These insignificant differences between W0.5N360 and W0.4N360 can be partly attributed to the promotion of cotton growth and yield formation by the relatively large amount of HL water of W0.4N360 and partly to the compensation of the negative effect of dryness by a deeper and moist subsoil layer. After all, an increased HL water amount may mean more effective replenishment of topsoil water.
The ET throughout all growth stages showed a clear decreasing trend with increasing dryness in topsoil and small differences among N rates. The WUE and PFPN data obtained under different irrigation and N levels could be used to guide irrigation and fertilization management. It was shown that the WUE of cotton increased with more severe dryness or more N rate in topsoil, which was supported by various reports [36,37,38,39,40], while PFPN did the opposite. Our measured WUE was relatively high in comparison with these findings, which may be related to the less soil water evaporation from the dry topsoil layer, the facilitation of HL by the moist subsoil layer, and the promoted transfer of water to crop water use (more transpiration) [41] achieved by water storage in the topsoil layer [42]. Rational N application would be beneficial to the environment, and improving N use efficiency is important [43]. The decrease in PFPN with increasing N rate or dryness in topsoil was easy to understand when combined with the definition of PFPN and the response of seed cotton yield to water and N treatments. It was noted that although the PFPN was much lower at N240 and N360 compared to at N120 (Figure 11), the N240 and N360 were a great help for the HL of cotton roots on the whole, especially the N360 (Figure 7, Figure 8 and Figure 9). Therefore, a balance should be struck between the contribution of increased N fertilization to HL enhancement and the resulting reduction in PFPN, while the economic and environmental impacts of N fertilizer losses should also be considered [44].
In addition, it should be noted that this experiment was conducted in a plastic greenhouse, which may be different from the field environment. Another limitation, given some differences in plant management practices between the two years in this study, is that this study was only a two-year continuous experiment. It is necessary to continue the experiment for several more years.

5. Conclusions

Cotton plant height and leaf area increased with increasing N rate, but the differences among topsoil water conditions were relatively small, except for leaf area in 2021. The sharp increase in plant height at N360 and the leaf area divergence across N rates under W0.5 or W0.4 appeared later. During the observation period, the HL water amount of all treatments increased gradually and then continued to decline. There was a trend that the drier the topsoil or, the more N applied, the greater the amount of HL water, and the topsoil water condition and N rate both had significant effects on the total HL water amount and root morphological characteristics (root length, root surface area, and root volume). Seed cotton yield and lint cotton yield tended to decrease with increasing dryness at N240 or N360, except for lint yield in 2021 and increased with higher N rates, especially under W0.6. Lint percentage was not significantly affected by topsoil water condition or N rate. As the topsoil became drier, the ET throughout the whole growth stages showed a decreasing trend, while with the increase in N rate, ET showed small differences. The WUE of cotton increased with more N rate in topsoil, while PFPN did the opposite. Moreover, the PFPN under W0.4 was significantly lower than that under W0.6 at N240 or N120.

Author Contributions

Conceptualization, K.Z. and G.S.; methodology, J.L.; formal analysis, Y.G.; investigation, Z.W.; data curation, K.Z. and Z.W.; writing—original draft preparation, Z.W.; writing—review and editing, Z.W. and K.Z.; visualization, Z.W. and K.Z.; supervision, G.S. and J.L.; funding acquisition, G.S. and J.L. All authors have read and agreed to the published version of the manuscript.

Funding

This research was funded by the National Nature Science Foundation of China (Grant No. 51879072 and 52309045).

Data Availability Statement

Data are contained within the article.

Acknowledgments

The authors would like to thank Yue Hu, Yi Wang, Yi Xu, Enze Song, and Zhibo Sun for their help in the experiment.

Conflicts of Interest

Author Kun Zhang was employed by the company Changjiang Survey, Planning, Design and Research Co., Ltd., Wuhan, China. The remaining authors declare that the research was conducted in the absence of any commercial or financial relationships that could be construed as a potential conflict of interest.

References

  1. Wheeler, T.; von Braun, J. Climate Change Impacts on Global Food Security. Science 2013, 341, 508–513. [Google Scholar] [CrossRef] [PubMed]
  2. Armstrong McKay, D.I.; Staal, A.; Abrams, J.F.; Winkelmann, R.; Sakschewski, B.; Loriani, S.; Fetzer, I.; Cornell, S.E.; Rockström, J.; Lenton, T.M. Exceeding 1.5 °C Global Warming Could Trigger Multiple Climate Tipping Points. Science 2022, 377, eabn7950. [Google Scholar] [CrossRef] [PubMed]
  3. Lesk, C.; Coffel, E.; Winter, J.; Ray, D.; Zscheischler, J.; Seneviratne, S.I.; Horton, R. Stronger Temperature–Moisture Couplings Exacerbate the Impact of Climate Warming on Global Crop Yields. Nat. Food 2021, 2, 683–691. [Google Scholar] [CrossRef] [PubMed]
  4. Li, R.; Tsunekawa, A.; Tsubo, M. Assessment of Agricultural Drought in Rainfed Cereal Production Areas of Northern China. Theor. Appl. Climatol. 2017, 127, 597–609. [Google Scholar] [CrossRef]
  5. Wei, W.; Pang, S.; Wang, X.; Zhou, L.; Xie, B.; Zhou, J.; Li, C. Temperature Vegetation Precipitation Dryness Index (TVPDI)-Based Dryness-Wetness Monitoring in China. Remote Sens. Environ. 2020, 248, 111957. [Google Scholar] [CrossRef]
  6. Xu, M.; Yao, N.; Hu, A.; Gustavo Goncalves De Goncalves, L.; Abrahão Mantovani, F.; Horton, R.; Heng, L.; Liu, G. Evaluating a New Temperature-Vegetation-Shortwave Infrared Reflectance Dryness Index (TVSDI) in the Continental United States. J. Hydrol. 2022, 610, 127785. [Google Scholar] [CrossRef]
  7. Uddin, S.; Löw, M.; Parvin, S.; Fitzgerald, G.J.; Tausz-Posch, S.; Armstrong, R.; O’Leary, G.; Tausz, M. Elevated [CO2] Mitigates the Effect of Surface Drought by Stimulating Root Growth to Access Sub-Soil Water. PLoS ONE 2018, 13, e0198928. [Google Scholar] [CrossRef]
  8. Abdelraheem, A.; Esmaeili, N.; O’Connell, M.; Zhang, J. Progress and Perspective on Drought and Salt Stress Tolerance in Cotton. Ind. Crops Prod. 2019, 130, 118–129. [Google Scholar] [CrossRef]
  9. Yang, Z.; Qanmber, G.; Wang, Z.; Yang, Z.; Li, F. Gossypium Genomics: Trends, Scope, and Utilization for Cotton Improvement. Trends Plant Sci. 2020, 25, 488–500. [Google Scholar] [CrossRef]
  10. Kautz, T.; Amelung, W.; Ewert, F.; Gaiser, T.; Horn, R.; Jahn, R.; Javaux, M.; Kemna, A.; Kuzyakov, Y.; Munch, J.-C.; et al. Nutrient Acquisition from Arable Subsoils in Temperate Climates: A Review. Soil Biol. Biochem. 2013, 57, 1003–1022. [Google Scholar] [CrossRef]
  11. Zhang, H.; Khan, A.; Tan, D.K.Y.; Luo, H. Rational Water and Nitrogen Management Improves Root Growth, Increases Yield and Maintains Water Use Efficiency of Cotton under Mulch Drip Irrigation. Front. Plant Sci. 2017, 8, 912. [Google Scholar] [CrossRef] [PubMed]
  12. Xie, T.; Shan, L. Water Stress and Appropriate N Management Achieves Profitable Yields and Less N Loss on Sandy Soils. Arid Land Res. Manag. 2021, 35, 358–373. [Google Scholar] [CrossRef]
  13. Hou, X.; Xiang, Y.; Fan, J.; Zhang, F.; Hu, W.; Yan, F.; Guo, J.; Xiao, C.; Li, Y.; Cheng, H.; et al. Evaluation of Cotton N Nutrition Status Based on Critical N Dilution Curve, N Uptake and Residual under Different Drip Fertigation Regimes in Southern Xinjiang of China. Agric. Water Manag. 2021, 256, 107134. [Google Scholar] [CrossRef]
  14. Amenu, G.G.; Kumar, P. A Model for Hydraulic Redistribution Incorporating Coupled Soil-Root Moisture Transport. Hydrol. Earth Syst. Sci. 2008, 12, 55–74. [Google Scholar] [CrossRef]
  15. Baker, J.M.; Bavel, C.H.M. Water Transfer through Cotton Plants Connecting Soil Regions of Differing Water Potential. Agron. J. 1988, 80, 993–997. [Google Scholar] [CrossRef]
  16. McMichael, B.L.; Lascano, R.J. Evaluation of Hydraulic Lift in Cotton (Gossypium hirsutum L.) Germplasm. Environ. Exp. Bot. 2010, 68, 26–30. [Google Scholar] [CrossRef]
  17. MuSa, A.; Zong, Q.; Niu, C. Hydraulic Lift Empirical Test among Native Plant Species in the Horqin Sandy Land, Northern China. J. Hydrol. Eng. 2013, 18, 439–445. [Google Scholar] [CrossRef]
  18. Wang, X.; Tang, C.; Guppy, C.N.; Sale, P.W.G. The Role of Hydraulic Lift and Subsoil P Placement in P Uptake of Cotton (Gossypium hirsutum L.). Plant Soil 2009, 325, 263–275. [Google Scholar] [CrossRef]
  19. Emerman, S.H.; Dawson, T.E. Hydraulic Lift and Its Influence on the Water Content of the Rhizosphere: An Example from Sugar Maple, Acer Saccharum. Oecologia 1996, 108, 273–278. [Google Scholar] [CrossRef]
  20. Hao, X.-M.; Chen, Y.-N.; Guo, B.; Ma, J.-X. Hydraulic Redistribution of Soil Water in Populus Euphratica Oliv. in a Central Asian Desert Riparian Forest. Ecohydrology 2013, 6, 974–983. [Google Scholar] [CrossRef]
  21. Ishikawa, C.M.; Bledsoe, C.S. Seasonal and Diurnal Patterns of Soil Water Potential in the Rhizosphere of Blue Oaks: Evidence for Hydraulic Lift. Oecologia 2000, 125, 459–465. [Google Scholar] [CrossRef]
  22. Shen, Y.; Zhang, Y.; Li, S. Nutrient Effects on Diurnal Variation and Magnitude of Hydraulic Lift in Winter Wheat. Agric. Water Manag. 2011, 98, 1589–1594. [Google Scholar] [CrossRef]
  23. IUSS Working Group WRB. International soil classification system for naming soils and creating legends for soil maps. In World Reference Base for Soil Resources, 4th ed.; International Union of Soil Sciences (IUSS): Vienna, Austria, 2022. [Google Scholar]
  24. Geng, Y.; Baumann, F.; Song, C.; Zhang, M.; Shi, Y.; Kühn, P.; Scholten, T.; He, J.S. Increasing temperature reduces the coupling between available nitrogen and phosphorus in soils of Chinese grasslands. Sci. Rep. 2017, 7, 43524. [Google Scholar] [CrossRef] [PubMed]
  25. Wang, H.D.; Wu, L.F.; Wang, X.K.; Zhang, S.H.; Cheng, M.H.; Feng, H.; Fan, J.L.; Zhang, F.C.; Xiang, Y.Z. Optimization of water and fertilizer management improves yield, water, nitrogen, phosphorus and potassium uptake and use efficiency of cotton under drip fertigation. Agric. Water Manag. 2021, 245, 106662. [Google Scholar] [CrossRef]
  26. Zhang, W.; Zhao, J.; Pan, F.J.; Li, D.J.; Chen, H.S.; Wang, K.L. Changes in nitrogen and phosphorus limitation during secondary succession in a karst region in southwest China. Plant Soil 2015, 391, 77–91. [Google Scholar] [CrossRef]
  27. Che, Z.; Wang, J.; Li, J. Effects of Water Quality, Irrigation Amount and Nitrogen Applied on Soil Salinity and Cotton Production under Mulched Drip Irrigation in Arid Northwest China. Agric. Water Manag. 2021, 247, 106738. [Google Scholar] [CrossRef]
  28. Wang, J.; Du, G.; Tian, J.; Zhang, Y.; Jiang, C.; Zhang, W. Effect of Irrigation Methods on Root Growth, Root-Shoot Ratio and Yield Components of Cotton by Regulating the Growth Redundancy of Root and Shoot. Agric. Water Manag. 2020, 234, 106120. [Google Scholar] [CrossRef]
  29. Hillel, D. Applications of Soil Physics; Academic Press, Inc.: New York, NY, USA, 1980; p. 385. [Google Scholar]
  30. Hou, X.H.; Fan, J.L.; Hu, W.H.; Zhang, F.C.; Yan, F.L.; Xiao, C.; Li, Y.P.; Cheng, H.L. Optimal Irrigation Amount and Nitrogen Rate Improved Seed Cotton Yield While Maintaining Fiber Quality of Drip-Fertigated Cotton in Northwest China. Ind. Crops Prod. 2021, 170, 113710. [Google Scholar] [CrossRef]
  31. Wang, T.; Wang, Z.; Zhang, J.; Ma, K. An Optimum Combination of Irrigation Amount, Irrigation Water Salinity and Nitrogen Application Rate Can Improve Cotton (for Fiber) Nitrogen Uptake and Final Yield. Ind. Crops Prod. 2022, 187, 115386. [Google Scholar] [CrossRef]
  32. Wu, B.; Zhang, L.; Tian, J.; Zhang, G.; Zhang, W. Nitrogen Rate for Cotton Should Be Adjusted According to Water Availability in Arid Regions. Field Crops Res. 2022, 285, 108606. [Google Scholar] [CrossRef]
  33. Yu, K.; D’Odorico, P. Climate, Vegetation, and Soil Controls on Hydraulic Redistribution in Shallow Tree Roots. Adv. Water Resour. 2014, 66, 70–80. [Google Scholar] [CrossRef]
  34. Shen, Y.F.; Li, S.Q. Effect of Fertilization Depth on Root Characteristics and Hydraulic Lift of Winter Wheat under Different Water Treatments. J. Northwest A&F Univ. (Nat. Sci. Ed.) 2019, 47, 65–73. (In Chinese) [Google Scholar] [CrossRef]
  35. Wang, H.; Wu, L.; Cheng, M.; Fan, J.; Zhang, F.; Zou, Y.; Chau, H.W.; Gao, Z.; Wang, X. Coupling Effects of Water and Fertilizer on Yield, Water and Fertilizer Use Efficiency of Drip-Fertigated Cotton in Northern Xinjiang, China. Field Crops Res. 2018, 219, 169–179. [Google Scholar] [CrossRef]
  36. Aujla, M.S.; Thind, H.S.; Buttar, G.S. Cotton Yield and Water Use Efficiency at Various Levels of Water and N through Drip Irrigation under Two Methods of Planting. Agric. Water Manag. 2005, 71, 167–179. [Google Scholar] [CrossRef]
  37. Chen, Z.K.; Niu, Y.P.; Zhao, R.H.; Han, C.L.; Han, H.Y.; Luo, H.H. The Combination of Limited Irrigation and High Plant Density Optimizes Canopy Structure and Improves the Water Use Efficiency of Cotton. Agric. Water Manag. 2019, 218, 139–148. [Google Scholar] [CrossRef]
  38. Kumar, R.; Pareek, N.K.; Kumar, U.; Javed, T.; Al-Huqail, A.A.; Rathore, V.S.; Nangia, V.; Choudhary, A.; Nanda, G.; Ali, H.M.; et al. Coupling Effects of Nitrogen and Irrigation Levels on Growth Attributes, Nitrogen Use Efficiency, and Economics of Cotton. Front. Plant Sci. 2022, 13, 890181. [Google Scholar] [CrossRef]
  39. Shareef, M.; Gui, D.; Zeng, F.; Waqas, M.; Zhang, B.; Iqbal, H. Water Productivity, Growth, and Physiological Assessment of Deficit Irrigated Cotton on Hyperarid Desert-Oases in Northwest China. Agric. Water Manag. 2018, 206, 1–10. [Google Scholar] [CrossRef]
  40. Wang, P.; Zhao, Z.; Wang, L.; Tian, C. Comparison of Efficiency-Enhanced Management and Conventional Management of Irrigation and Nitrogen Fertilization in Cotton Fields of Northwestern China. Agriculture 2021, 11, 1134. [Google Scholar] [CrossRef]
  41. Koudahe, K.; Sheshukov, A.Y.; Aguilar, J.; Djaman, K. Irrigation-Water Management and Productivity of Cotton: A Review. Sustainability 2021, 13, 10070. [Google Scholar] [CrossRef]
  42. Richards, J.H.; Caldwell, M.M. Hydraulic Lift: Substantial Nocturnal Water Transport between Soil Layers by Artemisia Tridentata Roots. Oecologia 1987, 73, 486–489. [Google Scholar] [CrossRef]
  43. Khan, A.; Tan, D.K.Y.; Munsif, F.; Afridi, M.Z.; Shah, F.; Wei, F.; Fahad, S.; Zhou, R.Y. Nitrogen Nutrition in Cotton and Control Strategies for Greenhouse Gas Emissions: A Review. Environ. Sci. Pollut. Res. 2017, 24, 23471–23487. [Google Scholar] [CrossRef] [PubMed]
  44. Shah, A.N.; Javed, T.; Singhal, R.K.; Shabbir, R.; Wang, D.P.; Hussain, S.; Anuragi, H.; Jinger, D.; Pandey, H.; Abdelsalam, N.R.; et al. Nitrogen Use Efficiency in Cotton: Challenges and Opportunities Against Environmental Constraints. Front. Plant Sci. 2022, 13, 970339. [Google Scholar] [CrossRef] [PubMed]
Figure 1. Daily maximum (Tmax) and minimum (Tmin) air temperature and total solar radiation during the cotton-growing season in 2020 and 2021.
Agronomy 13 03022 g001
Figure 2. Diagram of the specially constructed split-root system used in this study.
Agronomy 13 03022 g002
Figure 3. The dynamics of cotton plant height over time for different nitrogen application rates under the same topsoil water condition (ac) and for different topsoil water conditions at the same nitrogen application rate (df) in 2020. Note: CK means soil water content controlled at 60–70% of field capacity and no nitrogen fertilizer applied. W0.6, W0.5, and W0.4 mean topsoil water condition at 60–70%, 50–60%, and 40–50% of field capacity, respectively. N120, N240, and N360 mean nitrogen rates of 120 kg·N ha−1, 240 kg·N ha−1, and 360 kg N·ha−1, respectively.
Agronomy 13 03022 g003
Figure 4. The dynamics of cotton plant height over time for different nitrogen application rates under the same topsoil water condition (ac) and for different topsoil water conditions at the same nitrogen application rate (df) in 2021. Note: CK means soil water content controlled at 60–70% of field capacity and no nitrogen fertilizer applied. W0.6, W0.5, and W0.4 mean topsoil water condition at 60–70%, 50–60%, and 40–50% of field capacity, respectively. N120, N240, and N360 mean nitrogen rates of 120 kg·N ha−1, 240 kg·N ha−1, and 360 kg N·ha−1, respectively.
Agronomy 13 03022 g004
Figure 5. The dynamics of cotton leaf area over time for different nitrogen application rates under the same topsoil water condition (ac) and for different topsoil water conditions at the same nitrogen application rate (df) in 2020. Note: CK means soil water content controlled at 60–70% of field capacity and no nitrogen fertilizer applied. W0.6, W0.5, and W0.4 mean topsoil water condition at 60–70%, 50–60%, and 40–50% of field capacity, respectively. N120, N240, and N360 mean nitrogen rates of 120 kg·N ha−1, 240 kg·N ha−1, and 360 kg N·ha−1, respectively.
Agronomy 13 03022 g005
Figure 6. The dynamics of cotton leaf area over time for different nitrogen application rates under the same topsoil water condition (ac) and for different topsoil water conditions at the same nitrogen application rate (df) in 2021. Note: CK means soil water content controlled at 60–70% of field capacity and no nitrogen fertilizer applied. W0.6, W0.5, and W0.4 mean topsoil water condition at 60–70%, 50–60%, and 40–50% of field capacity, respectively. N120, N240, and N360 mean nitrogen rates of 120 kg·N ha−1, 240 kg·N ha−1, and 360 kg N·ha−1, respectively.
Agronomy 13 03022 g006
Figure 7. Changes in the amount of water from root hydraulic lift at different periods for different nitrogen application rates under the same topsoil water condition (ac) and for different topsoil water conditions at the same nitrogen application rate (df) in 2020. Note: CK means soil water content controlled at 60–70% of field capacity and no nitrogen fertilizer applied. W0.6, W0.5, and W0.4 mean topsoil water condition at 60–70%, 50–60%, and 40–50% of field capacity, respectively. N120, N240, and N360 mean nitrogen rates of 120 kg·N ha−1, 240 kg·N ha−1, and 360 kg N·ha−1, respectively.
Agronomy 13 03022 g007
Figure 8. Changes in the amount of water from root hydraulic lift at different periods for different nitrogen application rates under the same topsoil water condition (ac) and for different topsoil water conditions at the same nitrogen application rate (df) in 2021. Note: CK means soil water content controlled at 60–70% of field capacity and no nitrogen fertilizer applied. W0.6, W0.5, and W0.4 mean topsoil water condition at 60–70%, 50–60%, and 40–50% of field capacity, respectively. N120, N240, and N360 mean nitrogen rates of 120 kg·N ha−1, 240 kg·N ha−1, and 360 kg N·ha−1, respectively.
Agronomy 13 03022 g008
Figure 9. The amount of water from root hydraulic lift throughout the test period of cotton in 2020 and 2021. Note: Different letters mean significant differences (p < 0.05). CK means soil water content controlled at 60–70% of field capacity and no nitrogen fertilizer applied. W0.6, W0.5, and W0.4 mean topsoil water condition at 60–70%, 50–60%, and 40–50% of field capacity, respectively. N120, N240, and N360 mean nitrogen rates of 120 kg·N ha−1, 240 kg·N ha−1, and 360 kg N·ha−1, respectively.
Agronomy 13 03022 g009
Figure 10. The total evapotranspiration (ET) of cotton in 2020 and 2021. Note: Different letters mean significant differences (p < 0.05). CK means soil water content controlled at 60–70% of field capacity and no nitrogen fertilizer applied. W0.6, W0.5, and W0.4 mean topsoil water condition at 60–70%, 50–60%, and 40–50% of field capacity, respectively. N120, N240, and N360 mean nitrogen rates of 120 kg·N ha−1, 240 kg·N ha−1, and 360 kg N·ha−1, respectively.
Agronomy 13 03022 g010
Figure 11. Water use efficiency (WUE) and nitrogen partial factor productivity (PFPN) of cotton in 2020 and 2021. Note: Different letters mean significant differences (p < 0.05). CK means soil water content controlled at 60–70% of field capacity and no nitrogen fertilizer applied. W0.6, W0.5, and W0.4 mean topsoil water condition at 60–70%, 50–60%, and 40–50% of field capacity, respectively. N120, N240, and N360 mean nitrogen rates of 120 kg·N ha−1, 240 kg·N ha−1, and 360 kg N·ha−1, respectively.
Agronomy 13 03022 g011
Table 1. Photosynthetic characteristics of leaves at the flowering stage for treatments in 2020 and 2021, presented as a mean ± S.E. (n = 3).
TreatmentNet Photosynthetic Rate
(μmol m−2 s−1)
Transpiration Rate
(mmol·m−2·s−1)
2020202120202021
CK20.47 ± 3.71 a17.97 ± 0.33 bc17.23 ± 3.77 a12.41 ± 0.59 a
W0.6N12021.23 ± 1.90 a19.37 ± 1.76 abc20.11 ± 0.61 a13.16 ± 1.66 a
W0.6N24019.46 ± 2.21 a18.81 ± 0.93 abc18.82 ± 3.40 a13.57 ± 0.64 a
W0.6N36022.57 ± 0.45 a20.69 ± 0.50 ab22.41 ± 1.53 a14.35 ± 0.11 a
W0.5N12021.40 ± 1.37 a20.84 ± 0.33 a20.54 ± 0.58 a12.45 ± 0.26 a
W0.5N24020.65 ± 1.26 a21.15 ± 1.50 a20.92 ± 1.78 a12.57 ± 1.22 a
W0.5N36023.09 ± 0.98 a20.27 ± 0.52 abc22.54 ± 1.33 a13.47 ± 0.23 a
W0.4N12021.57 ± 1.04 a18.67 ± 1.19 abc20.97 ± 1.37 a13.61 ± 1.82 a
W0.4N24021.84 ± 0.31 a19.41 ± 0.11 abc23.02 ± 1.34 a14.22 ± 1.93 a
W0.4N36023.61 ± 1.85 a17.80 ± 0.63 c22.67 ± 1.32 a12.47 ± 0.92 a
Year** **
Waterns ns
Nitrogenns ns
Year × Waterns ns
Year × Nitrogenns ns
Water × Nitrogenns ns
Year × Water × Nitrogenns ns
Note: Different letters mean significant differences (p < 0.05). ** and ns mean p < 0.01 and no significant difference, respectively. CK means soil water content controlled at 60–70% of field capacity and no nitrogen fertilizer applied. W0.6, W0.5, and W0.4 mean topsoil water condition at 60–70%, 50–60%, and 40–50% of field capacity, respectively. N120, N240, and N360 mean nitrogen rates of 120 kg·N ha−1, 240 kg·N ha−1, and 360 kg N·ha−1, respectively.
Table 2. Significance levels (p-values) of the effects of topsoil water condition and N rate on the amount of water from root hydraulic lift.
TreatmentThe Amount of Water from Root Hydraulic Lift
Year**
Water**
Nitrogen**
Year × Water**
Year × Nitrogen**
Water × Nitrogen*
Year × Water × Nitrogenns
Note: *, **, and ns mean p < 0.05, p < 0.01, and no significant difference, respectively.
Table 3. Total root length, root surface area, and root volume for treatments in 2020 and 2021 presented as a mean ± S.E. (n = 3).
TreatmentRoot Length (cm)Root Surface Area (cm2)Root Volume (cm3)
202020212020202120202021
CK832.84 ± 53.85 bcd 828.10 ± 8.49 cd468.45 ± 24.89 ab 453.49 ± 12.24 bc16.06 ± 0.70 d 17.10 ± 0.87 d
W0.6N120878.41 ± 50.31 abc 758.85 ± 2.36 cdef545.32 ± 33.33 a 429.11 ± 15.31 cd19.41 ± 0.84 abc 19.58 ± 1.39 bc
W0.6N240926.13 ± 36.24 ab 1025.06 ± 39.52 ab546.20 ± 45.62 a 506.83 ± 19.03 ab18.89 ± 0.74 abc 20.40 ± 0.67 b
W0.6N360973.00 ± 28.11 a 1070.28 ± 47.72 a550.22 ± 19.32 a 516.71 ± 30.52 a21.00 ± 1.30 abc 23.51 ± 0.19 a
W0.5N120805.94 ± 37.17 cd 806.19 ± 80.45 cde457.97 ± 31.28 b 409.54 ± 32.44 cd18.22 ± 0.87 bcd 17.00 ± 0.94 d
W0.5N240848.83 ± 16.09 bcd 885.51 ± 27.97 bc483.81 ± 37.30 ab 459.45 ± 8.93 abc17.42 ± 0.62 cd 19.13 ± 0.10 bcd
W0.5N360819.91 ± 7.68 cd 768.92 ± 4.56 cdef489.50 ± 11.75 ab 433.62 ± 6.65 cd19.68 ± 0.54 abc 20.11 ± 0.19 b
W0.4N120788.33 ± 41.90 cd 654.27 ± 11.47 f458.66 ± 19.88 b 387.83 ± 18.39 d17.42 ± 0.66 cd 18.30 ± 0.69 bcd
W0.4N240765.68 ± 17.06 d 709.97 ± 106.43 def438.10 ± 22.94 b 403.08 ± 34.31 cd17.65 ± 0.36 bcd 17.91 ± 0.78 cd
W0.4N360829.85 ± 27.23 bcd 669.36 ± 1.72 ef503.34 ± 9.45 ab 401.45 ± 1.12 cd20.00 ± 1.12 ab 19.71 ± 0.08 bc
Yearns ** ns
Water** ** **
Nitrogen** ** **
Year × Water* ns ns
Year × Nitrogenns ns ns
Water × Nitrogen** ns ns
Year × Water × Nitrogenns ns ns
Note: Different letters mean significant differences (p < 0.05). *, **, and ns mean p < 0.05, p < 0.01, and no significant difference, respectively. Note: CK means soil water content controlled at 60–70% of field capacity and no nitrogen fertilizer applied. W0.6, W0.5, and W0.4 mean topsoil water condition at 60–70%, 50–60%, and 40–50% of field capacity, respectively. N120, N240, and N360 mean nitrogen rates of 120 kg·N ha−1, 240 kg·N ha−1, and 360 kg N·ha−1, respectively.
Table 4. Seed cotton yield, lint cotton yield, and lint percentage for treatments in 2020 and 2021 presented as a mean ± S.E. (n = 3).
TreatmentSeed Cotton Yield (g·plant−1)Lint Cotton Yield (g·plant−1)Lint Percentage (%)
202020212020202120202021
CK60.92 ± 3.30 d67.51 ± 3.87 fg23.45 ± 1.27 e28.66 ± 1.52 ef38.50 ± 0.01 a42.47 ± 0.18 a
W0.6N12070.92 ± 0.72 cd73.82 ± 0.12 efg26.47 ± 0.94 de30.85 ± 0.09 def37.31 ± 1.02 a41.80 ± 0.06 ab
W0.6N24085.17 ± 3.37 ab82.00 ± 6.85 cde34.24 ± 1.95 ab33.22 ± 2.16 bcd40.15 ± 0.71 a40.63 ± 0.76 abc
W0.6N36096.67 ± 5.26 a109.37 ± 1.67 a38.32 ± 0.80 a41.39 ± 0.19 a39.80 ± 1.49 a37.85 ± 0.40 d
W0.5N12066.40 ± 6.70 cd76.64 ± 2.78 def26.26 ± 2.11 de30.29 ± 1.02 def39.74 ± 1.23 a39.52 ± 0.11 cd
W0.5N24077.63 ± 5.02 bc78.69 ± 0.18 de28.66 ± 2.14 cd33.33 ± 0.58 bcd36.89 ± 0.76 a42.35 ± 0.83 a
W0.5N36077.56 ± 3.55 bc94.63 ± 2.65 b31.51 ± 2.43 bc37.55 ± 1.50 ab40.52 ± 1.40 a39.65 ± 0.47 bcd
W0.4N12064.66 ± 2.27 d67.07 ± 1.87 g25.19 ± 1.27 de27.39 ± 0.80 f38.92 ± 0.58 a40.83 ± 0.05 abc
W0.4N24060.02 ± 4.05 d85.13 ± 3.85 bcd24.08 ± 0.40 e32.77 ± 3.12 cde40.51 ± 2.93 a38.32 ± 1.93 d
W0.4N36071.95 ± 4.10 cd90.41 ± 2.60 bc27.34 ± 0.54 cde37.03 ± 1.34 abc38.16 ± 1.43 a40.94 ± 0.30 abc
Year** ** **
Water** ** ns
Nitrogen** ** ns
Year × Water* * ns
Year × Nitrogenns ns ns
Water × Nitrogen* ns ns
Year × Water × Nitrogen* ns **
Note: Different letters mean significant differences (p < 0.05). *, **, and ns mean p < 0.05, p < 0.01, and no significant difference, respectively. Note: CK means soil water content controlled at 60–70% of field capacity and no nitrogen fertilizer applied. W0.6, W0.5, and W0.4 mean topsoil water condition at 60–70%, 50–60%, and 40–50% of field capacity, respectively. N120, N240, and N360 mean nitrogen rates of 120 kg·N ha−1, 240 kg·N ha−1, and 360 kg N·ha−1, respectively.
Table 5. Significance levels (p-values) of the effects of topsoil water condition and N rate on the ET, WUE, and PFPN.
TreatmentETWUEPFPN
Year******
Water**ns**
Nitrogen*****
Year × Waterns**ns
Year × Nitrogennsnsns
Water × Nitrogenns*ns
Year × Water × Nitrogenns*ns
Note: *, **, and ns mean p < 0.05, p < 0.01, and no significant difference, respectively.
Disclaimer/Publisher’s Note: The statements, opinions and data contained in all publications are solely those of the individual author(s) and contributor(s) and not of MDPI and/or the editor(s). MDPI and/or the editor(s) disclaim responsibility for any injury to people or property resulting from any ideas, methods, instructions or products referred to in the content.

