Article

Simulation of Irrigation Strategy Based on Stochastic Rainfall and Evapotranspiration

Institute of Farmland Irrigation, Chinese Academy of Agriculture Sciences, Xinxiang 453002, China
*
Author to whom correspondence should be addressed.
Agronomy 2023, 13(11), 2849; https://doi.org/10.3390/agronomy13112849
Submission received: 18 September 2023 / Revised: 13 November 2023 / Accepted: 16 November 2023 / Published: 20 November 2023

Abstract

:
The North China Plain plays a pivotal role in China’s crop production, contributing to 30% of the maize yield. Nevertheless, summer maize in this region faces challenges due to climatic constraints characterized by concurrent high temperatures and rainfall during the growing season, resulting in a relatively high evapotranspiration rate. In this study, we explored eight soil moisture-based threshold irrigation strategies, consisting of two upper limits and four lower limits, along with a rainfed mode (E). The upper and lower irrigation limits are expressed as a percentage of the field’s water-holding capacity (sfc). For the four full irrigation modes (A1, A2, A3, A4), the lower limits were set at 0.6 sfc, 0.6 sfc, 0.5 sfc, and 0.5 sfc, respectively. The upper limits were defined at two levels: 0.8 sfc for A1 and A2 and sfc for A3 and A4. Similarly, for the four deficit irrigation modes (B1, B2, B3, B4), the lower limits were established at 0.4 sfc, 0.4 sfc, 0.3 sfc, and 0.3 sfc, respectively, with the upper limits set at two levels: 0.8 sfc for B1 and B2 and the full sfc for B3 and B4. To investigate the impact of rainfall and potential evapotranspiration on these irrigation modes under long-term fluctuations, we employed a stochastic framework that probabilistically linked rainfall events and irrigation applications. The Monte Carlo method was employed to simulate a long-term series (4000a) of rainfall parameters and evapotranspiration using 62 years of meteorological data from the Xinxiang region, situated in the southern part of the North China Plain. Results showed that the relative yield and net irrigation water requirement of summer maize decreased with decreasing irrigation lower limits. Additionally, the interannual variation of rainfall parameters and evapotranspiration during the growing season were remarkable, which led to the lowest relative yield of the rainfed mode (E) aligned with a larger interannual difference. According to the simulation results, mode A4 (irrigation lower limit equals 0.5 sfc, irrigation upper limit equals 0.8 sfc) could be adopted for adequate water resources. Conversely, mode B2 is more suitable for a lack of water resources.

1. Introduction

The North China Plain is a vital maize production hub in China, yet it faces chronic freshwater shortages [1,2]. The irregular spatial and temporal distribution of high temperatures and rainfall leads to seasonal drought stress during the growth of summer maize, resulting in lower rain-fed summer maize yields compared to irrigated crops [3,4,5]. Thus, irrigation is necessary to ensure a high yield of summer maize in this region. However, widespread groundwater usage for irrigation, especially in the face of variable climatic conditions, has led to a rapid decline in the groundwater table [6]. Consequently, nearly all counties in this region are grappling with severe water scarcity [7,8,9]. Prioritizing enhanced water utilization efficiency in this region is critical not only to address the ongoing water crisis but also to ensure the long-term sustainability of grain production.
The conventional approach to irrigation scheduling relies on analyzing average multi-year meteorological data, often derived from long-term rainfall records or a representative hydrological year [10,11]. While the conventional approach is practical and convenient, it tends to overlook the influence of random rainfall patterns. The annual rainfall variability throughout the growing season significantly affects soil moisture levels, playing a pivotal role in shaping effective water management strategies [12,13]. Through incorporating the stochastic rainfall, stochastic soil water balance models offer a robust framework for assessing soil water availability. This approach enables the identification of optimal environmental conditions, including irrigation strategies [14]. Unlike the previous approach, the stochastic method considers the impact of stochastic rainfall on crop yields without overly relying on computationally intensive numerical simulations [15].
The Monte Carlo method, a statistical technique employing randomly generated pseudo-random numbers or events, has proven valuable in simulating stochastic processes and tackling complex problems [16]. It has been applied effectively in quantifying uncertainty related to precipitation and evapotranspiration within hydrological models, as demonstrated in previous research [17,18]. In this study, we employ the Monte Carlo method to generate long-term sequences of rainfall parameters. Subsequently, within a soil water balance framework, we calculate the water requirements and yield responses associated with eight distinct irrigation strategies and a rainfed mode (E) under stochastic rainfall conditions. This analysis aims to offer robust and adaptive irrigation strategies suitable for various scenarios of water resource accessibility.

2. Materials and Methods

2.1. Method

2.1.1. Rainfall Parameter

Rainfall demonstrates heavy tails in the extremes of its marginal distribution and presents persistence in the parent process of estimating extreme values [19,20]. Addressing these extremes is crucial for effectively mitigating agricultural losses, especially under extreme conditions. However, in the pursuit of a strategy with broader applicability, the main body of the marginal distribution is considered; to achieve this, the Poisson process is employed to describe rainfall [21]. The rainfall amount (h) and the interval (τ) of the rainfall events obey an exponential distribution, which can be expressed as follows:
f h = 1 α e 1 α h
f τ = λ e λ τ
where α is the mean depth of rainfall events and λ the mean frequency of rainfall events.
Given that the fundamental attributes of the rainfall process during the crop growth period can be quantitatively described using the rainfall parameters α and λ, the total precipitation over the growing season, denoted as P, can be calculated as follows:
P = α λ T s e a s
where Tseas is the length of the growing season.

2.1.2. Potential Evapotranspiration

Crop potential evapotranspiration is the maximum value of crop evapotranspiration under standard conditions, assuming no restrictions on crop growth, evapotranspiration from soil water, salinity stress, crop density, pests, diseases, weed infestation, or low fertility. The crop evapotranspiration from the non-stressed treatment is provided as follows [22]:
E m = K c E 0
where Em is the potential evapotranspiration, E0 is the reference crop evapotranspiration and Kc is the crop coefficient. Summer maize Kc was taken as 1.07, according to Song et al. [23]. Reference crop evapotranspiration was calculated using the FAO-recommended Penman-Monteith equation [22,24]:
E 0 = 0.408 Δ R n G + ζ 900 T + 273 u 2 e s e a Δ + ζ 1 + 0.34 u 2
where Rn is the net canopy radiation, G is the soil heat flux, T is the air temperature at 2 m above ground, u2 is the wind speed at 2 m above ground, es is the saturation water vapor pressure, ea is the actual water vapor pressure, Δ is the slope of the saturation water vapor pressure curve, and ζ is the hygrometer constant (kPa/°C).

2.1.3. Soil Moisture Density Function

In a homogeneous isotropic soil, without considering the lateral movement of water, the differential equation of water balance with soil moisture as the state variable is expressed as:
n Z r d s d t = R + I E L Q
where R is rainfall, I is irrigation water, E is actual evapotranspiration, LQ is the combination of deep percolation and runoff, n is soil porosity, s is soil moisture, averaged over a representative soil rooting zone of depth Zr of a homogeneous of soil of porosity n. The groundwater depth in the study area is below 5 m. Therefore, the influence of groundwater evapotranspiration is disregarded in this study.
The rainfall process is stochastic, characterized by random variables governing rainfall amounts and intervals. Equation (6) is a stochastic differential equation with respect to s. The analytical solution of Equation (6) regarding s probability density under stable conditions can be obtained [25]:
p s = C ρ s e ε s γ λ ρ u d u 1 + ε s γ θ ω u δ ω u e ε u γ λ ρ y d y d u
where p s is the soil water density function; ρ s is the soil moisture loss function; θ(·) is the Heaviside function; δ(·) is the Dirac delta function; C is the integration constant, which can be obtained by imposing ε s f c p s = 1 . ρ s   is the soil moisture loss function [26], which is calculated as:
ρ s = η s s , 0 s s η , s < s s f c
Selecting the appropriate upper and lower limits of the integral, the analytic formula of the p(s) piecewise function can be solved [25]:
p s = C η s s e γ s ε s ε λ η s 1 + e γ ε ε λ η s h 1 s h 1 ε , ε s s C η e γ s ε + λ η s s s ε λ η s 1 + e γ ε ε λ η s h 1 s h 1 ε + e γ s ε e γ λ η s ε s λ η s h 2 s h 2 s , s < s s f c
h 1 s = ε s γ θ ω u δ ω u e γ u u λ η s   d u
h 2 s = ε s γ θ ω u δ ω u e γ λ η u u λ η s   d u
λ = λ e Δ α , γ = n Z r α , η = E p n Z r
ε is the lower limit of irrigation; ω the upper limit of irrigation; s* is the point of incipient stomatal closure when plant transpiration is reduced; sfc is the field water-holding capacity; Δ is the canopy interception capacity.

2.1.4. Net Irrigation Water Requirement and Actual Evapotranspiration

While a portion of the crop’s water demand can be met through rainfall, there are instances where irrigation is needed to supplement the net irrigation water requirement. The calculation formula for the control index of the net irrigation water demand (V) considers both upper and lower irrigation limits and is expressed as follows [25]:
V = n Z r ω ε ρ ε p ε T s e a s
The actual evapotranspiration based on p(s) is calculated as:
E = n Z r ε s f c ρ s p s d s
As the significant interannual variability in potential evapotranspiration and summer maize yield, this paper utilizes the Stewart relative value model to describe the water production function of summer maize [27]:
1 Y Y m = K y 1 E E m
where Ym is the maximum crop yield, which is the highest yield (kg/hm2) that can be obtained under the climatic conditions of the year without restricting the normal growth of the crop by water, fertilizer, pests, and diseases; Ky is the yield response coefficient, with a value of Ky = 1.16 as determined in the study by Kang [28].

2.2. Data Collection and Simulation Design

The subject of our research is summer maize cultivated at the Experiment Station (35°9′ N, 113°48′ E; 81 m altitude) of the Chinese Academy of Agricultural Sciences. Maize is sown mid-to-early June and harvested mid-to-late September, resulting in a growth period of 105 days. The soil type in the summer maize experimental field is silt loam, characterized by soil particles in the 0–100 cm layer comprising 16–18% sand, 62–67% silt, and 15–22% clay. The dry bulk density ranges from 1.38 to 1.45 g/cm3, and the soil exhibits a porosity (n) of 0.44. The field water capacity (θfc) is 0.33 (volume), while the wilting coefficient (θw) is 0.09 (volume). The root active layer depth for summer maize is 80 cm, and the average canopy interception capacity during the growth period is 1.5 mm [29]. Meteorological data for the Xinxiang area from 1951 to 2012 was sourced from the China Meteorological Science Data Sharing Service Network.
In this study, nine scheduling strategies were employed, including eight irrigation strategies and rainfed modes. The former modes are governed by specific upper and lower limits on soil water content. The aim was to develop more effective irrigation scheduling strategies tailored to the varying water supplementation needs in the North China Plain. The strategies included two upper irrigation limits (sfc, 0.8 sfc) and four lower irrigation limits (0.6 sfc, 0.5 sfc, 0.4 sfc, 0.3 sfc), as outlined in Table 1. Probability distribution functions for interannual α, λ, and Ep were fitted using meteorological data from 1951 to 2012 in the study area. The Monte Carlo method was employed to generate a long series (4000 years) of α, λ, and Ep [30]. Subsequently, these values were incorporated into the abovementioned equations to calculate net irrigation water demand, relative evapotranspiration, and relative yield for different water regulation modes. This approach enables an analysis of the effects of various water regulation measures.

3. Results

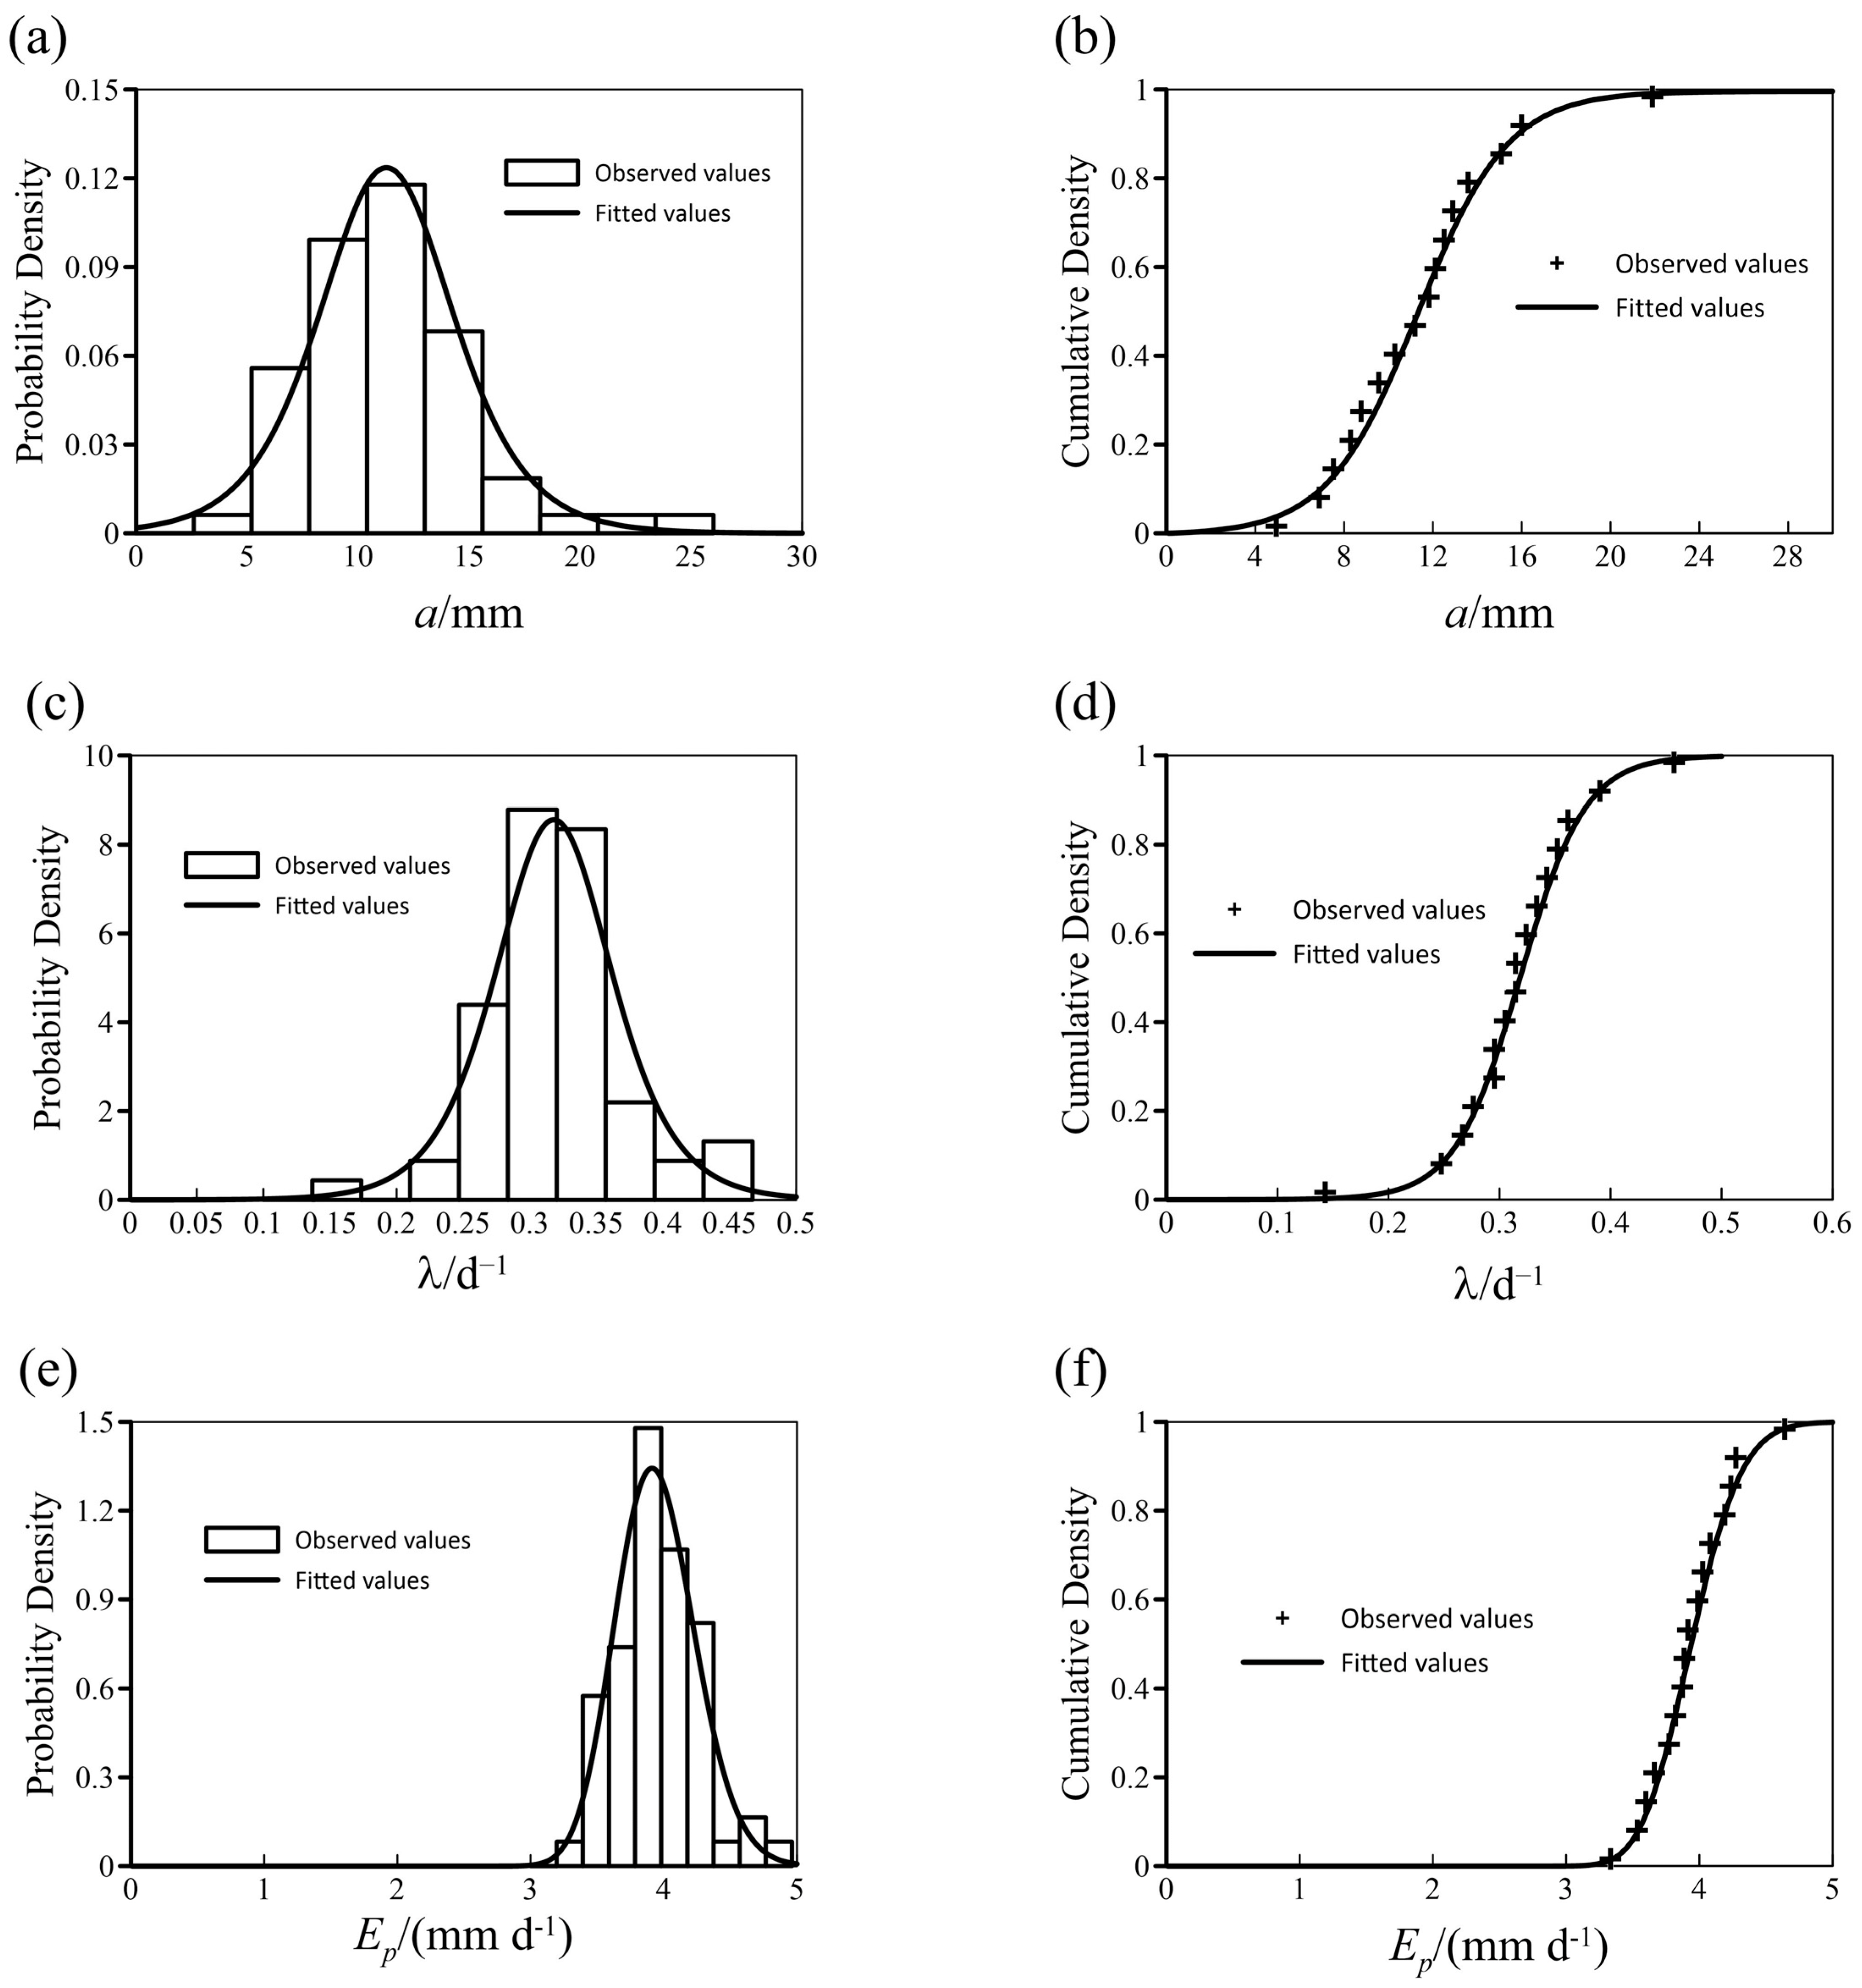
3.1. Characteristics of Interannual Variation of Rainfall Parameters and Potential Evapotranspiration

The inter-annual rainfall variation during summer maize growth in the study area from 1951 to 2012 is readily apparent. This variability encompasses not only the amount of rainfall but also in distribution of rainfall parameters: The multi-year average of the parameter, α, stands at 11.523 mm, with a maximum of 25.003 mm and a minimum of 4.958 mm, resulting in a coefficient of variation of 0.326. For the parameter λ, the average of multi-year is 0.319 d−1, with a maximum of 0.143 d−1 and a minimum of 0.457 d−1, leading to a coefficient of variation of 0.170. Unlike the rainfall parameters, potential evapotranspiration (Ep) presented relatively stable values of 3.95 mm/day, 4.86 mm/day, 3.33 mm/day, and 0.076 for the multi-year mean, maximum, minimum, and coefficient of variation, respectively.
Rainfall parameters and potential evapotranspiration probability distributions were determined using the maximum likelihood method with a confidence level of 0.05, and the results are depicted in Figure 1. In Figure 1, it is evident that the histograms of the probability distribution function (PDF) and cumulative distribution function (CDF) for α and λ observations closely align with the hyperbolic secant square distribution (logistic distribution) curve and its cumulative distribution curve. On the other hand, the PDF and CDF of observed Ep values closely match the lognormal distribution (LogNormal distribution) curve and its cumulative distribution curve. Consequently, the interannual variation of α and λ in the study area is characterized by the hyperbolic normal cut square distribution, denoted as α~Logistic (11.273, 2.022) and λ~Logistic (0.318, 0.029). Meanwhile, the interannual variation of Ep is described by the lognormal distribution, represented as Ep~LogNormal (3.945, 0.076). As α and λ do not obey normal distribution, a nonparametric Spearman rank correlation test was conducted to assess their correlation. The resulting correlation coefficient 0.028 (at a confidence interval of 0.05) suggests a weak correlation between α and λ, indicating that their interannual variations are largely independent.

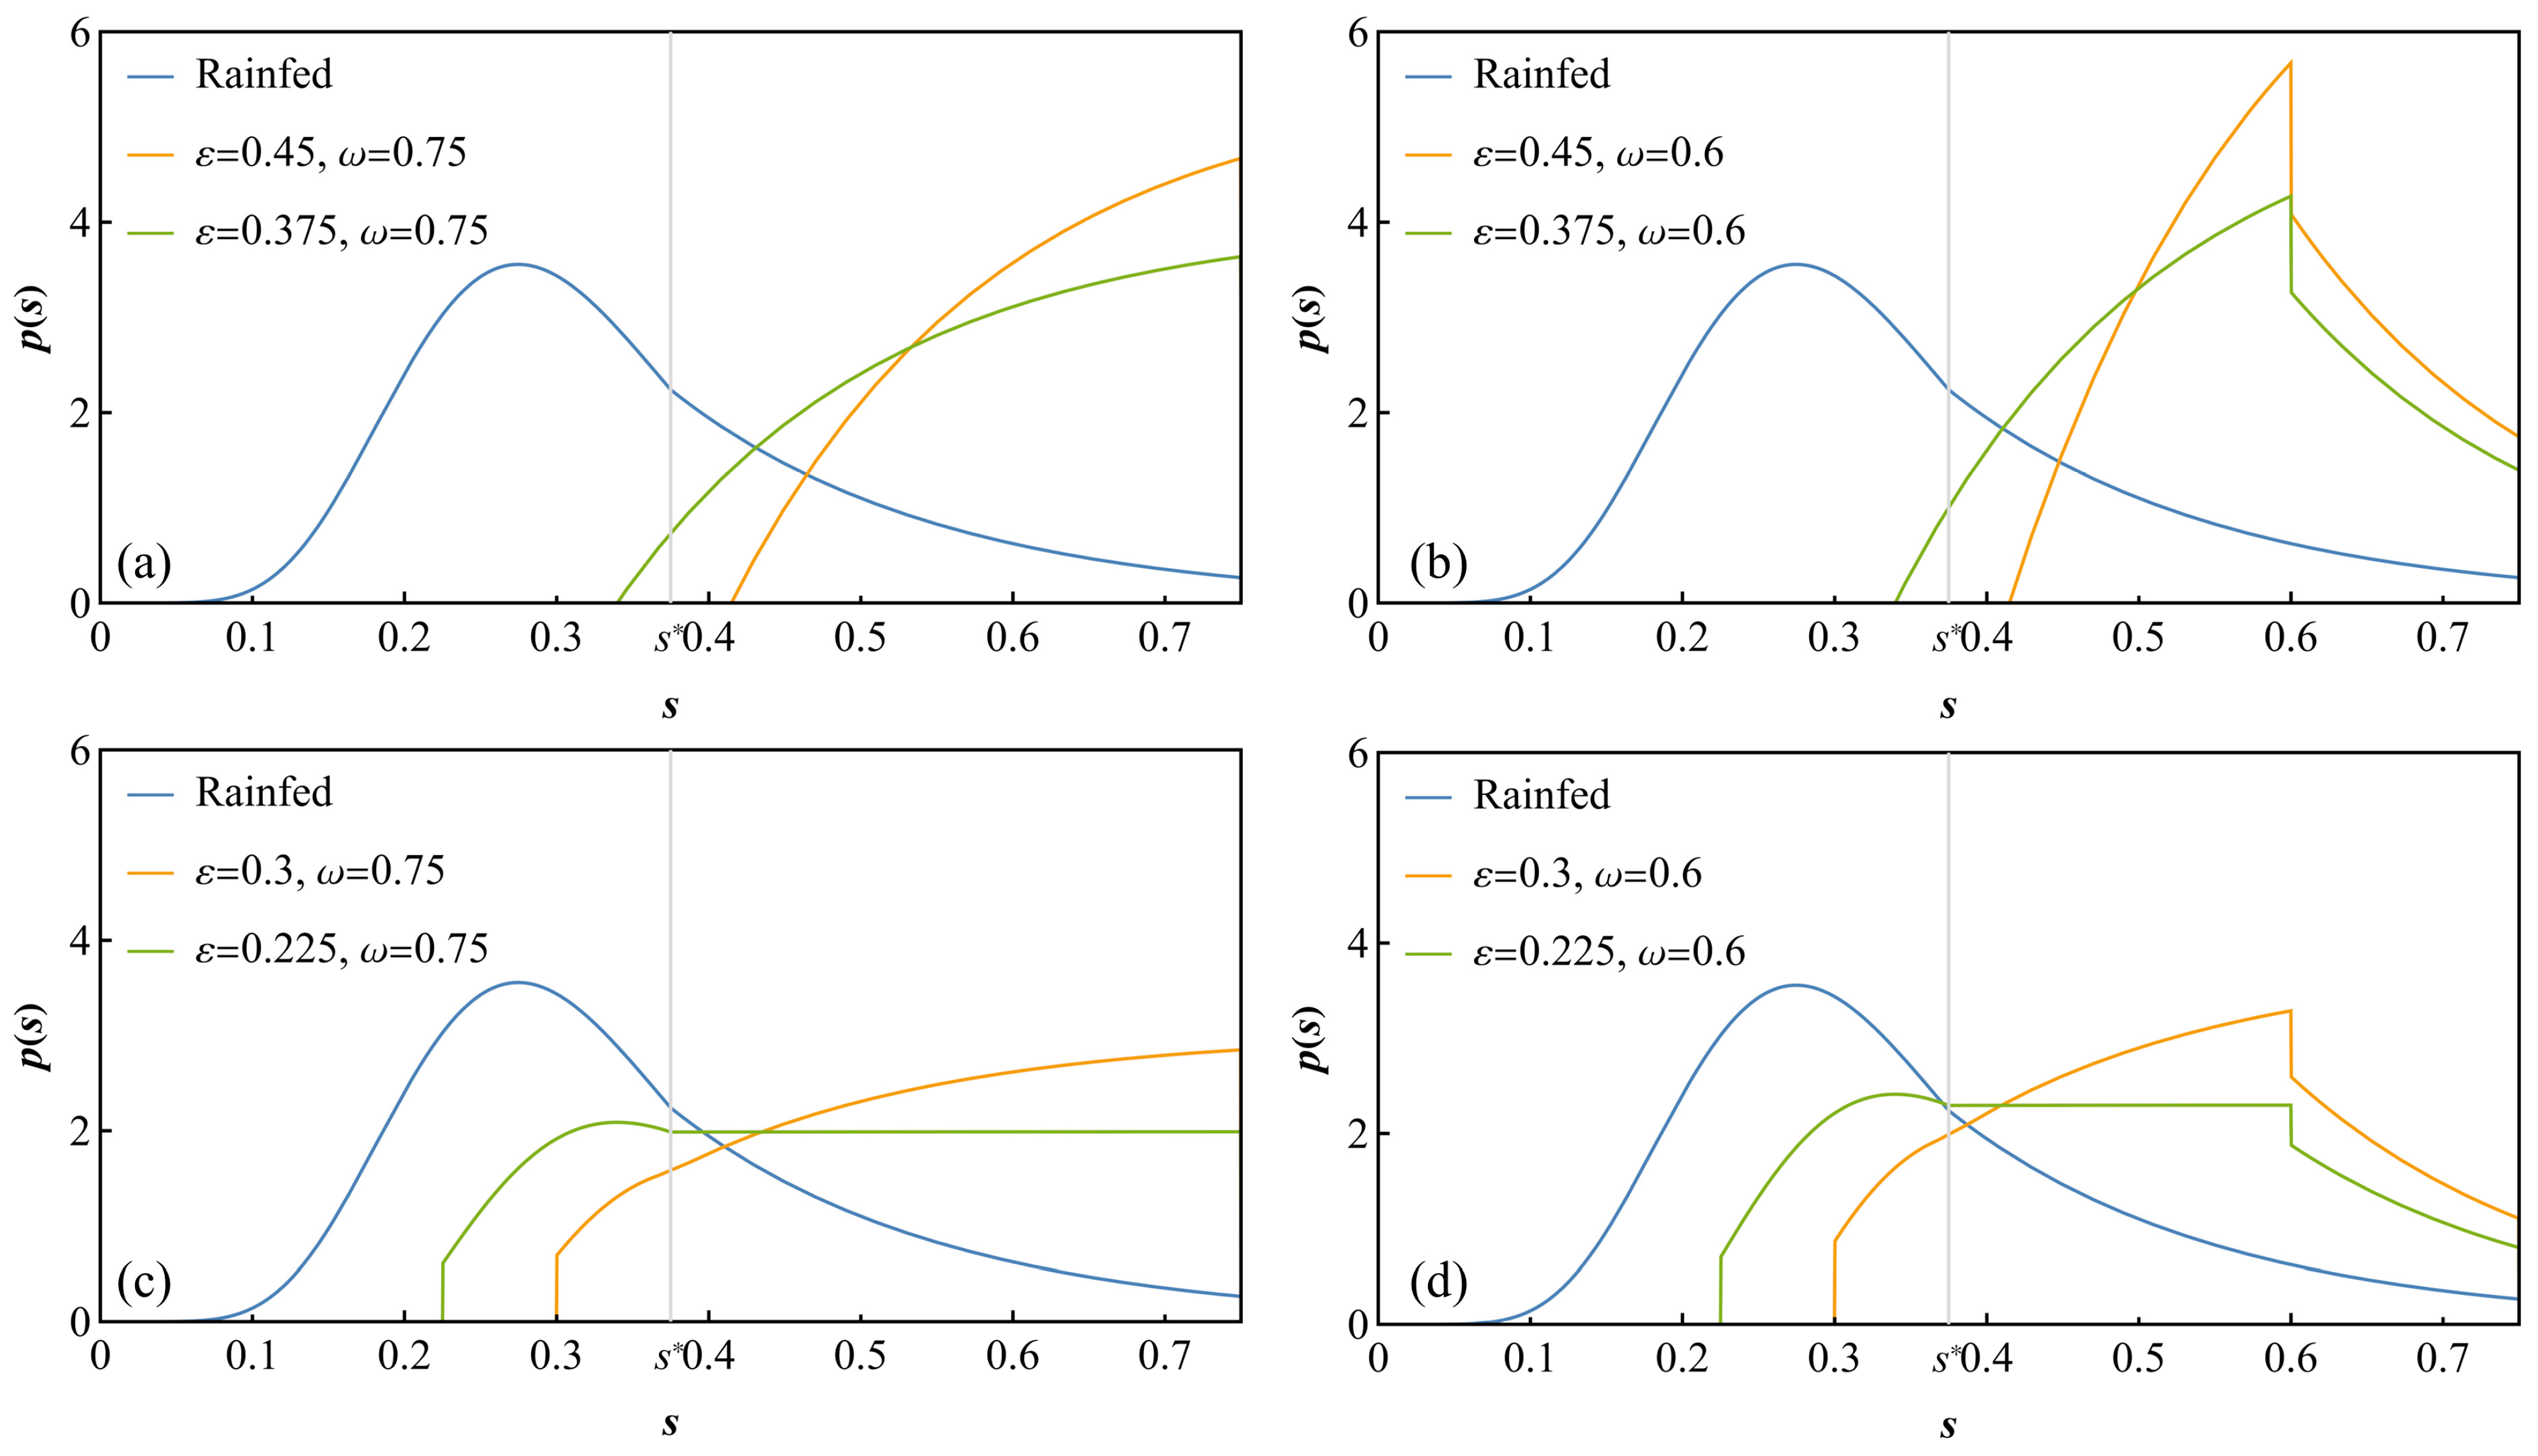
3.2. Effect of Moisture Regulation on Soil Moisture

Figure 2 illustrates significant variations in soil moisture density function curves under different irrigation modes. In Figure 2a,c, the upper limits of irrigation (ω) for full and deficit irrigation are sfc. In Figure 2b,d, the upper limits of irrigation (ω) for full and deficit irrigation are 0.8 sfc.
As depicted in Figure 2a,c, when the upper limit of irrigation is sfc, the soil moisture density function curve for the rainfed condition is wider, and the peak of p(s) occurs at s = 0.275. For both full and deficit irrigation, the peak of p(s) occurs at s = sfc. However, it is worth noting that the peak of p(s) for deficit irrigation, as shown in Figure 2c, is noticeably lower than that for full irrigation in Figure 2a.
In contrast, in Figure 2b,d, the maximum value of p(s) for both full and deficit irrigation modes is observed at s = 0.8 sfc. Similarly, the peak value of p(s) for deficit irrigation remains substantially lower than that for full irrigation, respectively, as shown in Figure 2b,d.
Generally, it is evident that different irrigation strategies have a markable impact on soil moisture density functions. By adjusting the upper and lower limits of irrigation, it is possible to regulate soil moisture levels, thereby retaining the likelihood of soil moisture at a relatively lower level.

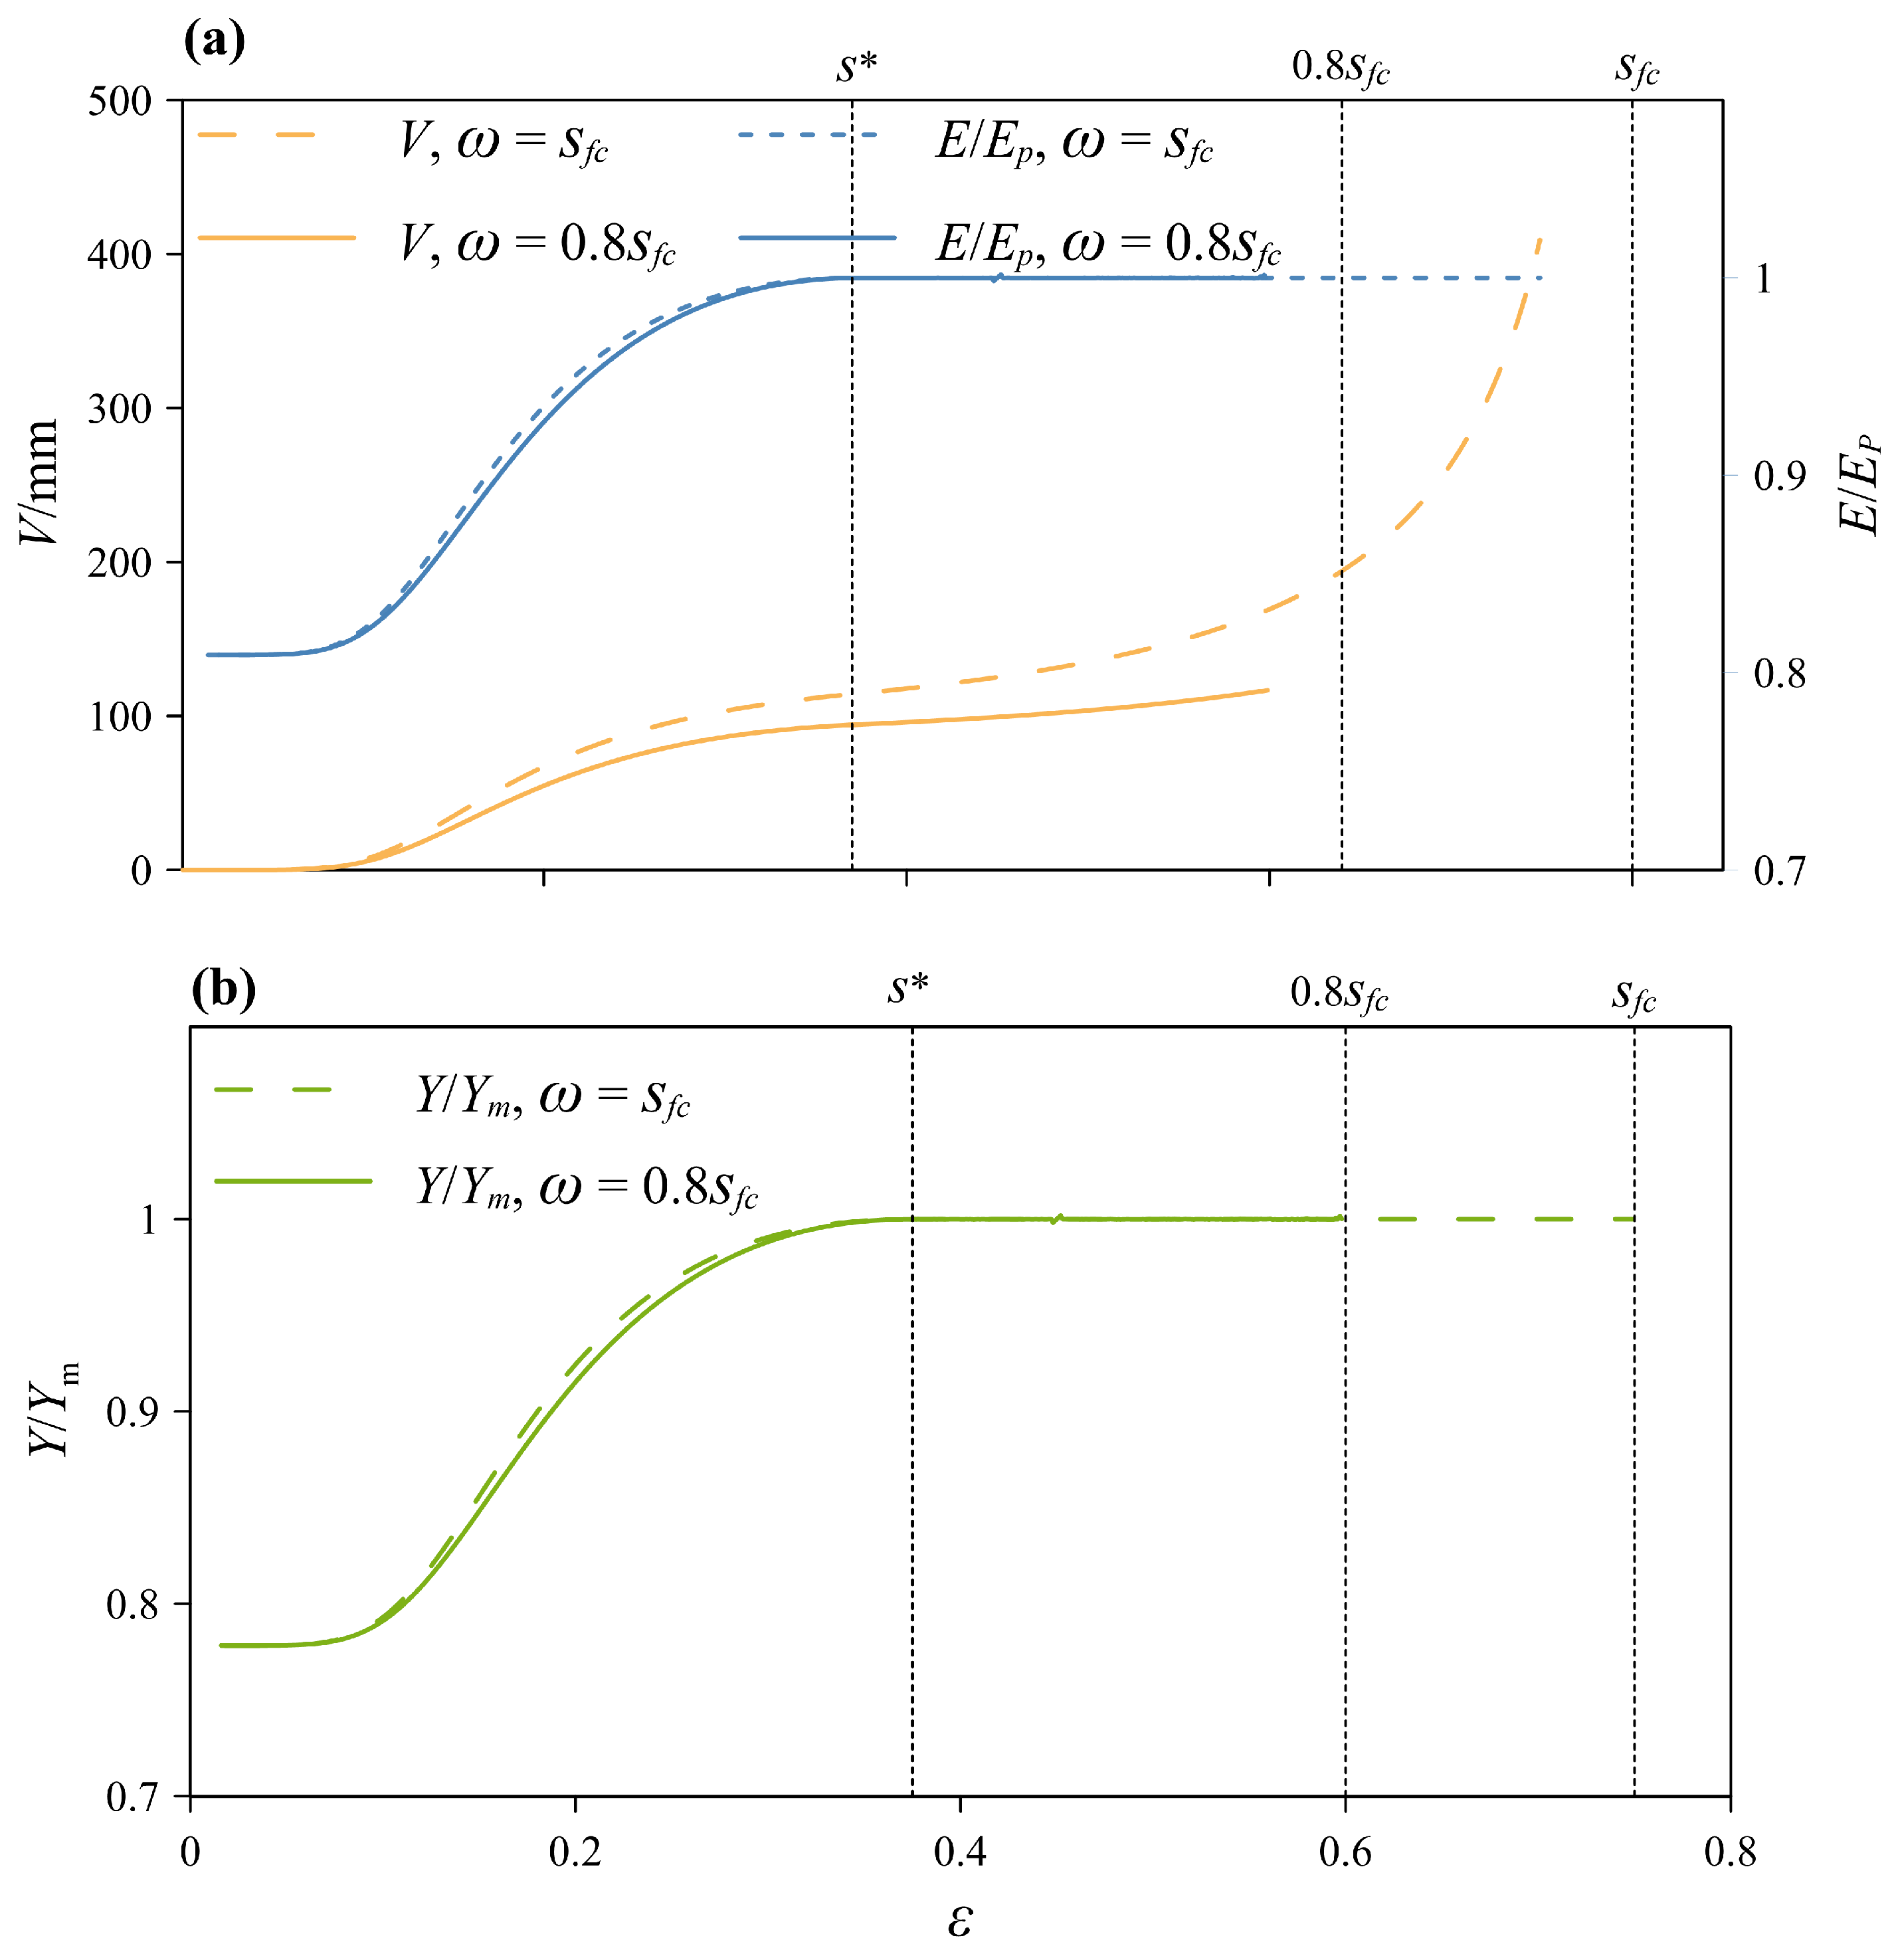
3.3. Effect of Water Regulation on Net Irrigation Water Requirement and Relative Yield

Figure 3 illustrates the effects of different irrigation lower limits (ε) on the net irrigation water requirement, relative evapotranspiration, and relative yield of summer maize in the study area. Two irrigation upper limit (ω) scenarios are considered here: Scenario I with ω = sfc and Scenario II with ω = 0.8 sfc.
As depicted in Figure 3a, the net irrigation water requirement gradually increased in scenarios I and II as r ε values rose. Notably, scenario I exhibited a higher net irrigation water requirement compared to scenario II, and the disparity between the two scenarios steadily increased as ε increased. In terms of relative evapotranspiration, both scenarios experienced an increase with increasing ε, eventually stabilizing when ε reached s*. Interestingly, the differences in relative evapotranspiration between the two scenarios remained relatively small for various ε values.
The trend in relative yield of summer maize mirrored that of relative evapotranspiration (Figure 3b). Importantly, the relative yields of summer maize for both scenarios showed no significant variations across different ε.

3.4. Irrigation Strategies Analysis

In order to evaluate the effect of different soil moisture-based thresholds irrigation strategies in the study area for long-term implementation, based on the rainfall parameters and potential evapotranspiration probability distribution functions obtained from the analysis above, a long series (4000a) of α, λ, and Ep sample spaces were simulated using a computer pseudo-random number generator, and the irrigation water demand, relative evapotranspiration and relative yield of different moisture regulation patterns were calculated by substituting them into the above equations and listed in Table 2.
Overall, as the lower and upper irrigation limits decrease, there is a corresponding decrease in net irrigation water requirement. The relative evapotranspiration and yield of mode E(rainfed) were significantly lower than those of the irrigated model, and the inter-annual variation was more pronounced, indicating more severe water stress during the growth of summer maize. Relative evapotranspiration and relative for four full irrigation modes is close to 100%.
In terms of deficit irrigation, mode B1 demonstrated the highest relative yield and net irrigation water requirement. Unlike mode B1, B2 showed less net water irrigation requirement but declined in relative yield. When considering both crop yield and net irrigation water requirement, mode B2 emerged as the optimal choice in the study area. This mode led to a reduction of approximately 24% in net irrigation water requirement while only causing a minor decrease in yield, approximately 2%, compared to mode A1.
While the irrigation requirements for modes B3 and B4 decreased compared to full irrigation modes and deficit irrigation (B1 and B2), the relative yield for modes B3 and B4 experienced a more significant drop, exceeding 4% compared to full irrigation. It is important to note that this yield decline is solely attributed to water stress, and in actual practice, it may be even more substantial. Therefore, careful consideration is advised when contemplating the adoption of modes B3 and B4.
The relative frequencies of net irrigation water requirements for different water regulation modes are listed in Table 3.
Notable differences in the probability distribution of net irrigation water requirements are observed, particularly in the ranges of less than 100 mm and more than 300 mm. Full irrigation exhibits a higher probability of net irrigation water requirements exceeding 300 mm than deficit irrigation. Conversely, the likelihood of net requirements below 50 mm is higher in full irrigation. As lower and upper irrigation limits decrease, the probability of net irrigation water requirements for summer maize falling below 50 mm gradually increases, while the probability of exceeding 50 mm decreases.

4. Discussion

Crafting effective irrigation strategies requires a delicate equilibrium between maximizing crop yield and optimizing the amount of irrigation for sustainable water use. On the one hand, irrigation is vital as the rain-fed mode is characterized by low actual evapotranspiration, significant inter-annual variation, and a relatively low, unstable yield. Numerous studies have scrutinized the challenges of rainfed maize cultivation. In periods of anticipated water scarcity, the rainfed strategy yielded less than 40% in the study sites of the Corn Belt, as indicated by the research findings [31]. Similarly, compared to full irrigation, there was a substantial reduction in average annual grain yield, particularly under rainfed conditions, reaching 58.8% [32]. Additionally, a single irrigation at a specific growth stage significantly boosted maize yield by 17% compared to rainfed cultivation [33]. On the other hand, reducing irrigation use has the potential to alleviate groundwater decline, possibly even halting it [34]. Therefore, choosing the most suitable irrigation strategy should align with the available water resources and carefully consider the anticipated yield in the study area.
Distinct irrigation strategies exhibit varying impacts on net water requirements and crop yield. The adjustment of upper and lower irrigation limits serves as a pivotal tool to manage irrigation volume and yield levels. Insights from the study suggest that, under the same lower irrigation limit (ε), appropriately reducing the upper irrigation limit (ω) does not significantly affect crop yield but results in a noteworthy reduction in net water requirement. This implies that, in the context of irrigation, decreasing either the upper or lower limit appropriately can effectively reduce net irrigation water usage without adversely affecting summer corn yield. Similar research, such as the study on apple trees–soybean intercropping systems by Wang et al. [35], recommends the adoption of upper irrigation limits at 80% FC and 65% FC during water-abundant and deficit years, respectively. Additionally, controlling soil moisture based on root-sourced signal characteristics of plants has demonstrated the potential to enhance water use efficiency (WUE) and irrigation water use efficiency (IWUE) in winter wheat [36].
In expanding the application of the methods proposed in this article to various scenarios and incorporating rainfall impact into the formulation of irrigation strategies, several critical considerations emerge.
The predictability of rainfall is pivotal for timely adjustments to irrigation strategy. Research indicates that predictability and unpredictability (randomness) coexist in rainfall patterns. However, within a time-window, predictability prevails. Specifically, in high-resolution rainfall time series, the time-window is 10 minutes [37]. In employing the Monte Carlo method for rainfall and evapotranspiration series generation, the preservation of probability distribution is undertaken without incorporating Hurst-Kolmogorov (HK) behavior. This decision stems from utilizing a dataset limited to 62a in this paper. However, recognizing the need for a more comprehensive analysis in a longer time series, including HK behavior becomes essential. The HK behavior effectively captures the elevated volatility inherent in rainfall and evapotranspiration processes, providing a more accurate representation of their uncertainties [38,39].
Lastly, the effects of groundwater evapotranspiration are intentionally disregarded due to the deep groundwater table depth in the research region. Groundwater evapotranspiration becomes relevant only when the groundwater table depth is smaller than the ultimate evapotranspiration depth [40,41]. In such situations, future studies should consider groundwater evapotranspiration, and corresponding calculation formulas should be refined for a more comprehensive analysis.

5. Conclusions

In the context of prolonged, random fluctuations in rainfall parameters and potential evapotranspiration within the research region, a decrease in both lower and upper irrigation limits corresponds to a reduction in net irrigation water requirement for both full and deficit irrigation modes, with a more substantial decrease in yield observed for deficit irrigation modes.
Full irrigation modes A1 (ε = 0.6 sfc, ω = sfc) and A3 (ε = 0.6 sfc, ω = sfc) ensure stable and high summer maize yields but come with a relatively high net irrigation water requirement. Full irrigation A2 (ε = 0.6 sfc, ω = 0.8 sfc) and A4 (ε = 0.6 sfc, ω = 0.8 sfc) yield the same level of output but with less net irrigation water requirement. On the other hand, deficit irrigation methods B1 (ε = 0.4 sfc, ω = sfc) and B2 (ε = 0.4 sfc, ω = 0.8 sfc) maintain a slightly decreased yield while demanding less net irrigation water. In contrast, the rainfed mode (E) exhibits lower actual evapotranspiration, greater year-to-year variability, and less stable yields.

Author Contributions

Conceptualization, Z.H.; methodology, Z.H. and T.L.; software, T.L. and Z.H.; validation, T.L., D.W. and X.W.; formal analysis, T.L. and X.C.; investigation, D.W. and Z.H.; resources, X.W.; data curation, T.L. and Z.H.; writing—original draft preparation, Z.H. and T.L.; writing—review and editing, Z.H. and T.L.; visualization, T.L. and X.C.; supervision, Z.H.; project administration, Z.H.; funding acquisition, Z.H. All authors have read and agreed to the published version of the manuscript.

Funding

This work was funded by the National Key R&D Program of China (2022YFF0711800).

Data Availability Statement

The data supporting the findings of this study are available from the corresponding author upon reasonable request.

Acknowledgments

The authors would like to thank the funding providers of the project. All support and assistance are sincerely appreciated.

Conflicts of Interest

The authors declare no conflict of interest.

References

  1. Hu, Q.; Ma, X.Q.; He, H.Y.; Pan, F.F.; He, Q.J.; Huang, B.X.; Pan, X.B. Warming and Dimming: Interactive Impacts on Potential Summer Maize Yield in North China Plain. Sustainability 2019, 11, 2588. [Google Scholar] [CrossRef]
  2. Feng, Z.; Hu, T.; Tai, A.P.K.; Calatayud, V. Yield and economic losses in maize caused by ambient ozone in the North China Plain (2014–2017). Sci. Total Environ. 2020, 722, 137958. [Google Scholar] [CrossRef] [PubMed]
  3. Hu, Z.; Wu, Z.; Zhang, Y.; Li, Q.; Islam, A.R.M.T.; Pan, C. Risk assessment of drought disaster in summer maize cultivated areas of the Huang-Huai-Hai plain, eastern China. Environ. Monit. Assess. 2021, 193, 441. [Google Scholar] [CrossRef] [PubMed]
  4. Wang, H.; Ren, H.; Zhang, L.; Zhao, Y.; Liu, Y.; He, Q.; Li, G.; Han, K.; Zhang, J.; Zhao, B.; et al. A sustainable approach to narrowing the summer maize yield gap experienced by smallholders in the North China Plain. Agric. Syst. 2023, 204, 103541. [Google Scholar] [CrossRef]
  5. Meng, Q.; Chen, X.; Lobell, D.B.; Cui, Z.; Zhang, Y.; Yang, H.; Zhang, F. Growing sensitivity of maize to water scarcity under climate change. Sci. Rep. 2016, 6, 19605. [Google Scholar] [CrossRef]
  6. Liu, J.; Si, Z.; Wu, L.; Shen, X.; Gao, Y.; Duan, A. High-low seedbed cultivation drives the efficient utilization of key production resources and the improvement of wheat productivity in the North China Plain. Agric. Water Manag. 2023, 285, 108357. [Google Scholar] [CrossRef]
  7. Leng, G.; Tang, Q.; Huang, M.; Leung, L.-Y.R. A comparative analysis of the impacts of climate change and irrigation on land surface and subsurface hydrology in the North China Plain. Reg. Environ. Change 2014, 15, 251–263. [Google Scholar] [CrossRef]
  8. Xu, Z.C.; Chen, X.Z.; Wu, S.R.; Gong, M.M.; Du, Y.Y.; Wang, J.Y.; Li, Y.K.; Liu, J.G. Spatial-temporal assessment of water footprint, water scarcity and crop water productivity in a major crop production region. J. Clean. Prod. 2019, 224, 375–383. [Google Scholar] [CrossRef]
  9. Zhong, H.; Sun, L.; Fischer, G.; Tian, Z.; van Velthuizen, H.; Liang, Z. Mission Impossible? Maintaining regional grain production level and recovering local groundwater table by cropping system adaptation across the North China Plain. Agric. Water Manag. 2017, 193, 1–12. [Google Scholar] [CrossRef]
  10. Wang, Y.; Jiang, K.; Shen, H.; Wang, N.; Liu, R.; Wu, J.; Ma, X. Decision-making method for maize irrigation in supplementary irrigation areas based on the DSSAT model and a genetic algorithm. Agric. Water Manag. 2023, 280, 108231. [Google Scholar] [CrossRef]
  11. Shan, Y.; Li, G.; Tan, S.; Su, L.; Sun, Y.; Mu, W.; Wang, Q. Optimizing the Maize Irrigation Strategy and Yield Prediction under Future Climate Scenarios in the Yellow River Delta. Agronomy 2023, 13, 960. [Google Scholar] [CrossRef]
  12. Porporato, A.; D’Odorico, P.; Laio, F.; Ridolfi, L.; Rodriguez-Iturbe, I. Ecohydrology of water-controlled ecosystems. Adv. Water Resour. 2002, 25, 1335–1348. [Google Scholar] [CrossRef]
  13. Pan, X.Y.; Zhang, L.; Potter, N.J.; Xia, J.; Zhang, Y.Q. Probabilistic modelling of soil moisture dynamics of irrigated cropland in the North China Plain. Hydrol. Sci. J. J. Des. Sci. Hydrol. 2011, 56, 123–137. [Google Scholar] [CrossRef]
  14. Bassiouni, M.; Manzoni, S.; Vico, G. Optimal plant water use strategies explain soil moisture variability. Adv. Water Resour. 2023, 173, 104405. [Google Scholar] [CrossRef]
  15. Albano, R.; Manfreda, S.; Celano, G. MY SIRR: Minimalist agro-hYdrological model for Sustainable IRRigation management—Soil moisture and crop dynamics. SoftwareX 2017, 6, 107–117. [Google Scholar] [CrossRef]
  16. Kan, G.; Li, C.; Zuo, D.; Fu, X.; Liang, K. Massively Parallel Monte Carlo Sampling for Xinanjiang Hydrological Model Parameter Optimization Using CPU-GPU Computer Cluster. Water 2023, 15, 2810. [Google Scholar] [CrossRef]
  17. Kunnath-Poovakka, A.; Ryu, D.; Eldho, T.I.; George, B. Parameter Uncertainty of a Hydrologic Model Calibrated with Remotely Sensed Evapotranspiration and Soil Moisture. J. Hydrol. Eng. 2021, 26, 04020070. [Google Scholar] [CrossRef]
  18. Baig, F.; Sherif, M.; Faiz, M.A. Quantification of Precipitation and Evapotranspiration Uncertainty in Rainfall-Runoff Modeling. Hydrology 2022, 9, 51. [Google Scholar] [CrossRef]
  19. Koutsoyiannis, D. Stochastics of Hydroclimatic Extremes—A Cool Look at Risk; Kallipos Open Academic Editions: Athens, Greece, 2023; 391p, ISBN 978-618-85370-0-2. [Google Scholar] [CrossRef]
  20. Iliopoulou, T.; Koutsoyiannis, D. Revealing hidden persistence in maximum rainfall records. Hydrol. Sci. J. 2019, 64, 1673–1689. [Google Scholar] [CrossRef]
  21. Rodríguez-Iturbe, I.; Porporato, A.; NetLibrary, I. Ecohydrology of Water-Controlled Ecosystems: Soil Moisture and Plant Dynamics; Cambridge University Press: Cambridge, UK, 2004. [Google Scholar]
  22. Allen, R.G.; Pereira, L.S.; Raes, D.; Smith, M. Crop evapotranspiration: Guidelines for computing crop water requirements. In FAO Irrigation and Drainage Paper; FAO: Rome, Italy, 1998; Volume xxvi, 300p. [Google Scholar]
  23. Song, N.; Sun, J.; Wang, J.; Chen, Z.; Qiang, X.; Liu, Z. Analysis of difference in crop coefficients based on modified Penman and Penman-Monteith equations. Trans. Chin. Soc. Agric. Eng. 2013, 29, 88–97. [Google Scholar]
  24. Tegos, A.; Stefanidis, S.; Cody, J.; Koutsoyiannis, D. On the Sensitivity of Standardized-Precipitation-Evapotranspiration and Aridity Indexes Using Alternative Potential Evapotranspiration Models. Hydrology 2023, 10, 64. [Google Scholar] [CrossRef]
  25. Vico, G.; Porporato, A. From rainfed agriculture to stress-avoidance irrigation: I. A generalized irrigation scheme with stochastic soil moisture. Adv. Water Resour. 2011, 34, 263–271. [Google Scholar] [CrossRef]
  26. Rodriguez-Iturbe, I.; Porporato, A.; Laio, F.; Ridolfi, L. Plants in water-controlled ecosystems: Active role in hydrologic processes and response to water stress—I. Scope and general outline. Adv. Water Resour. 2001, 24, 695–705. [Google Scholar] [CrossRef]
  27. Stewart, J.I.; Hagan, R.M.; Pruitt, W.O.; Danielson, R.E.; Franklin, W.T.; Hanks, R.J.; Riley, J.P.; Jackson, E.B. “Optimizing Crop Production through Control of Water and Salinity Levels in the Soil”. Reports. Paper 67. 1977. Available online: https://digitalcommons.usu.edu/water_rep/67 (accessed on 15 November 2023).
  28. Kang, S. Introduction to Agriculture Water-Soil Engineering; China Agriculture Press: Beijing, China, 2007. [Google Scholar]
  29. Wang, D.; Li, J.; Rao, M. Estimation of net interception loss by crop canopy under sprinkler irrigation based on energy balance. Trans. Chin. Soc. Agric. Eng. 2007, 23, 27–33. [Google Scholar]
  30. Wang, S.; Duan, A.; Zhang, Z.; Xu, J. Winter wheat irrigation schedule on stochastic precipitation. Trans. Chin. Soc. Agric. Eng. 2010, 26, 47–52. [Google Scholar]
  31. Orduña, A.; Schütze, N.; Niyogi, D. Evaluation of Hydroclimatic Variability and Prospective Irrigation Strategies in the U.S. Corn Belt. Water 2019, 11, 2447. [Google Scholar] [CrossRef]
  32. Sun, H.; Zhang, X.; Wang, E.; Chen, S.; Shao, L. Quantifying the impact of irrigation on groundwater reserve and crop production—A case study in the North China Plain. Eur. J. Agron. 2015, 70, 48–56. [Google Scholar] [CrossRef]
  33. Wang, B.; van Dam, J.; Yang, X.; Ritsema, C.; Du, T.; Kang, S. Reducing water productivity gap by optimizing irrigation regime for winter wheat-summer maize system in the North China Plain. Agric. Water Manag. 2023, 280, 108229. [Google Scholar] [CrossRef]
  34. Mao, X.; Jia, J.; Liu, C.; Hou, Z. A simulation and prediction of agricultural irrigation on groundwater in well irrigation area of the piedmont of Mt. Taihang, North China. Hydrol. Process. 2005, 19, 2071–2084. [Google Scholar] [CrossRef]
  35. Wang, L.; Wang, R.; Luo, C.; Dai, H.; Xiong, C.; Wang, X.; Zhang, M.; Xiao, W. Effects of Different Soil Water and Heat Regulation Patterns on the Physiological Growth and Water Use in an Apple–Soybean Intercropping System. Agronomy 2023, 13, 511. [Google Scholar] [CrossRef]
  36. Ma, S.-C.; Zhang, W.-Q.; Duan, A.-W.; Wang, T.-C. Effects of controlling soil moisture regime based on root-sourced signal characteristics on yield formation and water use efficiency of winter wheat. Agric. Water Manag. 2019, 221, 486–492. [Google Scholar] [CrossRef]
  37. Dimitriadis, P.; Koutsoyiannis, D.; Tzouka, K. Predictability in dice motion: How does it differ from hydro-meteorological processes? Hydrol. Sci. J. 2016, 61, 1611–1622. [Google Scholar] [CrossRef]
  38. Dimitriadis, P.; Koutsoyiannis, D.; Iliopoulou, T.; Papanicolaou, P. A Global-Scale Investigation of Stochastic Similarities in Marginal Distribution and Dependence Structure of Key Hydrological-Cycle Processes. Hydrology 2021, 8, 59. [Google Scholar] [CrossRef]
  39. Dimitriadis, P.; Tegos, A.; Koutsoyiannis, D. Stochastic Analysis of Hourly to Monthly Potential Evapotranspiration with a Focus on the Long-Range Dependence and Application with Reanalysis and Ground-Station Data. Hydrology 2021, 8, 177. [Google Scholar] [CrossRef]
  40. Hou, X.; Yang, H.; Cao, J.; Feng, W.; Zhang, Y. A Review of Advances in Groundwater Evapotranspiration Research. Water 2023, 15, 969. [Google Scholar] [CrossRef]
  41. Schoeller, H. Les Eaux Souterraines; Masson: Wargnies-le-Grand, France, 1962. [Google Scholar]
Figure 1. Interannual variations of rainfall parameters (α and λ) and potential evapotranspiration (Ep). (a,c,e) are the probability density of α, λ and Ep, respectively; (b,d,f) are the cumulative density of α, λ and Ep, respectively.
Agronomy 13 02849 g001
Figure 2. Probability density functions of soil moisture for eight irrigation strategies controlled by four irrigation lower limits (ε) and two irrigation upper limits (ω). (a,b) are four irrigation strategies; (c,d) are four irrigation strategies.
Agronomy 13 02849 g002
Figure 3. Irrigation requirement (V), relative evapotranspiration, and relative yield (Y/Ym) as a function of irrigation lower limit (ε) for two irrigation upper limits (ω). (a,b) depicts how alterations in the lower irrigation limit directly affect the net irrigation requirement and relative evapotranspiration, as well as relative yield, respectively, in two sceneries (ω = sfc and ω = 0.8 sfc).
Agronomy 13 02849 g003
Table 1. Simulation scheme design for irrigation, featuring full irrigation strategies (A1, A2, A3, A4), deficit irrigation strategies (B1, B2, B3, B4), and rainfed mode (E). The irrigation strategies are controlled by various percentages of the field water-holding capacity (sfc).
Soil Water RegulationIrrigation Lower LimitIrrigation Upper Limit
A10.6 sfcsfc
A2 0.6 sfc0.8 sfc
A3 0.5 sfcsfc
A40.5 sfc0.8 sfc
B10.4 sfcsfc
B20.4 sfc0.8 sfc
B30.3 sfcsfc
B40.3 sfc0.8 sfc
E--
Table 2. The mean and coefficient of variation of irrigation requirement (V), relative evapotranspiration (E/Ep), and relative yield (Y/Ym) for different Irrigation strategies: full irrigation strategy (A1, A2, A3, A4), deficit irrigation strategy (B1, B2, B3, B4), and rainfed mode (E).
Irrigation StrategiesThe Upper and Lower LimitVE/EpY/Ym
ε ω MeanCVMeanCVMeanCV
A10.6 sfcsfc138.55 0.500 100%0100%0
A20.6 sfc0.8 sfc117.76 0.603 100%0100%0
A30.5 sfcsfc129.26 0.566 100%0100%0
A40.5 sfc0.8 sfc113.57 0.648 100%0100%0
B10.4 sfcsfc118.51 0.626 99.14%0.005 99.01%0.005
B20.4 sfc0.8 sfc105.42 0.692 98.86%0.007 98.68%0.008
B30.3 sfcsfc96.91 0.726 95.72%0.023 95.04%0.027
B40.3 sfc0.8 sfc85.12 0.779 94.82%0.031 93.99%0.036
E --0075.41%0.257 71.47%0.315
Table 3. Relative frequency of irrigation requirements for full irrigation strategy (A1, A2, A3, A4) and deficit irrigation strategy (B1, B2, B3, B4).
Irrigation Strategies<50 mm50–100 mm100–150 mm150–200 mm200–250 mm250–300 mm>300 mm
A19.78%23.15%25.70%20.85%13.15%6.58%0.80%
A219.40%27.20%23.05%15.05%10.23%4.53%0.55%
A315.70%23.63%23.13%18.48%12.18%6.13%0.78%
A4 23.60%25.38%21.33%14.63%10.03%4.50%0.55%
B121.80%22.83%22.38%16.45%11.38%4.73%0.45%
B228.43%24.43%20.03%14.23%9.30%3.33%0.28%
B332.33%23.55%19.90%14.23%7.95%2.03%0.03%
B438.33%24.68%18.05%11.95%6.03%0.98%0.00%
Disclaimer/Publisher’s Note: The statements, opinions and data contained in all publications are solely those of the individual author(s) and contributor(s) and not of MDPI and/or the editor(s). MDPI and/or the editor(s) disclaim responsibility for any injury to people or property resulting from any ideas, methods, instructions or products referred to in the content.

