Article

Effects of Phosphate Application Rate on Grain Yield and Nutrition Use of Summer Maize under the Coastal Saline-Alkali Land

1
State Key Laboratory of Nutrient Use and Management, National Agricultural Experimental Station for Soil Quality (Jinan), Institute of Agricultural Resources and Environment, Shandong Academy of Agricultural Sciences, Jinan 250100, China
2
National Center of Technology Innovation for Comprehensive Utilization of Saline-Alkali Land, Institute of Modern Agriculture on Yellow River Delta, Shandong Academy of Agricultural Sciences, Dongying 257091, China
3
College of Water Conservancy and Civil Engineering, Shandong Agricultural University, Tai’an 271018, China
4
Shandong Academy of Agricultural Machinery Science, Shandong Academy of Agricultural Sciences, Jinan 250100, China
*
Author to whom correspondence should be addressed.
These authors contributed equally to this work.
Agronomy 2023, 13(11), 2668; https://doi.org/10.3390/agronomy13112668
Submission received: 13 September 2023 / Revised: 18 October 2023 / Accepted: 20 October 2023 / Published: 24 October 2023

Abstract

:
Saline-alkali soil is a major threat to global food security. Phosphorus (P) fertilizer is essential for crop growth and yield production. Nevertheless, the optimal phosphate fertilizer application rates for summer maize under coastal saline–alkali soil are still unclear. A field experiment with five phosphate application rates (0, 45, 90, 135, and 180 kg ha−1, referred to as T1, T2, T3, T4, and T5, respectively) was conducted during the 2018–2020 summer maize seasons study the effects of phosphate rates on the grain yield, biomass, and nitrogen (N), P and potassium (K) accumulation, and N, P, and K physiological efficiency (denoted as NPE, PPE and KPE, respectively). Results showed that P application notably improved maize grain and biomass yield, the total uptake of N, P, K, and NPE and KPE across three seasons. As the P addition increased to 135 kg ha−1, the grain yield achieved a maximum of 7168.4 kg ha−1, with an average NPE of 2.15 kg kg−1, PPE of 0.19 kg kg−1, and KPE of 1.49 kg kg−1. However, PPE continuously decreased with the input of phosphate. P application rates exceeding 135 kg ha−1 were not considered effective due to a decline in grain yield, nutrient uptake, and NPE. Furthermore, the effect of the planting season was significant on the total uptake of N and K, and the use efficiency of N, P, and K. TOPSIS revealed that a phosphate application rate of 90–135 kg ka−1 was the optimal pattern for maize production. These results may give a theoretical basis for the phosphate management of maize production in saline–alkali soil.

1. Introduction

Soil salinization is widely distributed worldwide, with a large area of approximately 0.8 billion hectares [1,2]. China, for instance, has approximately 9913 hectares of saline–alkali land, including more than 0.14 hectares of coastal saline–alkali land area, which accounts for 10.37% of the national cultivated land area [3]. Coastal saline–alkali soil has long been influenced by the ocean and continental interactions. In particular, the Yellow River Delta (YRD) in China is a typical coastal saline–alkali land. The salinity ranges from 0.2 to 4.6 g kg−1 in coastal saline–alkali soils in China, which is a serious menace to crop productivity and decreases grain yield by 10–90% [3,4]. This is largely because saline–alkali cultivated land has a poor soil pore structure and groundwater salinization [5,6]. In order to meet the challenges of global food security, improving the production capacity of saline–alkali land has become an urgent task [7,8].
Fertilizer application is considered to be one of the key essential and manageable methods in the reclamation of saline–alkali soils and the improvement in saline soil quality [9,10,11]. Phosphate fertilizer (P) is a critical component in many essential organic compounds in living organisms [12,13]. However, under coastal saline conditions, P uptake by crop roots is always restrained by competition of Na+, Cl, and other salt ions, resulting in low P availability [14]. Additionally, low P availability, in turn, affects the uptake of other nutrients, such as nitrogen (N) and potassium (K), and restricts the growth and yield of crops in coastal alkaline soils [15,16,17]. To avoid P deficiency, farmers usually excessively input P fertilizer to achieve higher yields. MacDonald et al. [18] previously reported that the amount of P investment into cropland soils has exceeded the crop demand for P, leading to a global agronomic surplus of more than 13 kg P ha−1. Evidence has shown that long-term over-fertilization of P leads to not only the degradation of soil quality [19] and the eutrophication of surface water [14] but also the achievement of sustainable agriculture [20,21]. Moreover, excessive P application tends to decrease the P-utilization efficiency (PUE) and other nutrient use efficiencies, including nitrogen (N) and potassium (K), eventually resulting in a decrease in crop yield [22,23,24]. In contrast, a suitable increase in P could improve crop yield quality as well as maintain the balance of soil nutrients [5,25,26,27]. Ullah et al. [28] reported that P input can balance soil N deficit and stimulate root formation, improving the storage capacity of inorganic P, thus determining crop tolerance to extreme environments. However, the rate of P addition on soil quality and plant yield is still controversial. For example, Xu et al. [21] reported that the optimal P rate was 90–135 kg P2O5 ha−1 to maximize yield and PUE. Whereas a Gaussian model analysis suggested that input rate ranging from 10 to 30 kg P2O5 ha−1 can decrease the mineralization and nutrient accumulation in soil and result in soil N, P, and K balance [29]. Recently, the technique for order preference by similarity to ideal solution (TOPSIS) has been used to comprehensively assess the performance of fertilizer application based on grain yield, resource use efficiency, and crop quality [30,31,32,33]. There were certain differences in various evaluation results for different treatments, which may be due to the algorithms and data utilization of analysis methods [30,33]. Li et al. [30] reported that TOPSIS performed best in assessing crop productivity and fruit quality under various water and nitrogen schedules relative to other approaches, thus using reasonable algorithms to make the evaluation of P application input in coastal saline–alkali soil more objective and scientific [33,34].
Maize (Zea mays L.), as an important crop, contributes one-third of grain production worldwide. Maize has been defined as a mild salt-tolerant crop and is widely grown in coastal saline–alkali land in summer. Most research on maize yield or fertilizer use efficiency in response to P rates is conducted in non-saline land, but few studies have been conducted on P rates in saline–alkali soils, especially in coastal saline–alkali areas. In fact, soil salinization had a certain inhibitory effect on the germination and growth of maize due to the soil salinity and poor structure [35]. Salt stress also hinders the development and growth of crop root systems, which seriously limits nutrient absorption and reduces phosphorus bioavailability. Therefore, more research is needed to explore the appropriate phosphate application management for summer maize production to meet the demands of future sustainable agriculture in coastal saline–alkali areas. The aim of this study was as follows: (1) Study the effect of different phosphorus rates on the grain and biomass yield of summer maize; N, P, and K uptake; and N, P, and K harvest index in coastal saline–alkali land. (2) Establish the optimum phosphorus fertilizer scheduling using the TOPSIS model for balancing yield and nutrition use. These results will provide the basis for phosphorus fertilizer scheduling management in summer maize fields under coastal saline–alkali land.

2. Materials and Methods

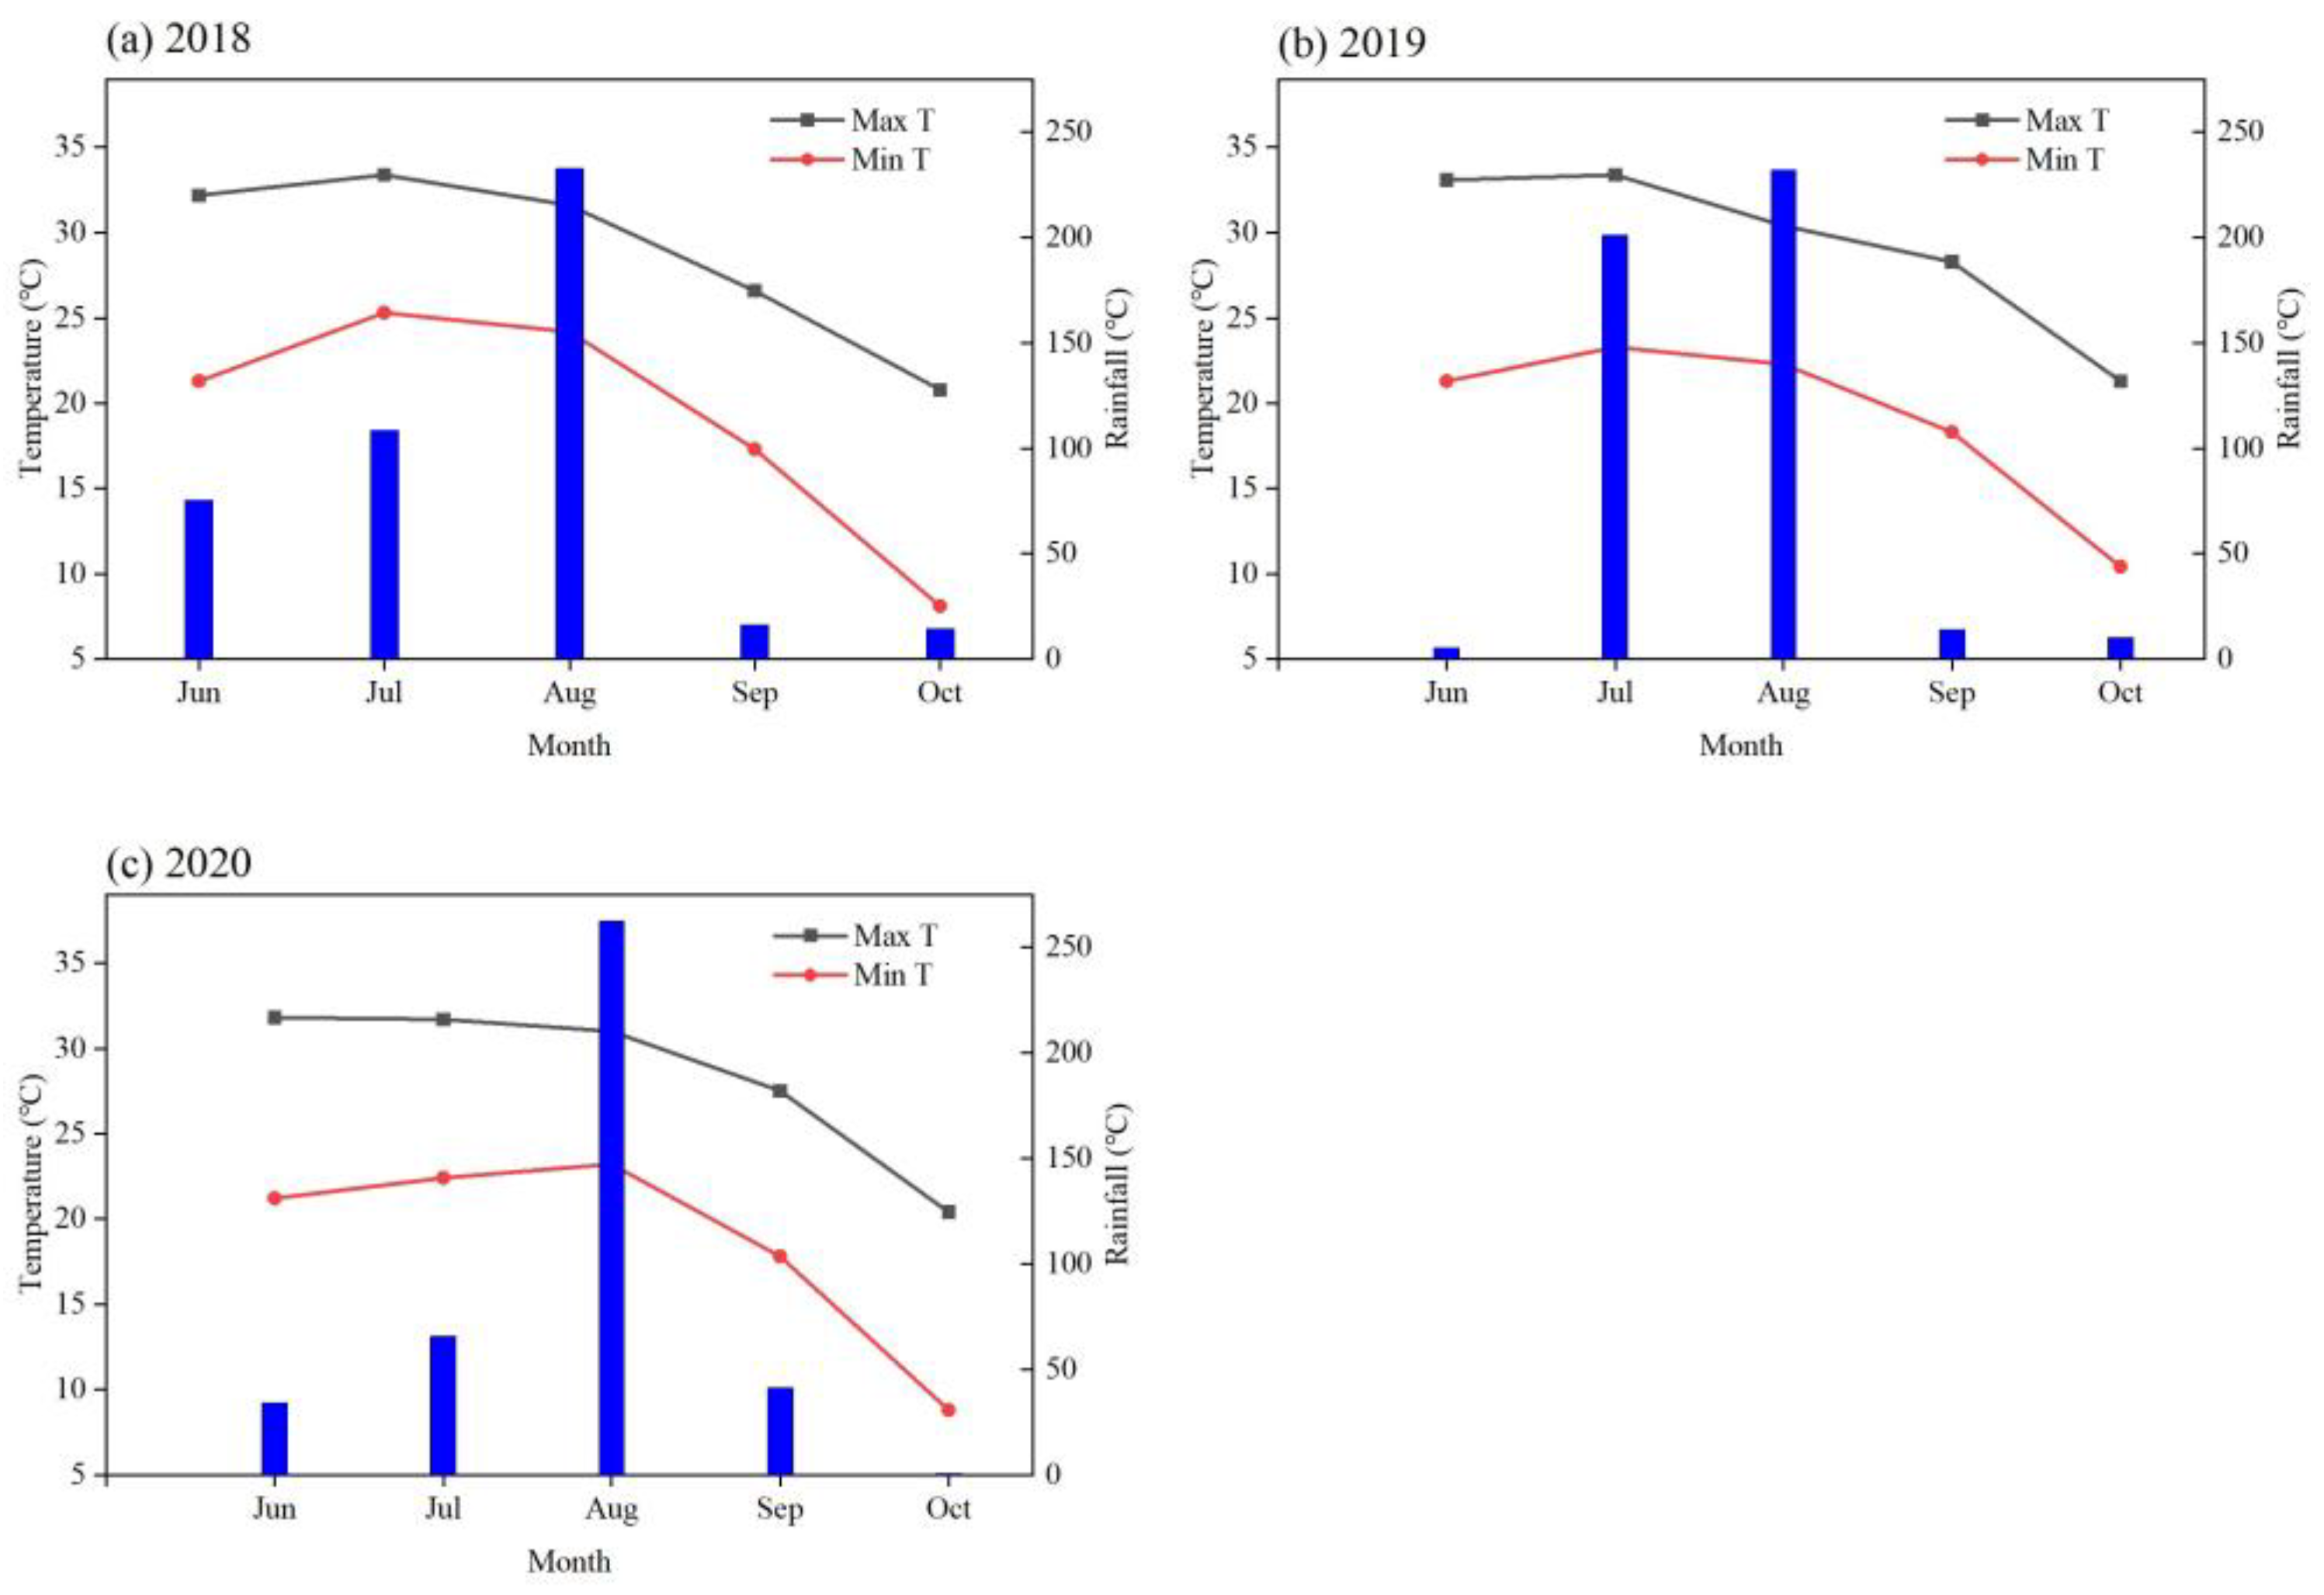
2.1. Experimental Site

A field experiment was performed over three summer maize growing seasons (2018, 2019, and 2020) at the Shuofeng family farm, Wudi County, Shandong Province, China (37.77° N, 117.63° E). Warm temperate continental monsoon climate prevails in the experimental area, with a 600 mm mean annual rainfall and a 13.6 °C mean air temperature. The effective rainfall during the maize-growing season in 2018, 2019, and 2020 was 447.4, 462.7, and 404.6 mm, respectively (Figure 1). Soil available N, P, and K in the 0–40 cm soil layer were 50.7 mg kg−1, 10.4 mg kg−1, and 152.0 mg kg−1, respectively, and the soil organic matter was 1.0%.

2.2. Experimental Design and Data Collection

In this study, five phosphate fertilizer treatments were tested for maize production, i.e., 0, 45, 90, 135, and 180 kg P2O5 ha−1 (denoted as T1, T2, T3, T4, and T5, respectively). Each treatment was repeated three times and arranged within 15 plots. Each plot in the experimental area was 40 m2 (5 m × 8 m). The summer maize cultivar was “Xinyan 156”, which is widely cultivated in this region. The maize density was set at 50,000 plants per ha−1 (plant spacing 30 cm and row spacing 60 cm). All treatments received equal quantities of nitrogen, potassium, and calcium. The urea (46% N, 90 kg ha−1), potassium sulfate (50% K2O, 90 kg ha−1), and calcium superphosphate (13% P2O5) were applied during seedbed preparation, and no fertilizer was applied for topdressing management hereafter. Farming chemicals, pendimethalin, and indoxacarb, were used in the farmland; thus, the experimental plot was kept free of diseases and weeds during the growing seasons. The sown date was 21 June 2018, 23 June 2019, and 18 June 2020.
At maturity, the grain yield and biomass yield were measured from three randomly chosen plants per plot from the soil surface in each growing season, totaling nine plants per treatment. All plants were cut from the soil surface. The crops were harvested on 10 October 2018, 24 October 2019, and 22 October 2020. Maize samples were collected and dissected into grains, cobs, stems, and leaves. Samples of each maize organ were dried in an oven at 105 °C for 30 min and then at 75 °C till constant weight. To measure nitrogen (N), phosphorus (P), and potassium (K) content, appropriate amounts (0.1–0.2 g, accurate to 0.0001 g) of the organs were weighted and then digested using H2SO4-H2O2 for sample chemical analysis. The organs’ N concentration was measured using the Kjeldahl method [36]; P concentration was determined using the ammonium molybdate method; and K concentration was measured using an atomic absorption spectrophotometer [24].

2.3. Data Analysis

2.3.1. Total Nitrogen (N), Phosphorus (P), and Potassium (K) Uptake Content of Grain and Straw

The total N, P, and K uptake content of grain (denoted as TNgrain, TPgrain, and TKgrain, respectively) and straw (denoted as TNstraw, TPstraw, and TKstraw, respectively) were calculated by multiplying the dry weight of the organ and its N, P, K content.

2.3.2. Calculation of Nitrogen, Phosphorus, and Potassium Harvest Index

The nitrogen physiological efficiency (NPE), phosphorus physiological efficiency (PPE), and potassium physiological efficiency (KPE) were calculated using Equations (1)–(3):
NPE = GY TN grain + TN straw
PPE = GY TP grain + TP straw
KPE = GY TK grain + TK straw

2.4. Determination of Optimum Phosphorus Management Using TOPSIS

To evaluate the optimal phosphorus rate that stabilizes the effects of grain yield and N/P/K use, the TOPSIS method was used. The steps were as follows:
(1)
Construction of the evaluation indices’ contribution matrix (GY, BY, TN, TP, TK, NPE, PPE and KPE)
X = ( X ij ) n × m
where n is the number of assessment objectives; m is the number of treatments; Xij is contribution value of the ith treatment to the jth evaluation index.
(2)
Normalization of the original matrix:
X ¯ i j = X i j i = 0 n X i j 2 ,   i = 1 , 2 , n ;   j = 1 , 2 , m
(3)
Calculating the weighted normalized matrix:
V ij = X ¯ ij × W j
Positive V i j indicates the ideal best solution and negative V i j indicates the ideal worst solution. W j is the weight of the jth criterion; when the grain yield, NPK uptake, and fertilizer physiological efficiency were treated equally, W j can be taken as 1.
(4)
Calculating the Euclidean distance:
D i + = j = 1 m ( V ij V j + ) 2 D i = j = 1 m ( V ij V j ) 2
(5)
Calculating the treatments’ performance scores:
C i = D i D i + + D i
When C i is close to 1, the wheat has an optimal comprehensive advantage in terms of best balancing grain yield and fertilizer physiological efficiency.
Data processing was performed using SPSS (Version 21.0, IBM Corp., Armonk, NY, USA). The significant differences between the mean values were analyzed using one-way and two-way analysis of variance (ANOVA) according to Dennett’s test at p < 0.05 and p < 0.01 level. All graphics were carried out in Origin 2020 software (Origin Lab, Northampton, MA, USA).

3. Results

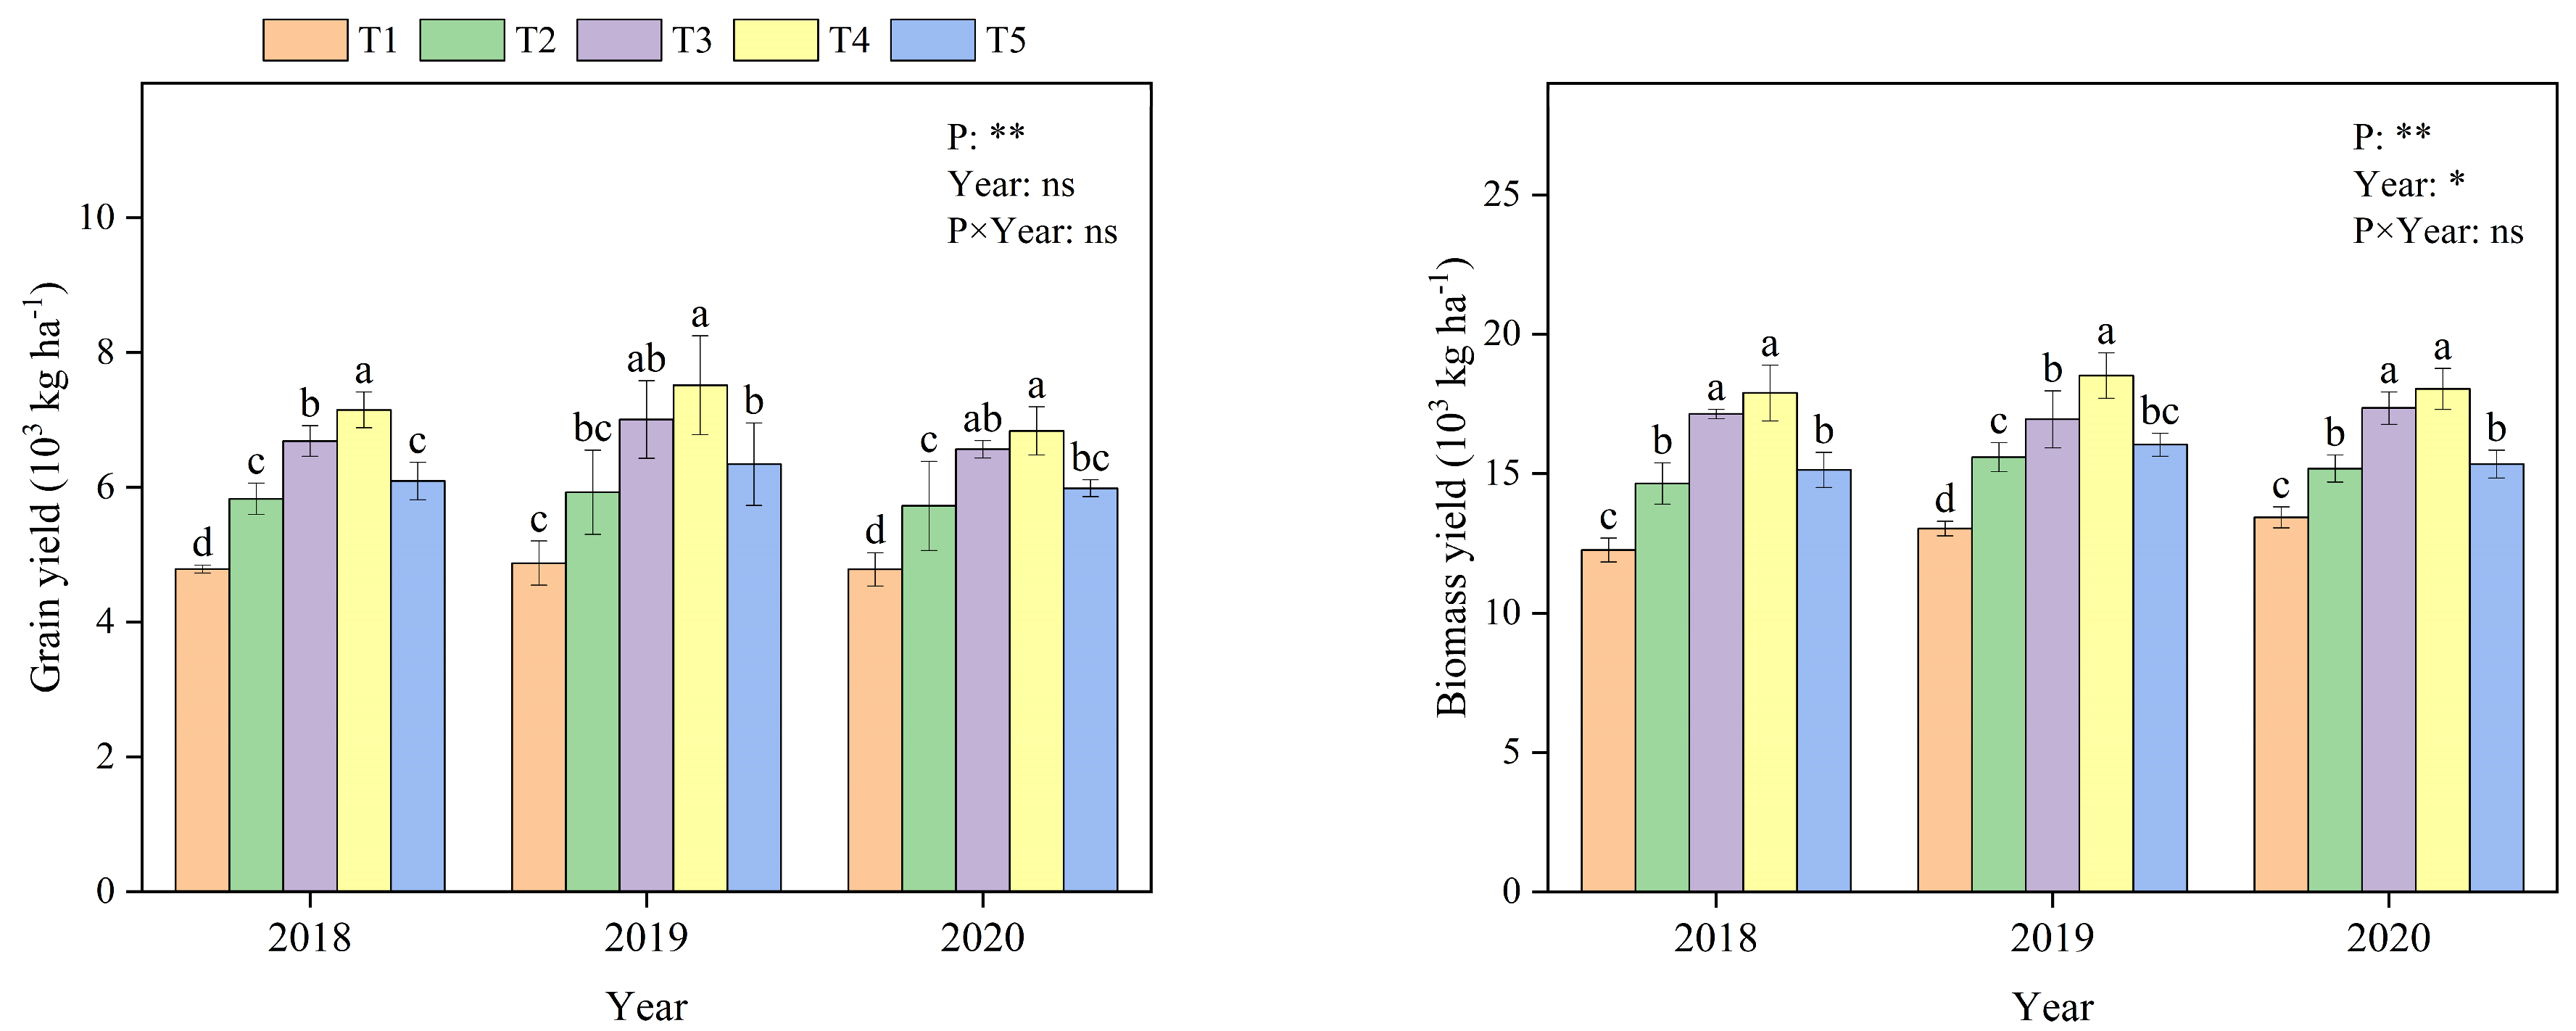
3.1. Grain Yield and Biomass Yield

Two-way ANOVA showed that there was a significant effect of phosphate on grain yield (GY) and biomass yield (BY) in summer maize across three growing seasons (Figure 2, p < 0.05), with the increase in P application, GY and BY increased. The maximum GY and BY were obtained in T3 and T4, and the minimum GY and BY were obtained in T1. For example, the mean GY across the three growing seasons reached 6754.31 kg ha−1, which was 40.21% higher than the T1 treatment. However, GY and BY were suppressed with the input of 180 kg P2O5 ha−1. The planting season did not affect GY from the three seasons (p > 0.05), while it significantly affected the BY (p < 0.05).

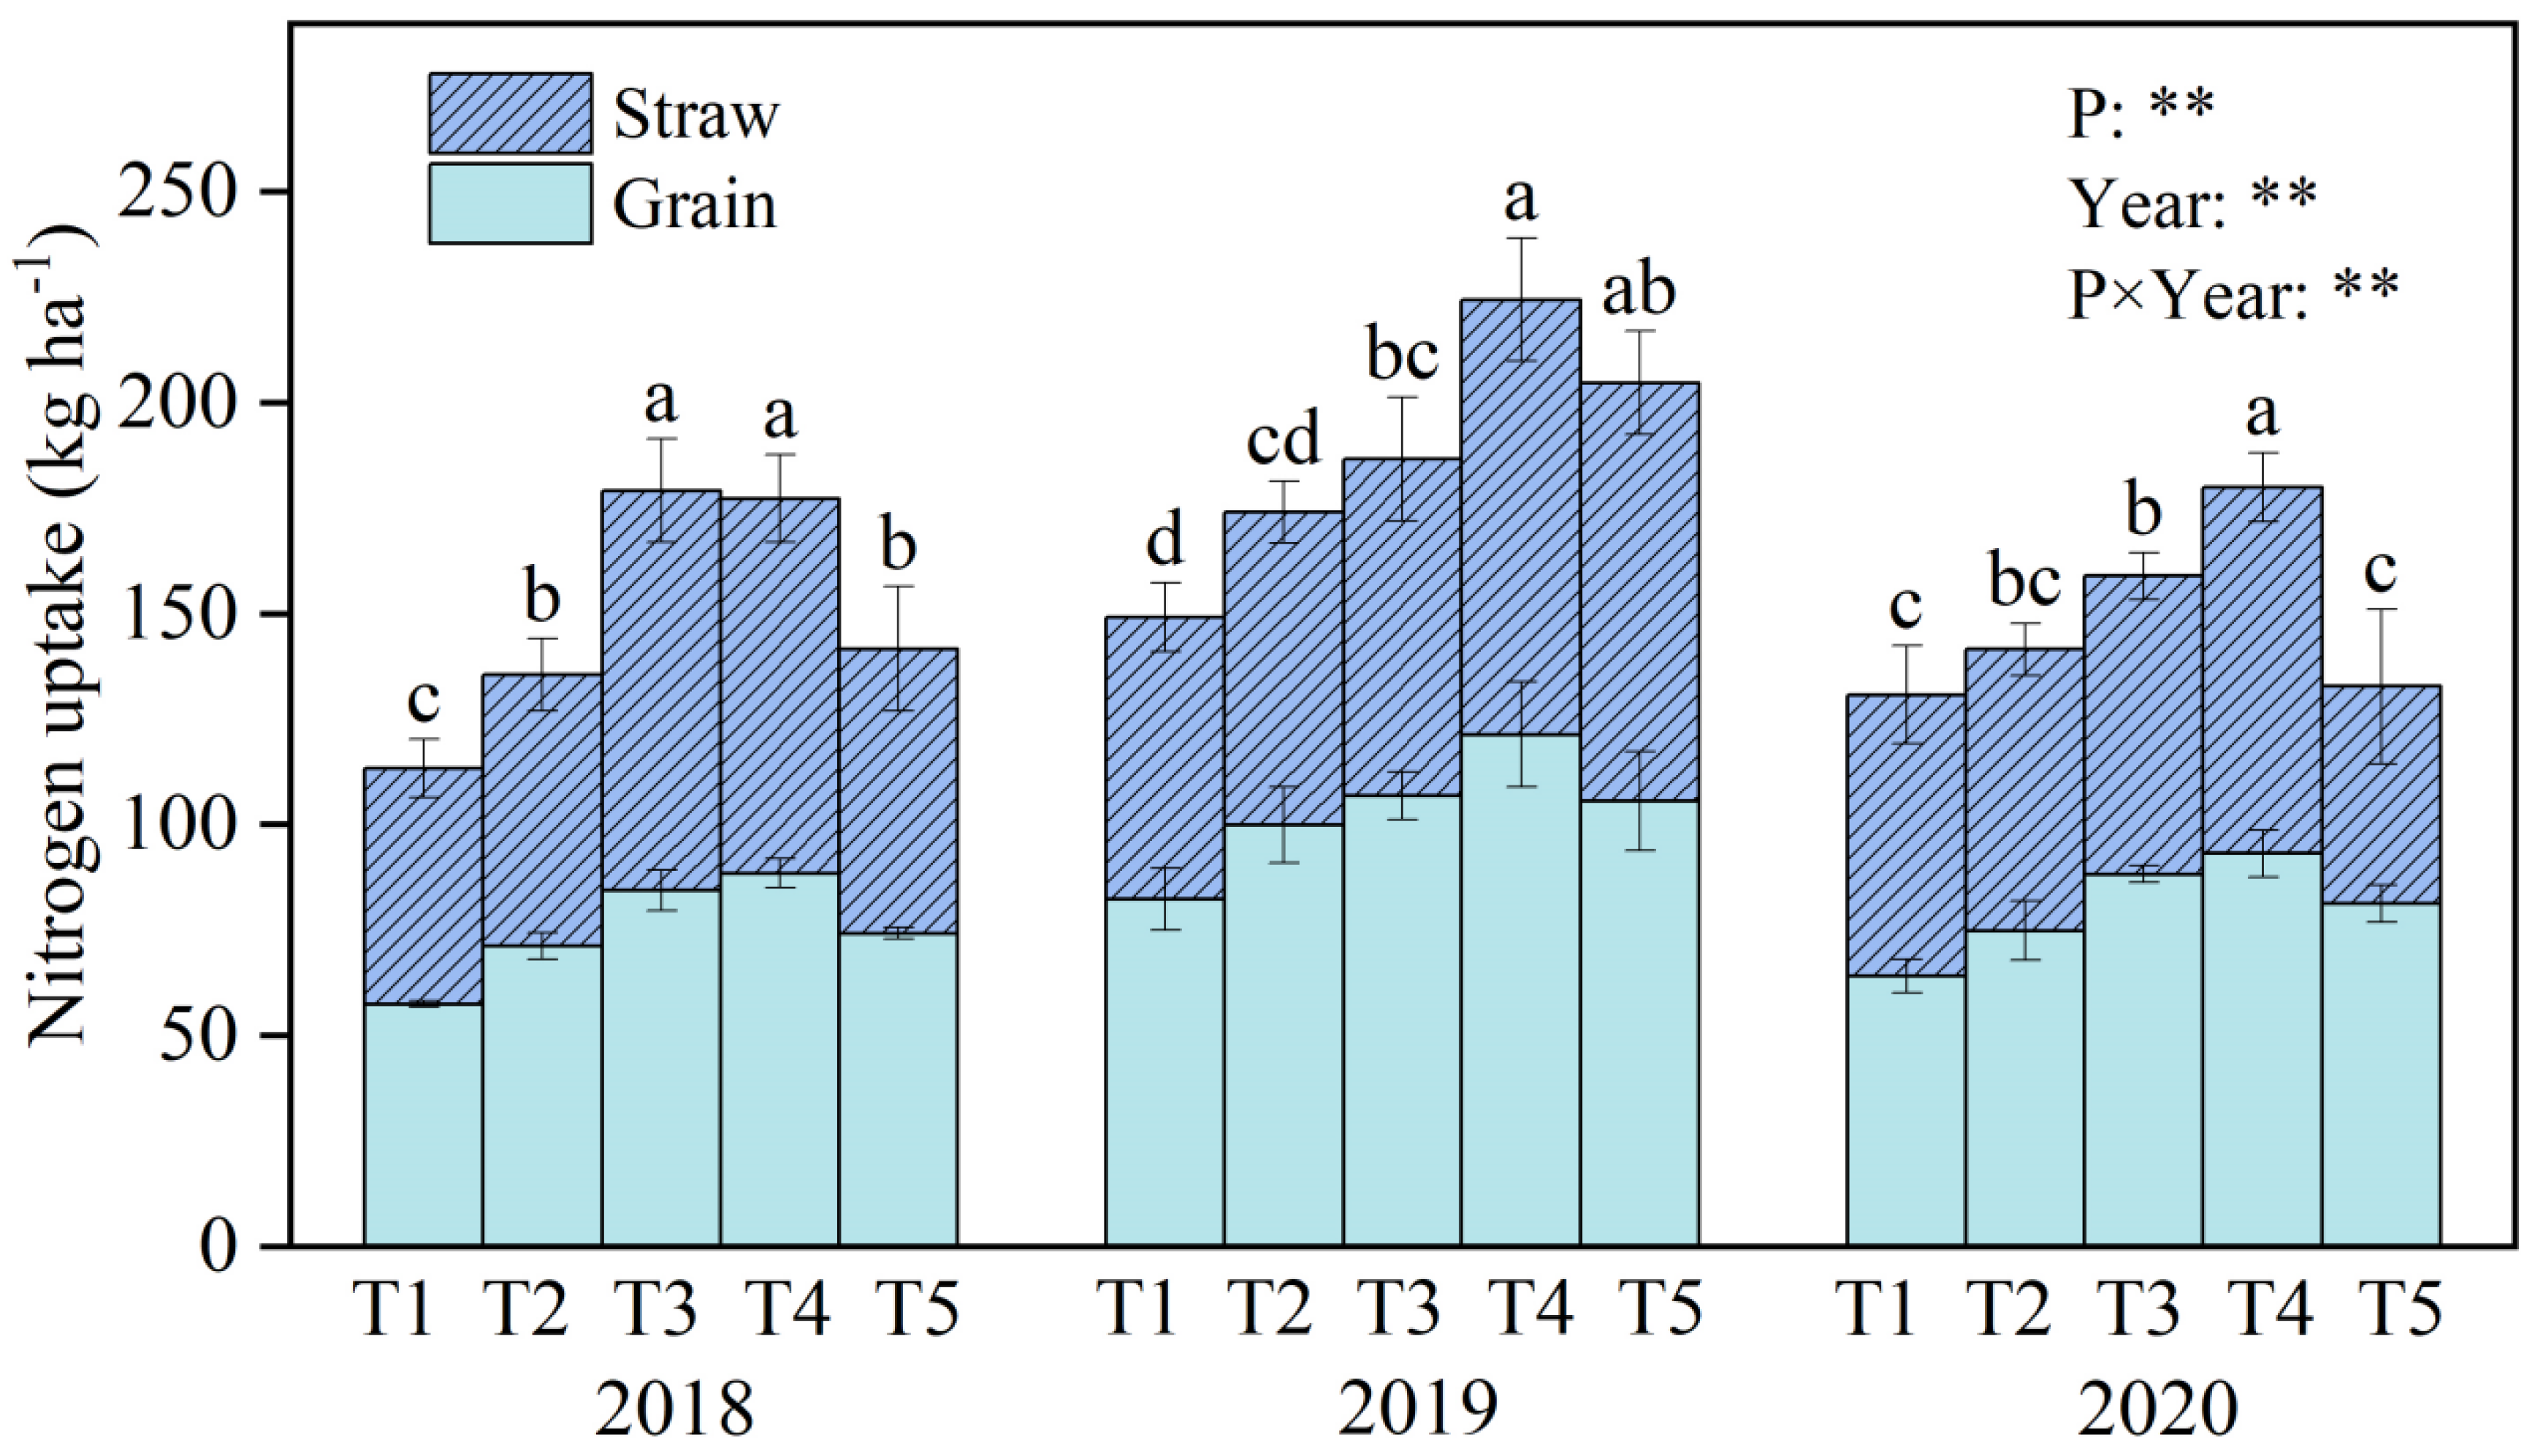
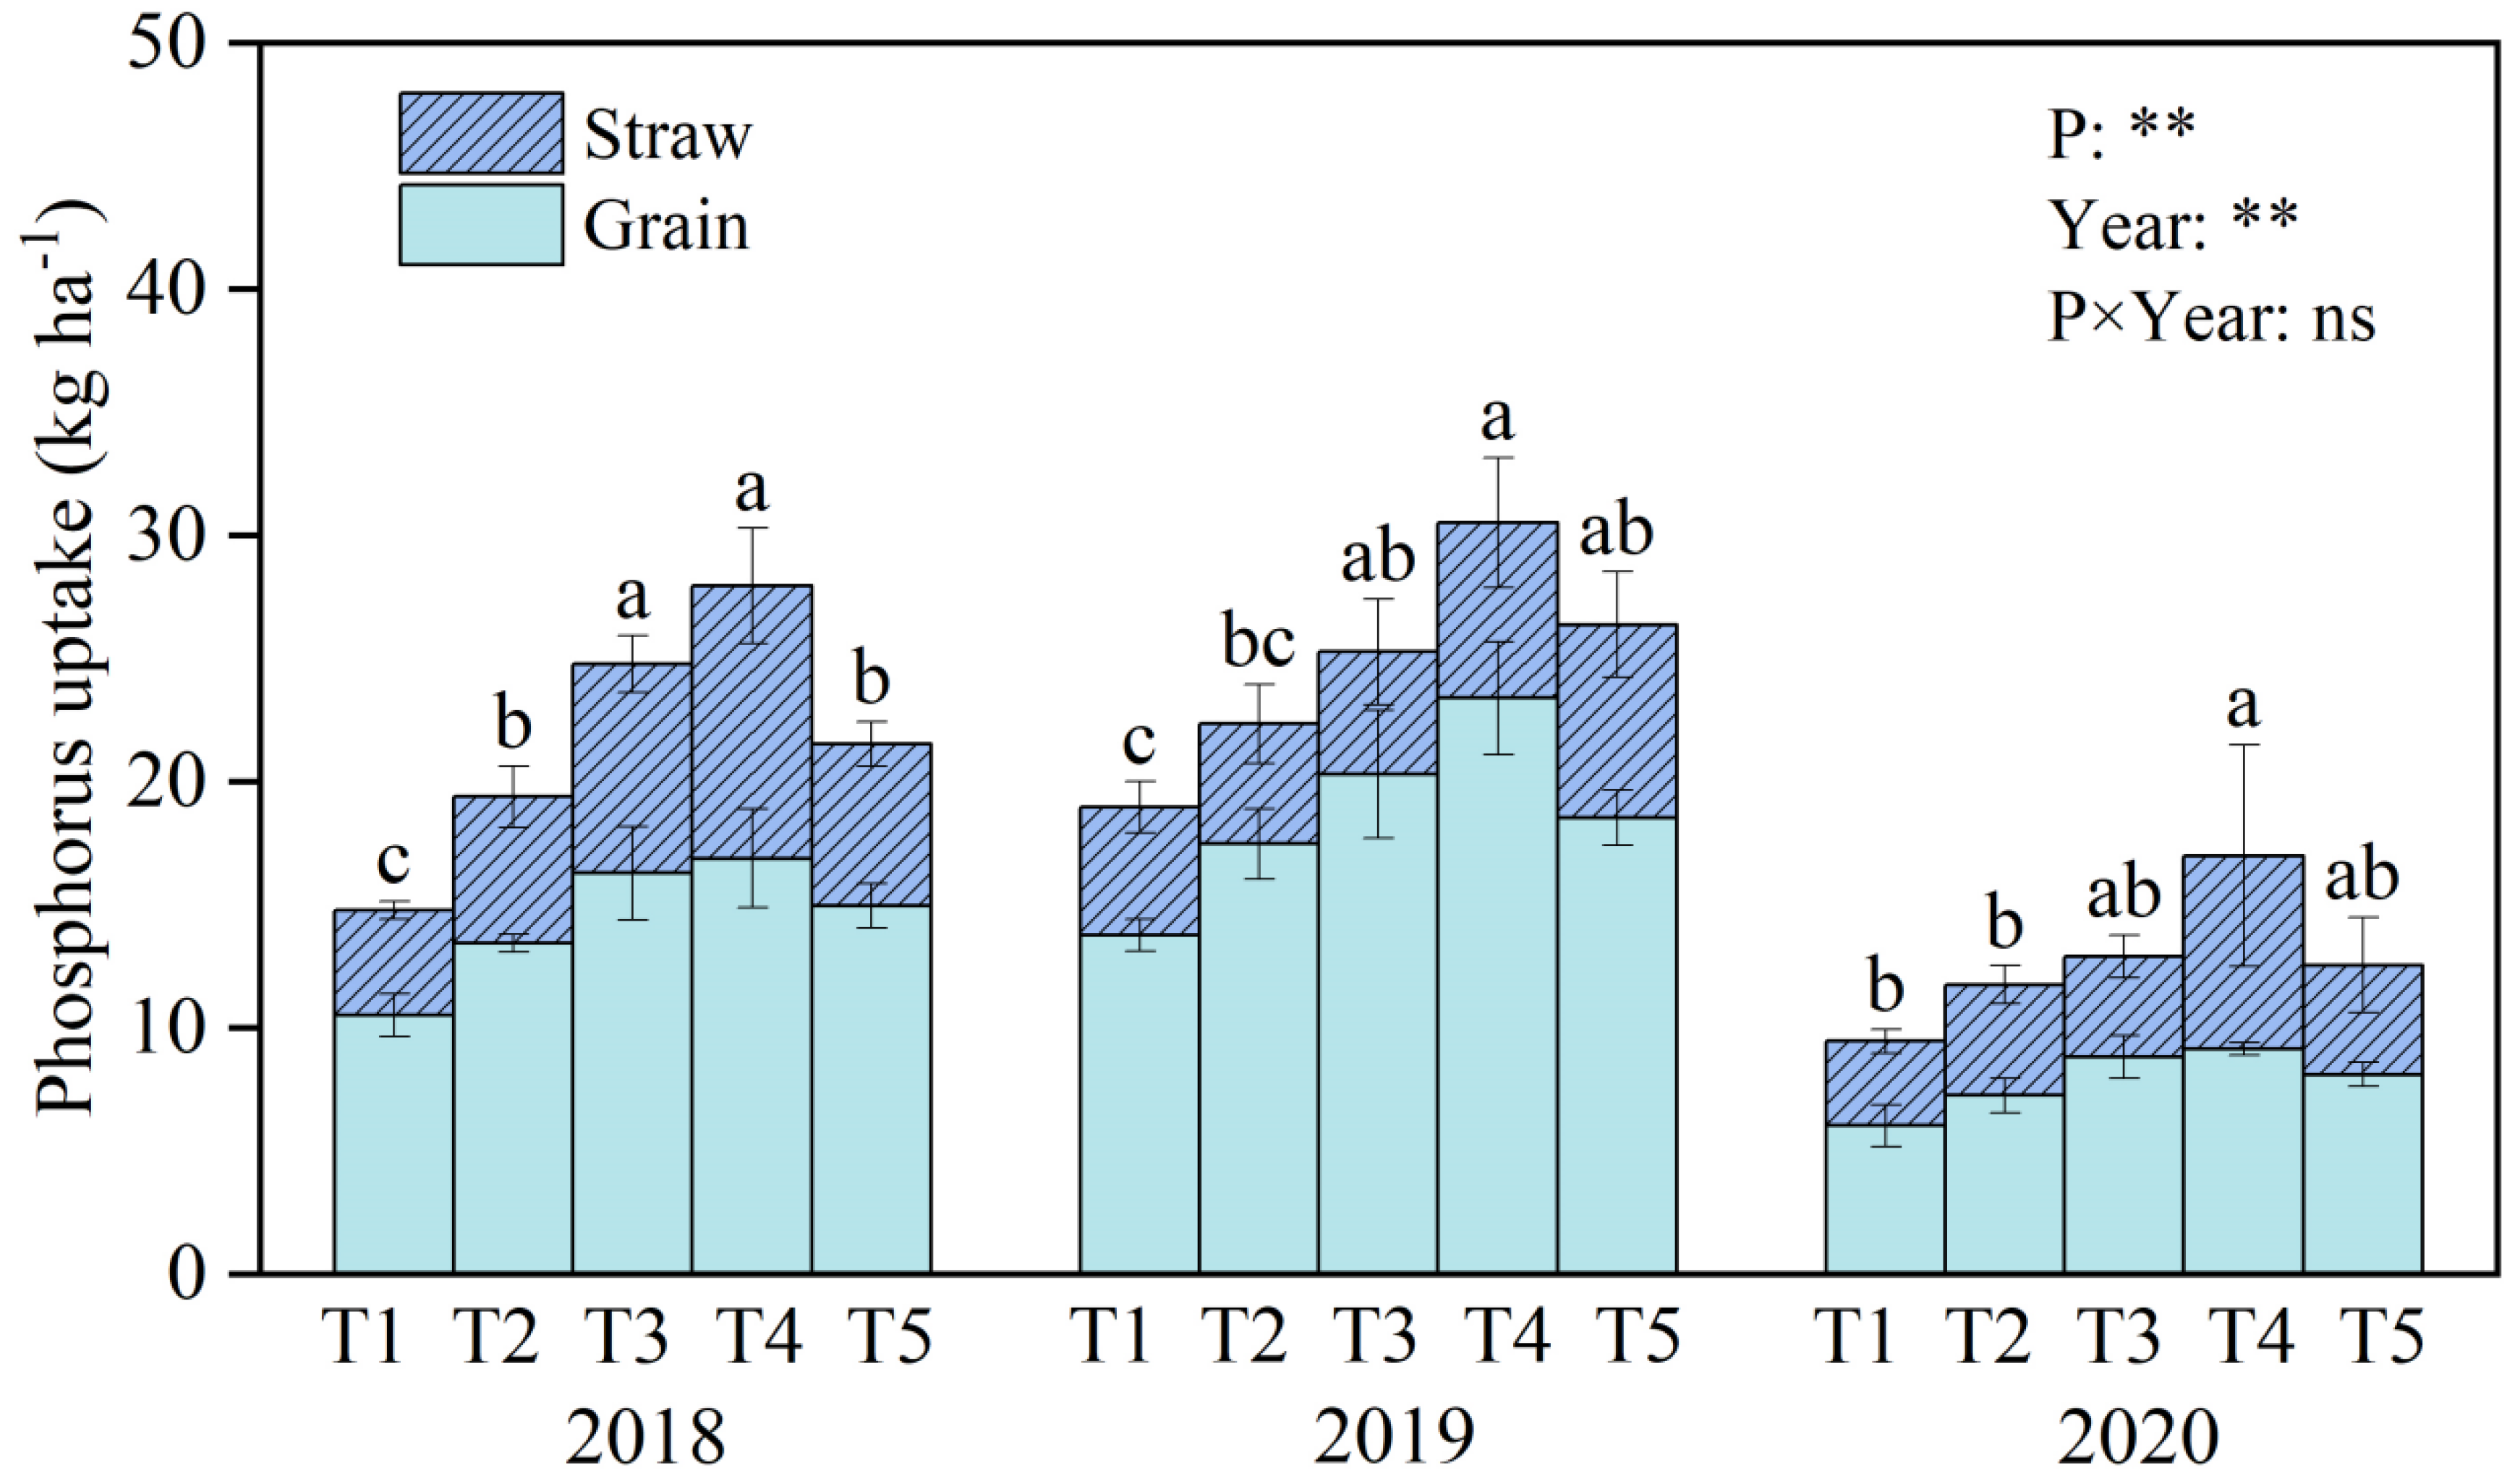
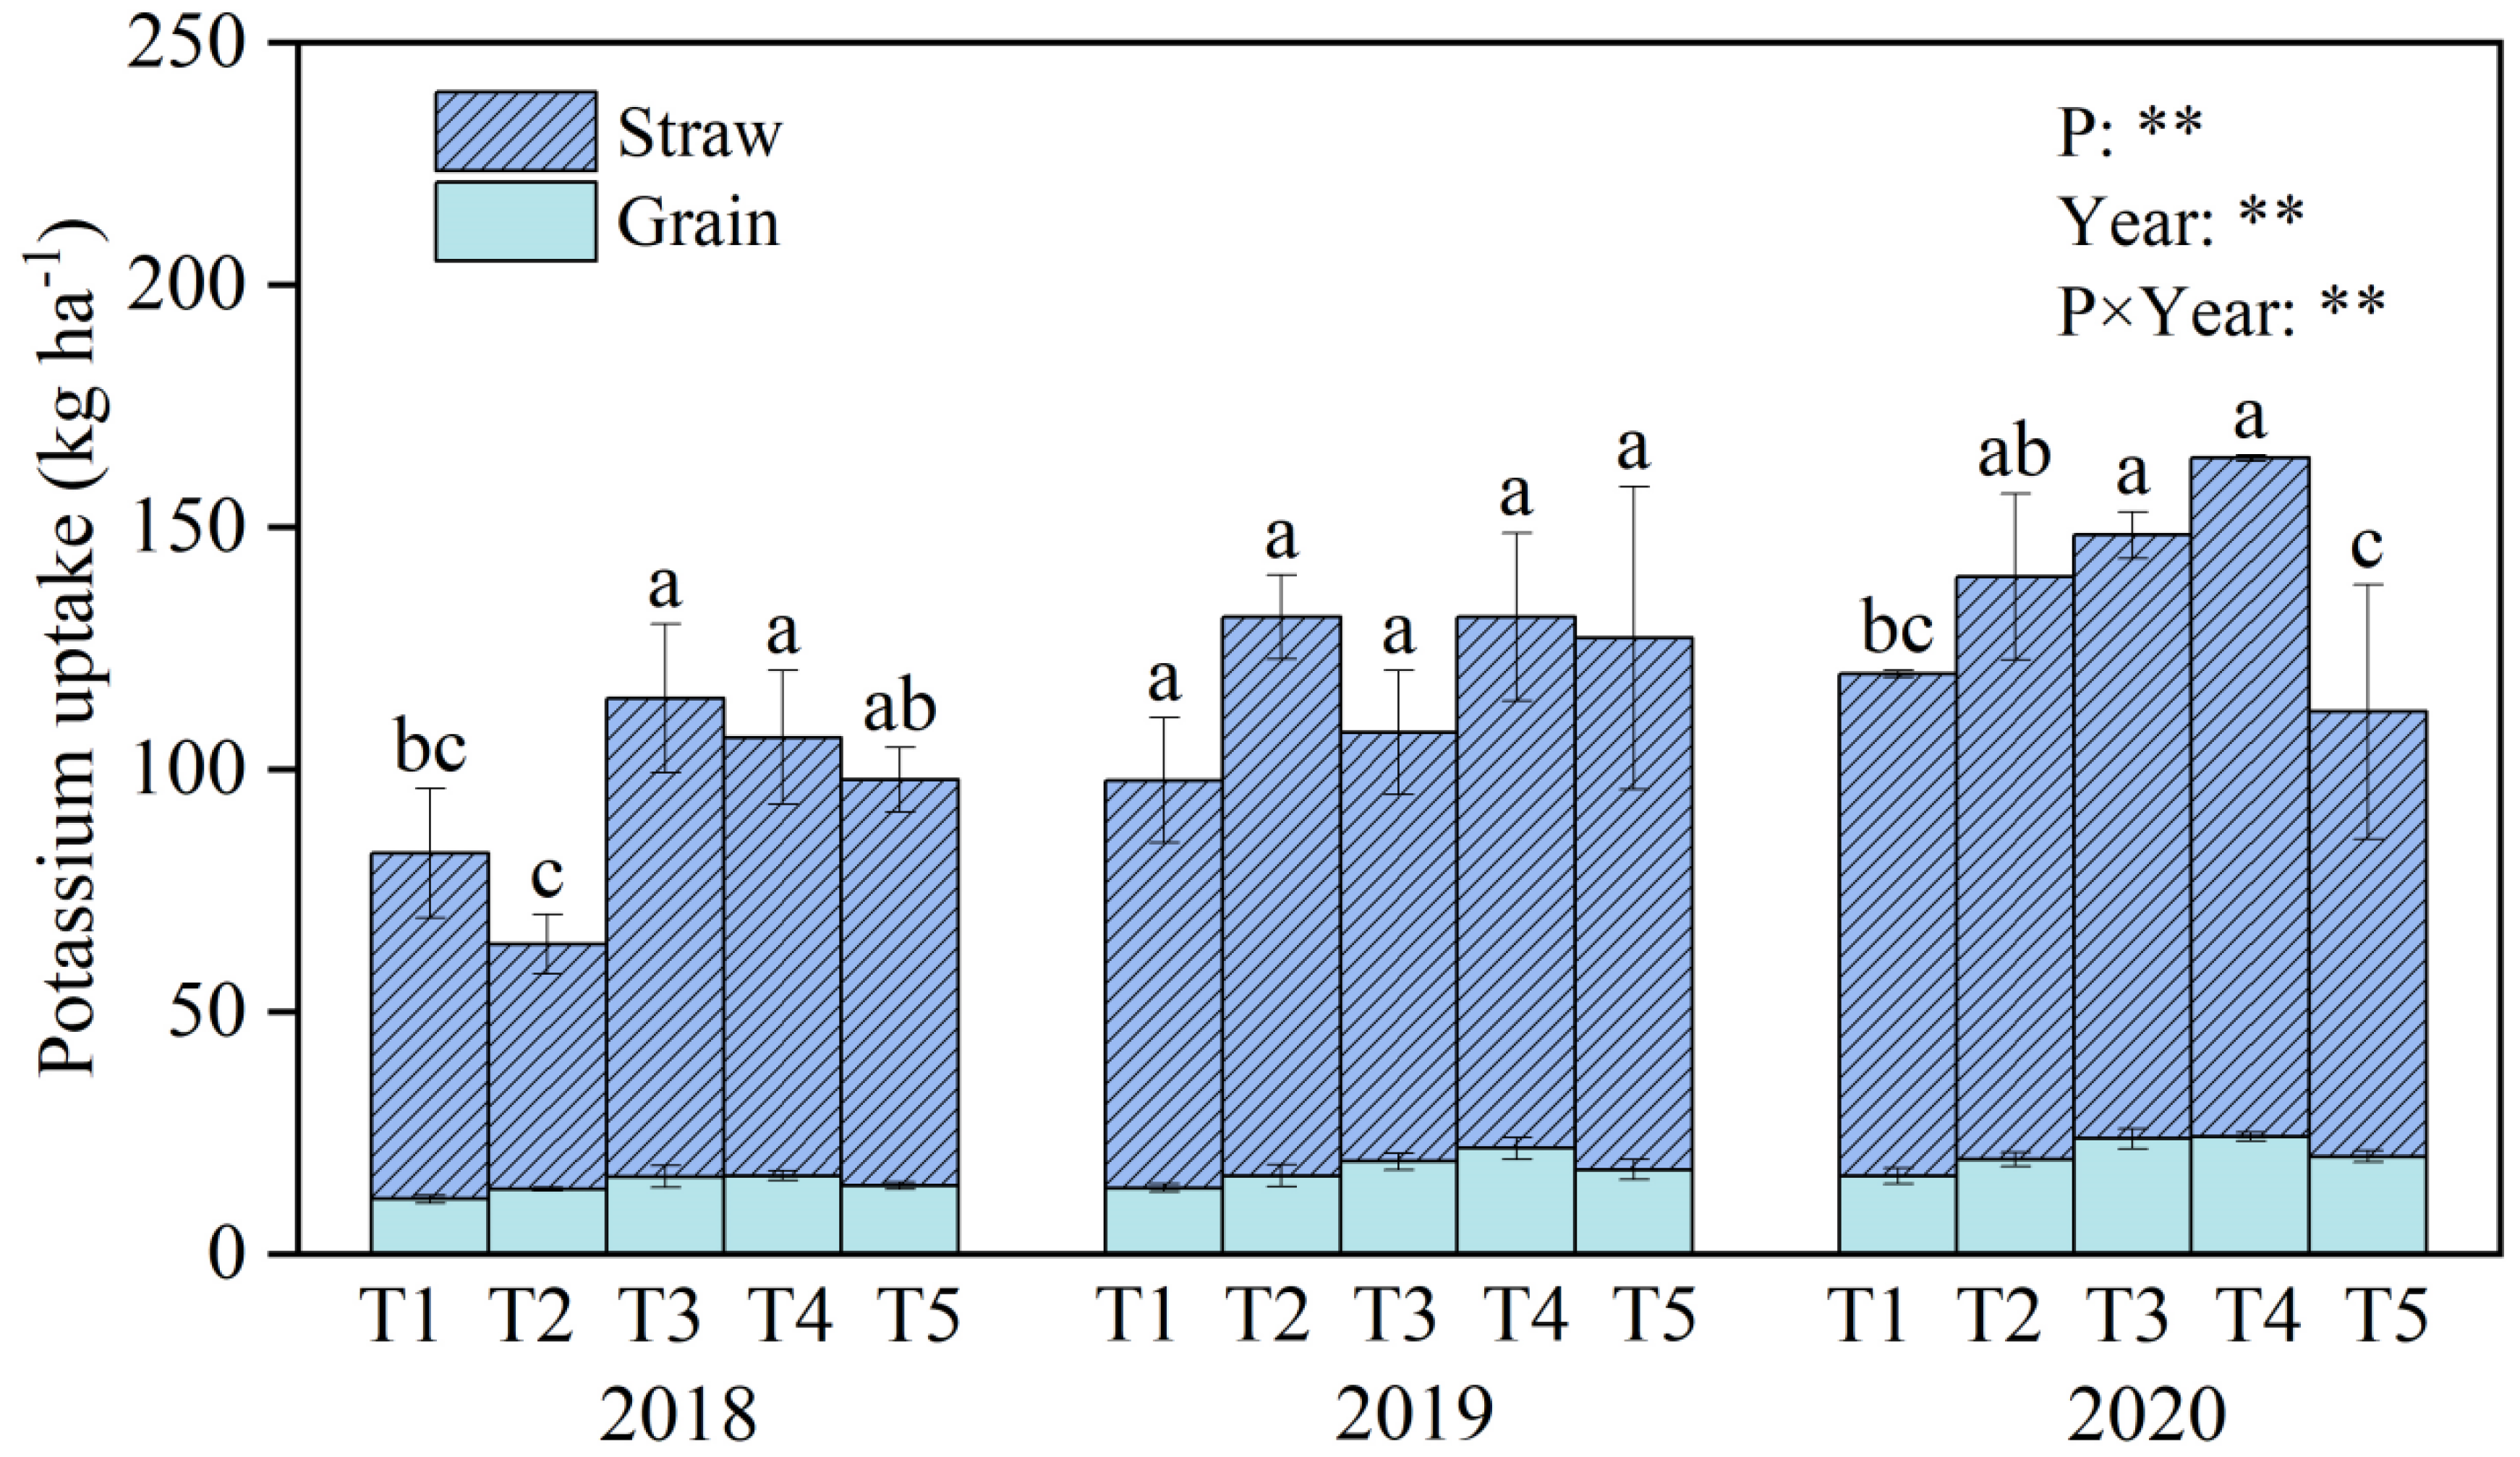
3.2. Nutrient Uptake Content and Partitioning

The total uptake content of N was significantly affected by P fertilizer application, season, and their interaction across 2018, 2019, and 2020 (Figure 3, p < 0.05). As P application increased, total nitrogen uptake increased and then decreased over the three seasons. T2, T3, T4, and T5 increased the total N uptake content by 8.2–19.6%, 21.5–58.1%, 37.6–56.4%, and 1.5–25.0%, respectively, relative to T1 over the three growing seasons. Similarly, the largest N uptake in grain was obtained with T4, being 88.4, 121.29, and 93.1 kg ha−1 in the 2018, 2019, and 2020 seasons, respectively. Additionally, the proportions of total N uptake in grain and straw over the three seasons were 47.1–61.2% and 38.8–52.9%, respectively, within all treatments. Furthermore, the total nitrogen uptake content in 2019 was obviously larger than those in 2018 and 2020 (p < 0.05). When the phosphate fertilizer supply was sufficient, the proportion of nitrogen uptake content in straw in 2019 was relatively high, while it was low in 2018 and 2020. Accordingly, a higher proportion of nitrogen uptake in grain under low P treatment in 2019 was obtained compared with sufficient P application, and the opposite results were found in the 2018 and 2020 seasons.
The rate of P application significantly affected the changes in total P uptake (Figure 4). Total P uptake content increased as the P application increased from 0 to 135 kg P2O5 ha−1, and then it decreased across the three seasons. Compared to T1, the total P content increased by 17.8–31.1%, 33.3–67.6%, 61.0–89.1%, and 32.8–45.7% in T2, T3, T4, and T5, respectively, over the three growing seasons. The grain P content was higher under the T4 treatment, being 16.9, 23.4, and 9.1 kg ha−1 in the 2018, 2019, and 2020 seasons, respectively. Additionally, the proportions of P uptake by grain and straw over the three seasons were 53.8–80.3% and 19.7–46.2%, respectively (Figure 4). Furthermore, the total P uptake content was significantly affected by the growing season (p < 0.05). Total P uptake in 2019 was significantly higher than in 2018 and 2020 (p < 0.05). When the phosphate fertilizer was not supplied in 2018 or 90 kg ha−1 in 2019 and 2020, the proportion of phosphorus uptake content in grain was higher than in the other treatments, and thus, it was relatively low for the proportions in straw.
P treatment, season, and their interaction among the two factors significantly affected the total potassium uptake (Figure 5). Similar to the N and P responses, total potassium uptake content increased and then decreased with an increase in phosphate fertilizer supply across the three seasons. Compared with no P application, P application increased total K content by −22.7–34.5%, 10.1–38.7%, 29.0–37.2%, and −0.07–30.1% in T2, T3, T4, and T5, respectively, within the three growing seasons. Furthermore, the largest potassium uptake in grain was obtained with T4, being 16.1, 21.7, and 24.2 kg ha−1 in 2018, 2019, and 2020, respectively. Interestingly, in 2019, there was no significant effect of P application on total K concentration. Additionally, the K uptake in grain was much lower than in straw within all treatments. For example, the proportion of K uptake by grain over the three seasons was 12.2–20.8% (Figure 5). To analyze the effect of season on K uptake, it was found that the total potassium uptake in 2020 was larger than in 2018 and 2019 (p < 0.05); the total K uptake content was 111.83–164.19 kg ha−1 in 2020, whereas it was 63.82–114.59 kg ha−1 in 2018 and 97.69–131.47 kg ha−1 in 2019.

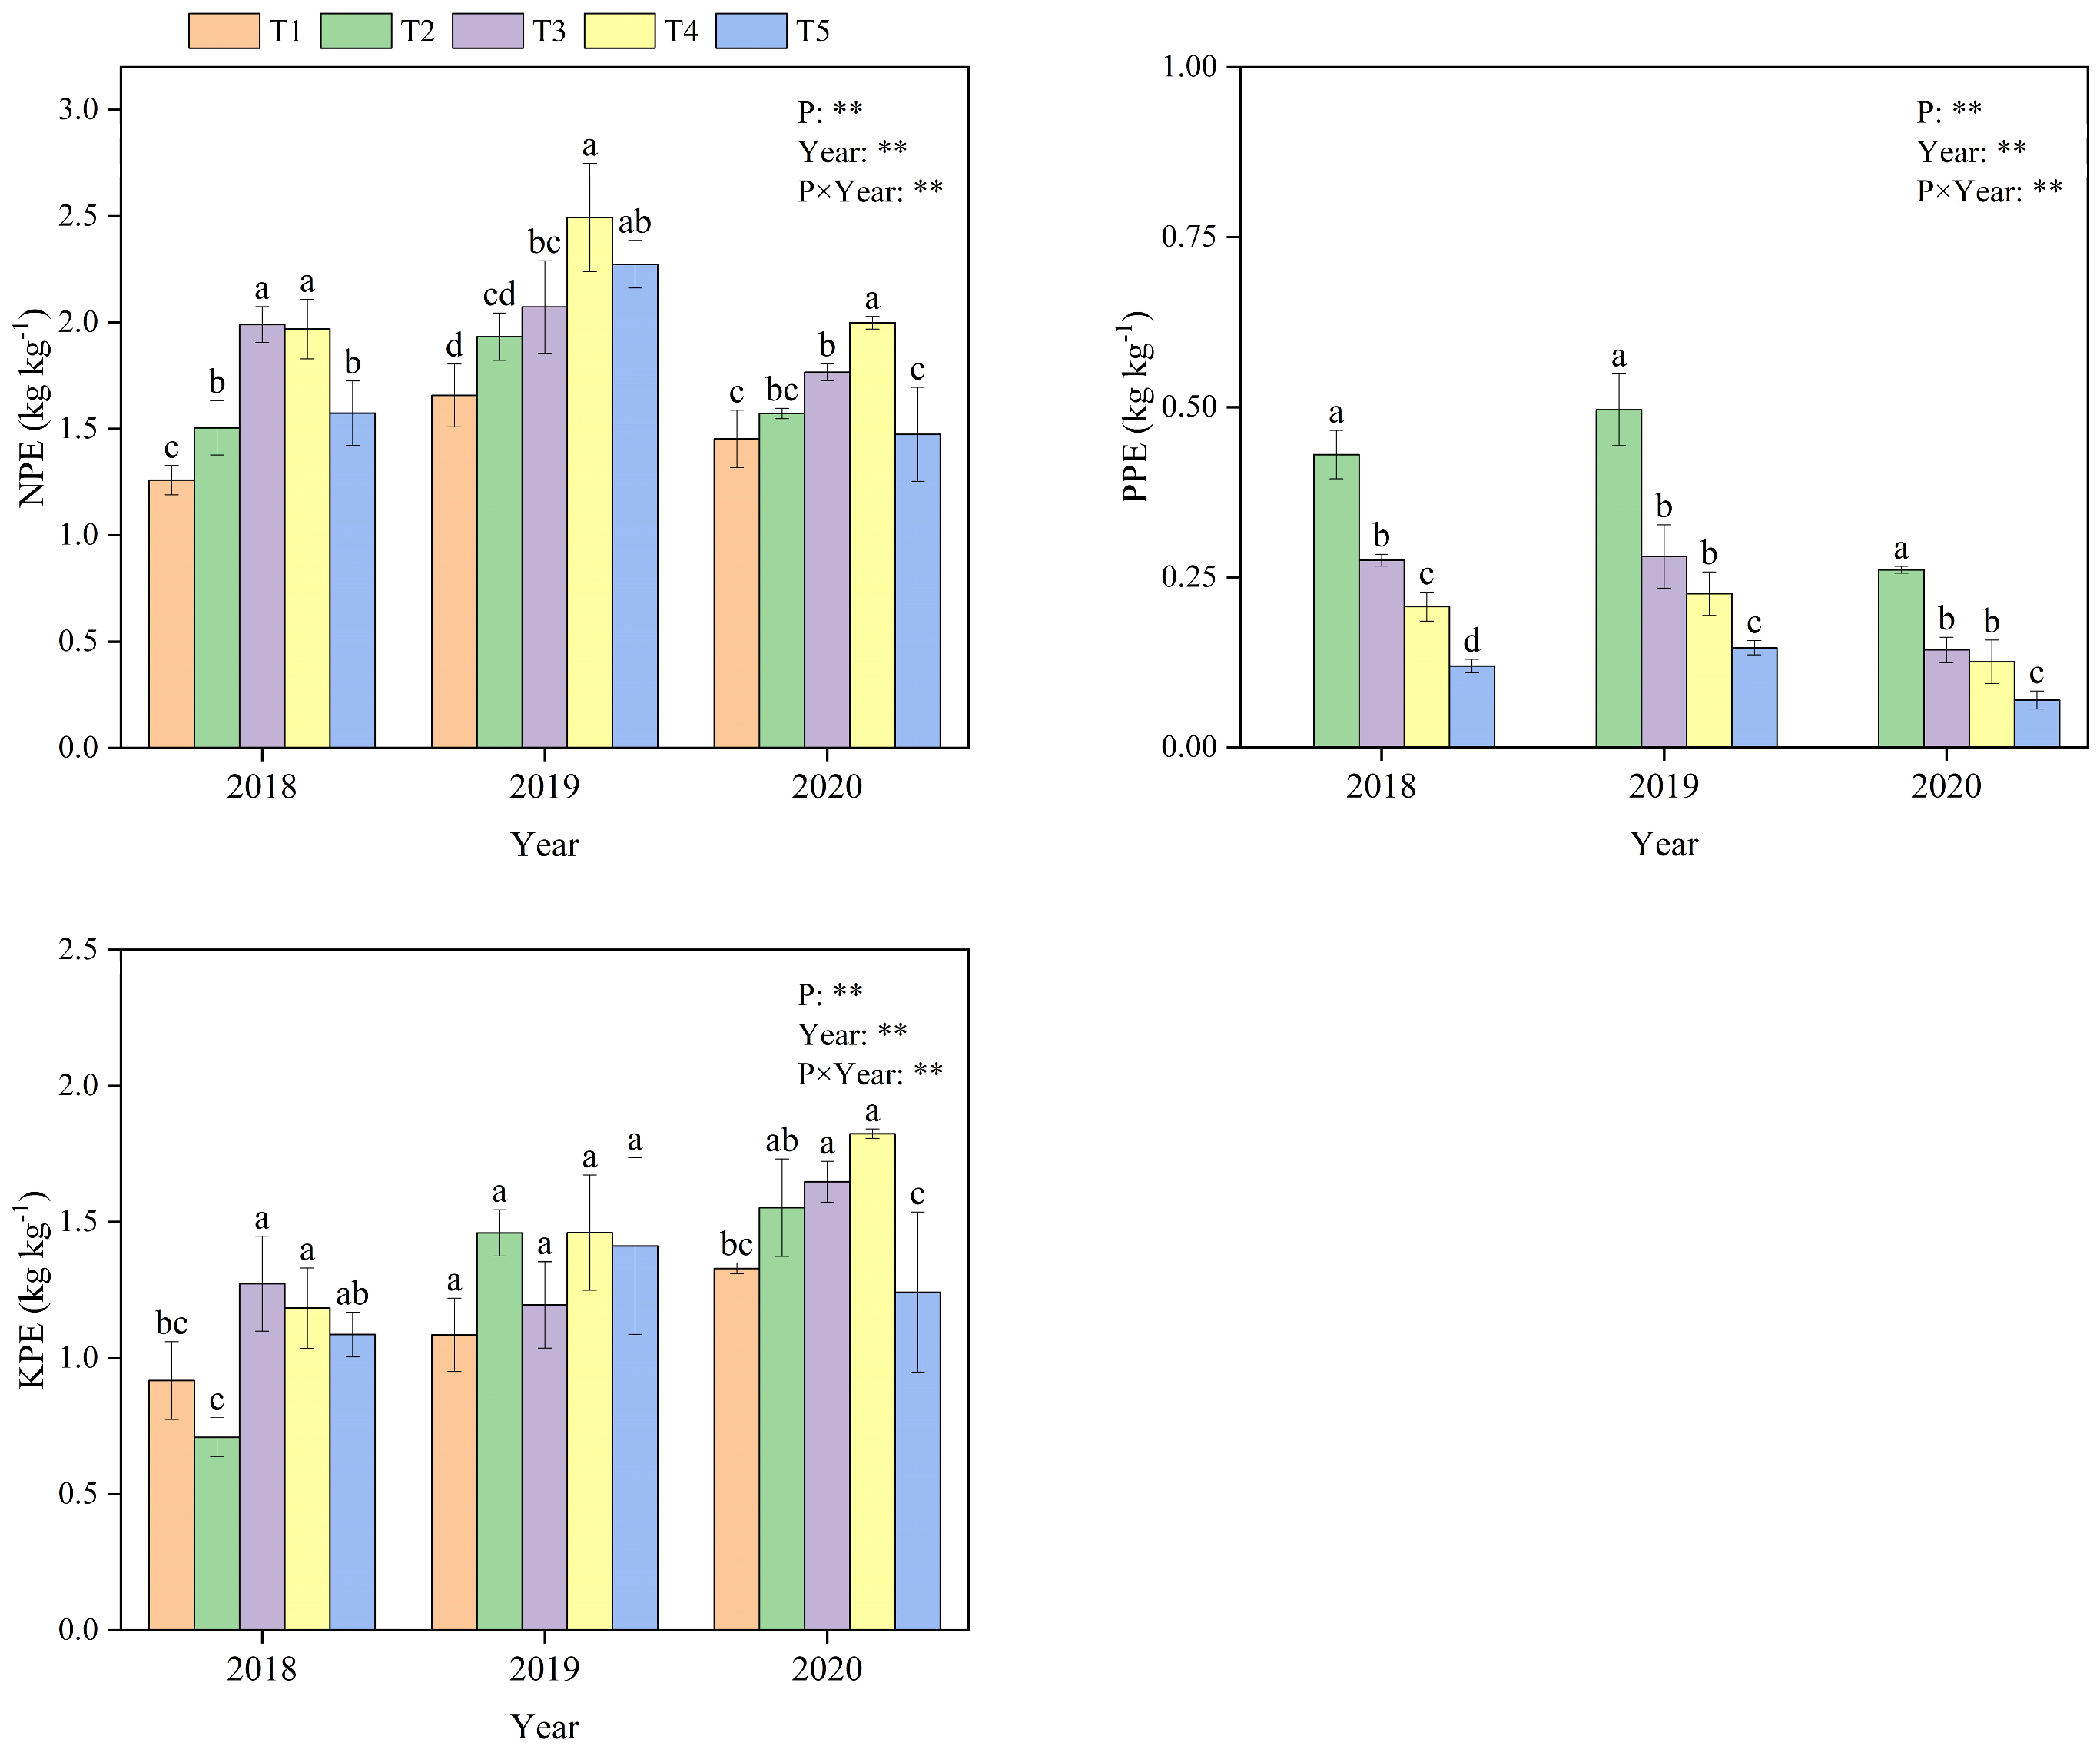
3.3. Nitrogen (Phosphorus, Potassium) Physiological Efficiency (NPE, PPE, and KPE)

As shown in Figure 6, nitrogen physiological efficiency (NPE), phosphorus physiological efficiency (PPE), and potassium physiological efficiency (KPE) were significantly affected by the phosphate fertilizer rate, season, and their interaction (p < 0.05). The average of the NPE, PPE, and KPE across the three growing seasons ranged from 1.46 to 2.15, 0.11 to 0.40, and 1.11 to 1.49 kg kg−1, respectively. For PPE, it decreased with the increasing phosphate fertilizer amount; T2, T3, and T4 increased by 253.7 kg kg−1, 108.2 kg kg−1, and 66.4 kg kg−1 relative to T5. Hence, the maximum PPE for P treatments was obtained in T2 within the three growing seasons. In contrast, the NPE and KPE changed differently from the PPE. T3 and T4 obtained maximum NPE and KPE, ranging from 1.94 to 2.15 and 1.37 to 1.49 kg kg−1, respectively. Interestingly, the NPE in 2019 was significantly higher than in 2018 and 2020, and the PPE in 2018 and 2019 was higher than in 2020. However, the KPEs in 2019 and 2020 were much greater than in 2018 with T5 P treatments.

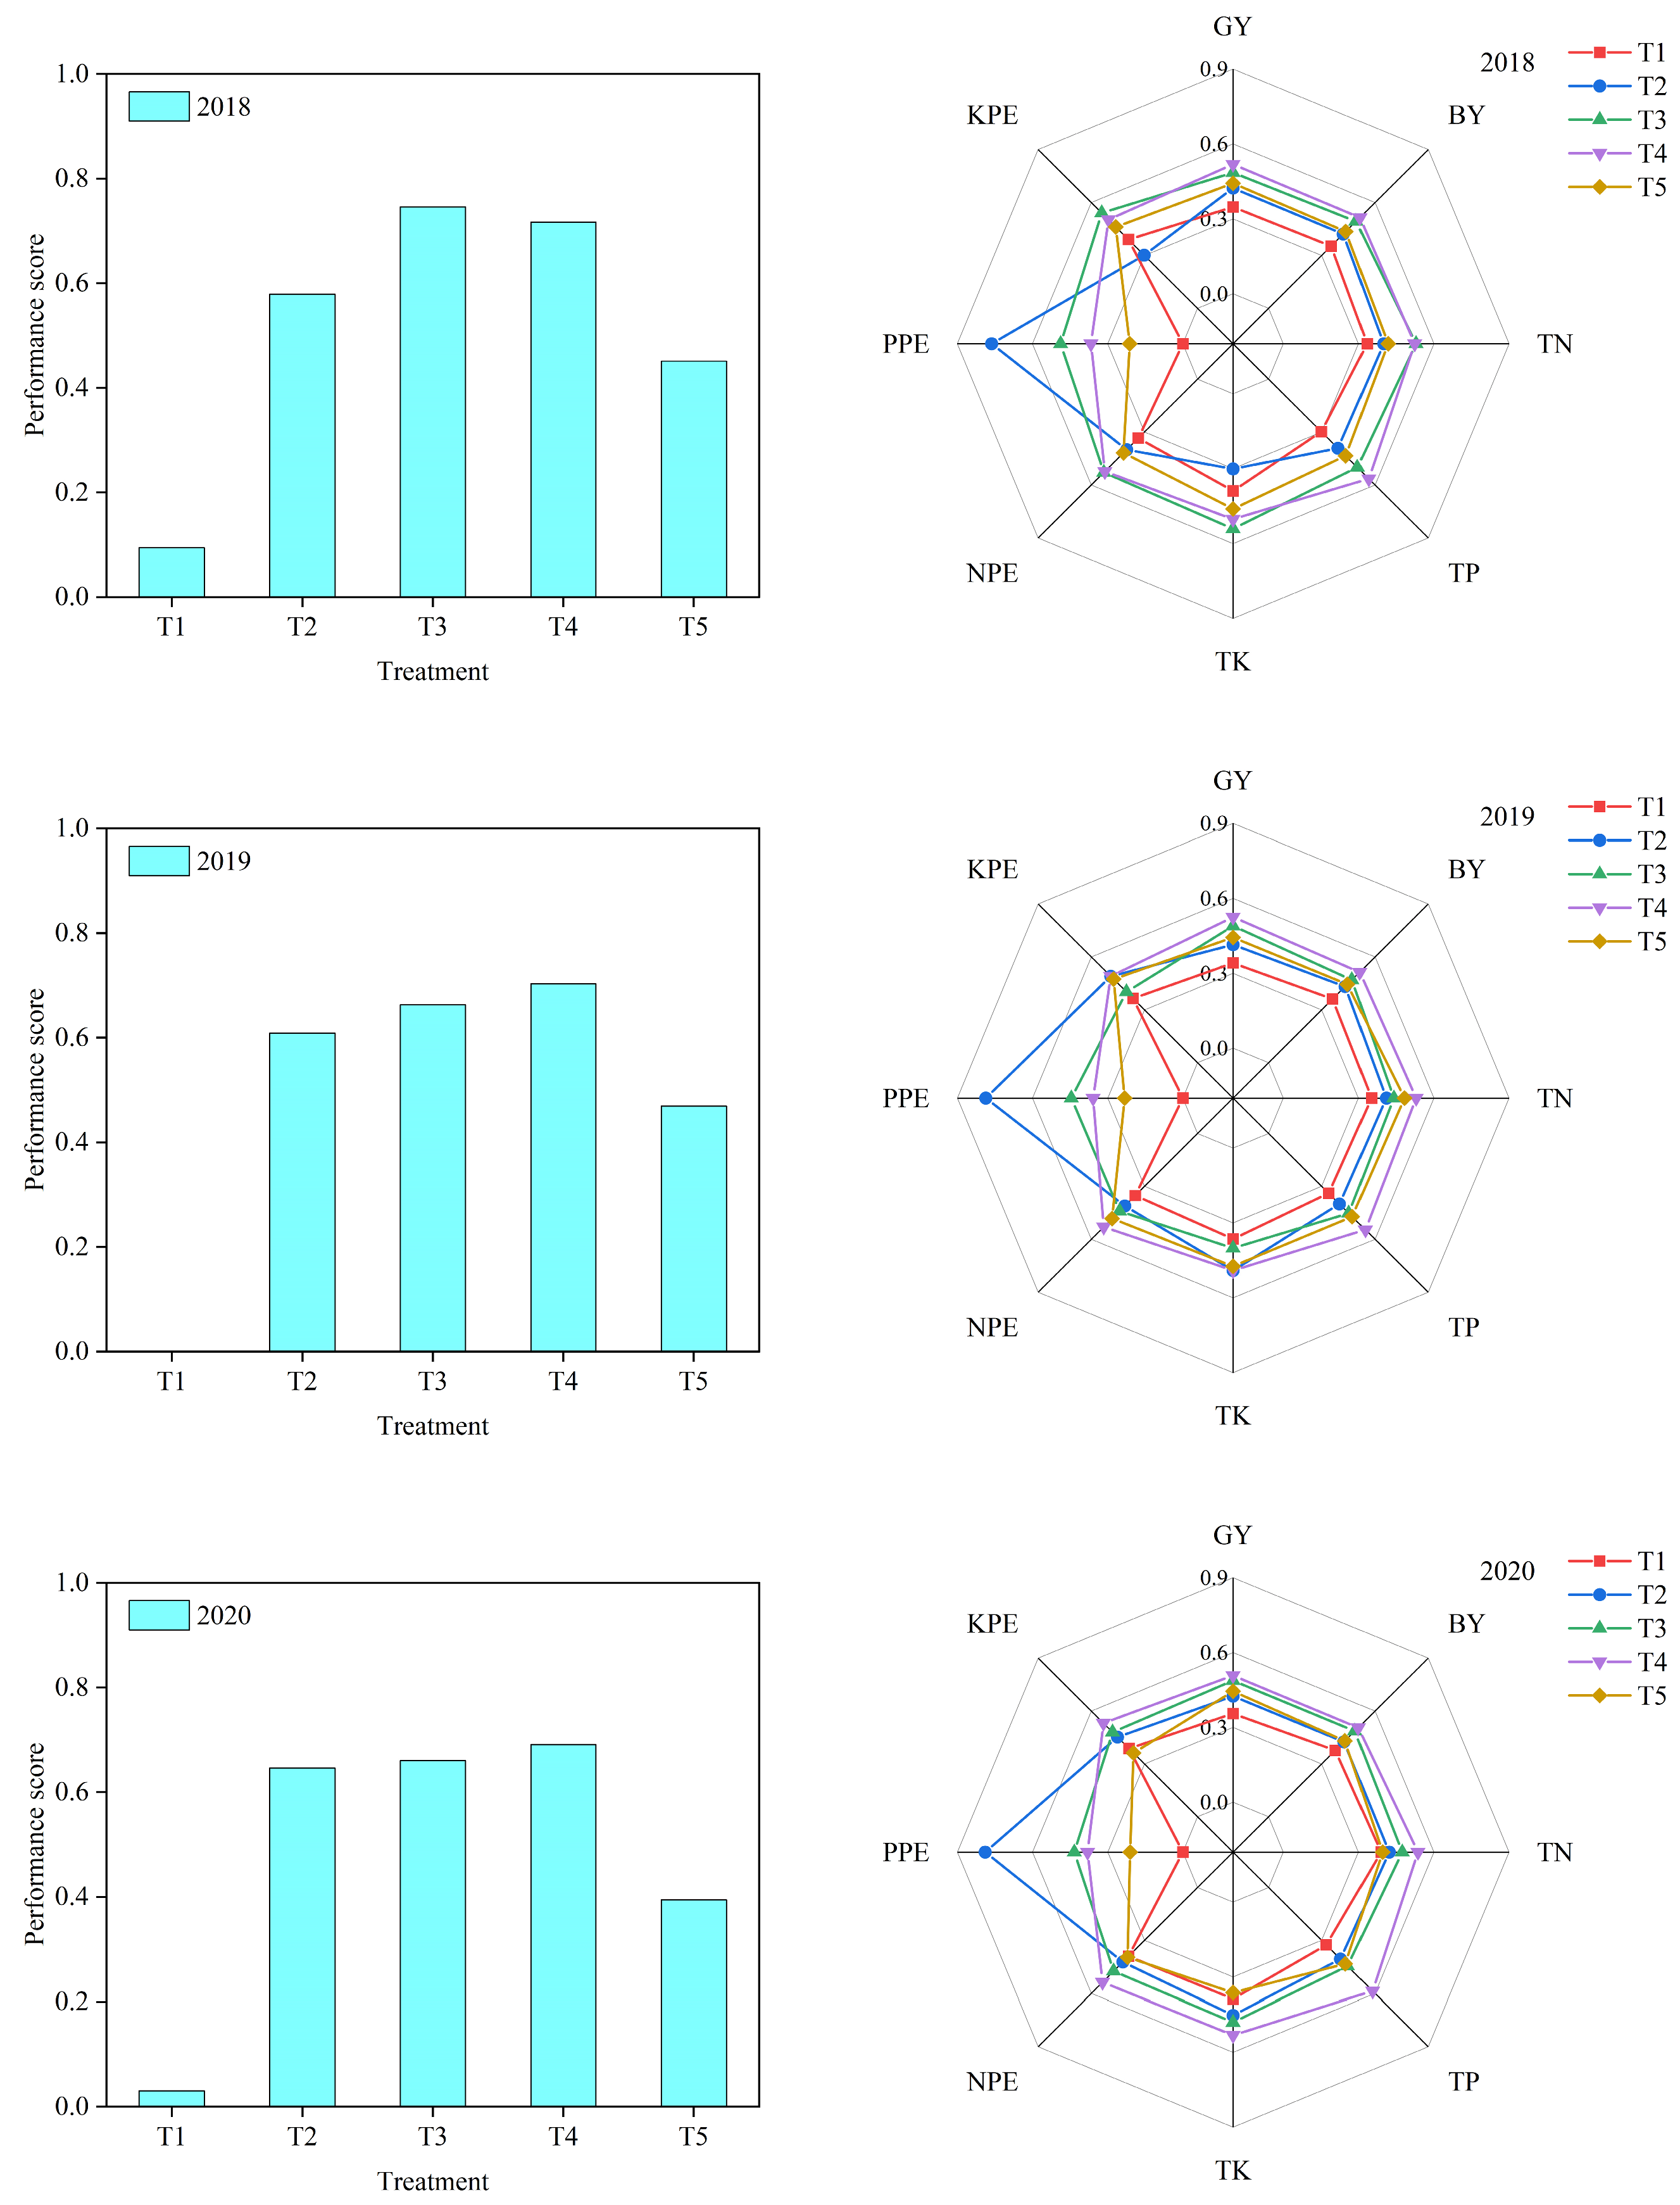
3.4. Comprehensive Evaluation of P Application Scheduling

As shown in Figure 7, the performance score, calculated by TOPSIS, followed the order of T3 > T4 > T2 > T5 > T1 in the 2018 season, but the order of T4 > T3 > T2 > T5 > T1 in the 2019 and 2020 seasons. The average ranking scores of T3 and T4 across the three years were 0.69 and 0.70, respectively, which was 11.7 times higher than T1. In addition, considering actual yield and fertilizer utilization, the normalized value radar chart further expressed the comprehensive performance under different phosphate fertilizer supplies. T3 and T4 performed well for GY, BY, TN, TP, TK, NPE, and KPE but poorly for PPE across the three seasons. These results indicated that T3 and T4 had good performance on grain and biomass yield, nutrition uptake, and fertilizer use efficiency.

4. Discussion

Previous work has shown that the average maize yield potential for the non-saline land is 13,200 kg ha−1 under the North China Plain [20]. However, in this study, the average of grain in summer maize was 5992.89 kg ha−1 under coastal saline–alkali conditions, which was much lower than under non-salinity soil. This might be due to the stress of high soil salt seriously affecting the growth of underground crop roots and inhibiting the uptake of water and nutrients. Byrt et al. [37] reported that salt stress caused changes in the wall composition of specific root cells, and thus it hindered cell growth. Furthermore, this study showed that, compared with phosphorus supply treatments, the biomass yield and grain yield of summer maize with no P application were significantly lower across 2018, 2019, and 2020 (Figure 2). This result was in agreement with an earlier study conducted by Zribi et al. [38], who found that salt stress decreased whole plant growth and leaf water content, and P deficiency increased this impact. Furthermore, soil salinization also reduced the ability of leaf carbon fixation and thus impeded the formation of photosynthetic compounds in crops, with a more marked impact of P stress [39,40].
Supplementing phosphorus application is an important approach to enhance crop yield in response to salt stress [41,42]. Maize is a characteristically phosphorus-fertilizer-demanding crop. Earlier studies have reported that a deficiency in soil P significantly decreases yield and P absorption [43,44]. In the present study, the effects of P management on grain and biomass yield were significant. Maize yield significantly increased with increasing P application; for example, 135 kg P2O5 ha−1 application made the maize obtain maximum grain and biomass yield, which was consistent with Xu et al. [21], who conducted a 12-year field experiment with P fertilization rates on summer maize in North China. On the one hand, the reason may be that the P fertilizer supply regulates the biosynthesis of exogenous hormones, such as auxin, gibberellin, cytokinin, or abscisic acid, which are closely correlated with maize growth and grain yield [45]. On the other hand, the rising production of maize was likely associated with larger carbon fixation. Chenet al. [46] revealed that proper P management maximizes the leaf area index, net photosynthetic rate, and, therefore, biomass production for summer maize. However, yield markedly declined with a further supply of 180 kg P2O5 ha−1 under soil salt conditions, thus suggesting that excessive P application was unbeneficial to maize growth. Perhaps this is because the interactive action between salt stress and P over-fertilization results in an increase in osmotic pressure in root rhizospheres [47]. Thus, to avoid a soil P excess, it would be better if the application of P did not exceed 180 kg ha−1.
Nutrient utilization of crops, including N, P, and K, is obviously related to the variety, fertilization, and soil environmental conditions [48,49]. Previous studies have reported that the prerequisite for high grain yield of crops is high biomass accumulation, and biomass accumulation and yield formation are dependent on nutrient absorption [29]. Xu et al. [21] showed that the total P uptake of crops treated with P2O5 was significantly higher than that without P2O5 application, and the P uptake increased with the increase in the P2O5 application rates. The study further reported that there was a significant difference in the total P uptake of crops when P2O5 application rates ranged from 90 to 225 kg ha−1. Similarly, Yan et al. [48] showed that adequate fertilizer input was conducive to nutrient (N, P, and K) uptake by crops and improved N, P, or K transport from the stem or leaves to grain. In this study, the total N, P, and K uptake increased as the P2O5 application rate increased and then decreased (Figure 4). A P2O5 application rate of 135 kg ha−1 obtained the maximum nutrient uptake, which was in accordance with the results of grain and biomass yield. These results indicate that a moderate P2O5 application rate is conducive to NPK accumulation, which in turn also provides sufficient material for photosynthesis and improved biomass accumulation. Nevertheless, excessive P2O5 supply not only lowers N, P, and K accumulation but also decreases grain and biomass yield.
Further, nutrient use efficiency is usually considered by agricultural scientists to develop sustainable production [49,50,51]. Improving nutrient physiological efficiency is helpful for the rational utilization of agricultural resources. In our study, the P application rate dynamically affected the physiological efficiency of N, P, and K (Figure 6). The average NPE ranged from 1.26 to 2.49 kg kg−1, while PPE ranged from 0.07 to 0.50 kg kg−1, and KPE ranged from 0.71 to 1.82 kg kg−1. In general, with P application rates of 90 and 135 kg ha−1, the maximum NPEs were 1.94 and 2.15 kg kg−1, respectively, which was 1.32–1.47 times higher than with no P application. Similar results were reported in maize [21], wheat [52], and cotton crops [14,53]. However, excessive P application with 180 kg ha−1 led to a decline in NPE because it exceeded the optimal demands of maize plants under salt conditions. P application has been shown to improve NPE, KPE, and crop yield, as well as reduce the PPE [54,55], which is consistent with our study. PPE decreased with the increase in P addition, reaching a maximum in the T1 treatment. An excessive P rate led to inefficient P utilization and, consequently, a high soil P retention [56]. Interestingly, our results showed that NPE, PPE, and KPE were also affected by planting seasons, alluding to the fact that precipitation and temperature might be important factors affecting the use of nutrient efficiency by regulating the soil moisture and salt movement. Further studies should focus on the comprehensive management of water and fertilizer application on maize production under saline–alkali conditions.
High grain yield is the goal of agricultural production, and high NPK utilization is required for efficient utilization of input production materials (e.g., fertilizer and water). In practice, it is difficult to achieve the highest yield, NPE, PPE, and KPE at the same time. In this study, the TOPSIS model was used to evaluate the maize yield and fertilizer use efficiency of five P treatments in saline–alkali soil. Previous studies have shown that TOPSIS can provide an effective solution for optimizing various traits and a comprehensive evaluation of multiple populations [30,33,57,58]. The TOPSIS model in this study showed that T3 ranked 1st and T4 ranked 2nd in the 2018 season. In 2019 and 2020, T4 ranked 1st, and T3 ranked 2nd. Therefore, the P application rate ranging from 90 to 135 kg ha−1 would be optimal for the management of maize production in saline–alkali land. The results provide a theoretical reference for producing a high grain yield while utilizing nutrients in saline–alkali land areas.

5. Conclusions

Supplementing phosphorus application significantly improved maize yield and N and K physiological efficiency, whereas P application rates exceeding 135 kg P2O5 ha−1 induced a decline in grain yield, nutrient uptake, and NPE. The P application rate ranging from 90 to 135 kg P2O5 ha−1 in saline–alkali land consistently resulted in a higher grain yield, total N, P, and K accumulation, and high NPE and KPE without much reduction in PPE in the three maize seasons. Furthermore, the TOPSIS model showed that 90 or 135 kg P2O5 ha−1 ranked 1st across the 2018, 2019 and 2020 seasons. Therefore, from the perspectives of efficient crop production and nutrient utilization, 90 to 135 kg P2O5 ha−1 is recommended as the most suitable P application management pattern for summer maize production in coastal saline–alkali land.

Author Contributions

Conceptualization, Z.L. Furthermore, S.L. (Shuang Li); methodology, Z.L. Furthermore, S.L. (Shuang Li); software, N.S.; validation, C.M., H.Y. and Z.S.; formal analysis, S.L. (Shenglin Liu); investigation, X.W.; resources, C.M., Z.L. and S.L. (Shuang Li); data curation, C.M. Furthermore, H.Y.; writing—original draft preparation, C.M. Furthermore, H.Y.; writing—review and editing, X.W. Furthermore, B.L.; visualization, C.M. Furthermore, H.Y.; supervision, S.L. (Shuang Li); project administration, S.L. (Shuang Li); funding acquisition, C.M., Z.L. and S.L. (Shuang Li). All authors have read and agreed to the published version of the manuscript.

Funding

This research was funded by the National Key Research and Development Plan (2021YFD1900900), the Key Technology Research and Development Program of Shandong Province (2021CXGC010801, 2021CXGC010804), the Agricultural Scientific and Technological Innovation project of SAAS (CXGC2023F03, CXGC2023F16, CXGC2023A48) and supported by the Taishan Scholars Program and the earmarked fund for CARS-03.

Data Availability Statement

Data will be made available on request.

Conflicts of Interest

The authors declare that they have no known competing financial interest or personal relationships that could appear to have influenced the work reported in this paper.

References

  1. Mukhopadhyay, R.; Sarkar, B.; Jat, H.S.; Sharma, P.C.; Bolan, N.S. Soil salinity under climate change: Challenges for sustainable agriculture and food security. J. Environ. Manag. 2020, 280, 111736. [Google Scholar] [CrossRef] [PubMed]
  2. Jat Baloch, M.Y.; Zhang, W.; Sultana, T.; Akram, M.; Shoumik, B.A.A.; Khan, M.Z.; Farooq, M.A. Utilization of sewage sludge to manage saline–alkali soil and increase crop production: Is it safe or not? Environ. Technol. Innov. 2023, 32, 103266. [Google Scholar] [CrossRef]
  3. Xie, H.; Li, J.; Zhang, Y.; Xu, X.; Wang, L.; Ouyang, Z. Evaluation of coastal farming under salinization and optimized fertilization strategies in China. Sci. Total Environ. 2021, 797, 149038. [Google Scholar] [CrossRef] [PubMed]
  4. Eynard, A.; Lal, R.; Wiebe, K. Crop Response in Salt-Affected Soils. J. Sustain. Agric. 2005, 27, 5–50. [Google Scholar] [CrossRef]
  5. Bakker, D.; Hamilton, G.; Hetherington, R.; Spann, C. Salinity dynamics and the potential for improvement of waterlogged and saline land in a Mediterranean climate using permanent raised beds. Soil Tillage Res. 2010, 110, 8–24. [Google Scholar] [CrossRef]
  6. Du, Y.; Liu, X.; Zhang, L.; Zhou, W. Drip irrigation in agricultural saline-alkali land controls soil salinity and improves crop yield: Evidence from a global meta-analysis. Sci. Total Environ. 2023, 880, 163226. [Google Scholar] [CrossRef]
  7. Feng, G.; Zhang, Z.; Wan, C.; Lu, P.; Bakour, A. Effects of saline water irrigation on soil salinity and yield of summer maize (Zea mays L.) in subsurface drainage system. Agric. Water Manag. 2017, 193, 205–213. [Google Scholar] [CrossRef]
  8. Song, C.; Song, J.; Wu, Q.; Shen, X.; Hu, Y.; Hu, C.; Li, W.; Wang, Z. Effects of applying river sediment with irrigation water on salinity leaching during wheat-maize rotation in the Yellow River Delta. Agric. Water Manag. 2022, 276, 108032. [Google Scholar] [CrossRef]
  9. Liu, S.; Zhang, Q.; Li, Z.; Tian, C.; Qiao, Y.; Du, K.; Cheng, H.; Chen, G.; Li, X.; Li, F. Soil Salinity Weakening and Soil Quality Enhancement after Long-Term Reclamation of Different Croplands in the Yellow River Delta. Sustainability 2023, 15, 1173. [Google Scholar] [CrossRef]
  10. He, K.; Xu, Y.; He, G.; Zhao, X.; Wang, C.; Li, S.; Zhou, G.; Hu, R. Combined application of acidic biochar and fertilizer synergistically enhances Miscanthus productivity in coastal saline-alkaline soil. Sci. Total Environ. 2023, 893, 164811. [Google Scholar] [CrossRef]
  11. El-Syed, N.M.M.; Helmy, A.M.; Fouda, S.E.E.; Nabil, M.M.; Abdullah, T.A.; Alhag, S.K.; Al-Shuraym, L.A.; Al Syaad, K.M.; Ayyoub, A.; Mahmood, M.; et al. Biochar with Organic and Inorganic Fertilizers Improves Defenses, Nitrogen Use Efficiency, and Yield of Maize Plants Subjected to Water Deficit in an Alkaline Soil. Sustainability 2023, 15, 12223. [Google Scholar] [CrossRef]
  12. Ma, C.; Xiao, Y.; Puig-Bargués, J.; Shukla, M.K.; Tang, X.; Hou, P.; Li, Y. Using phosphate fertilizer to reduce emitter clogging of drip fertigation systems with high salinity water. J. Environ. Manag. 2020, 263, 110366. [Google Scholar] [CrossRef] [PubMed]
  13. Fertahi, S.; Pistocchi, C.; Daudin, G.; Amjoud, M.; Oukarroum, A.; Zeroual, Y.; Barakat, A.; Bertrand, I. Experimental dissolution of biopolymer-coated phosphorus fertilizers applied to a soil surface: Impact on soil pH and P dynamics. Ann. Agric. Sci. 2022, 67, 189–195. [Google Scholar] [CrossRef]
  14. Cao, N.; Wang, J.; Pang, J.; Hu, W.; Bai, H.; Zhou, Z.; Meng, Y.; Wang, Y. Straw retention coupled with mineral phosphorus fertilizer for reducing phosphorus fertilizer input and improving cotton yield in coastal saline soils. Field Crops Res. 2021, 274, 108309. [Google Scholar] [CrossRef]
  15. Qiu, R.; Du, T.; Kang, S. Root length density distribution and associated soil water dynamics for tomato plants under furrow irrigation in a solar greenhouse. J. Arid. Land 2017, 9, 637–650. [Google Scholar] [CrossRef]
  16. Singh, L.; Coronejo, S.; Pruthi, R.; Chapagain, S.; Subudhi, P.K. Integration of QTL Mapping and Whole Genome Sequencing Identifies Candidate Genes for Alkalinity Tolerance in Rice (Oryza sativa). Int. J. Mol. Sci. 2023, 23, 11791. [Google Scholar] [CrossRef]
  17. Yu, C.; Wang, G.; Zhang, H.; Chen, H.; Ma, Q. Biochar and Nitrification Inhibitor (Dicyandiamide) Combination Had a Double-Win Effect on Saline-Alkali Soil Improvement and Soybean Production in the Yellow River Delta, China. Agronomy 2022, 12, 3154. [Google Scholar] [CrossRef]
  18. MacDonald, G.K.; Bennett, E.M.; Potter, P.A.; Ramankutty, N. Agronomic phosphorus imbalances across the world’s croplands. Proc. Natl. Acad. Sci. USA 2011, 108, 3086–3091. [Google Scholar] [CrossRef]
  19. Yin, H.J.; Zhao, W.Q.; Li, T.; Chen, X.Y.; Liu, Q. Balancing straw returning and chemical fertilizers in China: Role of straw nutrient resources. Renew. Sustain. Energy Rev. 2018, 81, 2695–2702. [Google Scholar] [CrossRef]
  20. Wang, H.; Ren, H.; Han, K.; He, Q.; Zhang, L.; Zhao, Y.; Liu, Y.; Zhang, J.; Zhao, B.; Ren, B.; et al. Sustainable improvement strategies for summer maize yield, nitrogen use efficiency and greenhouse gas emission intensity in the North China Plain. Eur. J. Agron. 2023, 143, 126712. [Google Scholar] [CrossRef]
  21. Xu, M.-Z.; Wang, Y.-H.; Nie, C.-E.; Song, G.-P.; Xin, S.-N.; Lu, Y.-L.; Bai, Y.-L.; Zhang, Y.-J.; Wang, L. Identifying the Critical Phosphorus Balance for Optimizing Phosphorus Input and Regulating Soil Phosphorus Effectiveness in a Typical Winter Wheat-Summer Maize Rotation System in North China. J. Inter. Agric. 2023; in press. [Google Scholar]
  22. Chen, X.; Yan, X.; Wang, M.; Cai, Y.; Weng, X.; Su, D.; Guo, J.; Wang, W.; Hou, Y.; Ye, D.; et al. Long-term excessive phosphorus fertilization alters soil phosphorus fractions in the acidic soil of pomelo orchards. Soil Tillage Res. 2022, 215, 105214. [Google Scholar] [CrossRef]
  23. Kim, G.W.; Lim, J.Y.; Islam Bhuiyan, M.S.; Das, S.; Khan, M.I.; Kim, P.J. Investigating the arable land that is the main contributor to global warming between paddy and upland vegetable crops under excessive nitrogen fertilization. J. Clean. Prod. 2022, 346, 131197. [Google Scholar] [CrossRef]
  24. Yan, S.; Wu, Y.; Fan, J.; Zhang, F.; Zheng, J.; Qiang, S.; Guo, J.; Xiang, Y.; Zou, H.; Wu, L. Dynamic change and accumulation of grain macronutrient (N, P and K) concentrations in winter wheat under different drip fertigation regimes. Field Crops Res. 2020, 250, 107767. [Google Scholar] [CrossRef]
  25. Halder, D.; Panda, R.K.; Srivastava, R.K.; Kheroar, S. Evaluation of the CROPGRO-Peanut model in simulating appropriate sowing date and phosphorus fertilizer application rate for peanut in a subtropical region of eastern India. Crop J. 2017, 5, 317–325. [Google Scholar] [CrossRef]
  26. Xi, J.; Yang, X.; Geng, J.; Lang, Y. Effects of phosphorus application on phosphorus uptake and yield of maize on saline soil Soils Fertil. Sci. China 2022, 7, 58–63. [Google Scholar]
  27. Mazeed, A.; Maurya, P.; Kumar, D.; Prakash, O.; Suryavanshi, P. Enhancing productivity, quality, and economics of rose scented geranium (Pelargonium graveolens L.) through a novel integrated approach to phosphorus application. Ind. Crops Prod. 2023, 204, 117293. [Google Scholar] [CrossRef]
  28. Ullah, I. Response of Common Buckwheat to Nitrogen and Phophorus Fertilization. Sarhad J. Agric. 2012, 28, 171–178. [Google Scholar]
  29. Zhang, Y.; Xie, D.; Ni, J.; Zeng, X. Optimizing phosphate fertilizer application to reduce nutrient loss in a mustard (Brassica juncea var. tumida)-maize (Zea mays L.) rotation system in Three Gorges Reservoir area. Soil Tillage Res. 2019, 190, 78–85. [Google Scholar] [CrossRef]
  30. Li, H.; Liu, H.; Gong, X.; Li, S.; Pang, J.; Chen, Z.; Sun, J. Optimizing irrigation and nitrogen management strategy to trade off yield, crop water productivity, nitrogen use efficiency and fruit quality of greenhouse grown tomato. Agric. Water Manag. 2021, 245, 106570. [Google Scholar] [CrossRef]
  31. Abubakar, S.A.; Hamani, A.K.M.; Chen, J.; Sun, W.; Wang, G.; Gao, Y.; Duan, A. Optimizing N-fertigation scheduling maintains yield and mitigates global warming potential of winter wheat field in North China Plain. J. Clean. Prod. 2022, 357, 131906. [Google Scholar] [CrossRef]
  32. Huang, C.; Zhang, W.; Wang, H.; Gao, Y.; Ma, S.; Qin, A.; Liu, Z.; Zhao, B.; Ning, D.; Zheng, H.; et al. Effects of water deficit at different stages on growth and ear quality of waxy maize. Agric. Water Manag. 2022, 266, 107603. [Google Scholar] [CrossRef]
  33. Yan, F.; Liu, X.; Bai, W.; Fan, J.; Zhang, F.; Xiang, Y.; Hou, X.; Pei, S.; Dai, Y.; Zeng, H.; et al. Multi-objective optimization of water and nitrogen regimes for drip-fertigated sugar beet in a desert climate. Field Crops Res. 2022, 288, 108703. [Google Scholar] [CrossRef]
  34. Hou, X.; Fan, J.; Hu, W.; Zhang, F.; Yan, F.; Xiao, C.; Li, Y.; Cheng, H. Optimal irrigation amount and nitrogen rate improved seed cotton yield while maintaining fiber quality of drip-fertigated cotton in northwest China. Ind. Crops Prod. 2021, 170, 113710. [Google Scholar] [CrossRef]
  35. Zhang, G.; Wang, C.; Yang, H.; Zhou, Z.; Zhang, Y.; Zhao, L. Experimental Research on Improving the Salt Tolerance of Plants in Coastal Saline Soil-A Case Study of Huanghua City in Hebei Province of China. Nat. Environ. Pollut. Technol. 2018, 17, 459–468. [Google Scholar]
  36. Bremner, J.M. Use of an ammonia electrode for determination of ammonium in Kjeldahl analysis of soils. Commun. Soil Sci. Plant Anal. 1972, 3, 159–165. [Google Scholar] [CrossRef]
  37. Byrt, C.S.; Munns, R.; Gilliham, R.A.B.M.; Wege, S. Root cell wall solutions for crop plants in saline soils. Plant Sci. 2018, 269, 47–55. [Google Scholar] [CrossRef]
  38. Talbi Zribi, O.; Abdelly, C.; Debez, A. Interactive effects of salinity and phosphorus availability on growth, water relations, nutritional status and photosynthetic activity of barley (Hordeum vulgare L.). Plant Biol. 2011, 13, 872–880. [Google Scholar] [CrossRef]
  39. Liu, Z.; Shang, H.; Han, F.; Zhang, M.; Li, Q.; Zhou, W. Improvement of nitrogen and phosphorus availability by Pseudoalteromonas sp. during salt-washing in saline-alkali soil. Appl. Soil Ecol. 2021, 168, 104117. [Google Scholar] [CrossRef]
  40. Loudari, A.; Mayane, A.; Naciri, R.; Zeroual, Y.; Colinet, G.; Oukarroum, A. Root morphological and anatomical responses to increasing phosphorus concentration of wheat plants grown under salinity. Plant Stress 2022, 6, 100121. [Google Scholar] [CrossRef]
  41. Orozco-Mosqueda, M.d.C.; Glick, B.R.; Santoyo, G. ACC deaminase in plant growth-promoting bacteria (PGPB): An efficient mechanism to counter salt stress in crops. Microbiol. Res. 2020, 235, 126439. [Google Scholar] [CrossRef]
  42. Barros, N.L.F.; Marques, D.N.; Tadaiesky, L.B.A.; de Souza, C.R.B. Halophytes and other molecular strategies for the generation of salt-tolerant crops. Plant Physiol. Biochem. 2021, 162, 581–591. [Google Scholar] [CrossRef] [PubMed]
  43. Sun, Q.; Zhang, P.; Zhao, Z.; Sun, X.; Liu, X.; Zhang, H.; Jiang, W. Maize Genotypes Sensitive and Tolerant to Low Phosphorus Levels Exhibit Different Transcriptome Profiles under Talaromyces purpurogenus Symbiosis and Low-Phosphorous Stress. Int. J. Mol. Sci. 2023, 24, 1511941. [Google Scholar] [CrossRef] [PubMed]
  44. Jiang, W.; Liu, X.; Wang, X.; Yang, L.; Yin, Y. Improving Phosphorus Use Efficiency and Optimizing Phosphorus Application Rates for Maize in the Northeast Plain of China for Sustainable Agriculture. Sustainability 2019, 11, 4799. [Google Scholar] [CrossRef]
  45. Zhang, Y.; Wei, W.; Gao, W.; Cui, H.; Xu, X.; Jiang, W.; Liu, S. Content Patterns of Maize Endogenous Hormones and Grain Yield Influenced by Field Phosphorus Application. Agronomy 2023, 13, 1911. [Google Scholar] [CrossRef]
  46. Chen, X.; Ren, H.; Zhang, J.; Zhao, B.; Ren, B.; Wan, Y.; Liu, P. Deep Phosphorus Fertilizer Placement Increases Maize Productivity by Improving Root-shoot Coordination and Photosynthetic Performance. Soil Tillage Res. 2023, 235, 105915. [Google Scholar] [CrossRef]
  47. Graciano, C.; Guiamét, J.J.; Goya, J.F. Impact of nitrogen and phosphorus fertilization on drought responses in Eucalyptus grandis seedlings. For. Ecol. Manag. 2005, 212, 40–49. [Google Scholar] [CrossRef]
  48. Yan, J.; Ren, T.; Wang, K.; Li, H.; Li, X.; Cong, R.; Lu, J. Improved crop yield and phosphorus uptake through the optimization of phosphorus fertilizer rates in an oilseed rape-rice cropping system. Field Crops Res. 2022, 286, 108614. [Google Scholar] [CrossRef]
  49. Liu, J.; Si, Z.; Wu, L.; Shen, X.; Gao, Y.; Duan, A. High-low seedbed cultivation drives the efficient utilization of key production resources and the improvement of wheat productivity in the North China Plain. Agric. Water Manag. 2023, 285, 108357. [Google Scholar] [CrossRef]
  50. Roberts, T.L.; Johnston, A.E. Phosphorus use efficiency and management in agriculture. Resour. Conserv. Recycl. 2015, 105, 275–281. [Google Scholar] [CrossRef]
  51. Goyette, J.O.; Botrel, M.; Billen, G.; Garnier, J.; Maranger, R. Agriculture specialization influence on nutrient use efficiency and fluxes in the St. Lawrence Basin over the 20th century. Sci. Total Environ. 2023, 856, 159018. [Google Scholar] [CrossRef]
  52. Duan, Y.-H.; Shi, X.-J.; Li, S.-L.; Sun, X.-F.; He, X.-H. Nitrogen Use Efficiency as Affected by Phosphorus and Potassium in Long-Term Rice and Wheat Experiments. J. Integr. Agric. 2014, 13, 588–596. [Google Scholar] [CrossRef]
  53. Nachimuthu, G.; Schwenke, G.; Baird, J.; McPherson, A.; Mercer, C.; Sargent, B.; Hundt, A.; Macdonald, B. Cotton yield response to fertilizer phosphorus under a range of nitrogen management tactics. Agric. Ecosyst. Environ. 2022, 1, 214–219. [Google Scholar] [CrossRef]
  54. Mai, W.; Xue, X.; Feng, G.; Yang, R.; Tian, C. Can optimization of phosphorus input lead to high productivity and high phosphorus use efficiency of cotton through maximization of root/mycorrhizal efficiency in phosphorus acquisition? Field Crops Res. 2018, 216, 100–108. [Google Scholar] [CrossRef]
  55. Sonmez, O.; Turan, V.; Kaya, C. The effects of sulfur, cattle, and poultry manure addition on soil phosphorus. Turk J. Agric. 2016, 40, 536–541. [Google Scholar] [CrossRef]
  56. Wu, L.; Zhang, S.; Chen, M.; Liu, J.; Ding, X. A sustainable option: Biochar addition can improve soil phosphorus retention and rice yield in a saline–alkaline soil Environ. Technol. Innov. 2021, 24, 102070. [Google Scholar] [CrossRef]
  57. Hu, J.; Zhang, S.; Yang, S.; Zhou, J.; Jiang, Z.; Qi, S.; Xu, Y. Effects of Irrigation and Fertilization Management on Yield and Quality of Rice and the Establishment of a Quality Evaluation System. Agronomy 2023, 13, 2034. [Google Scholar] [CrossRef]
  58. Liu, Y.; Zhou, Y.; Zhang, X.; Cao, N.; Li, B.; Liang, J.; Yang, Q. Effects of Combined Application of Biological Agent and Fertilizer on Fungal Community Structure in Rhizosphere Soil of Panax notoginseng. Agronomy 2023, 13, 2093. [Google Scholar] [CrossRef]
Figure 1. Maximum and minimum air temperature and monthly rainfall during the summer maize seasons in (a) 2018, (b) 2019, and (c) 2020.
Agronomy 13 02668 g001
Figure 2. Influence of different phosphate fertilizer rates on grain yield and biomass yield in the 2018, 2019, and 2020 maize seasons. Different letters indicate a significant difference at * p < 0.05; ** p < 0.01; ns, not significant.
Agronomy 13 02668 g002
Figure 3. Influence of different phosphate fertilizer rates on nitrogen uptake content in the 2018, 2019, and 2020 maize seasons. Different letters indicate a significant difference at p < 0.05; ** p < 0.01.
Agronomy 13 02668 g003
Figure 4. Influence of different phosphate fertilizer rates on phosphorus uptake content in the 2018, 2019, and 2020 maize seasons. Different letters indicate a significant difference at p < 0.05; ** p < 0.01; ns, not significant.
Agronomy 13 02668 g004
Figure 5. Influence of different phosphate fertilizer rates on potassium uptake content in the 2018, 2019, and 2020 maize seasons. Different letters indicate a significant difference at p < 0.05; ** p < 0.01.
Agronomy 13 02668 g005
Figure 6. Influence of different phosphate fertilizer rates on nitrogen physiological efficiency (NPE), phosphorus physiological efficiency (PPE), and potassium physiological efficiency (KPE) in the 2018, 2019 and 2020 maize seasons. Different letters indicate a significant difference at p < 0.05; ** p < 0.01.
Agronomy 13 02668 g006
Figure 7. The TOPSIS score and normalized values of all indexes under different phosphate fertilizer rates in 2018, 2019, and 2020. Note: GY, grain yield; BY, biomass yield; TN, total nitrogen uptake; TP, total phosphorus uptake; TK, total potassium uptake; NPE, nitrogen physiological efficiency; PPE, phosphorus physiological efficiency; KPE, potassium physiological efficiency.
Agronomy 13 02668 g007
Disclaimer/Publisher’s Note: The statements, opinions and data contained in all publications are solely those of the individual author(s) and contributor(s) and not of MDPI and/or the editor(s). MDPI and/or the editor(s) disclaim responsibility for any injury to people or property resulting from any ideas, methods, instructions or products referred to in the content.

