Article

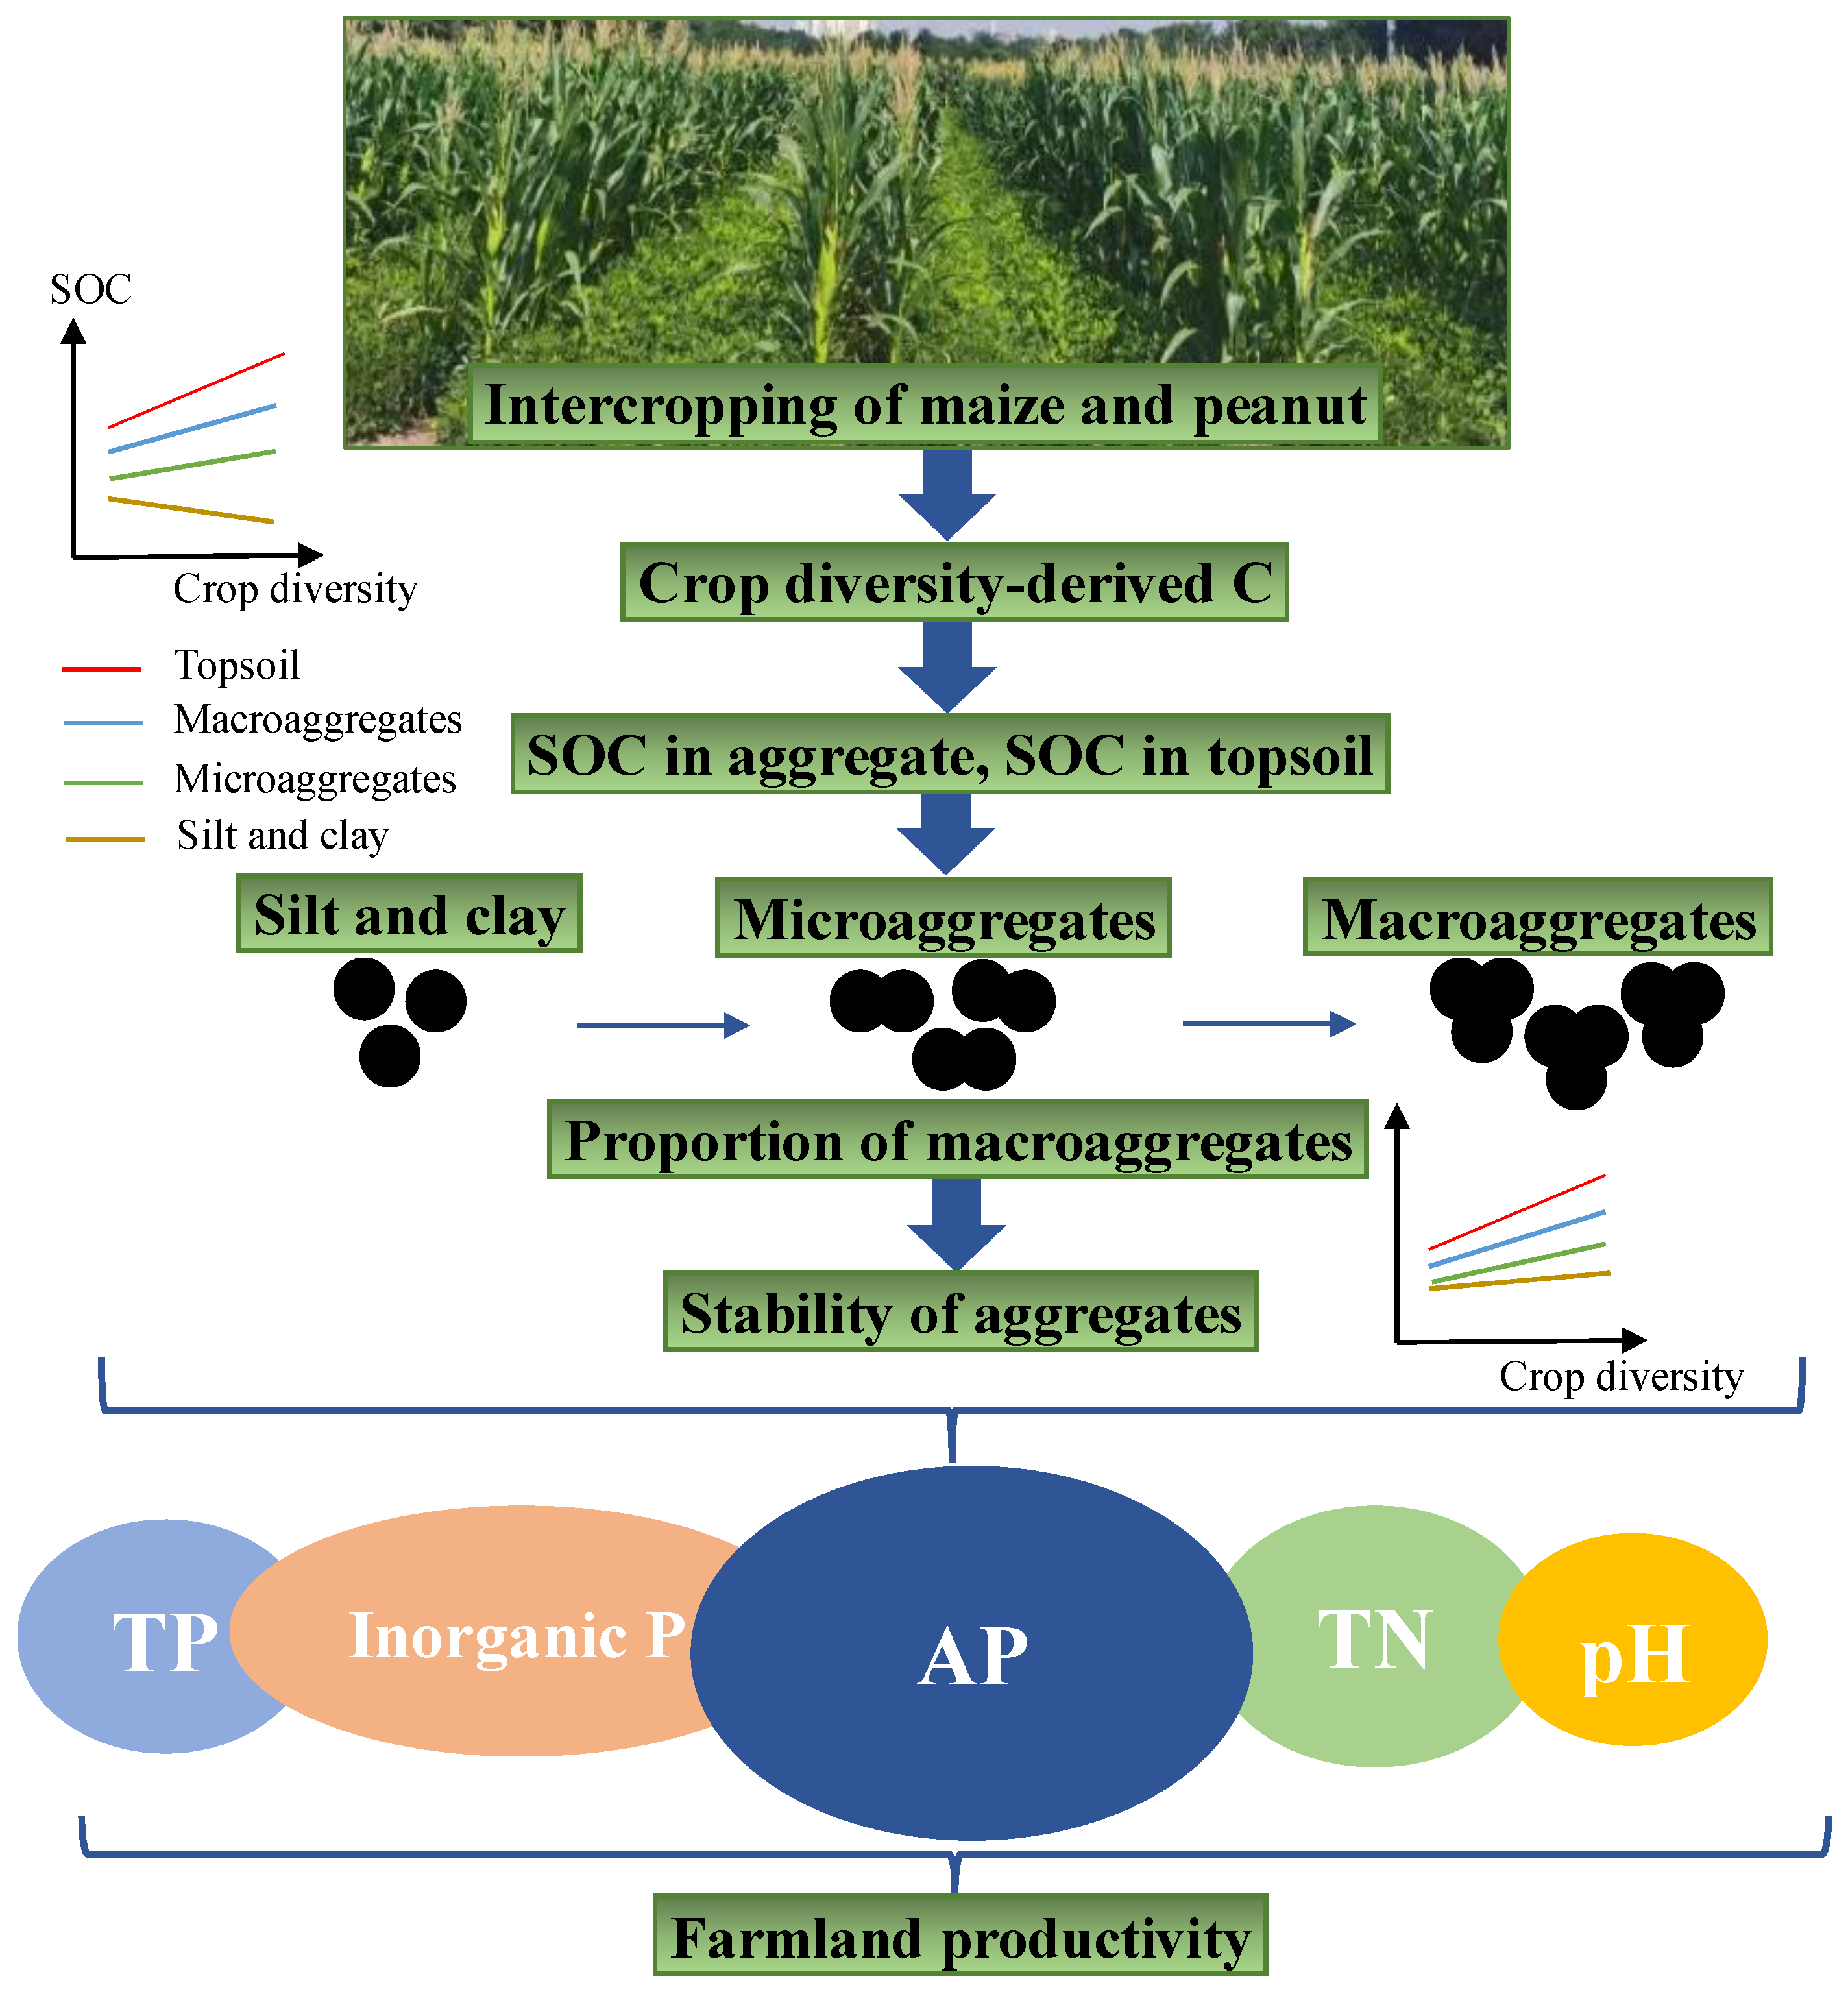
Long-Term Maize Intercropping with Peanut and Phosphorus Application Maintains Sustainable Farmland Productivity by Improving Soil Aggregate Stability and P Availability

1
College of Agronomy, Henan University of Science and Technology, Luoyang 471023, China
2
Shandong Provincial Key Laboratory of Water and Soil Conservation and Environmental Protection, College of Resources and Environment, Linyi University, Linyi 276000, China
3
State Key Laboratory of Crop Biology, College of Agronomy, Shandong Agricultural University, Tai’an 271018, China
4
State Key Laboratory of Nutrient Use and Management, College of Resources and Environmental Sciences, China Agricultural University, Beijing 100193, China
*
Author to whom correspondence should be addressed.
Agronomy 2023, 13(11), 2846; https://doi.org/10.3390/agronomy13112846
Submission received: 13 October 2023 / Revised: 9 November 2023 / Accepted: 16 November 2023 / Published: 20 November 2023

Abstract

:
The intercropping of maize (Zea mays L.) and peanuts (Arachis hypogaea L.) (M||P) significantly enhances crop yield. In a long-term M||P field experiment with two P fertilizer levels, we examined how long-term M||P affects topsoil aggregate fractions and stability, organic carbon (SOC), available phosphorus (AP), and total phosphorus (TP) in each aggregate fraction, along with crop yields. Compared to their respective monocultures, long-term M||P substantially increased the proportion of topsoil mechanical macroaggregates (7.6–16.3%) and water-stable macroaggregates (>1 mm) (13.8–36.1%), while reducing the unstable aggregate index (ELT) and the percentage of aggregation destruction (PAD). M||P significantly boosted the concentration (12.9–39.9%) and contribution rate (4.1–47.9%) of SOC in macroaggregates compared to single crops. Moreover, the concentration of TP in macroaggregates (>1 mm) and AP in each aggregate fraction of M||P exceeded that of the respective single crops (p < 0.05). Furthermore, M||P significantly increased the Ca2-P, Ca8-P, Al-P, and Fe-P concentrations of intercropped maize (IM) and the Ca8-P, O-P, and Ca10-P concentrations of intercropped peanuts (IP). The land equivalent ratio (LER) of M||P was higher than one, and M||P stubble improved the yield of subsequent winter wheat (Triticum aestivum L.) compared with sole-crop maize stubble. P application augmented the concentration of SOC, TP, and AP in macroaggregates, resulting in improved crop yields. In conclusion, our findings suggest that long-term M||P combined with P application sustains farmland productivity in the North China Plain by increasing SOC and macroaggregate fractions, improving aggregate stability, and enhancing soil P availability.

1. Introduction

Global agricultural systems are facing major challenges in meeting the needs of the increasing global population [1,2]. Current global agriculture is based on monoculture and excessive fertilizer input, which have led to soil degradation, soil nutrient depletion, and an increase in pathogenic microorganisms, together resulting in crop yield instability [3]. Therefore, appropriate field management is essential to increase species diversity and restore degraded soil functions, ensuring the sustainable development of crop productivity [4,5]. In this regard, intercropping is a globally recognized model for sustainable agricultural development [5,6].
Intercropping of maize-fava bean (Vicia fava L.) increases species diversity and microbial communities [7]. It also enhances nutrient utilization efficiency and contributes to soil sustainability [8,9]. Furthermore, several studies have demonstrated that intercropped crops exhibit higher root biomass and root length density compared to monocultures. The intertwining roots improve crop root attachment to the soil, increase microbial activity, and accelerate the transition from microaggregates to macroaggregates [10,11,12]. Macroaggregates play a crucial role in physically protecting soil compounds from biodegradation and erosion, as well as retaining significant amounts of carbon (C) and phosphorus (P), ultimately leading to higher crop yields and efficiency [13,14]. Li et al. [5] reported a 22.3% increase in crop yield in intercropped systems compared to matched monocultures in northwest China, with greater year-to-year stability. Furthermore, intercropping maize with pigeon pea (Cajanus cajan L.) in Eastern and Southern Africa has resulted in up to a 35% increase in maize yield [15]. Similarly, intercropping with cowpea (Vigna sinensis L.) in India enhances the yield of the current crop and boosts the yield of subsequent winter wheat [16]. In the North China Plain, our previous research has shown that intercropping maize and peanut (M||P) offers significant yield advantages, attributed to positive aboveground and belowground interspecific interactions influencing crop plant growth [17,18]. These mechanisms may involve enhancing iron and nitrogen reciprocity between maize and peanut [19] and weak light absorption and utilization by peanut [20] along with strong light utilization by maize [17]. Feng et al. showed that the worldwide average LER of maize intercropping with peanut was 1.31 ± 0.03 through a global meta-analysis of 36 studies [21]. However, whether long-term M||P can sustainably increase the yield of subsequent crops remains unclear.
Soil aggregates are the basic unit of soil structure. The fractions and stability play an essential role in the conversion of soil material and capacity [22], which are affected by soil organic carbon (SOC) concentration, fertilization, and planting patterns [14,23,24]. Maize-pigeon pea intercropping enhances soil macroaggregate fractions and organic phosphorus storage [14]. Faba bean-maize intercropping alters soil microbial community composition and further facilitates soil aggregation [25], facilitating the conversion of insoluble soil P sources to soluble P sources [26], thus providing a slow but continuous source of P for crops [27]. Millet (Setaria italica L.)-peanut intercropping system increases macroaggregates (>2 mm), improves aggregate stability, and enhances SOC and N concentrations in aggregates [12]. However, whether long-term M||P can increase SOC, thereby improving soil aggregate stability and nutrient availability, merits further study.
Numerous studies have attempted to demonstrate the effects of intercropping and fertilization on soil aggregate stability and nutrients, but the results have been inconsistent [28,29,30,31,32,33,34]. Some studies showed that fava bean and broccoli (Brassica oleracea var italica L.) intercropping could increase the proportion of soil macroaggregates (>2 mm), organic carbon and nutrient contents, and thus significantly increase crop productivity [28]; that maize intercropping with cowpea and balanced fertilization increased soil macroaggregate proportions and enhanced soil stability, which resulted in an increased carbon sequestration rate and improved crop production potential [30]; and that wheat-maize-soybean relay strip intercropping maintained soil fertility and increased both soil macroaggregate stability and microbial diversity when straw incorporation and N input were considered [31]. In contrast, Chai et al. [32] reported that 22 years of continuous chemical fertilizer application significantly decreased macroaggregate fractions but did not increase macroaggregate formation, and that fertilization did not significantly affect the formation of macro-aggregates [33], and Liu [34] reported that although intercropping increased water-stable macroaggregates (>2 mm), and its interaction with P fertilizer did not significantly increase the proportion of soil water-stable macroaggregates. Therefore, the effects of M||P and P application on aggregate fractions and stability need to be studied further.
M||P played an important role in alleviating the conflict between grain and oil crops in China, exerting significant intercropping advantages [19,35]. Therefore, this study aimed to investigate how intercropping affects soil aggregate fractions and stability, as well as the concentration of C and P in these aggregate fractions, and how these factors relate to farmland productivity in the North China Plain. This investigation was conducted through an 11-year M||P field experiment with two levels of P fertilizer application. Our initial hypotheses were as follows: compared to those of the respective single crops (i) long-term M||P increases SOC concentration and fractions of macroaggregates, improves aggregate stability in topsoil; (ii) intercropping and P application boost TP and AP concentration in macroaggregates, enhance soil P availability, and so (iii) long-term M||P can maintain sustainable farmland productivity (Figure 1).

2. Materials and Methods

2.1. Experimental Site

A long-term M||P and P application field experiment was conducted in Luoyang, Henan Province, China (33°35’ N, 111°8’ E). This area has a temperate continental monsoon climate, with an annual average temperature of approximately 12.7 °C. The average annual radiation is approximately 492 kJ·cm−2, the average annual precipitation is 650 mm, the average sunshine is 2200–2300 h, and the frost-free period is 180–200 d. The soil in the experimental site is fluvo-aquic, with sand, loam, and clay accounting for 28%, 50%, and 22%, respectively. At the beginning of the experiment in 2010, soil characteristics of the 0–20 cm topsoil layer were measured by standard methods [36] and were as follows: pH, 7.33; organic C, 10.7 g·kg−1; total N, 1.20 g·kg−1; total P, 0.75 g·kg−1; available N, 79.9 mg·kg−1; available P, 11.6 mg·kg−1; available K, 223.8 mg·kg−1; and bulk density, 1.35 g·cm−3.

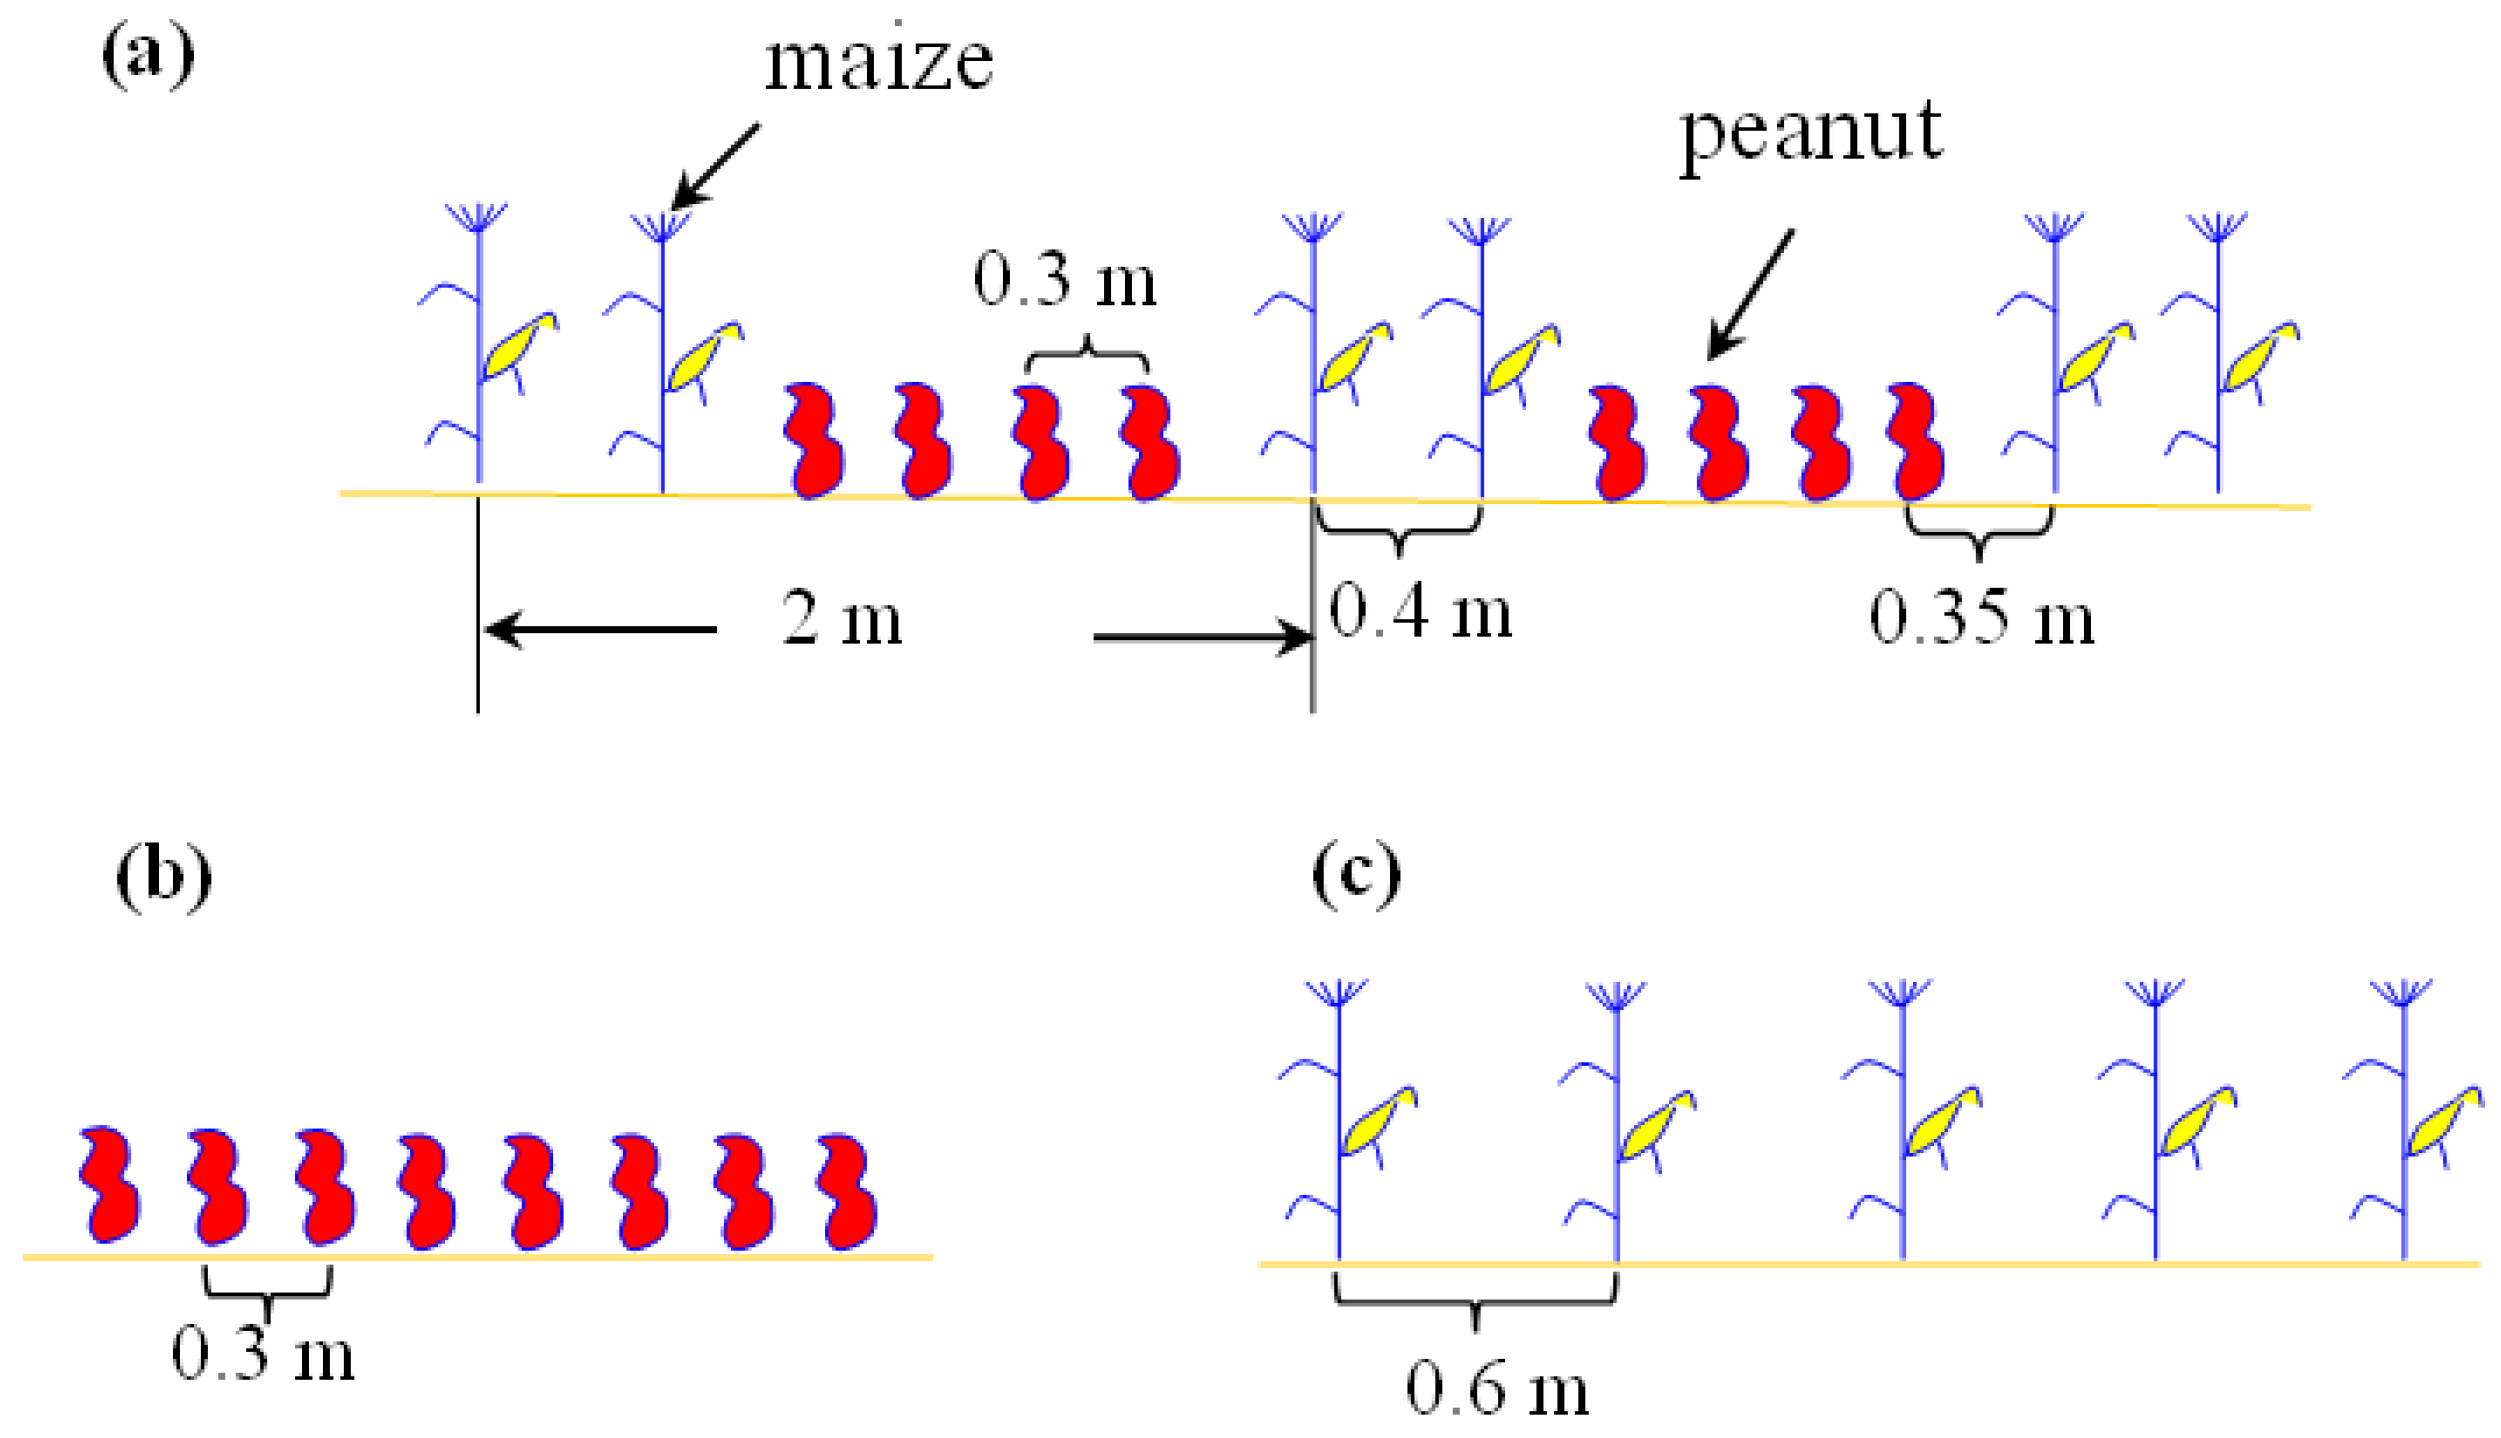
2.2. Experimental Design

We used cultivars (cv.) commonly grown by local farmers, namely maize cv. Zhengdan 958, and peanut cv. Huayu 16. The field experimental design was a randomized complete block design with three replicates, three crop systems, and two P fertilizer treatments each year from 2010 to 2022. The crop systems were as follows: maize intercropped with peanuts (two rows of maize intercropped with four rows of peanuts, M||P), sole-crop peanut (SP), and sole-crop maize (SM). In the intercropping system, intercropped maize (IM) was planted in wide-narrow rows with row spacing of 1.6 m and 0.4 m, respectively; plant spacing within the row was 0.2 m. Intercropped peanut (IP) was planted in wide rows with row spacing of 0.3 m; plant spacing within the row was 0.2 m. The distance between adjacent maize and peanut rows was 0.35 m. The planting densities of IM and IP were 50,000 plants·ha−1 and 100,000 plants·ha−1, respectively. In sole cropping, for peanuts, the row spacing was 0.3 m and plants were spaced 0.2 m within the row, with a density of 166,667 holes·ha−1. For maize, the row spacing was 0.6 m and plant spacing was 0.25 m within the row, with a density of 66,667 plants·ha−1 (Figure 2). Maize and peanut were sown simultaneously in early June and harvested simultaneously in early October. The field plots received 90 kg N·ha−1 as urea before peanut sowing and 90 kg N·ha−1 as urea as a furrow dressing for maize at the sixth-leaf stage. The two P application levels were 0 kg P2O5·ha−1 (P0) and 180 kg P2O5·ha−1 (P180) as diammonium phosphate before crop sowing from 2010 to 2022.
To assess the long-term sustainability of M||P intercropping in maintaining farmland productivity, winter wheat was planted following maize and peanut harvests from 2018 to 2022. The winter wheat cv. Luomai 26 was planted using semi-precise mechanical seeding in mid-October and harvested in early June. The seeding rate was 150 kg·ha−1 with a row spacing of 0.2 m. Weed and pest control followed standard field production practices and spray irrigation was applied annually, aligning with crop demand and local practices in response to soil moisture shortages. All treatments received 180 kg N·ha−1 in the form of urea, and prior to sowing winter wheat each year, two P application levels were utilized: P0 and P180, both in the form of diammonium phosphate.

2.3. Soil Sampling

Soil samples were collected from plots on 14 April 2020, and were taken down to a depth of 20 cm using an auger (10 cm in diameter). In addition, in the previous crop of the intercropping system, soil samples were collected according to the strips of peanut and maize intercropping. Soil samples were broken into 10–12 mm diameter blocks according to their natural structure. Stones and plant residue were removed from the soil. All soil samples were divided into three subsamples. First subsample was air-dried and passed through a 2 mm mesh sieve for analysis of chemical properties; the second subsample was air-dried and passed through a 10 mm sieve to investigate aggregate fractions, the third sample was air dried for the determination of SOC, total phosphorus (TP), available phosphorus (AP), Ca2-P, Ca8-P, Al-P, Fe-P O-P, and Ca10-P concentration in topsoil.

2.4. Determination of Soil Aggregate

Soil water-stable aggregates were measured using the wet sieving method [37] and separated into six sizes: (1) huge macroaggregates (>2 mm), (2) large macroaggregates (2–1 mm; it should be noted that “macroaggregates” is used to represent aggregates >1 mm further in the text), (3) small macroaggregates (1–0.5 mm), (4) microaggregates (0.5–0.25 mm), and (5–6) silt and clay (0.25–0.053 mm and <0.053 mm, respectively). The aggregate fractions were dried at 105 °C in a vacuum oven for 24 h and the weights of the aggregate fractions were recorded.
Soil mechanical aggregates were measured using the dry-sieving method [38] and were separated into five sizes: (1) huge macroaggregates (>2 mm), (2) large macroaggregates (2–1 mm; it should be noted that further in the text “macroaggregates” is used to represent aggregates >1 mm), (3) small macroaggregates (1–0.5 mm), (4) microaggregates (0.5–0.25 mm), and (5) silt and clay (<0.25 mm). To determine the SOC, TP, AP, and inorganic phosphorus concentration in aggregate fractions, aggregates of each particle size were air-dried.

2.5. Soil Chemical Property Analysis

The SOC was determined by H2SO4 (Luoyang Haohua reagent factory., Luoyang, China)-K2CrO7 (Luoyang Haohua reagent factory., Luoyang, China) digestion, and ferrous sulfate reverse titration; TN was determined by the Kjeldahl method; soil pH was determined after shaking the soil water (1:2.5, w/v) suspension for 30 min; The methods for determination of TP, AP were concentrated sulfuric acid-perchloric acid digestion and sodium bicarbonate infiltration extraction, respectively; Ca2-P, Ca8-P, Al-P, Fe-P O-P and Ca8-P were extracted using six solutions and then determined by inductively coupled plasma emission spectrometry. The specific determination method of the above indicators can be found in the agricultural analysis book [36].

2.6. Determination of Crop Yields

At the harvest stage of SM, IM, SP, IP, and winter wheat, the yields of five-meter double-row peanut, maize, and winter wheat were measured randomly with three replicates. After air-drying, the weights of maize seed, peanut pod, and wheat seed were measured from 2018 to 2022, respectively. Meanwhile, the straw in each plot was crushed in situ and returned to the field.

2.7. Calculations

2.7.1. Stability Index of Soil Aggregates

The mean weight diameter (MWD: mm), geometric mean diameter (GMD: mm), unstable aggregate index (ELT), and percentage of aggregation destruction (PAD) were used to quantify soil aggregate stability [39,40]. The specific formulae are as follows:
Nutrient contribution rate of aggregate fractions (%) =
[nutrient concentration of the aggregate fraction (g·kg−1) × proportion of
the aggregate fraction (%)/soil nutrient concentration] × 100,
WR0.25 = WS > 0.25/WS × 100%,
DR0.25 = Mr > 0.25/Mr × 100%,
ELT = (WS − WR0.25)/WT × 100%,
PAD = (DR0.25 − WR0.25)/DR0.25 × 100%,
MWD = i = 1 n = 6 W i ˙ X i ,
and
GMD = exp Σ i = 1 n = 6 W i ˙ X i Σ i = 1 n = 6 W I ˙ ,
where DR0.25 (%) is the proportion of mechanical aggregates >0.25 mm and WR0.25 (%) is the proportion of water-stable aggregates >0.25 mm. WS > 0.25 (g) and WS (g) are the fractions weights of water-stable aggregates >0.25 mm and the sum of weights of each water-stable aggregate fraction, respectively. Mr > 0.25 (g) and Mr (g) are the fraction weights of mechanically stable aggregates >0.25 mm and the sum of weights of each mechanically stable aggregate fraction, respectively. Each of the six classes of diameters (i = 1–6), Xi (mm), and Wi (%) are the mean diameter and proportion of each size fraction of water-stable aggregates, respectively.

2.7.2. Land Equivalent Ratio

The intercropping advantage is measured by the land equivalent ratio (LER) [41]. The specific formula is as follows:
LER = Y I M Y S M + Y I P Y S P
where YIM and YSM are the actual yields of the intercropped and sole-crop maize, respectively, and YIP and YSP are the actual yields of the intercropped and sole-crop peanuts, respectively.

2.8. Statistical Analyses

All statistical analyses were performed using SPSS (version 24.0; SPSS Inc., Chicago, IL, USA) and AMOS (version 23.0; Chicago, IL, USA). The figures were prepared using Excel 2019 (Microsoft Corporation, Washington, DC, USA). The effects of different planting patterns and P application on SOC and soil nutrient concentration in aggregates, proportion of aggregate size fraction, and aggregate stability were evaluated using one-way and two-way analysis of variance (ANOVA) (the normal distribution and homogeneity of variance of the data were checked). Pearson correlation analysis was employed to assess correlations. Treatment means were separated using Duncan’s test at a 0.05 probability level. To examine the relationship between soil physicochemical properties and productivity, we conducted confirmatory factor analysis using the maximum likelihood method to construct a path model within the framework of structural equation modeling (SEM), aligning with our main objectives.

3. Results

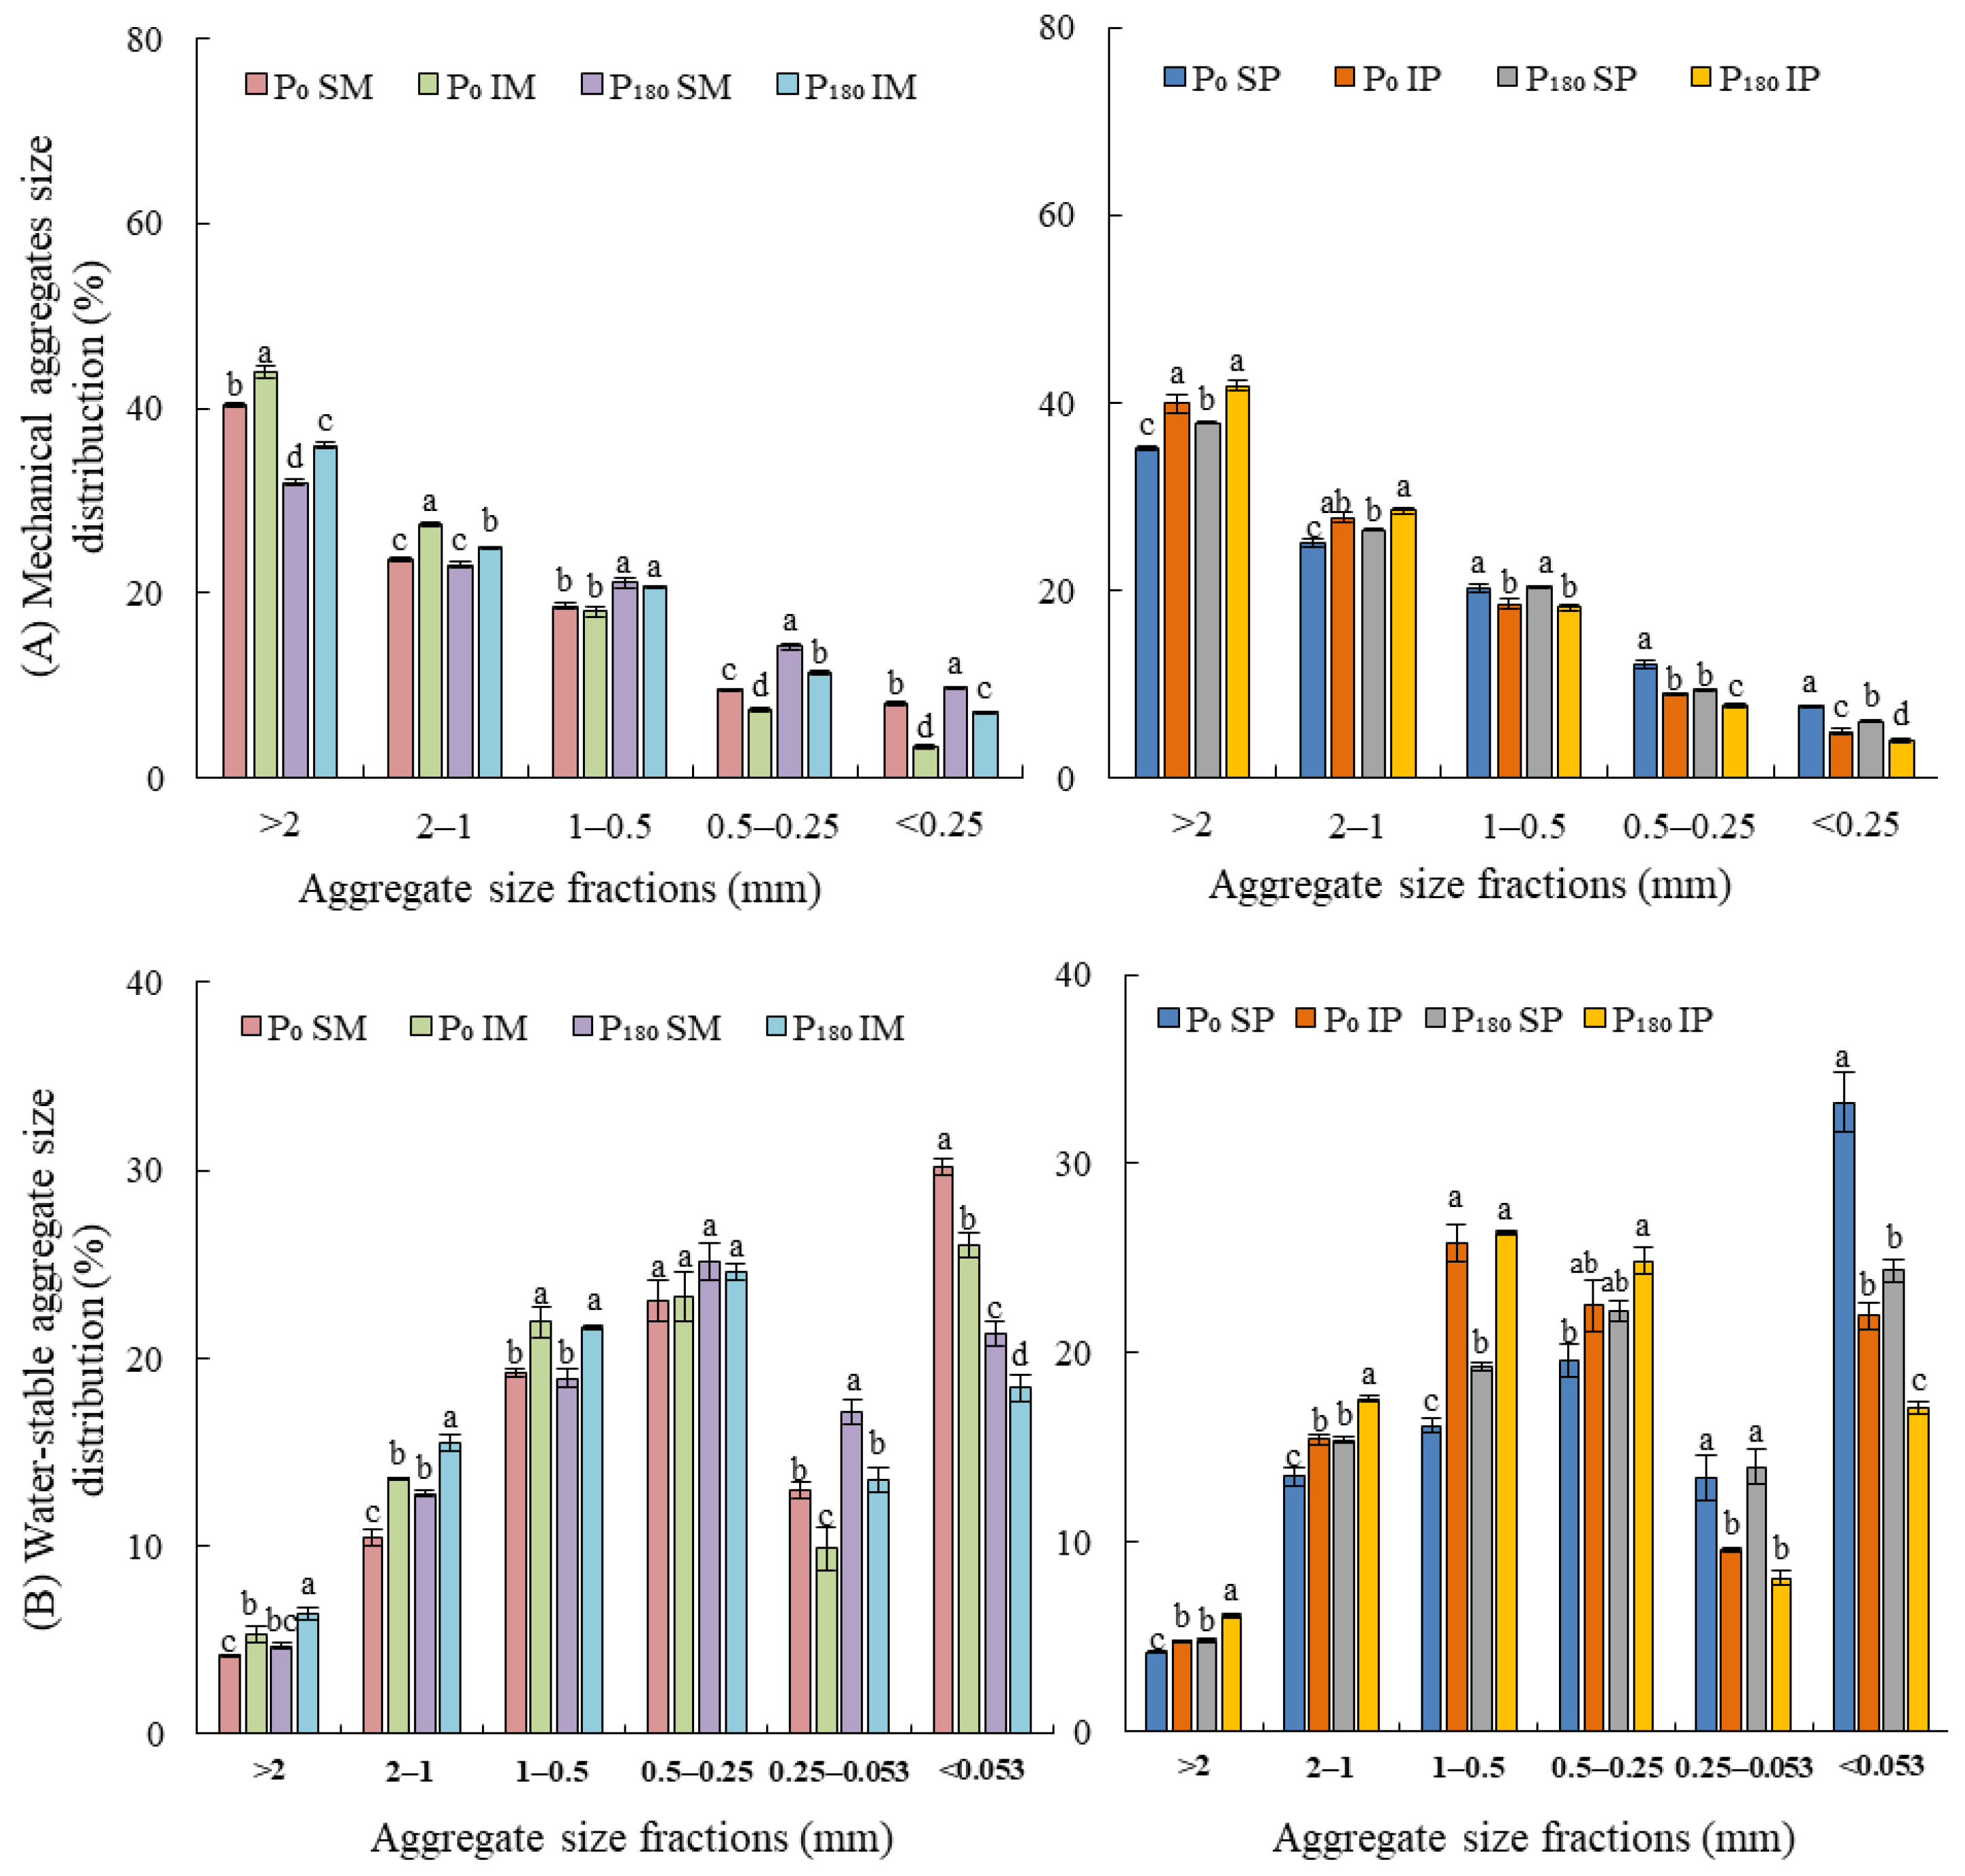
3.1. Effects of Long-Term M||P and P Application on the Proportion and Stability of Aggregates

The proportion of mechanical macroaggregates (>1 mm) was significantly greater (p < 0.05) in intercropped (IM) plots compared to sole maize (SM) and intercropped (IP) plots compared to sole peanut (SP) plots, with increases of 7.6–13.7% and 8.6–16.3%, respectively (Figure 3A). In IM, the proportions of water-stable macroaggregates (>1 mm) (21.3–36.1%) and small macroaggregates (1–0.5 mm) (14.1–14.3%) were significantly higher (p < 0.05) than in SM (Figure 3B). In IP, the proportions of water-stable macroaggregates (>1 mm) (13.8–26.6%), small macroaggregates (1–0.5 mm) (36.6–59.4%), and microaggregates (0.5–0.25 mm) (12.0–14.9%) were significantly greater (p < 0.05) than those in SP (Figure 3B). Under P application, intercropping significantly increased the proportions of mechanical macroaggregates (>1 mm) and water-stable macroaggregates (>0.5 mm) compared to SP and SM (Figure 3). There was a significant interaction between planting pattern and P application on mechanical and water-stable aggregate (Tables S1 and S2). Long-term M||P significantly increased DR0.25, WR0.25, MWD, and GMD compared with those of the respective single crops, but significantly decreased (p < 0.05) ELT and PAD (Table 1). P application had a positive effect on these results, which also significantly increased the stability of soil aggregates.

3.2. Effects of Long-Term M||P and P Application on Concentration and Contribution Rates of SOC in Aggregates

The SOC concentration in macroaggregates (>2 mm) was significantly higher (p < 0.05) in the intercropped than that for the SP and SM, increased by 39.9% and 12.9%, respectively (Figure 4A). The P application significantly increased (p < 0.05) the SOC concentration in each aggregate fraction in the M||P system compared with their matched monocultures (Figure 4A). The contribution rate of SOC in macroaggregates (>1 mm) was greater (p < 0.05) in intercropped than that for the SP and SM, increased by 4.1–47.9% and 17.7–17.8%, respectively (Figure 4B). Compared with the respective single crops, the contribution rate of SOC in macroaggregates (>1 mm) significantly increased (p < 0.05) for the IP (16.9%) and IM (15.9%) with the P180 application (Figure 4B). There was a significant interaction between planting pattern and P application on concentration and contribution rate of SOC (Tables S3 and S4).

3.3. Effects of Long-Term M||P and P Application on Organic C and Nutrients

The TP concentration in macroaggregates (>1 mm) was greater (p < 0.05) in intercropped compared to that for the SM and SP, increased by 7.6–12.9% and 5.1–12.2%, respectively (Table 2). Long-term M||P and P application significantly increased the AP concentration in each aggregate fraction (Table 2). IM and IP significantly increased (p < 0.05) SOC, TP, and AP concentration by, 23.7%, 8.3%, and 36.2% and 7.5%, 8.3%, and 22.1%, respectively, compared with those of the respective single crops (Table 3). The interaction between P application and M||P significantly increased SOC (32.7–52.7%), TP (3.8–8.7%), and AP (37.7–51.0%) concentrations, with all differences being statistically significant (p < 0.05). However, there was no significant difference in the topsoil TN concentration among the treatments. Compared to their respective monocultures, IP increased Ca8-P, O-P, and Ca10-P concentrations and decreased Ca2-P, Al-P, and Fe-P concentrations, whereas IM increased Ca2-P, Ca8-P, Al-P, and Fe-P concentrations and decreased O-P and Ca10-P concentrations. P180 significantly increased Ca2-P, Ca8-P, Al-P, and Fe-P concentrations under different planting methods compared to P0. Long-term intercropping significantly reduced the pH of alkaline soil (Table 3).

3.4. Effects of Long-Term M||P and P Application on Farmland Productivity

In 2018–2022, the LER in intercropping ranged from 1.28–1.46, with an average of 1.33 (Table 4). The subsequent winter wheat yield (13.4–56.68%) of M||P stubble was higher (p < 0.05) than that of SM stubble. P180 significantly increased (p < 0.05) subsequent winter wheat yields in M||P stubble by 12.6–38.1% compared to P0. The annual crop yield of the M||P-W (a multiple cropping system in which M||P was harvested and then wheat was planted in a year) exceeded that of the SP-W (a multiple cropping system in which SP was harvested and then wheat was planted in a year) and SM-W (a multiple cropping system in which SM was harvested and then wheat was planted in a year) systems, with significant increases of 27.5–74.7% and 10.3–41.6% (p < 0.05), respectively. The increase in annual yield was greater in the M||P-W system under P application (Table 4).

3.5. Relationships between Farmland Productivity and Soil Physical and Chemical Properties

An SEM was established based on known influencing factors (SOC, WR0.25 PAD, TN, pH, and AP) and key drivers (intercropping and P application) to clarify the effects of intercropping and P application on topsoil physical and chemical properties, crop productivity, and their correlation. The SEM showed that SOC indirectly affected productivity through WR0.25 (0.65), PAD (−0.18), TN (−0.35), pH (0.60), and AP (0.19), whereas TN (0.29) and AP (0.69) directly affected productivity. WR0.25 had a positive feedback effect on TN (0.81) and pH (0.63) and a negative feedback effect on PAD (−0.82). The PAD indirectly affected productivity through pH (0.53) and AP (−0.34), and pH indirectly affected productivity through TN (0.61) (Figure 5).

4. Discussion

4.1. Long-Term M||P and P Application Strengthened the Soil Aggregate Stability, Increased the Topsoil SOC Concentration in Macroaggregates

Planting patterns and agricultural practices, such as fertilization, influence soil aggregate stability and SOC concentration [14,29]. In this study, long-term M||P significantly increased SOC concentration in macroaggregates, developed the proportion of mechanical and water-stable macroaggregates, and had a strong positive effect on soil aggregation (Figure 3 and Figure 4). These findings support our first hypothesis and are consistent with previous studies [5,31,42]. Intercropping is an important cultivation method that increases C input by increasing aggregate stability [24,28], which can improve organic matter persistence in agricultural soils by maximizing biodiversity [4], improving aboveground productivity and underground biomass, strengthening interspecific edge effects [43], changing the soil microbial community structure, reducing pathogenic bacteria, and increasing plant rhizosphere vitality, all of which are conducive to soil C sequestration and storage [11]. The intercropping of sugarcane with other crops increases organic C sources that can replenish organic C in aggregates directly, with organic C encapsulated in aggregates or existing in pores in the form of particles, which reduces organic C decomposition [44]. Studies have shown that long-term fava bean-maize intercropping can improve the microbial community structure in crop rhizosphere soil, increase fungal biomass, and stimulate microorganisms to release cementing substances [25]. These cementing substances, released by microbial communities, play a crucial role in soil structure development by binding primary soil particles into larger aggregates [45]. Soil macroaggregates are composed of microaggregates and organic matter, so an increase in macroaggregates results in a gradual rise in soil organic carbon [46]. However, Zhou et al. [47] demonstrated that intercropping could increase soil microaggregate fractions and reduce soil aggregate mean weight diameter (MWD), while Peng et al. [12] found no significant difference in the proportion of aggregates between sole cropping and intercropping. Some studies suggest that as plant diversity increases, litter decomposition rates become slower than input rates, which can increase total soil organic carbon (SOC) while reducing the soil’s active carbon pool [48]. Importantly, the formation of soil aggregates and changes in SOC are long-term and gradual processes. Factors such as test duration, soil type, crop type, and climatic conditions can significantly influence research outcomes [5,25].
In addition to the direct effects of intercropping, P application significantly influenced aggregate-associated C and aggregate stability. Fertilizer type and planting pattern influence both the degree of soil aggregation and the fate of C stability in agroecosystems [49,50]. This study concludes that P application significantly increased aggregate stability and SOC concentration (Table 1 and Table 3, Figure 4A). The results align with the findings of Prakash et al. and Bansal et al. [51,52], who also observed that P application promotes soil enzyme activity and enhances SOC concentration [51,53]. Phosphate fertilizer application fosters crop growth and development and substantially increases crop biomass and soil microbial biomass C, thus contributing to soil C sequestration [53] (Mahmoud et al. 2019). Moreover, P fertilizer can enhance C sequestration by stimulating microbial activity and root biomass, thereby promoting the formation of soil aggregates [54,55]. In cases of low-P soils, the appropriate application of P fertilizer can result in increased SOC and nitrogen storage and the development of macroaggregates (>2 mm) [52]. In high-P soils, rhizosphere interactions in intercropping systems can enhance soil aggregation and boost C sequestration. These effects are primarily driven by physical root contact, with secondary contributions from biochemical activities [14].

4.2. Long-Term M||P and P Application Improved Topsoil TP and AP Concentration in Aggregate Fractions

P is an important component of fertilizers and an essential nutrient for crop growth [53]. However, most P is consolidated and precipitated in the soil, where it combines with other phosphates to form P with low solubility. Crops can only absorb and use a small amount of P [56]. Therefore, it is crucial to determine the effectiveness of increasing soil P and reducing P fertilizer application. In this study, the TP concentration in macroaggregates (>1 mm) and AP concentration in each aggregate fraction were significantly higher in the long-term M||P system compared with their matched monocultures (Table 2). This supports our second hypothesis and corroborates other studies that show the ability of maize and leguminous intercropping to improve soil P availability [57,58]. This could be because intercropping can improve soil structure and increase soil macroaggregates [14] (Garland et al. 2017), which can protect the soil from degradation and erosion, thereby increasing soil C and P concentrations [59,60]. These findings are supported by our research (Table 1, Table 2 and Table 3; Figure 3 and Figure 4). This is a positive result because it suggests that the maize-peanut intercropping system has a high potential for increasing both the use and storage of P in the form of increased large aggregates, which has been suggested to reduce P pool losses by improving soil structure stability [14].
We also observed a significant decrease in soil pH for M||P (Table 3). The changes in TP and AP were the opposite of those in pH. Soil acidification may be associated with increased soil P availability. The SEM revealed that soil acidification can directly affect total N concentration, thereby indirectly affecting available P (Figure 5). Most previous studies on cereal legume intercrops found that legumes increased P acquisition via the nitrogen fixation process by releasing a large amount of H+, which activates insoluble P in the soil [61,62,63]; this results in the release of more insoluble P nutrients and accumulation in soil, ultimately increasing P availability [26], which promotes the conversion of species lacking P mobilization traits into those with P mobilization traits [64,65], increases P availability, and consequently reduces P fertilizer application [66]. Moreover, interspecific interactions and P application increased the efficacy of soil P. This is consistent with the results of previous studies [65,67]. Thus, agricultural management practices like intercropping and fertilization change the physical, chemical, and biological properties of the soil, which has a direct impact on system sustainability and crop performance [5,31]. However, the effects of M||P and P application on P availability are inconsistent and may be influenced by factors such as enzyme activity, microorganisms, water, and soil nutrients, which require further research.

4.3. Long-Term M||P and P Application Could Maintain Sustainable Farmland Productivity

A well-designed intercropping system can improve the farmland biodiversity and ecological environment [25,68], and is an important planting method for high-yield crop cultivation and sustainable agricultural development [66]. This study showed that long-term M||P and P application not only ensured the yield of IM (high crop), but also reduced the yield reduction margin of IP (low crop). Further, LER of M||P was higher than one, and M||P stubble improved the yield of subsequent winter wheat compared with SM stubble (Table 4). Intercropping may increase crop diversity, improve aboveground productivity and underground biomass, and increase litter inputs and soil C sequestration [68,69,70]. Long-term intercropping with leguminous crops may also produce N and C sources in the soil from their residues, which can benefit the subsequent growth of wheat and thus significantly increase crop yields [6]. Other intercropping studies found that the proportion of soil macroaggregates increased with an increase in the soil C pool, and the soil structure became more stable [14], thus improving the soil nutrient concentration and P utilization efficiency, and achieving high crop yield and efficiency [4,71,72]. A previous study found that soil macroaggregate formation increases soil fertility by improving water infiltration and nutrient cycling and by reducing soil erosion, which ultimately leads to increased yield [4,5]. The structural equation used in this study validated these findings (Figure 5).
Therefore, we concentrated on investigating the effect of intercropping on soil macroaggregates and found that intercropping significantly increased the proportion of macroaggregates and the stability of soil aggregates when compared to those of monocultures under the same fertilization conditions (Table 1, Figure 3). Soil nutrient availability increased significantly with an increase in large aggregates, contributing to an increase in productivity (Table 2). Thus, macroaggregates produced by intercropping may be a mechanism driving long-term increases in yield [5,11,73]. Here, we demonstrate that switching from conventional monocultures to intercropping and the application of phosphate fertilizer can improve soil structural stability, promote SOC sequestration and P sustainability, and ensure the optimum crop yield of current and future crops.

5. Conclusions

The present study revealed that 11 years of M||P shows the obvious advantages of intercropping and increases the yield of subsequent winter wheat with sustainable farmland productivity by increasing SOC and macroaggregate fractions, improving aggregate stability, promoting the conversion of non-directly available P sources to directly available P sources in the soil, and enhancing soil P availability. Moreover, P application augmented the concentration of SOC, TP, and AP in macroaggregates, resulting in improved crop yields. This was because M||P and P application increased SOC concentration in macroaggregates, raised the proportion and stability of mechanical and water-stable macroaggregates, and enhanced P availability. These results provide a theoretical basis for reasonable planting patterns and maintaining sustainable farmland productivity in North China Plain.

Supplementary Materials

The following supporting information can be downloaded at: https://www.mdpi.com/article/10.3390/agronomy13112846/s1, Table S1. Effects of planting pattern and phosphorus application on topsoil mechanical aggregate; Table S2. Effects of planting pattern and phosphorus application on topsoil water-stable aggregate; Table S3. Effects of planting pattern and phosphorus application on topsoil organic carbon concentration in aggregates; Table S4. Effects of planting pattern and phosphorus application on topsoil organic carbon contribution rate in aggregates.

Author Contributions

Conceptualization, N.J. and Z.Z.; methodology, N.J., T.N. and B.Z.; validation, N.J., J.W. and Y.W.; formal analysis, Z.Z. and B.Z.; investigation, N.J. and Z.Z.; resources, N.J.; data curation, Z.Z. and Y.W.; writing—original draft preparation, N.J. and Z.Z.; writing—review and editing, N.J., L.L., W.C. and X.Z.; visualization, R.M. and W.C.; supervision, N.J. and Y.W.; project administration, N.J.; funding acquisition, N.J. All authors have read and agreed to the published version of the manuscript.

Funding

This work was supported by the National Natural Science Foundation of China (U1404315 and 32272231), and the Natural Science Foundation of Henan Province (212300410342).

Data Availability Statement

The data presented in this study are available on request from the corresponding author. All data supporting the finding of this study are availability within the paper and within its Supporting Information published online.

Acknowledgments

This study is the result of a multi-actor collaboration. We would like to thank all the people who were directly or indirectly involved in this project.

Conflicts of Interest

The authors declare that they have no known competing financial interest or personal relationships that could have appeared to influence the work reported in this paper.

References

  1. Hunter, M.C.; Smith, R.G.; Schipanski, M.E.; Atwood, L.W.; Mortensen, D.A. Agriculture in 2050: Recalibrating targets for sustainable intensification. Bioscience 2017, 67, 386–391. [Google Scholar] [CrossRef]
  2. van Dijk, M.; Morley, T.; Rau, M.L.; Saghai, Y. A meta-analysis of projected global food demand and population at risk of hunger for the period 2010–2050. Nat. Food 2021, 2, 494–501. [Google Scholar] [CrossRef] [PubMed]
  3. Jang, W.S.; Neff, J.C.; Im, Y.; Doro, L.; Herrick, J.E. The hidden costs of land degradation in US maize agriculture. Earths Future 2021, 9, e2020EF001641. [Google Scholar] [CrossRef]
  4. Cappelli, S.L.; Domeignoz-Horta, L.A.; Loaiza, V.; Laine, A.L. Plant biodiversity promotes sustainable agriculture directly and via belowground effects. Trends Plant Sci. 2022, 27, 674–687. [Google Scholar] [CrossRef] [PubMed]
  5. Li, X.F.; Wang, Z.G.; Bao, X.G.; Sun, J.H.; Yang, S.C.; Wang, P.; Wang, C.B.; Wu, J.P.; Liu, X.R.; Tian, X.L.; et al. Long-term increased grain yield and soil fertility from intercropping. Nat. Sustain. 2021, 4, 943–950. [Google Scholar] [CrossRef]
  6. Chapagain, T.; Riseman, A. Nitrogen and carbon transformations, water use efficiency and ecosystem productivity in monocultures and wheat-bean intercropping systems. Nutr. Cycl. Agroecosys 2015, 101, 107–121. [Google Scholar] [CrossRef]
  7. Sun, X.Z.; Zhang, C.C.; Bei, S.K.; Wang, G.Z.; Geisen, S.; Bedoussac, L.; Christie, P.; Zhang, J.L. High bacterial diversity and siderophore-producing bacteria collectively suppress Fusarium oxysporum in maize/faba bean intercropping. Front. Microbiol. 2022, 13, 972587. [Google Scholar] [CrossRef]
  8. Li, L.; Zhang, F.S.; Li, X.L.; Christie, P.; Sun, J.H.; Yang, S.C.; Tang, C.X. Interspecific facilitation of nutrient uptake by intercropped maize and faba bean. Nutr. Cycl. Agroecosys 2003, 65, 61–71. [Google Scholar] [CrossRef]
  9. Li, H.G.; Zhang, F.S.; Rengel, Z.; Shen, J.B. Rhizosphere properties in monocropping and intercropping systems between faba bean (Vicia faba L.) and maize (Zea mays L.) grown in a calcareous soil. Crop Pasture Sci. 2013, 64, 976–984. [Google Scholar] [CrossRef]
  10. Chen, C.; Liu, W.; Wu, J.; Jiang, X.; Zhu, X. Can intercropping with the cash crop help improve the soil physico-chemical properties of rubber plantations? Geoderma 2019, 335, 149–160. [Google Scholar] [CrossRef]
  11. Lian, T.X.; Mu, Y.H.; Jin, J.; Ma, Q.B.; Cheng, Y.B.; Cai, Z.D.; Nian, H. Impact of intercropping on the coupling between soil microbial community structure, activity, and nutrient-use efficiencies. PeerJ 2019, 7, e6412. [Google Scholar] [CrossRef] [PubMed]
  12. Peng, Y.M.; Xu, H.S.; Wang, Z.; Li, L.; Shang, J.Y.; Li, B.G.; Wang, X. Effects of intercropping and drought on soil aggregation and associated organic carbon and nitrogen. Soil Use Manag. 2023, 39, 316–328. [Google Scholar] [CrossRef]
  13. Balesdent, J.; Chenu, C.; Balabane, M. Relationship of soil organic matter dynamics to physical protection and tillage. Soil. Tillage Res. 2000, 53, 215–230. [Google Scholar] [CrossRef]
  14. Garland, G.; Bunemann, E.K.; Oberson, A.; Frossard, E.; Six, J. Plant-mediated rhizospheric interactions in maize-pigeon pea intercropping enhance soil aggregation and organic phosphorus storage. Plant Soil 2017, 415, 37–55. [Google Scholar] [CrossRef]
  15. Chamkhi, I.; Cheto, S.; Geistlinger, J.; Zeroual, Y.; Kouisni, L.; Bargaz, A.; Ghoulam, C. Legume-based intercropping systems promote beneficial rhizobacterial community and crop yield under stressing conditions. Ind. Crop Prod. 2022, 183, 114958. [Google Scholar] [CrossRef]
  16. Tripathi, S.C.; Venkatesh, K.; Meena, R.P.; Chander, S.; Singh, G.P. Sustainable intensification of maize and wheat cropping system through pulse intercropping. Sci. Rep. 2021, 11, 18805. [Google Scholar] [CrossRef] [PubMed]
  17. Jiao, N.Y.; Ning, T.Y.; Yang, M.K.; Fu, G.Z.; Yin, F.; Xu, G.W.; Li, Z.J. Effects of maize||peanut intercropping on photosynthetic characters and yield forming of intercropped maize. Acta Ecol. Sin. 2013, 33, 4324–4330. [Google Scholar] [CrossRef]
  18. Jiao, N.Y.; Wang, J.T.; Ma, C.; Zhang, C.C.; Guo, D.Y.; Zhang, F.S.; Jensen, E.S. The importance of aboveground and belowground interspecific interactions in determining crop growth and advantages of peanut/maize intercropping. Crop J. 2021, 9, 1460–1469. [Google Scholar] [CrossRef]
  19. Jiao, N.Y.; Wang, F.; Ma, C.; Zhang, F.S.; Jensen, E.S. Interspecific interactions of iron and nitrogen use in peanut (Arachis hypogaea L.)-maize (Zea mays L.) intercropping on a calcareous soil. Eur. J. Agron. 2021, 128, 126303. [Google Scholar] [CrossRef]
  20. Jiao, N.Y.; Ning, T.Y.; Zhao, C.; Wang, Y.; Shi, Z.Q.; Hou, L.T.; Fu, G.Z.; Jiang, X.D.; Li, Z.J. Characters of photosynthesis in intercropping system of maize and peanut. Acta Agron. Sin. 2006, 17, 2332–2336. [Google Scholar] [CrossRef]
  21. Feng, C.; Sun, Z.X.; Zhang, L.Z.; Zheng, J.M.; Bai, W.; Gu, C.F.; Wang, Q.; Xu, Z.; van der Werf, W. Maize/peanut intercropping increases land productivity: A meta-analysis. Field Crops Res. 2021, 270, 108208. [Google Scholar] [CrossRef]
  22. Blankinship, J.C.; Fonte, S.J.; Six, J.; Schimela, J.P. Plant versus microbial controls on soil aggregate stability in a seasonally dry ecosystem. Geoderma 2016, 272, 39–50. [Google Scholar] [CrossRef]
  23. Benbi, D.K.; Singh, P.; Toor, A.S.; Gayatri, V. Manure and fertilizer application effects on aggregate and mineral-associated organic carbon in a loamy soil under rice-wheat system. Commun. Soil Sci. Plant Anal. 2016, 47, 1828–1844. [Google Scholar] [CrossRef]
  24. Chaplot, V.; Cooper, M. Soil aggregate stability to predict organic carbon outputs from soils. Geoderma 2014, 243, 205–213. [Google Scholar] [CrossRef]
  25. Tian, X.L.; Wang, C.B.; Bao, X.G.; Wang, P.; Li, X.F.; Yang, S.C.; Ding, G.C.; Christie, P.; Li, L. Crop diversity facilitates soil aggregation in relation to soil microbial community composition driven by intercropping. Plant Soil 2019, 436, 173–192. [Google Scholar] [CrossRef]
  26. Liao, D.; Zhang, C.; Li, H.; Lambers, H.; Zhang, F. Changes in soil phosphorus fractions following sole cropped and intercropped maize and faba bean grown on calcareous soil. Plant Soil 2020, 448, 587–601. [Google Scholar] [CrossRef]
  27. Yang, Z.; Zhang, Y.; Wang, Y.; Zhang, H.; Zhu, Q.; Yan, B.; Luo, G. Intercropping regulation of soil phosphorus composition and microbially-driven dynamics facilitates maize phosphorus uptake and productivity improvement. Field Crop Res. 2022, 287, 108666. [Google Scholar] [CrossRef]
  28. Marcos-Pérez, M.; Sánchez-Navarro, V.; Zornoza, R. Intercropping fava bean with broccoli can improve soil properties while maintaining crop production under Mediterranean conditions. In Proceedings of the EGU General Assembly 2020, Online, 4–8 May 2020; p. 11058. [Google Scholar] [CrossRef]
  29. Zhang, Y.; Shengzhe, E.; Wang, Y.N.; Su, S.M.; Bai, L.Y.; Wu, C.X.; Zeng, X.B. Long-term manure application enhances the stability of aggregates and aggregate-associated carbon by regulating soil physicochemical characteristics. Catena 2021, 203, 105342. [Google Scholar] [CrossRef]
  30. Roohi, M.; Arif, M.S.; Guillaume, T.; Yasmeen, T.; Riaz, M.; Shakoor, A.; Farooq, T.H.; Shahzad, S.M.; Bragazza, L. Role of fertilization regime on soil carbon sequestration and crop yield in a maize-cowpea intercropping system on low fertility soils. Geoderma 2022, 428, 116152. [Google Scholar] [CrossRef]
  31. Zheng, B.C.; Chen, P.; Du, Q.; Yang, H.; Luo, K.; Wang, X.C.; Yang, F.; Yong, T.W.; Yang, W.Y. Soil organic matter, aggregates, and microbial characteristics of intercropping soybean under straw incorporation and N input. Agriculture 2022, 12, 1409. [Google Scholar] [CrossRef]
  32. Chai, Y.J.; Zeng, X.B.; Sheng-zhe, E.; Huang, T.; Che, Z.X.; Su, S.M.; Bai, L.Y. Response of soil organic carbon and its aggregate fractions to long term fertilization in irrigated desert soil of China. J. Integr. Agr. 2014, 13, 2758–2767. [Google Scholar] [CrossRef]
  33. Grunwald, D.; Kaiser, M.; Ludwig, B. Effect of biochar and organic fertilizers on C mineralization and macro-aggregate dynamics under different incubation temperatures. Soil Tillage Res. 2016, 164, 11–17. [Google Scholar] [CrossRef]
  34. Liu, X.R. Effects of Intercropping and P Fertilization on Crop Yields and Soil Fertility in Orthic Antrosols. Master’s Dissertation, Shihezi University, Shihezi, China, 2016. [Google Scholar] [CrossRef]
  35. Yang, H.G.; Sun, W.; Wu, F.; Xu, H.B.; Gu, F.W.; Hu, Z.C. Determination of planting pattern and screening of agricultural machineries for maize-peanut strip intercropping: A Case Study in Henan Province of China. Sustainability 2023, 15, 8289. [Google Scholar] [CrossRef]
  36. Bao, S.D. Soil and Agriculture Chemistry Analysis, 3rd ed.; China Agriculture Press: Beijing, China, 2015. [Google Scholar]
  37. Soinne, H.; Hovi, J.; Tammeorg, P.; Turtola, E. Effect of biochar on phosphorus sorption and clay soil aggregate stability. Geoderma 2014, 219, 162–167. [Google Scholar] [CrossRef]
  38. Bai, Y.X.; Zhou, Y.C.; He, H.Z. Effects of rehabilitation through afforestation on soil aggregate stability and aggregate-associated carbon after forest fires in subtropical China. Geoderma 2020, 376, 114548. [Google Scholar] [CrossRef]
  39. Dou, Y.X.; Yang, Y.; An, S.S.; Zhu, Z.L. Effects of different vegetation restoration measures on soil aggregate stability and erodibility on the Loess Plateau, China. Catena 2020, 185, 104294. [Google Scholar] [CrossRef]
  40. Zuo, F.L.; Li, X.Y.; Yang, X.F.; Wang, Y.; Ma, Y.J.; Huang, Y.H.; Wei, C.F. Soil particle-size distribution and aggregate stability of new reconstructed purple soil affected by soil erosion in overland flow. J. Soils Sediments 2020, 20, 272–283. [Google Scholar] [CrossRef]
  41. Mead, R.; Willey, R. The concept of a ‘land equivalent ratio’ and advantages in yields from intercropping. Exp. Agric. 1980, 16, 217–228. [Google Scholar] [CrossRef]
  42. Liu, K.; Xu, Y.; Feng, W.; Zhang, X.; Yao, S.; Zhang, B. Modeling the dynamics of protected and primed organic carbon in soil and aggregates under constant soil moisture following litter incorporation. Soil Biol. Biochem. 2020, 151, 108039. [Google Scholar] [CrossRef]
  43. Cong, W.F.; Hoffland, E.; Li, L.; Six, J.; Sun, J.H.; Bao, X.G.; Zhang, F.S.; Van Der Werf, W. Intercropping enhances soil carbon and nitrogen. Global Chang. Biol. 2014, 21, 1715–1726. [Google Scholar] [CrossRef]
  44. Hu, L.N.; Huang, R.; Deng, H.; Li, K.; Peng, J.Y.; Zhou, L.Q.; Ou, H.P. Effects of different intercropping methods on soil organic carbon and aggregate stability in sugarcane field. Pol. J. Environ. Stud. 2022, 31, 3587–3596. [Google Scholar] [CrossRef]
  45. Bronick, C.J.; Lal, R. Soil structure and management: A review. Geoderma. 2005, 124, 3–22. [Google Scholar] [CrossRef]
  46. Tisdall, J.M.; Oades, J.M. Organic matter and water-stable aggregates in soils. Eur. J. Soil Sci. 1982, 33, 141–163. [Google Scholar] [CrossRef]
  47. Zhou, Q.; Wang, L.C.; Xing, Y.; Ma, S.M.; Zhang, X.D.; Chen, J.; Shi, C. Effects of Chinese milk vetch intercropped with rape under straw mulching on soil aggregate and organic carbon character. J. Appl. Ecol. 2019, 30, 1235–1242. [Google Scholar] [CrossRef]
  48. Dijkstra, F.A.; Hobbie, S.E.; Reich, P.B.; Knops, J.M. Divergent effects of elevated CO2, N fertilization, and plant diversity on soil C and N dynamics in a grassland field experiment. Plant Soil 2005, 272, 41–52. [Google Scholar] [CrossRef]
  49. Jin, V.L.; Wienhold, B.J.; Mikha, M.M.; Schmer, M.R. Cropping system partially offsets tillage-related degradation of soil organic carbon and aggregate properties in a 30-yr rainfed agroecosystem. Soil Tillage Res. 2021, 209, 104968. [Google Scholar] [CrossRef]
  50. Wan, W.; Li, X.; Han, S.; Wang, L.; Luo, X.; Chen, W.; Huang, Q. Soil aggregate fractionation and phosphorus fraction driven by long-term fertilization regimes affect the abundance and composition of P-cycling-related bacteria. Soil Tillage Res. 2020, 196, 104475. [Google Scholar] [CrossRef]
  51. Prakash, D.; Benbi, D.K.; Saroa, G.S. Effect of rate and source of phosphorus application on soil organic carbon pools under rice (Oryza sativa)-wheat (Triticum aestivum) cropping system. Indian J. Agric. Sci. 2016, 86, 1127–1132. Available online: https://www.researchgate.net/publication/308581768 (accessed on 21 January 2023). [CrossRef]
  52. Bansal, S.; Yin, X.; Savoy, H.J.; Jagadamma, S.; Lee, J.; Sykes, V. Long-term influence of phosphorus fertilization on organic carbon and nitrogen in soil aggregates under no-till corn-wheat-soybean rotations. Agron. J. 2020, 112, 2519–2534. [Google Scholar] [CrossRef]
  53. Mahmoud, E.; Ibrahim, M.; Abd El-Rahman, L.; Khader, A. Effects of biochar and phosphorus fertilizers on phosphorus fractions, wheat yield and microbial biomass carbon in Vertic Torrifluvents. Commun. Soil Sci. Plan. 2019, 50, 362–372. [Google Scholar] [CrossRef]
  54. Soudzilovskaia, N.A.; van der Heijden, M.G.A.; Cornelissen, J.H.C.; Makarov, M.I.; Onipchenko, V.G.; Maslov, M.N.; Akhmetzhanova, A.A.; Bodegom, P.M. Quantitative assessment of the differential impacts of arbuscular and ectomycorrhiza on soil carbon cycling. New Phytol. 2015, 208, 280–293. [Google Scholar] [CrossRef] [PubMed]
  55. Zhao, H.; Sun, B.F.; Lu, F.; Wang, X.K.; Zhuang, T.; Zhang, G.; Ouyang, Z.Y. Roles of nitrogen, phosphorus, and potassium fertilizers in carbon sequestration in a Chinese agricultural ecosystem. Clim. Chang. 2017, 142, 587–596. [Google Scholar] [CrossRef]
  56. Ludewig, U.; Yuan, L.X.; Neumann, G. Improving the efficiency and effectiveness of global phosphorus use: Focus on root and rhizosphere levels in the agronomic system. Front. Agric. Sci. Eng. 2019, 6, 357–365. [Google Scholar] [CrossRef]
  57. Chen, X.; Chen, H.Y.; Chang, S.X. Meta-analysis shows that plant mixtures increase soil phosphorus availability and plant productivity in diverse ecosystems. Nat. Ecol. Evol. 2022, 6, 1112–1121. [Google Scholar] [CrossRef]
  58. Tian, J.; Tang, M.; Xu, X.; Luo, S.; Condron, L.M.; Lambers, H.; Wang, J. Soybean (Glycine max (L.) Merrill) intercropping with reduced nitrogen input influences rhizosphere phosphorus dynamics and phosphorus acquisition of sugarcane (Saccharum officinarum). Biol. Fert. Soils 2020, 56, 1063–1075. [Google Scholar] [CrossRef]
  59. Cui, H.; Ou, Y.; Wang, L.X.; Wu, H.T.; Yan, B.X.; Li, Y.X. Distribution and release of phosphorus fractions associated with soil aggregate structure in restored wetlands. Chemosphere 2019, 223, 319–329. [Google Scholar] [CrossRef]
  60. Fonte, S.J.; Nesper, M.; Hegglin, D.; Velásquez, J.E.; Ramirez, B.; Rao, I.M.; Bernasconi, S.M.; Bünemann, E.K.; Frossard, E.; Oberson, A. Pasture degradation impacts soil phosphorus storage via changes to aggregate-associated soil organic matter in highly weathered tropical soils. Soil Biol. Biochem. 2014, 68, 150–157. [Google Scholar] [CrossRef]
  61. Latati, M.; Blavet, D.; Alkama, N.; Laoufi, H.; Drevon, J.J.; Gerard, F.; Ounane, S.M. The intercropping cowpea-maize improves soil phosphorus availability and maize yields in an alkaline soil. Plant Soil 2014, 385, 181–191. [Google Scholar] [CrossRef]
  62. Latati, M.; Bargaz, A.; Belarbi, B.; Lazali, M.; Benlahrech, S.; Tellah, S.; Kaci, G.; Drevon, J.J.; Ounane, S.M. The intercropping common bean with maize improves the rhizobial efficiency, resource use and grain yield under low phosphorus availability. Eur. J. Agron. 2016, 72, 80–90. [Google Scholar] [CrossRef]
  63. Li, L.; Li, S.M.; Sun, J.H.; Zhou, L.L.; Bao, X.G.; Zhang, H.G.; Zhang, F.S. Diversity enhance agricultural productivity via rhizophere phosphorus facilitation on phosphorus-deficient soils. Proc. Natl. Acad. Sci. USA 2007, 104, 11192–11196. [Google Scholar] [CrossRef]
  64. Li, L.; Tilman, D.; Lambers, H.; Zhang, F.S. Plant diversity and overyielding: Insights from belowground facilitation of intercropping in agriculture. New Phytol. 2014, 203, 63–69. [Google Scholar] [CrossRef] [PubMed]
  65. Tang, X.Y.; Placella, S.A.; Daydé, F.; Bernard, L.; Robin, A.; Journet, E.P.; Justes, E.; Hinsinger, P. Phosphorus availability and microbial community in the rhizosphere of intercropped cereal and legume along a P-fertilizer gradient. Plant Soil 2016, 407, 119–134. [Google Scholar] [CrossRef]
  66. An, R.; Yu, R.P.; Xing, Y.; Zhang, J.D.; Bao, X.G.; Lambers, H.; Li, L. Enhanced phosphorus-fertilizer-use efficiency and sustainable phosphorus management with intercropping. Agron. Sustain. Dev. 2023, 43, 57. [Google Scholar] [CrossRef]
  67. Wang, X.C.; Deng, X.Y.; Pu, T.; Song, C.; Yong, T.W.; Yang, F.; Sun, X.; Liu, W.G.; Yan, Y.H.; Du, J.B.; et al. Contribution of interspecific interactions and phosphorus application to increasing soil phosphorus availability in relay intercropping systems. Field Crop. Res. 2017, 204, 12–22. [Google Scholar] [CrossRef]
  68. Jensen, E.S.; Chongtham, I.R.; Dhamala, N.R.; Rodriguez, C.; Carton, N.; Carlsson, G. Diversifying European agricultural systems by intercropping grain legumes and cereals. Int. J. Agric. Nat. Res. 2020, 47, 174–186. [Google Scholar] [CrossRef]
  69. Jat, H.S.; Datta, A.; Choudhary, M.; Yadav, A.K.; Choudhary, V.; Sharma, P.C.; Gathala, M.K.; Jat, M.L.; McDonald, A. Effects of tillage, crop establishment and diversification on soil organic carbon, aggregation, aggregate associated carbon and productivity in cereal systems of semi-arid Northwest India. Soil Tillage Res. 2019, 190, 128–138. [Google Scholar] [CrossRef]
  70. Qin, A.Z.; Gan, Y.T.; Yu, A.Z. Higher yield and lower carbon emission by intercropping maize with rape, pea, and wheat in arid irrigation areas. Agron. Sustain. Dev. 2013, 34, 535–543. [Google Scholar] [CrossRef]
  71. Li, B.; Liu, J.; Shi, X.X.; Han, X.; Chen, X.Y.; Wei, Y.F.; Xiong, F. Effects of belowground interactions on crop yields and nutrient uptake in maize-faba bean relay intercropping systems. Arch. Agron. Soil Sci. 2023, 69, 314–325. [Google Scholar] [CrossRef]
  72. Tang, X.Y.; Bernard, L.; Brauman, A.; Daufresne, T.; Deleporte, P.; Desclaux, D.; Souche, G.; Placella, S.A.; Hinsinger, P. Increase in microbial biomass and phosphorus availability in the rhizosphere of intercropped cereal and legumes under field conditions. Soil Biol. Biochem. 2014, 75, 86–93. [Google Scholar] [CrossRef]
  73. Tiemann, L.K.; Grandy, A.S.; Atkinson, E.E.; Marin-Spiotta, E.; McDaniel, M.D. Crop rotational diversity enhances belowground communities and functions in an agroecosystem. Ecol. Lett. 2015, 18, 761–771. [Google Scholar] [CrossRef]
Figure 1. Hypotheses for key factors and mechanisms of maintaining farmland productivity in maize and peanut intercropping system. SOC: soil organic carbon; TN: total nitrogen; TP: total phosphorus; AP: available phosphorus; Ca2-P; Ca8-P; Al-P; Fe-P; O-P; and Ca10-P are forms of soil inorganic P.
Agronomy 13 02846 g001
Figure 2. Planting pattern diagram. (a) Two rows of maize intercropping with four rows of peanut; intercropping maize was planted in wide-narrow rows with respective row spacing of 1.6 m and 0.4 m, and plant spacing within the row was 0.2 m. Intercropping peanut was planted in wide rows with row spacing of 0.3 m, and plant spacing within the row was 0.2 m. (b) Sole peanut row spacing was 0.3 m and plant spacing within the row was 0.2 m. (c) Sole maize row spacing was 0.6 m and plant spacing within the row was 0.25 m.
Agronomy 13 02846 g002
Figure 3. Effects of long-term maize intercropping with peanut and phosphorus application on mechanical aggregate size distribution (A) and water-stable aggregate size distribution (B) in topsoil. P0SP: sole-crop peanut under 0 kg P2O5·ha−1; P0IP: intercropped peanut under 0 kg P2O5·ha−1; P180SP: sole-crop peanut under 180 kg P2O5·ha−1; P180IP: intercropped peanut under 180 kg P2O5·ha−1; P0SM: sole-crop maize under 0 kg P2O5·ha−1; P0IM: intercropped maize under 0 kg P2O5·ha−1; P180SM: sole-crop maize under 180 kg P2O5·ha−1; P180IM: intercropped maize under 180 kg P2O5·ha−1. Different letters indicate significant differences within the same size fraction among different treatments after Tukey’s honestly significant difference (HSD) test (p < 0.05). The bars represent the average of three data points. Error bars show the standard errors.
Agronomy 13 02846 g003
Figure 4. Effects of long-term maize intercropping with peanut and phosphorus application on soil organic carbon concentration (A) and soil organic carbon contribution (B). P0SM: sole-crop maize under 0 kg P2O5·ha−1; P0IM: intercropped maize under 0 kg P2O5·ha−1; P180SM: sole-crop maize under 180 kg P2O5·ha−1; P180IM: intercropped maize under 180 kg P2O5·ha−1; P0SP: sole-crop peanut under 0 kg P2O5·ha−1; P0IP: intercropped peanut under 0 kg P2O5·ha−1; P180SP: sole-crop peanut under 180 kg P2O5·ha−1; P180IP: intercropped peanut under 180 kg P2O5·ha−1. Different letters indicate significant differences within the same size fraction among different treatments after Tukey’s honestly significant difference (HSD) test (p < 0.05). The bars represent the average of three data points. Error bars show the standard errors.
Agronomy 13 02846 g004
Figure 5. Path diagram for the relationships between crop productivity and soil physical-chemical properties under long-term maize intercropping with peanut and phosphorus application. The numbers adjacent to the arrows are the standardized path coefficients, analogous to partial regression weights and indicative of the effect size of the relationship. The red and blue lines represent positive and negative pathways, respectively. The solid and dotted lines represent significant and insignificant effects, respectively. The thickness of each line is proportional to the absolute values of the standardized path coefficients. * Significant at p < 0.05. ** Significant at p < 0.01. *** Significant at p < 0.001. The number above each box is the squared multiple correlations, and the numbers on the lines among these parameters are the standardized regression weights. Model fitness details (χ2, χ2/df, RMSEA, P) are shown in the figure.
Agronomy 13 02846 g005
Table 1. Effects of long-term maize intercropping with peanut and phosphorus application on stability indices of topsoil aggregates.
PPlantingDR0.25
(%)
WR0.25
(%)
ELTPADMWD (mm)GMD (mm)
LevelPattern
P0SM92.0 ± 0.2 c69.9 ± 0.4 c43.1 ± 0.5 b24.0 ± 0.6 b0.50 ± 0.02 c0.87 ± 0.01 b
IM96.6 ± 0.2 a73.9 ± 0.7 b35.9 ± 0.5 c23.4 ± 0.5 b0.58 ± 0.02 b0.95 ± 0.01 a
SP92.4 ± 0.1 c66.7 ± 1.5 d46.6 ± 1.2 a27.8 ± 1.7 a0.51 ± 0.03 c0.93 ± 0.01 a
IP95.1 ± 0.3 b78.0 ± 0.7 a31.6 ± 0.6 d17.9 ± 0.7 c0.62 ± 0.02 a0.96 ± 0.00 a
P180SM90.3 ± 0.1 d78.7 ± 0.6 b38.4 ± 1.1 a12.9 ± 0.6 b0.55 ± 0.00 d0.90 ± 0.00 d
IM93.0 ± 0.1 c81.6 ± 0.7 a31.9 ± 0.6 b12.2 ± 0.6 b0.64 ± 0.01 b0.98 ± 0.01 b
SP94.0 ± 0.2 b75.6 ± 0.6 c38.3 ± 0.3 a19.6 ± 0.7 a0.59 ± 0.00 c0.96 ± 0.00 c
IP96.1 ± 0.3 a82.9 ± 0.3 a25.2 ± 0.5 c13.7 ± 0.4 b0.69 ± 0.00 a1.00 ± 0.00 a
P level*********nsns***
Planting pattern******************
P level × Planting pattern***ns****nsns
SM: sole-crop maize; IM: intercropped maize; SP: sole-crop peanut; IP: intercropped peanut. P0: 0 kg P2O5·ha−1; P180:180 kg P2O5·ha−1. DR0.25: proportion of > 0.25 mm mechanical aggregate; WR0.25: proportion of >0.25 mm water-stable aggregate; ELT: unstable aggregate index; PAD: percentage of aggregation destruction; MWD: mean weight diameter; GMD: geometric mean diameter. Different letters in the same column indicate significant differences among treatments at the same P level by Tukey’s honest significant difference test (p < 0.05). * Significant at p < 0.05. *** Significant at p < 0.001. ns: not significant. Data are presented as mean ± standard error.
Table 2. Effects of long-term maize intercropping peanut and phosphorus application on concentrations of total phosphorus and available phosphorus in topsoil aggregates (mg·kg−1).
P LevelPlanting Pattern>2 mm2–1 mm1–0.5 mm0.5–0.25 mm<0.25 mm
TPAPTPAPTPAPTPAPTPAP
P0SM696.4 ± 12.4 b8.5 ± 0.2 c704.8 ± 3.7 b9.7 ± 0.2 d709.0 ± 1.6 b9.5 ± 0.6 b725.1 ± 7.6 b9.2 ± 0.4 bc781.3 ± 10.4 b10.0 ± 0.7 b
IM781.7 ± 1.6 a9.7 ± 0.1 b741.0 ± 4.1 a17.5 ± 0.4 a777.2 ± 10.5 a11.6 ± 0.7 a779.6 ± 6.8 a12.1 ± 1.0 a801.2 ± 151 a12.9 ± 1.4 ab
SP739.6 ± 7.7 ab10.1 ± 0.6 b705.5 ± 11.2 b13.3 ± 0.3 c719.8 ± 6.0 b12.5 ± 0.6 a773.5 ± 4.8 a8.7 ± 0.2 c757.9 ± 15.8 b9.9 ± 0.6 b
IP835.3 ± 51.5 a12.6 ± 0.2 a759.4 ± 1.6 a16.4 ± 0.2 b760.5 ± 0.2 a12.9 ± 0.5 a769.3 ± 7.0 a11.4 ± 0.8 a b754.1 ± 4.2 b14.5 ± 1.1 a
P180SM1010.5 ± 8.9 b60.0 ± 2.2 b976.2 ± 11.5 b31.9 ± 1.3 c942.7 ± 45.8 b26.9 ± 3.4 c1096.6 ± 23.2 b31.1 ± 3.0 b1289.4 ± 3.9 a15.9 ± 0.6 c
IM1072.0 ± 3.5 a74.7 ± 4.2 a1097.6 ± 25.9 a50.7 ± 2.6 a1113.0 ± 8.2 a48.9 ± 0.7 a1164.4 ± 10.7 ab48.7 ± 0.8 a1253.4 ± 26.6 a26.2 ± 0.7 b
SP1007.7 ± 17.7 b34.2 ± 2.5 c997.8 ± 3.7 b33.4 ± 1.4 bc1097.6 ± 38.6 a34.6 ± 1.8 b1113.1 ± 19.6 ab23.2 ± 1.0 c1273.8 ± 6.4 a17.4 ± 1.0 c
IP1106.3 ± 34.5 a55.4 ± 3.9 b1074.9 ± 7.9 a38.1 ± 0.9 b1043.4 ± 4.9 a42.4 ± 0.8 a1173.4 ± 14.7 a29.2 ± 2.3 bc1280.7 ± 49.2 a31.7 ± 0.2 a
P level******************************
Planting pattern******************************
P level × Planting patternns***************ns***ns***
SM: sole-crop maize; IM: intercropped maize; SP: sole-crop peanut; IP: intercropped peanut. P0: 0 kg P2O5·ha−1; P180:180 kg P2O5·ha−1. TP: total phosphorus; AP: available phosphorus. Different letters in the same column indicate significant differences among treatments at the same P level by Tukey’s honest significant difference test (p < 0.05). *** Significant at p < 0.001. ns: not significant. Data are presented as mean ± standard error.
Table 3. Effects of long-term maize intercropping peanut and phosphorus application on total organic carbon and nutrients in the topsoil.
P
Level
Planting PatternSOCTNTPAPCa2-PCa8-PAl-PFe-PO-PCa10-PpH
(g·kg−1)(g·kg−1)(g·kg−1)(mg·kg−1)(mg·kg−1)(mg·kg−1)(mg·kg−1)(mg·kg−1)(mg·kg−1)(mg·kg−1)
P0SM13.3 ± 0.2 b1.18 ± 0.02 a0.73 ± 0.00 b c9.1 ± 0.1 d2.0 ± 0.1 c119.2 ± 0.7 c20.7 ± 0.1 c72.1 ± 0.5 b4.53 ± 0.06 a200.6 ± 2.5 a7.34 ± 0.03 a
IM16.5 ± 0.4 a1.18 ± 0.03 a0.79 ± 0.02 a12.5 ± 0.3 b2.3 ± 0.0 b131.6 ± 2.5 b24.7 ± 0.1 a75.9 ± 0.7 a4.22 ± 0.05 b190.1 ± 0.8 b7.30 ± 0.00 a
SP11.9 ± 0.1 c1.24 ± 0.00 a0.71 ± 0.01 c11.2 ± 0.2 c2.7 ± 0.1 a135.7 ± 1.0 b23.7 ± 0.1 b75.8 ± 0.2 a4.12 ± 0.07 b175.4 ± 1.8 c7.33 ± 0.02 a
IP12.8 ± 0.0 b1.20 ± 0.00 a0.77 ± 0.01 b13.7 ± 0.1 a2.0 ± 0.0 c164.9 ± 4.7 a18.8 ± 0.0 d72.1 ± 0.0 b4.23 ± 0.03 b186.7 ± 0.5 b7.15 ± 0.04 b
P180SM13.4 ± 0.3 b1.38 ± 0.01 a b1.07 ± 0.02 b28.3 ± 1.0 c12.3 ± 0.5 b274.4 ± 4.0 b63.3 ± 0.4 b97.3 ± 0.4 b4.96 ± 0.11 a159.2 ± 2.7 c7.41 ± 0.05 a
IM17.8 ± 0.9 a1.40 ± 0.02 a1.11 ± 0.01 a42.7 ± 0.3 a15.8 ± 0.6 a320.8 ± 3.3 a66.7 ± 0.7 a105.9 ± 0.7 a4.61 ± 0.07 b179.8 ± 0.8 b c7.43 ± 0.06 a
SP12.5 ± 0.1 b1.34 ± 0.01 b c1.01 ± 0.01 b24.9 ± 0.7 d12.6 ± 1.0 b277.2 ± 3.2 b65.5 ± 0.5 a90.7 ± 0.3 c4.23 ± 0.09 c183.0 ± 5.0 b7.37 ± 0.05 a
IP19.0 ± 0.3 a1.30 ± 0.00 c1.10 ± 0.01 a34.3 ± 0.7 b9.2 ± 0.2 c245.8 ± 5.0 c56.1 ± 0.2 c97.0 ± 0.3 b4.60 ± 0.03 b196.4 ± 0.6 a7.29 ± 0.05 a
P level********************************
Planting pattern*******************************
P level × Planting patternns*********************ns***
SM: sole-crop maize; IM: intercropped maize; SP: sole-crop peanut; IP: intercropped peanut. P0: 0 kg P2O5·ha−1, P180:180 kg P2O·ha−1. SOC: soil organic carbon; TN: total nitrogen; TP: total phosphorus; AP: available phosphorus; Ca2-P; Ca8-P; Al-P; Fe-P; O-P; and Ca10-P are forms of soil inorganic phosphorus. Different letters in the same column indicate significant differences among treatments at the same P level by Tukey’s honest significant difference test (p < 0.05). * Significant at p < 0.05. ** Significant at p < 0.01. *** Significant at p < 0.001. ns: not significant. Data are presented as mean ± standard error.
Table 4. Crop yield and land equivalent ratio under different planting patterns during 2018–2022.
YearP LevelMaize Yield (t·ha−1)Peanut Yield (t·ha−1)LERWheat Yield (t·ha−1)Annual Yield (t·ha−1)
SMIMSPIPSM StubbleSP StubbleM||P StubbleSM-WSP-WM||P-W
2018P05.25 ± 0.05 a5.03 ± 0.10 a3.08 ± 0.22 b1.02 ± 0.02 c1.292.17 ± 0.32 b3.33 ± 0.45 a3.40 ± 0.15 a7.42 ± 0.29 b6.42 ± 0.23 c9.44 ± 0.12 a
P1807.44 ± 0.46 a6.22 ± 0.13 b4.00 ± 0.13 c1.18 ± 0.07 d1.145.07 ± 0.41 b6.03 ± 0.18 a7.00 ± 0.18 a12.51 ± 0.87 b10.03 ± 0.22 c14.37 ± 0.15 a
2019P05.63 ± 0.14 a5.32 ± 0.10 b2.44 ± 0.01 c0.82 ± 0.01 d1.282.32 ± 0.12 b2.91 ± 0.02 a2.63 ± 0.02 a7.95 ± 0.12 b5.36 ± 0.11 c8.76 ± 0.21 a
P1809.62 ± 0.42 a8.02 ± 0.27 b3.79 ± 0.02 c1.15 ± 0.02 d1.149.66 ± 0.07 c10.26 ± 0.03 b10.76 ± 0.12 a18.87 ± 0.07 b14.05 ± 0.05 c19.93 ± 0.35 a
2020P06.36 ± 0.09 a5.83 ± 0.04 b2.37 ± 0.03 c0.90 ± 0.01 d1.32.67 ± 0.13 b3.45 ± 0.05 a3.39 ± 0.03 a9.03 ± 0.18 b5.81 ± 0.07 b10.12 ± 0.07 a
P1809.63 ± 0.23 a9.10 ± 0.38 a3.52 ± 0.04 b1.00 ± 0.01 c1.239.43 ± 0.05 c10.11 ± 0.09 b10.62 ± 0.06 a19.06 ± 0.25 b13.63 ± 0.07 c20.72 ± 0.38 a
2021P05.24 ± 0.13 a5.20 ± 0.08 a3.17 ± 0.08 b0.98 ± 0.01 c1.31.29 ± 0.11 a1.25 ± 0.07 a1.54 ± 0.18 a6.53 ± 0.24 b4.42 ± 0.01 c7.72 ± 0.22 a
P1807.43 ± 0.10 a6.87 ± 0.23 b4.13 ± 0.05 c1.36 ± 0.06 d1.256.63 ± 0.44 a6.96 ± 0.08 a8.50 ± 0.01 a14.06 ± 0.52 b11.09 ± 0.03 c16.73 ± 0.21 a
2022P04.28 ± 0.04 a4.09 ± 0.13 a4.35 ± 0.09 a2.17 ± 0.08 b1.462.26 ± 0.13 b2.91 ± 0.07 a3.00 ± 0.16 a6.54 ± 0.16 c7.27 ± 0.02 b9.26 ± 0.10 a
P1807.39 ± 0.21 a6.51 ± 0.08 b5.23 ± 0.06 c2.47 ± 0.05 d1.359.06 ± 0.47 b7.95 ± 0.52 b10.54 ± 0.24 a17.12 ± 0.28 b13.17 ± 0.47 b19.52 ± 0.27 a
MeanP05.35 ± 0.02 a5.09 ± 0.02 b3.08 ± 0.05 c1.18 ± 0.02 d1.332.14 ± 0.10 b2.77 ± 0.08 a2.78 ± 0.05 a7.60 ± 7.49 b5.88 ± 5.86 c9.00 ± 9.05 a
P1808.22 ± 0.11 a7.33 ± 0.07 b4.13 ± 0.02 c1.43 ± 0.02 d1.227.97 ± 0.13 b8.26 ± 0.16 b9.48 ± 0.03 a16.19 ± 0.02 b12.39 ± 0.14 c18.24 ± 0.08 a
P level*** ******
Year*** ******
Planting pattern*** ******
P level × Year*** ******
P level × Planting pattern*** *****
Year × Planting pattern*** ****
P level × Year × Planting pattern*** ns*
SM: sole-crop maize; IM: intercropping maize; SP: sole-crop peanut; IP: intercropping peanut; M||P: maize intercropping with peanut; SP stubble: wheat was planted after harvest of SP; SM stubble: wheat was planted after harvest of SM; M||P stubble: wheat was planted after harvest of M||P; SP-W: a multiple cropping system in which SP was harvested and then wheat was planted in a year; SM-W: a multiple cropping system in which SM was harvested and then wheat was planted in a year; M||P-W: a multiple cropping system in which M||P was harvested and then wheat was planted in a year. P0: 0 kg P2O5·ha−1, P180:180 kg P2O5·ha−1. Different letters in the same column indicate significant differences among treatments at the same P level by Tukey’s honest significant difference test (p < 0.05). * Significant at p < 0.05. ** Significant at p < 0.01. *** Significant at p < 0.001. ns: not significant. Data are presented as mean ± standard error.
Disclaimer/Publisher’s Note: The statements, opinions and data contained in all publications are solely those of the individual author(s) and contributor(s) and not of MDPI and/or the editor(s). MDPI and/or the editor(s) disclaim responsibility for any injury to people or property resulting from any ideas, methods, instructions or products referred to in the content.

