Article

Shading Level and Harvest Time Affect the Photosynthetic and Physiological Properties of Basil Varieties

by
Paria Eskandarzade
1,
Mahboobeh Zare Mehrjerdi
1,
Fardad Didaran
1,
Nazim S. Gruda
2,* and
Sasan Aliniaeifard
1,3,*
1
Department of Horticulture, Aburaihan Campus, University of Tehran, Tehran 33916-53755, Iran
2
Department of Horticultural Science, INRES-Institute of Crop Science and Resource Conservation, University of Bonn, 53121 Bonn, Germany
3
Controlled Environment Agriculture Center, College of Agriculture and Natural Resources, University of Tehran, Tehran 33916-53755, Iran
*
Authors to whom correspondence should be addressed.
Agronomy 2023, 13(10), 2478; https://doi.org/10.3390/agronomy13102478
Submission received: 15 August 2023 / Revised: 12 September 2023 / Accepted: 18 September 2023 / Published: 26 September 2023
(This article belongs to the Topic Biophysics of Photosynthesis: From Molecules to the Field)

Abstract

:
Basil (Ocimum basilicum L.) is one of the most important medicinal and aromatic plants. Light intensity is an indispensable factor for plants due to its effect on photosynthesis and physiological processes. Here, we investigated the impact of light intensities and harvesting times on the photosynthesis of green and purple basil. The experiment involved subjecting plants to three different levels of sunlight for 12 days: complete—100%, 50%, and 30%—sunlight. In addition, we evaluated the impact of harvest time during the day. The highest levels of photosynthetic and protective pigments were detected under full sunlight conditions in purple basil harvested at noon. The highest levels of soluble and storage carbohydrates were recorded in the purple basil grown under full sunlight and harvested during the early morning. By contrast, the lowest levels were obtained in plants grown under 30% sunlight and harvested at noon time. Under all light treatments, the maximum quantum yield of photosystem II (FV/FM) was detected at 4 a.m. in both basil varieties; it decreased at noon and increased again at 5 p.m. Non-Photochemical Quenching (NPQ) was most elevated in the green variety under all light intensities at noon. However, the highest NPQ was detected in the purple variety at 8 a.m. The NPQ was lowest in both basil varieties during the early morning and afternoon. Full sunlight at noon caused temporary photoinhibition and reduced carbohydrates while enhancing pigment concentration and photo-protective mechanisms in basil plants.

1. Introduction

Due to the adverse effects of chemical medicine and the growing trend in herbal remedies, significant agricultural lands have been devoted to the cultivation of medicinal plants in recent decades. About 150 species are known for the genus Ocimum, of which the basil (Ocimum basilicum L.) is the most important, and it is cultivated in many parts of the world because of its commercial value [1]. Basil has many applications in the food, pharmaceutical, and cosmetics industries. Basil oil is used as a spice in pastries, salads, soft drinks, ice cream, perfume factories, and oral and dental products such as toothpaste [2]. Furthermore, essential oils repel insects and have anti-parasitic, anti-bacterial, antifungal, and antioxidant properties [3].
Light is recognized as an essential factor for plants due to its effect on photosynthesis, physiological processes, plant structure and morphology, and the production of phytochemicals [4]. During the growing season, the quantity that solar energy plants receive determines their development and function. High and low light intensities can limit photosynthesis and carbon fixation in plants. In full sunlight, light inhibition occurs, leading to reduced photosynthesis, especially when other stresses are present [5]. Low light intensities also cause stress in plants, as they cause a reduced carbon concentration and photosynthetic net stabilization while also hampering plant growth [6]. In addition to its effects on photosynthesis, light intensity also affects plant temperature and morphological responses, which, at unfavorable levels, also cause stress [7]. Due to the critical role of light in photosynthesis (source of energy absorbed by pigments, induction of pigment synthesis, stomatal opening), when light is lower than species-dependent levels, plants often strive to expose themselves to higher light levels during growth [6,8,9].
High light intensities impose problems for crops, especially during the summertime [10]. Therefore, decreasing light intensity during the seasons with high light intensity is a standard practice in greenhouses. One way to adjust the light intensity is to use shading techniques. Shading grids are used to protect horticultural crops from excessive sunlight, environmental hazards (wind and hail), or flying pests (birds and insects) [11]. Shading reduces the quantity of light reaching the plant’s surface, which reduces plant growth and development, especially under conditions that include other stresses [12]. The cons and pros of high and low light intensities have been widely studied before. For instance, in Salvia (Salvia officinalis L.), photosynthetic pigments increased at a low light intensity, and overall biomass weight and plant height declined with decreasing light intensity [13]. In sunflowers (Helianthus annuus L.), plant growth and soluble protein content increased at a higher light intensity (350 µmol m−2 s−1), leading to additional growth due to an increase in CO2 fixation. Chlorophyll content increased with decreasing light intensity (125 µmol m−2 s−1). Furthermore, carbohydrate levels were higher in plants grown at higher light intensities. Nitrate reductase activity in both light treatments decreased with the increasing age of sunflower plants [14]. In Brassica campestris ssp., malondialdehyde content, which indicates damage to plant cells, increased under low light. Exposure to shade caused a decrease in chlorophyll a, soluble proteins, net photosynthesis, transpiration, stomatal conductance, and antioxidant activity. Moreover, low light intensity reduced anthocyanin biosynthetic enzymes and caused B. campestris plants to change their color from purple to green [15].
Plants were exposed to different light levels during the course of the day. This resulted in different plant metabolite profiles during different times of the day. Therefore, harvesting plant materials at different times during the day could result in the achievement of different metabolites and biochemicals in harvested plant products [16]. Although the application of shading at different levels is a common practice in greenhouse crop production in different parts of the world (especially in mid-range latitudes), in seasons characterized by high light intensities, the determination of photosynthetic functionality under different light levels during the course of a day has not been addressed so far. The present study aimed to investigate the photosynthetic functionality and level of photoprotective machinery under different shade levels at different time points of the day on basil plants with other pigmentations. We hypothesized that there would be higher pressure on the photosynthesis system at noon due to higher light intensities. Furthermore, due to different pigmentations in green and purple, we hypothesized different responses to the light levels. Basil was used in this investigation since it is one of the most essential herbs/medicinal plants, widely used in mid-range latitude countries with the availability of varieties of different pigmentations (green and purple).

2. Materials and Methods

2.1. Plant Material and Growth Conditions

Seeds from two commercial basil cultivars, green ‘Mobarake’ and purple ‘Ardestan’, were obtained from a commercial seed company (Pakan Bazr Isfahan Company, Isfahan, Iran) and sown in a mixture of coir–pith and perlite in a 1:1 ratio (v:v) in a greenhouse (latitude 35°27′07.7″ N, longitude 51°42′46.3″ E) in April 2020. After one month, in the six-leaf stage, basil seedlings were transferred to pots with a 9.0 diameter × 12.3 height cm containing 1:1:1 soil, sand, and leaf soil, which was regularly irrigated. The analysis of the soil used as the culture media is presented in Supplementary Table S1. The average day/night temperature of the greenhouse was 28 ± 3/18 ± 2 °C. To investigate the effect of different light intensities at different times of the day, a factorial split—plot experiment was conducted in a completely randomized design with two factors, including the basil variety (green and purple), three light intensities (full light, 50% and 30% of full sunlight) and four harvesting times (4 a.m., 8 a.m., 12 and 5 p.m.). To decrease light intensity, shade nets with the ability to reduce light intensity by 50% and 70%, were installed in the greenhouse at a distance of 150 ± 20 cm above the plants. Plants were positioned under these shades, along with regular greenhouse lighting. Twelve days after the light treatments, the plants were sampled. Young and fully developed leaves were used for the measurements. The measurements were conducted 42 days in total after seed sowing. The shade nets were placed at a distance that precisely decreased the light intensity by 50% and 70% of full natural sunlight (Table 1). Light intensity was determined using FluorPen FP 100-MAX (Photon System Instruments, Drasov, Czech Republic).

2.2. Determination of Chlorophyll and Carotenoid Contents

The chlorophyll (Chl) and carotenoid contents in plant leaves were determined based on the method of Lichtenthaler and Wellburn (1983). The samples (500 mg) from mature leaves were extracted in 10 mL of acetone (80%), and the extract was separated by centrifugation (SIGMA-3K30) at 7000× g for 5 min. Then, the absorbance of the supernatant was spectrophotometrically (Lambda 25-UV/VIS spectrometer) measured at 645, 663, and 470 nm, and the content of Chl a, b, total Chl, and carotenoids were calculated based on Lichtenthaler and Wellburn (1983) [17].

2.3. Determination of Total Anthocyanins

Anthocyanin content was measured based on the Tang et al. (2005) method. For this purpose, 500 mg of leaf powder was mixed with 10 mL of acidified ethanol and hydrochloric acid (1%) and then incubated in an incubator shaker at 4 °C for 24 h. After centrifugation (10 min at 7000× g), the absorbance of the supernatant was measured at 530 and 657 nm [18].

2.4. Evaluation of Soluble and Storage Carbohydrate Contents

To obtain the plant extract to measure the carbohydrate contents, 500 mg of the plant powder was mixed in 5 mL of 96% ethanol and placed on an incubator shaker at 4 °C for 24 h. After centrifugation (10 min at 4000× g), the supernatant was separated, and 5 mL of 70% ethanol was poured onto the remaining sediments and placed in an incubator shaker at 4 °C for one hour. After centrifugation, the top solution was mixed with the previous solution. The plant extract (50 μL) was mixed with 3 mL of anthrone (150 mg of anthrone powder per 100 mL of 72% sulfuric acid) to measure soluble carbohydrates. The samples were then placed in a bain-marie at 100 °C for ten min. Finally, the sample absorbance was measured at 625 nm. Concentrations at 0, 25, 75, and 100 mg mL−1 for monohydrate glucose were used to draw the standard curve [19]. The sediments that remained after extraction were used to measure starch carbohydrates. To perform this, 1.25 mL of distilled water was added to completely dried sediments, and then 1.265 mL of perchloric acid was added to it. After centrifugation (10 min at 4000× g), the supernatant was removed, and all steps were re-applied to the residue. Then, the samples were placed on ice for 30 min. They were smoothed with filter paper and finally reached a volume of 2.5 mL. To prepare the sample solution, 0.625 mL of the extract was mixed with 2.5 mL of 0.002 Antron solution in 98% sulfuric acid and was then placed in a bain-marie at 100 °C for 8 min. It was placed on ice immediately. Finally, the absorption of the samples was read at a wavelength of 630 nm [20].

2.5. Chl a Fluorescence

The youngest fully developed leaves were used to measure the maximum quantum efficiency of PSII (FV/FM) with the Handy Fluorcam FC 1000-H (Photon Systems Instruments, PSI, Czech Republic). Intact leaves attached to the plants were dark-adapted for 20 min. After dark adaptation, intact plants were immediately used to measure FV/FM. The Fluorcam, consisting of a CCD camera and four fixed LED panels, one pair supplying the measuring pulses and the second pair providing actinic illumination and a saturating flash were used. FV/FM was calculated using a custom-made protocol [21,22,23]. Images were recorded during short measurements of flashes in darkness. At the end of these short flashes, the samples were exposed to a saturating light pulse (3900 μmol m−2 s−1) that resulted in the transitory saturation of photochemistry and a reduction in the primary quinone acceptor of PSII [23]. After reaching steady-state fluorescence, two successive series of fluorescence data were digitized and averaged, one during short measuring flashes in darkness (Fo) and the other during the saturating light flash (Fm). Fv was calculated using the expression Fv = Fm − Fo from these two parameters. The FV/FM was calculated using the ratio (Fm − Fo)/Fm. The average values and standard deviation of FV/FM were calculated using version 7 FluorCam software.
Following overnight dark adaption, transient polyphasic Chl a fluorescence (OJIP) was evaluated on young fully formed basil leaves using a FluorPen FP 100-MAX (Photon System Instruments, Drasov, Czech Republic). A saturating light of approximately 3900 µmol m−2 s−1 initiated the fluorescence measurement. The JIP test was used to assess OJIP transients [24]. The following data from the original size was used after extraction using FluorPen software: fluorescence intensities were conducted at 50 µs (F 50 µs, considered as the minimum fluorescence F0), 2 ms (J-step, FJ), 60 ms (I-step, FI), with maximum fluorescence (Fm). At time 0 and the time to obtain the maximum fluorescence, the performance index was determined using the absorption basis (PIABS) and densities of QA- reducing PSII reaction centers. Parameters related to OJIP fluorescence transients include the probability that a trapped exciton promotes an electron in ETC beyond QA-0) where the quantum yield of electron transport (φE0), the quantum yield of energy dissipation (φD0), the quantum yield for primary photochemistry (φPAV), the maximum quantum yield of primary photochemistry (φP0), specific energy fluxes per reaction center (RC) for energy absorption (ABS/RC), trapped energy flux (TR0/RC), electron transport flux (ET0/RC) and dissipated energy flux (DI0/RC) were calculated according to Kalhor et al. (2018) [25].
The fluorescence transient, when displayed on a logarithmic time scale, generally consists of four discernible stages. The FO (O) measurement was performed under conditions where all response centers were fully open, with a duration of 20 milliseconds (ms). Following this, fluorescence intensity at the J step (FJ) was measured at a time interval of 2 ms with the fluorescent intensity at the I step (FI) examined at a time interval of 60 ms, and the maximum fluorescent intensity (Fm, also known as FP) was recorded at a time interval of 300 ms. The JIP–test parameters were derived using raw fluorescence data collected during the execution of the OJIP transients’ protocol. The fluorescence kinetics were normalized by calculating the relative values of Vt using the formula Vt = (Ft − FO)/(Fm − FO), where Vt represents the fluorescence intensity at a given time, FO represents the baseline fluorescence intensity, and Fm represents the maximum fluorescence intensity. In addition, the process of normalization was carried out with respect to FO and FJ, resulting in the calculation of VOJ using the formula (Ft − FO)/(FJ − FO). Furthermore, the process of normalization was performed with regard to FJ and FI, resulting in the equation VJI = (Ft − FJ)/(FI − FJ). Similarly, normalization using FI and FP was achieved using the equation VIP = (Ft − FI)/(FP − FI) [26].

2.6. Statistical Analysis

Statistical analysis was performed using SAS 9.4 statistical analysis software (SAS Institute Inc., Cary, NC, USA). A hundred plants were cultured under each light treatment, 10 of them were selected for photosynthetic measurements and three random replications were used for physiological evaluations. The experiment was arranged on a factorial basis with a completely randomized design, including 10 replications for photosynthetic measurements and three replications for physiological evaluations. All data are presented as the mean ± standard deviation (SD). Mean separations were conducted using a Duncan test protected by ANOVA at p ≤ 0.05.

3. Results

3.1. Effects of Shading and Harvest Time on Pigment Concentrations of Basil Plants

The light intensities and harvest time significantly influenced concentrations of all photosynthetic pigments in basil leaves. In general, the purple variety contained higher levels of chlorophyll pigments under 100% and 50% light levels, while there was no significant difference between the two basil varieties when plants were exposed to a 30% light level. At full sunlight, the highest chlorophyll content was detected at noon, while at 50% of light levels, the highest chlorophyll content was performed in the morning. The purple variety had the highest levels of chlorophyll a, b, and their total amount was obtained when harvested at noon under full sunlight conditions. On the other hand, the green variety had the lowest levels of these components when harvested in the morning under the same light intensity (Figure 1A–C).
The purple variety showed the highest carotenoid content when harvested at noon and in full sunlight, as well as at 50% light in the morning and noon. Conversely, the green variety had the lowest carotenoids when harvested in the morning and noon under full sunlight treatment and at noon with a 50% light level. The purple variety also had a lower carotenoid when harvested in the morning under full sunlight treatment (Figure 1D).
The purple variety had the highest level of anthocyanin when harvested at noon under full sunlight, while the green variety had the lowest level under a 30% light level during both the morning and noon harvest, as well as 50% full sunlight during the morning harvest. Overall, the purple variety had enormously higher levels of anthocyanin in all treatments compared to the green variety. In general, the levels of anthocyanin decreased in both varieties as the light intensity decreased (Figure 1E).

3.2. Effects of Shading and Harvest Time on Leaf Carbohydrate Contents of Basil Plants

The light intensities and harvest time significantly influenced both soluble and storage carbohydrate contents in basil leaves. Both basil varieties had the highest storage and soluble carbohydrates when exposed to full sunlight and harvested in the morning. On the other hand, the lowest amount of carbohydrates was detected for the green variety when exposed to 30% sunlight and harvested at noon. The purple variety also had lower carbohydrate levels at the same light intensity when harvested at noon. In general, carbohydrate levels were higher in the morning than at noon. As light intensity decreased, the amount of carbohydrates for both varieties was also reduced (Figure 2 and Figure 3).

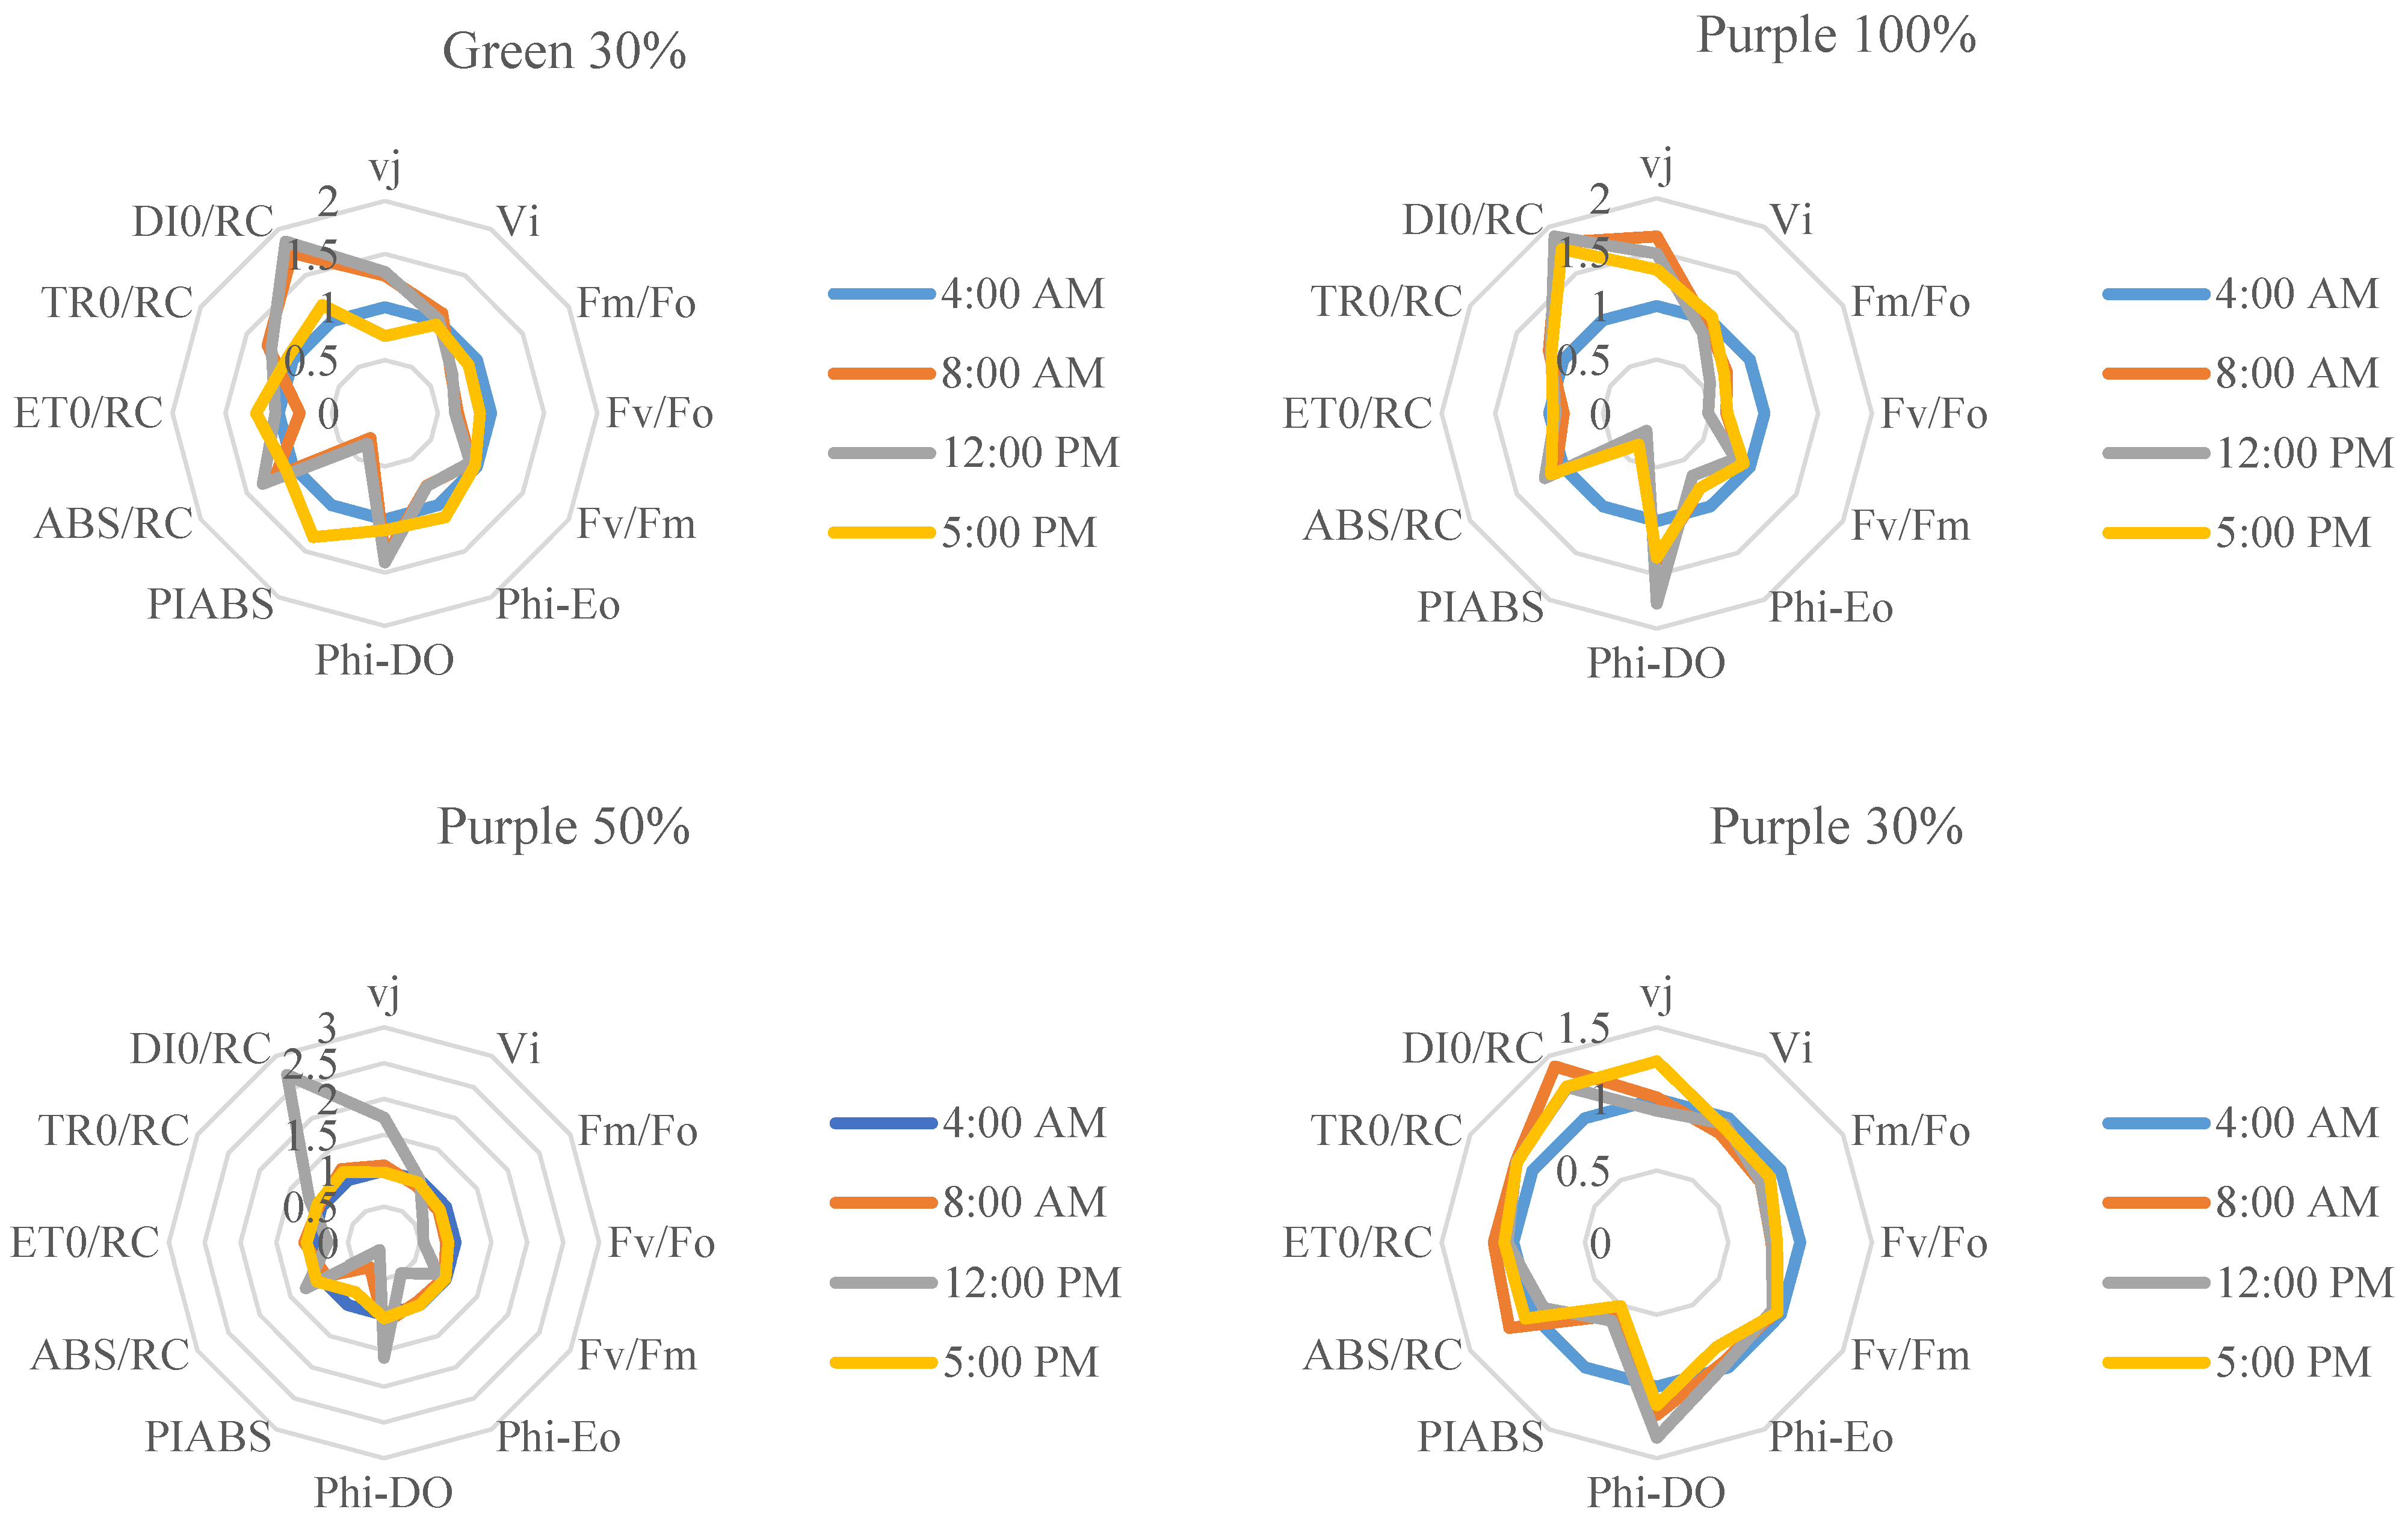
3.3. Chlorophyll a Fluorescence Influenced by Light Intensity and Day-Time in Basil Varieties

In this study, to assess the photosynthetic functionality under different light intensities and different times of day, a fast OJIP transient was used. Due to a large number of measurements and to achieve a better understanding, the diagrams of OJIP transients were drawn separately from each variety and light intensity, while measurements during different time courses of a day are presented in each graph (Figure 3). The most normal OJIP can be seen in both varieties and at all intensities of light at 4 a.m., and with the passage of time and the onset of daylight, disturbances in different stages of OJIP, especially in the final stages, occurred (Figure 3). Under different shade treatments in both basil varieties, there were declines in the final steps of the OJIP transient when measurements were performed during the daytime (8 a.m., 12, 5 p.m.).
The investigation entailed the observation of discernible photosynthetic reactions in both green and purple basil cultivars as they were subjected to different levels of light intensity and monitored over the course of a day. In the case of the green variant, the maximum values of Vt were seen for 50% and 100% sunlight levels at 8 a.m., while the minimum value was recorded for 30% sunlight at 5 p.m. VOJ attained its maximum value under 100% sunlight at 8 a.m. and subsequently reached its minimum value under 30% sunlight at 5 p.m. VJI exhibited its highest values for 100% and 50% of sunlight intensities at 8 a.m., whereas the lowest value was observed for 100% sunlight intensity in the late afternoon at 5 p.m. The highest values of VIP were observed at 4 a.m. with 30% sunlight, 5 p.m. with 100% sunlight, and 4 a.m. with 50% sunlight. Conversely, the lowest VIP was recorded at 8 a.m. with 30% sunlight. The purple type demonstrated its highest Vt value under 50% sunlight at 4 a.m., whereas the lowest Vt value was seen in 50% sunlight during the late afternoon at 5 p.m. VOJ attained its peak value under 100% sunlight at 12, while its nadir fell under 100% sunlight at 8 a.m. The highest values of VJI were detected under 100% sunlight at 5 p.m., whilst the lowest values were recorded under 100% sunlight at 8 a.m. The VIP displayed its peak values under 100% and 50% sunlight levels at 4 a.m., while the lowest VIP value was seen at 5 p.m. under 50% sunlight conditions. These aforementioned results highlight the intricate photosynthetic adjustments exhibited by the two basil cultivars in response to fluctuations in light intensity and daily variations. This provides valuable insights into their physiological mechanisms for maximizing photosynthesis and safeguarding against excessive light exposure (Figures S1 and S2).
In general, and under all light intensities, the maximum quantum yield of the green variety’s photosystem II (FV/FM) was higher than its ratio in the purple variety (Figure 4). Furthermore, under all light treatments in both basil varieties, FV/FM was at its highest value at 4 a.m.; then, with exposure to sunlight, FV/FM decreased at 8 a.m. and 12 and increased again at 5 p.m. The highest FV/FM was detected in green basil plants at 4 a.m. under all light treatments, while the lowest FV/FM was obtained in purple basil plants at 12 when exposed to full sunlight or 50% of sunlight conditions (Figure 4).
The highest performance index on an absorbance basis (PIABS) was detected in the green variety under 50% and 30% of full sunlight at 5 p.m., and the lowest PIABS belonged to the purple variety under full sunlight and 50% at 12. The lowest PIABS in the green variety was obtained under all light intensities at 8 a.m. The highest PIABS in the purple variety was detected under full sunlight at 4 a.m. (Figure 5).
For the green variety, the highest variation in OJIP transient-derived parameters was detected mainly for DI0/RC and PIABS (Figure 6). Compared to the 4 a.m. measurement, there was an increase in DI0/RC when the measurements were performed during the day (8 a.m., 12, and 5 p.m.). In the case of PIABS, there was a decrease when plants were exposed to full sunlight during daytime measurements. The same reduction was obtained in plants exposed to 50% and 30% of full sunlight when measurements were conducted at 8 a.m. and 12, while at 5 p.m., there was an increase in the value of PIABS. The purple variety showed considerable variations in OJIP transient-derived parameters, especially for фD0, DI0/RC, Vj, and PIABS (Figure 6). DI0/RC, Vj, and фD0 were sharply increased, while PIABS dramatically decreased when measurements were conducted during the daytime (8 a.m., 12, and 5 p.m.).
The highest NPQ was detected for the purple variety exposed to full light at 8 a.m. The lowest NPQ was also detected for the purple variety exposed to 50% of full sunlight at 5 p.m. (Figure 7). In both basil varieties, there was no difference or a slight increase in the NPQ of plants at 8 a.m. compared to its values at 4 a.m. In general, both basil varieties showed the lowest NPQ at 5 p.m.

4. Discussion

The photosynthetic pigment increased in green basil, while it decreased in purple basil by reducing light intensity.
Photosynthetic pigments play a critical role in facilitating the absorption and transfer of light energy in plants, thereby directly influencing photosynthetic efficiency. Among these pigments, chlorophyll is important and is a significant indicator of photosynthetic capacity [27]. In general, chlorophyll levels were increased for the green variety and decreased in the purple variety by reducing light intensity (Figure 1). Many factors, including light’s quantity and quality, affect the chlorophyll level in plants [28]. Similar to the green variety of the present study, it was found that the amount of chlorophyll in sage increased with decreasing light intensity [13]. However, it has been shown that plants that are grown under shade receive lower levels of light per unit of the leaf area compared to those grown under full sunlight. Consequently, it is common for shade-exposed plants to achieve elevated levels of chlorophyll, particularly chlorophyll b, to compensate for a decrease in received light intensity [29]. Similar to our result, a higher chlorophyll content in the purple basil variety compared to the level in the green basil variety has been reported by Hosseini et al [17], where plants are grown under different light spectra. It seems that the high anthocyanin level of the purple variety, which is considered a shade screen for the leaf to protect it from high light intensities, induces chlorophyll accumulation to compensate for the decreased light level received by the mesophyll [30]. In the present study, chlorophyll levels increased at noon time when plants were exposed to full sunlight conditions, while at the same time, they decreased when shadings were applied (Figure 1). The level of chlorophyll in plant leaves depends on many factors, including genotype, location, light level, etc. An increase in chlorophyll levels as a result of exposure to high light intensity has been reported in green-leaf plants [6,8,9]. On the other hand, a decrease in chlorophyll content due to high-light-intensity exposure has been reported [31,32,33].
Anthocyanins are stable pigments with the antioxidant role of protecting the photosynthetic system against photooxidation under stress conditions [27]. The accumulation of anthocyanins as an important pigment in leaves is affected by various factors, such as temperature and access to water and light. The accumulation of anthocyanins in the leaves can act as a protective surface that reduces the harmful effects of light [34]. Under intense light conditions, plants undergo changes in their metabolism, structure, and pigment composition in order to compete and survive in the new environment. Many plants in their leaves and fruits, under high light and other stress conditions, induce the synthesis of additional pigments, such as anthocyanins [35]. Anthocyanin levels decreased in both basil varieties with decreasing light intensity (Figure 1). Therefore, a positive correlation between anthocyanin levels and tolerance to high light stress has been proposed [36]. In petunia plants, a reduction in light intensity caused a decrease in the production of anthocyanin [37]. As expected, the purple basil contained more anthocyanin levels than the green variety [17,38]. The purple variety had a higher amount of anthocyanin (0.6 to 1 mg/g fresh weight) than the green variety (less than 0.5 mg/g fresh weight), and the cause of the purple color in this variety was attributed to the accumulation of anthocyanins [39]. Due to the accumulation of anthocyanins in vacuoles [40], they increase plant tolerance by protecting the photosynthetic system against stresses, such as high light radiation, by increasing the amount of fluorescence [17,41].
Carotenoids serve as both pigments that receive light and protect chloroplasts when they are under stress. Under high light intensity, carotenoids primarily function to protect, while in environments with low light radiation, they absorb light and transmit its energy to chlorophyll [42]. In the present study, carotenoid levels increased as light intensity decreased for the green variety, with higher levels detected in the morning, while in the purple variety, carotenoid levels mainly accumulated at noon time.
Photosynthetic functionality decreased by high light stress mainly for the purple basil variety.
During the process of photosynthesis, light energy is converted into chemical energy. This chemical energy is stored as carbohydrates for consumption during plant growth [43]. In our study, the amount of carbohydrates in the plant decreased by decreasing the light intensity using shading. Furthermore, the highest amount of carbohydrates was detected in the morning harvest. The light intensity can affect plant growth and stress tolerance in plants due to its effect on the synthesis of carbohydrate products [44]. Decreased and weak growth due to exposure to low light intensities is mainly due to reduced energy inputs obtained from light reactions (ATP and NADPH) for carbon reactions; this results in a decrease in CO2 fixation and, as a consequence, reduces sugar synthesis as the cytoskeleton of plant structure [43]. Similar results were obtained in a survey on the effect of different light intensities on sunflowers [14]. In another study on roses, it was found that plants contained less carbohydrates when exposed to a high and stressful light intensity, which is consistent with the results of the present study at noon. Decreased carbohydrate production when exposed to high light intensity is known to reduce the photosystem II functionality and, thus, reduce the production of sugars in the plant [36].
Photosynthetic reactions in plants depend on environmental conditions. The quantity and quality of light are among the factors that can affect photosynthetic reactions [45]. Environmental stress usually increases FO. The increase in FO indicates the degradation of the electron transfer chain of photosystem II due to a reduction in QA capacity, its complete lack of oxidation due to the slow flow of electrons along the path of photosystem II, and the total inactivation of photosystem II [46]. The increase in FO could also be attributed to the damage caused to the D1-bound protein of photosystem II [24,47]. Maximum fluorescence (FP) is related to the maximum emission of fluorescence due to a reduction in all electron carriers [48]. In this study, FP levels decreased in both varieties when light intensity increased during the day. In the experiment on roses, the amount of FP decreased when the rose was exposed to high light intensity [36]. A decrease in FP is likely associated with the reduced activity of the water-degrading enzyme complex as well as electron transfer cycles in or around photosystem II [49]. The variable fluorescence, denoted as Vt, is a measure of the efficiency of photosystem II. It is expressed as the ratio of the fluorescence intensity relative to the minimum and maximum values. Variable fluorescence, as indicated by the acronym VOJ, pertains to the measurement of fluorescence during the O-J phase. This measurement serves as an indicator of the efficiency of energy transfer within the photosystem. The Variable J-I (VJI) method quantifies the fluorescence emitted during the J and I phases, thereby offering valuable insights into the consumption of energy. In conclusion, the acronym VIP denotes variable fluorescence during the I-P phase, which provides valuable insights into the operation of photosystem I. Combining the aforementioned factors provides insights into the adaptive mechanisms of basil plants when adjusting their photosynthetic processes in accordance with variations in environmental conditions. This sheds light on the physiological techniques employed by basil plants to optimize photosynthesis and mitigate the effects of photoinhibition.
FV/FM is calculated from the ratio of variable fluorescence to maximum fluorescence. This index indicates the maximum quantum efficiency of photosystem II for converting absorbed light into chemical energy [50]. This parameter decreases during stress conditions. The decrease in this index is the result of damage to the reaction centers of photosystem II. It indicates the occurrence of photoinhibition due to environmental stress [51]. The FV/FM index is used to diagnose photosynthetic system disorders, and its reduction indicates a decrease in photochemical productivity in photosystem II and damage to the photosynthetic system [52]. FV/FM represents the ratio of light used in the photosynthesis process to the total light absorbed by chlorophyll; its decrease indicates a decrease in the photosynthesis capacity [53]. Decreased photochemical performance is due to the occurrence of inhibition due to the inactivation of photosystem II’s reaction center and the damage to the D1 protein [51]. In the present study, conducted at 4 a.m. in both varieties, FV/FM was at its highest value, but when the light intensity increased (noon), FV/FM also decreased. It then rose again with decreasing light intensity at 5 p.m. An increase in FV/FM reduced energy loss in the form of heat in the plant [54]. The results of this study were consistent with the research of Hazrati et al. [55], which reported that decreasing FV/FM was associated with increased light intensity and increased heat dissipation in the form of heat [55]. The decrease in FV/FM was due to photosystem II damage, which reduced photosynthesis efficiency [56]. The green variety showed a higher FV/FM compared to the purple variety, which was in line with the study of Hosseini et al [17].
PIABS is a parameter that is defined as an indicator of system performance per absorbed light [25]. This index is one of the most useful biophysical parameters when showing the difference between the response of photosystem II to normal conditions and conditions in which plants are under stress [5]. In other words, PIABS is an indicator of photon absorption performance. This parameter is very sensitive to environmental changes and stresses and is successfully used to track photosynthetic performance when the plant is exposed to many abiotic stresses, including high light stress [5], elevated temperatures [57], salinity stress [58], drought [59], and nutrient deficiency [60]. The decrease in PIABS may be due to electron inhibition and a decline in the normal performance of photosystem II [61]. In the present study, PIABS decreased with increasing light intensity during the day. In wheat, PIABS decreased from 12 to 5 p.m. compared to its values in the morning [62].
NPQ is an indicator of the dissipation of received energy in the form of heat. Elevation in the NPQ indicates the high capacity of the xanthophyll cycle and the plant’s ability to withstand stress through energy loss in the form of heat [63]. The NPQ is highly related to the functioning of the xanthophyll cycle, which facilitates energy dissipation in the form of heat under high light intensities [64]. In the present study, NPQ was highest for the green variety at noon time, which could be related to the high level of carotenoids at noon time for the green variety (Figure 1). It has been shown that plants that are exposed to intense light have higher levels of NPQ than plants exposed to low light [8,56]. In the purple variety, NPQ reached its highest level at 8 a.m. and decreased at noon with the highest light intensity during the measurement. Studies have shown that the accumulation of anthocyanin in plants reduces NPQ under conditions of high light intensity. Indeed, anthocyanin acts as a light shield and protects the plant’s photosynthetic system from high light intensity [65]. However, in the present study, a higher anthocyanin level for the purple variety did not provide more protection on the photosynthetic apparatus. This could be elucidated by lower FV/FM and NPQ during the noon time in the purple variety, while in the green variety, which contained lower anthocyanin levels, higher FV/FM and NPQ were shown during noon time. It has been reported that although anthocyanin protects plants from high light stress due to its antioxidant properties, it reduces photosynthetic functionality [30]. Agati et al. (2022) challenged the known role of anthocyanin in the photoprotection of photosynthesis by showing a shortage of proper investigations using red- and green-leaved plants and the discrepancy between the findings of controlled environments and the field [66]. Therefore, it is still too early to make a firm conclusion in relation to the role of anthocyanin in protection over photosynthesis machinery.

5. Conclusions

In the present study, photosynthetic and protective pigments of green and purple basil varieties were influenced by shade level and measurement time throughout the day. Although the purple variety showed higher levels of chlorophyll and anthocyanin pigments than the green variety, these pigments decreased considerably when shade treatments were applied. The green variety showed a lower photoinhibition level during the day than the purple variety. As a result, there were lower variations in the fate of excited energy in the green variety compared to the purple one. The higher photoinhibition during the daytime in the purple variety could be related to their lower capacity to dissipate extra energy on the photosynthetic system for heat (NPQ). In conclusion, higher anthocyanin levels for the purple variety did not necessarily prevent photoinhibition in the purple variety.

Supplementary Materials

The following supporting information can be downloaded at: https://www.mdpi.com/article/10.3390/agronomy13102478/s1. Table S1: Soil Analysis Results at the depths 0–30 cm. Figure S1: Effect of different light intensities (100:100% sunlight, 50:50% sunlight, and 30:30% sunlight) and harvested at various time courses of a day on Vt (A), VOJ (B), VJI (C), and VIP(D) in green basil; Figure S2. Effect of different light intensities (100:100% sunlight, 50:50% sunlight, and 30:30% sunlight) and harvested at various time courses of a day on Vt (A), VOJ (B), VJI (C), and VIP(D) in purple basil.

Author Contributions

Conceptualization, P.E., M.Z.M., F.D., N.S.G. and S.A.; methodology, P.E., M.Z.M., F.D. and S.A.; software, P.E., M.Z.M., F.D. and S.A.; validation, N.S.G.; formal analysis, P.E., M.Z.M., F.D. and S.A.; investigation, P.E., M.Z.M., F.D. and S.A.; resources, M.Z.M. and S.A.; data curation, P.E., M.Z.M., F.D. and S.A.; writing—original draft preparation, P.E. and F.D.; writing—review and editing, S.A.; visualization, S.A.; supervision, S.A.; project administration, S.A.; funding acquisition, N.S.G. All authors have read and agreed to the published version of the manuscript.

Funding

This research was funded by University of Tehran.

Data Availability Statement

The data supporting the conclusions of this research can be obtained from the corresponding author upon a reasonable request.

Conflicts of Interest

The authors declare no conflict of interest.

References

  1. Ioannidis, D.; Bonner, L.; Johnson, C.B. UV-B is required for normal development of oil glands in Ocimum basilicum L. (Sweet Basil). Ann. Bot. 2002, 90, 453–460. [Google Scholar] [CrossRef]
  2. Labra, M.; Miele, M.; Ledda, B.; Grassi, F.; Mazzei, M.; Sala, F. Morphological characterization, essential oil composition and DNA genotyping of Ocimum basilicum L. cultivars. Plant Sci. 2004, 167, 725–731. [Google Scholar] [CrossRef]
  3. Sajjadi, S.E. Analysis of the essential oils of two cultivated basil (Ocimum basilicum L.) from Iran. DARU J. Pharm. Sci. 2006, 14, 128–130. [Google Scholar]
  4. Paez, A.; Gebre, G.M.; Gonzalez, M.E.; Tschaplinski, T.J. Growth, soluble carbohydrates, and aloin concentration of Aloevera plants exposed to three irradiance levels. Environ. Exp. Bot. 2000, 44, 133–139. [Google Scholar] [CrossRef]
  5. Ashrostaghi, T.; Aliniaeifard, S.; Shomali, A.; Azizinia, S.; Abbasi Koohpalekani, J.; Moosavi-Nezhad, M.; Gruda, N.S. Light intensity: The role player in cucumber response to cold stress. Agronomy 2022, 12, 201. [Google Scholar] [CrossRef]
  6. Esmaeili, S.; Aliniaeifard, S.; Dianati Daylami, S.; Karimi, S.; Shomali, A.; Didaran, F.; Telesiński, A.; Sierka, E.; Kalaji, H.M. Elevated light intensity compensates for nitrogen deficiency during chrysanthemum growth by improving water and nitrogen use efficiency. Sci. Rep. 2022, 12, 10002. [Google Scholar] [CrossRef]
  7. Long, S.P.; Humphries, S.; Falkowski, P.G. Photoinhibition of photosynthesis in nature. Annu. Rev. Plant Biol. 1994, 45, 633–662. [Google Scholar] [CrossRef]
  8. Ghorbanzadeh, P.; Aliniaeifard, S.; Esmaeili, M.; Mashal, M.; Azadegan, B.; Seif, M. Dependency of growth, water use efficiency, chlorophyll fluorescence, and stomatal characteristics of lettuce plants to light intensity. J. Plant Growth Regul. 2021, 40, 2191–2207. [Google Scholar] [CrossRef]
  9. Vatankhah, A.; Aliniaeifard, S.; Moosavi-Nezhad, M.; Abdi, S.; Mokhtarpour, Z.; Reezi, S.; Tsaniklidis, G.; Fanourakis, D. Plants exposed to titanium dioxide nanoparticles acquired contrasting photosynthetic and morphological strategies depending on the growing light intensity: A case study in radish. Sci. Rep. 2023, 13, 5873. [Google Scholar] [CrossRef]
  10. Zhang, S.; Ma, K.; Chen, L. Response of photosynthetic plasticity of Paeonia suffruticosa to changed light environments. Environ. Exp. Bot. 2003, 49, 121–133. [Google Scholar] [CrossRef]
  11. Whitelam, G.C.; Halliday, K.J. Light and Plant Development; Blackwell Pub: Hoboken, NJ, USA, 2007. [Google Scholar]
  12. Tesfaye, K.; Walker, S.; Tsubo, M. Radiation interception and radiation use efficiency of three grain legumes under water deficit conditions in a semi-arid environment. Eur. J. Agron. 2006, 25, 60–70. [Google Scholar] [CrossRef]
  13. Zervoudakis, G.; Salahas, G.; Kaspiris, G.; Konstantopoulou, E. Influence of light intensity on growth and physiological characteristics of common sage (Salvia officinalis L.). Braz. Arch. Biol. Technol. 2012, 55, 89–95. [Google Scholar] [CrossRef]
  14. De la Mata, L.; Cabello, P.; De La Haba, P.; Agüera, E. Study of the senescence process in primary leaves of sunflower (Helianthus annuus L.) plants under two different light intensities. Photosynthetica 2013, 51, 85–94. [Google Scholar] [CrossRef]
  15. Zhu, H.; Li, X.; Zhai, W.; Liu, Y.; Gao, Q.; Liu, J.; Ren, L.; Chen, H.; Zhu, Y. Effects of low light on photosynthetic properties, antioxidant enzyme activity, and anthocyanin accumulation in purple pak-choi (Brassica campestris ssp. Chinensis Makino). PLoS ONE 2017, 12, e0179305. [Google Scholar] [CrossRef]
  16. Santana, A.C.; Carrão-Panizzi, M.C.; Mandarino, J.M.G.; Leite, R.S.; Silva, J.B.D.; Ida, E.I. Effect of harvest at different times of day on the physical and chemical characteristics of vegetable-type soybean. Food Sci. Technol. 2012, 32, 351–356. [Google Scholar] [CrossRef]
  17. Hosseini, A.; Zare Mehrjerdi, M.; Aliniaeifard, S.; Seif, M. Photosynthetic and growth responses of green and purple basil plants under different spectral compositions. Physiol. Mol. Biol. Plants 2019, 25, 741–752. [Google Scholar] [CrossRef]
  18. Teng, S.; Keurentjes, J.; Bentsink, L.; Koornneef, M.; Smeekens, S. Sucrose-specific induction of anthocyanin biosynthesis in Arabidopsis requires the MYB75/PAP1 gene. Plant Physiol. 2005, 139, 1840–1852. [Google Scholar] [CrossRef]
  19. Irigoyen, J.; Einerich, D.; Sánchez-Díaz, M. Water stress induced changes in concentrations of proline and total soluble sugars in nodulated alfalfa (Medicago sativd) plants. Physiol. Plant. 1992, 84, 55–60. [Google Scholar] [CrossRef]
  20. McCready, R.; Guggolz, J.; Silviera, V.; Owens, H.S. Determination of starch and amylose in vegetables. Anal. Chem. 1950, 22, 1156–1158. [Google Scholar] [CrossRef]
  21. Aliniaeifard, S.; Matamoros, P.M.; van Meeteren, U. Stomatal malfunctioning under low VPD conditions: Induced by alterations in stomatal morphology and leaf anatomy or in the ABA signaling? Physiol. Plant. 2014, 152, 688–699. [Google Scholar] [CrossRef]
  22. Aliniaeifard, S.; van Meeteren, U. Natural variation in stomatal response to closing stimuli among Arabidopsis thaliana accessions after exposure to low VPD as a tool to recognize the mechanism of disturbed stomatal functioning. J. Exp. Bot. 2014, 65, 6529–6542. [Google Scholar] [CrossRef] [PubMed]
  23. Genty, B.; Briantais, J.-M.; Baker, N.R. The relationship between the quantum yield of photosynthetic electron transport and quenching of chlorophyll fluorescence. Biochim. Biophys. Acta BBA-Gen. Subj. 1989, 990, 87–92. [Google Scholar] [CrossRef]
  24. Strasser, R.J.; Srivastava, A.; Tsimilli-Michael, M. The fluorescence transient as a tool to characterize and screen photosynthetic samples. Probing Photosynth. Mech. Regul. Adapt. 2000, 25, 445–483. [Google Scholar]
  25. Kalhor, M.S.; Aliniaeifard, S.; Seif, M.; Asayesh, E.J.; Bernard, F.; Hassani, B.; Li, T. Enhanced salt tolerance and photosynthetic performance: Implication of ɤ-amino butyric acid application in salt-exposed lettuce (Lactuca sativa L.) plants. Plant Physiol. Biochem. 2018, 130, 157–172. [Google Scholar] [CrossRef] [PubMed]
  26. Zhang, H.-H.; Xu, N.; Wu, X.; Wang, J.; Ma, S.; Li, X.; Sun, G. Effects of four types of sodium salt stress on plant growth and photosynthetic apparatus in sorghum leaves. J. Plant Interact. 2018, 13, 506–513. [Google Scholar] [CrossRef]
  27. He, F.; Mu, L.; Yan, G.-L.; Liang, N.-N.; Pan, Q.-H.; Wang, J.; Reeves, M.J.; Duan, C.-Q. Biosynthesis of anthocyanins and their regulation in colored grapes. Molecules 2010, 15, 9057–9091. [Google Scholar] [CrossRef]
  28. Abreu, P.P.; Souza, M.M.; de Almeida, A.-A.F.; Santos, E.A.; de Oliveira Freitas, J.C.; Figueiredo, A.L. Photosynthetic responses of ornamental passion flower hybrids to varying light intensities. Acta Physiol. Plant. 2014, 36, 1993–2004. [Google Scholar] [CrossRef]
  29. Wadhwa, R.; Kumari, N.; Sharma, V. Varying light regimes in naturally growing Jatropha curcus: Pigment, proline and photosynthetic performance. J. Stress Physiol. Biochem. 2010, 6, 66–80. [Google Scholar]
  30. Zhao, S.; Blum, J.A.; Ma, F.; Wang, Y.; Borejsza-Wysocka, E.; Ma, F.; Cheng, L.; Li, P. Anthocyanin accumulation provides protection against high light stress while reducing photosynthesis in apple leaves. Int. J. Mol. Sci. 2022, 23, 12616. [Google Scholar] [CrossRef]
  31. Biswal, A.K.; Pattanayak, G.K.; Pandey, S.S.; Leelavathi, S.; Reddy, V.S.; Govindjee; Tripathy, B.C. Light intensity-dependent modulation of chlorophyll b biosynthesis and photosynthesis by overexpression of chlorophyllide a oxygenase in tobacco. Plant Physiol. 2012, 159, 433–449. [Google Scholar] [CrossRef]
  32. Muhidin; Syam’Un, E.; Kaimuddin; Musa, Y.; Sadimantara, G.; Usman; Leomo, S.; Rakian, T. The effect of shade on chlorophyll and anthocyanin content of upland red rice. IOP Conf. Ser. Earth Environ. Sci. 2018, 122, 012030. [Google Scholar] [CrossRef]
  33. Zhang, H.; Zhong, H.; Wang, J.; Sui, X.; Xu, N. Adaptive changes in chlorophyll content and photosynthetic features to low light in Physocarpus amurensis Maxim and Physocarpus opulifolius “Diabolo”. PeerJ 2016, 4, e2125. [Google Scholar] [CrossRef] [PubMed]
  34. Oren-Shamir, M.; Levi-Nissim, A. UV-light effect on the leaf pigmentation of Cotinus coggygria ‘Royal Purple’. Sci. Hortic. 1997, 71, 59–66. [Google Scholar] [CrossRef]
  35. Merzlyak, M.N.; Chivkunova, O.B. Light-stress-induced pigment changes and evidence for anthocyanin photoprotection in apples. J. Photochem. Photobiol. B Biol. 2000, 55, 155–163. [Google Scholar] [CrossRef] [PubMed]
  36. Bayat, L.; Arab, M.; Aliniaeifard, S.; Seif, M.; Lastochkina, O.; Li, T. Effects of growth under different light spectra on the subsequent high light tolerance in rose plants. AoB Plants 2018, 10, ply052. [Google Scholar] [CrossRef]
  37. Albert, N.W.; Lewis, D.H.; Zhang, H.; Irving, L.J.; Jameson, P.E.; Davies, K.M. Light-induced vegetative anthocyanin pigmentation in Petunia. J. Exp. Bot. 2009, 60, 2191–2202. [Google Scholar] [CrossRef]
  38. Tenore, G.C.; Campiglia, P.; Ciampaglia, R.; Izzo, L.; Novellino, E. Antioxidant and antimicrobial properties of traditional green and purple “Napoletano” basil cultivars (Ocimum basilicum L.) from Campania region (Italy). Nat. Prod. Res. 2017, 31, 2067–2071. [Google Scholar] [CrossRef]
  39. Landi, M.; Pardossi, A.; Remorini, D.; Guidi, L. Antioxidant and photosynthetic response of a purple-leaved and a green-leaved cultivar of sweet basil (Ocimum basilicum) to boron excess. Environ. Exp. Bot. 2013, 85, 64–75. [Google Scholar] [CrossRef]
  40. Chanoca, A.; Kovinich, N.; Burkel, B.; Stecha, S.; Bohorquez-Restrepo, A.; Ueda, T.; Eliceiri, K.W.; Grotewold, E.; Otegui, M.S. Anthocyanin vacuolar inclusions form by a microautophagy mechanism. Plant Cell 2015, 27, 2545–2559. [Google Scholar] [CrossRef]
  41. Gould, K.S.; Dudle, D.A.; Neufeld, H.S. Why some stems are red: Cauline anthocyanins shield photosystem II against high light stress. J. Exp. Bot. 2010, 61, 2707–2717. [Google Scholar] [CrossRef]
  42. Ayalew, B. Impact of shade on morpho-physiological characteristics of coffee plants, their pests and diseases: A review. Afr. J. Agric. Res. 2018, 13, 2016–2024. [Google Scholar]
  43. Bryant, D.A.; Frigaard, N.-U. Prokaryotic photosynthesis and phototrophy illuminated. Trends Microbiol. 2006, 14, 488–496. [Google Scholar] [CrossRef] [PubMed]
  44. Cakmak, I.; Römheld, V. Boron deficiency-induced impairments of cellular functions in plants. Plant Soil 1997, 193, 71–83. [Google Scholar] [CrossRef]
  45. Chen, M.; Chory, J.; Fankhauser, C. Light signal transduction in higher plants. Annu. Rev. Genet. 2004, 38, 87–117. [Google Scholar] [CrossRef] [PubMed]
  46. Zlatev, Z.S.; Yordanov, I.T. Effects of soil drought on photosynthesis and chlorophyll fluorescence in bean plants. Bulg. J. Plant Physiol. 2004, 30, 3–18. [Google Scholar]
  47. Shomali, A.; Aliniaeifard, S.; Bakhtiarizadeh, M.R.; Lotfi, M.; Mohammadian, M.; Sadi, M.S.V.; Rastogi, A. Artificial neural network (ANN)-based algorithms for high light stress phenotyping of tomato genotypes using chlorophyll fluorescence features. Plant Physiol. Biochem. 2023, 201, 107893. [Google Scholar] [CrossRef]
  48. Mehta, P.; Jajoo, A.; Mathur, S.; Bharti, S. Chlorophyll a fluorescence study revealing effects of high salt stress on Photosystem II in wheat leaves. Plant Physiol. Biochem. 2010, 48, 16–20. [Google Scholar] [CrossRef]
  49. Chaves, M.M.; Flexas, J.; Pinheiro, C. Photosynthesis under drought and salt stress: Regulation mechanisms from whole plant to cell. Ann. Bot. 2009, 103, 551–560. [Google Scholar] [CrossRef]
  50. Kocheva, K.; Lambrev, P.; Georgiev, G.; Goltsev, V.; Karabaliev, M. Evaluation of chlorophyll fluorescence and membrane injury in the leaves of barley cultivars under osmotic stress. Bioelectrochemistry 2004, 63, 121–124. [Google Scholar] [CrossRef]
  51. Shomali, A.; Lastochkina, O.V.; Mohammadian, M.; Rastogi, A.; Bosacchi, M.; Li, T.; Aliniaeifard, S. Photoinhibition in horticultural crops: An overview of the effect of light quality and signaling in the underlying photoprotection mechanisms. Int. J. Hortic. Sci. Technol. 2023, 10, 39–50. [Google Scholar]
  52. Willadino, L.; de Oliveira Filho, R.A.; da Silva Junior, E.A.; Neto, A.G.; Camara, T.R. Estresse salino em duas variedades de cana-de-açúcar: Enzimas do sistema antioxidativo e fluorescência da clorofila. Rev. Ciência Agronômica 2011, 42, 417–422. [Google Scholar] [CrossRef]
  53. Li, J.; Cang, Z.; Jiao, F.; Bai, X.; Zhang, D.; Zhai, R. Influence of drought stress on photosynthetic characteristics and protective enzymes of potato at seedling stage. J. Saudi Soc. Agric. Sci. 2017, 16, 82–88. [Google Scholar] [CrossRef]
  54. Broetto, F.; Duarte, H.M.; Lüttge, U. Responses of chlorophyll fluorescence parameters of the facultative halophyte and C3–CAM intermediate species Mesembryanthemum crystallinum to salinity and high irradiance stress. J. Plant Physiol. 2007, 164, 904–912. [Google Scholar] [CrossRef] [PubMed]
  55. Hazrati, S.; Tahmasebi-Sarvestani, Z.; Modarres-Sanavy, S.A.M.; Mokhtassi-Bidgoli, A.; Nicola, S. Effects of water stress and light intensity on chlorophyll fluorescence parameters and pigments of Aloe vera L. Plant Physiol. Biochem. 2016, 106, 141–148. [Google Scholar] [CrossRef] [PubMed]
  56. Shomali, A.; Aliniaeifard, S.; Didaran, F.; Lotfi, M.; Mohammadian, M.; Seif, M.; Strobel, W.R.; Sierka, E.; Kalaji, H.M. Synergistic effects of melatonin and gamma-aminobutyric acid on protection of photosynthesis system in response to multiple abiotic stressors. Cells 2021, 10, 1631. [Google Scholar] [CrossRef]
  57. Martinazzo, E.G.; Ramm, A.; Bacarin, M.A. The chlorophyll a fluorescence as an indicator of the temperature stress in the leaves of Prunus persica. Braz. J. Plant Physiol. 2012, 24, 237–246. [Google Scholar] [CrossRef]
  58. Mathur, S.; Mehta, P.; Jajoo, A. Effects of dual stress (high salt and high temperature) on the photochemical efficiency of wheat leaves (Triticum aestivum). Physiol. Mol. Biol. Plants 2013, 19, 179–188. [Google Scholar] [CrossRef]
  59. Sousaraei, N.; Mashayekhi, K.; Mousavizadeh, S.J.; Akbarpour, V.; Medina, J.; Aliniaeifard, S. Screening of tomato landraces for drought tolerance based on growth and chlorophyll fluorescence analyses. Hortic. Environ. Biotechnol. 2021, 62, 521–535. [Google Scholar] [CrossRef]
  60. Kalaji, H.M.; Oukarroum, A.; Alexandrov, V.; Kouzmanova, M.; Brestic, M.; Zivcak, M.; Samborska, I.A.; Cetner, M.D.; Allakhverdiev, S.I.; Goltsev, V. Identification of nutrient deficiency in maize and tomato plants by in vivo chlorophyll a fluorescence measurements. Plant Physiol. Biochem. 2014, 81, 16–25. [Google Scholar] [CrossRef]
  61. Liang, Y.; Chen, H.; Tang, M.J.; Yang, P.F.; Shen, S.H. Responses of Jatropha curcas seedlings to cold stress: Photosynthesis-related proteins and chlorophyll fluorescence characteristics. Physiol. Plant. 2007, 131, 508–517. [Google Scholar] [CrossRef]
  62. Zivcak, M.; Olsaovska, K.; Slamka, P.; Galambosova, J.; Rataj, V.; Shao, H.-B.; Kalaji, H.M.; Brestic, M.; Zivcak, M. Measurements of chlorophyll fluorescence in different leaf positions may detect nitrogen deficiency in wheat. Zemdirbyste-Agriculture 2014, 101, 437–444. [Google Scholar] [CrossRef]
  63. Porcar-Castell, A.; Tyystjärvi, E.; Atherton, J.; Van der Tol, C.; Flexas, J.; Pfündel, E.E.; Moreno, J.; Frankenberg, C.; Berry, J.A. Linking chlorophyll a fluorescence to photosynthesis for remote sensing applications: Mechanisms and challenges. J. Exp. Bot. 2014, 65, 4065–4095. [Google Scholar] [CrossRef] [PubMed]
  64. Shomali, A.; Das, S.; Arif, N.; Sarraf, M.; Zahra, N.; Yadav, V.; Aliniaeifard, S.; Chauhan, D.K.; Hasanuzzaman, M. Diverse physiological roles of flavonoids in plant environmental stress responses and tolerance. Plants 2022, 11, 3158. [Google Scholar] [CrossRef]
  65. Zhu, H.; Zhang, T.-J.; Zheng, J.; Huang, X.-D.; Yu, Z.-C.; Peng, C.-L.; Chow, W.S. Anthocyanins function as a light attenuator to compensate for insufficient photoprotection mediated by nonphotochemical quenching in young leaves of Acmena acuminatissima in winter. Photosynthetica 2018, 56, 445–454. [Google Scholar] [CrossRef]
  66. Agati, G.; Guidi, L.; Landi, M.; Tattini, M. Anthocyanins in photoprotection: Knowing the actors in play to solve this complex ecophysiological issue. New Phytol. 2021, 232, 2228. [Google Scholar] [CrossRef] [PubMed]
Figure 1. Chlorophyll a (A), chlorophyll b (B), total chlorophyll (C), total carotenoids (D), and anthocyanin (E) of green (G) and purple (P) varieties of basil exposed to different light intensities (100:100% sunlight, 50:50% of sunlight and 30:30% of sunlight) and harvested during different time courses of a day (G-M: Green basil harvested in the early morning, G-N: Green basil harvested at noon, P-M: Purple basil harvested in the early morning and P-N: Purple basil harvested at noon). Different letters (a–j) represent a significant difference among treatments (p < 0.05). Bars are means ± SE.
Agronomy 13 02478 g001aAgronomy 13 02478 g001b
Figure 2. Storage carbohydrate (A) and soluble carbohydrate (B) of green (G) and purple (P) varieties of basil exposed to different light intensities (100:100% sunlight, 50:50% of sunlight and 30:30% of sunlight) and harvested during different time courses of a day (G-M: Green basil harvested in the early morning, G-N: Green basil harvested at noon, P-M: Purple basil harvested in the early morning and P-N: Purple basil harvested at noon). Different letters (a–f) represent a significant difference among treatments (p < 0.05). Bars are means ± SE.
Agronomy 13 02478 g002
Figure 3. OJIP transient trend in green and purple varieties of basil exposed to different light intensities (100:100% sunlight, 50:50% of sunlight and 30:30% of sunlight) and harvested during various time courses of a day (full sunlight conditions (A), 50% of full sunlight (B), 30% of full sunlight (C)) and Purple (full sunlight conditions (D), 50% of full sunlight (E), 30% of full sunlight (F)) basil at different measurement time-points. Bars are means ± SE.
Agronomy 13 02478 g003
Figure 4. Maximum quantum yield of photosystem II (FV/FM) from the fluorescence transient exhibited by leaves of green (G) and purple (P) basil grown under different light intensities (100:100% sunlight, 50:50% of sunlight, and 30:30% of sunlight) and harvested at an additional time of day. Different letters (a–j) represent a significant difference among treatments (p < 0.05). Bars represent means ± SD.
Agronomy 13 02478 g004
Figure 5. The performance index in absorbance basis (PIABS) obtained from the fluorescence transient exhibited by leaves of green (G) and purple (P) basil plants grown under different light intensities (100:100% sunlight, 50:50% of sunlight, and 30:30% of sunlight) and harvested during various time courses of a day. Different letters (a–j) represent a significant difference among treatments (p < 0.05). Bars represent means ± SD.
Agronomy 13 02478 g005
Figure 6. Spider plot of OJIP test parameters derived from the fluorescence transient displayed by leaves of purple and green basil plants cultivated under various light intensities [full sunlight, 50%, and 30% light intensity of full sunlight] during different time courses of a day. The derived parameter values are displayed in comparison to the plants measured at 4 a.m.
Agronomy 13 02478 g006aAgronomy 13 02478 g006b
Figure 7. Non-Photochemical Quenching (NPQ) from the fluorescence transient exhibited by leaves of green (G) and purple (P) basil plants grown under different light intensities (100:100% sunlight, 50:50% of sunlight, and 30:30% of sunlight) and harvested during different time of day. Different letters (a–j) represent a significant difference among treatments (p < 0.05). Bars represent means ± SD.
Agronomy 13 02478 g007
Table 1. Light intensity (µmol m−2 s−1) under different shade levels and at different time courses of a day.
Time PointLight Intensity (µmol m−2 s−1)
100% of Sunlight50% of Sunlight30% of Sunlight
8 a.m.470 ± 52235 ± 31325 ± 43
121230 ± 155615 ± 73369 ± 47
5 p.m.650 ± 71325 ± 43195 ± 28
Disclaimer/Publisher’s Note: The statements, opinions and data contained in all publications are solely those of the individual author(s) and contributor(s) and not of MDPI and/or the editor(s). MDPI and/or the editor(s) disclaim responsibility for any injury to people or property resulting from any ideas, methods, instructions or products referred to in the content.

