Article

Calibration of Soil Moisture Sensors (ECH2O-5TE) in Hot and Saline Soils with New Empirical Equation

by
Ibrahim I. Louki
1,2 and
Abdulrasoul M. Al-Omran
1,*
1
Soil Science Department, College of Food and Agriculture Science, King Saud University, Riyadh 11451, Saudi Arabia
2
Al-Mohawis’s agriculture Farm at Thadiq, Thadiq 11953, Saudi Arabia
*
Author to whom correspondence should be addressed.
Agronomy 2023, 13(1), 51; https://doi.org/10.3390/agronomy13010051
Submission received: 4 November 2022 / Revised: 14 December 2022 / Accepted: 19 December 2022 / Published: 23 December 2022

Abstract

:
The use of soil moisture sensors is a practice applied to improve irrigation water management. ECH2O-5TE sensors are increasingly being used to estimate the volumetric water content (VWC). In view of the importance of the efficient use of these devices, six main factors affecting the accuracy of sensor measurements were studied: soil moisture levels, soil salinity, temperature, organic matter, soil texture, and bulk density. The study showed that the electrical conductivity of the soil and the temperature independently affect the measurements, while the influence of other factors interferes with that of salinity. This study found that the sensor measurements of the VWC were closest to the actual VWC at the soil ECe and temperatures of 2.42 dS m−1 and 25 °C, with root-mean-square errors (RMSE) of 0.003 and 0.004 m3 m−3. Otherwise, the measured VWC values of these sensor readouts significantly overestimated the actual VWC, with an increasing soil ECe and/or producing temperatures higher than the stated values, and vice versa. Given the importance of these sensors for obtaining accurate measurements for water management, a simplified empirical equation was derived using the data collected from a wide range of measurements to correct the influences of electrical conductivity and temperature on the measurement accuracy of the sensors, while considering the influence of the soil’s texture. Thus, the following equation was proposed: ϴva =   θ vs a E C e 2 + b E C e + c + d T 2 + e T + f 1 . The results concerning the measurement of different VWC levels via these sensors and the proposed L&O correction equation were compared with the corresponding actual VWC values determined by gravimetric methods. It was found that this empirical equation reduced the differences in the RMSE between the sensor readings for the VWC and the actual VWC from 0.072 and 0.252 to 0.030 and 0.030 m3 m−3 for 1 and 5 dS m−1, respectively, with respect to the EC’s influence at 25 °C and reduced the RMSE from 0.053 and 0.098 to 0.007 and 0.011 at 3 and 50 °C, respectively, regarding the effect of the temperature at EC 2.42 dS m−1 at different levels of the actual VWC values.

1. Introduction

The key to irrigation water conservation, irrigation management, irrigation scheduling, and precision agriculture is the determination of the soil’s moisture content. However, it is not practical to estimate the volumetric water content (VWC) via gravimetric methods for daily irrigation. Therefore, sensors must be installed to consistently measure the VWC level around the roots in a precise manner so that losses of water by the plant can be compensated in a timely manner. ECH2O-5TE sensors (METER Environment, formerly Decagon Devices, Inc., Pullman, WA, USA) which are increasingly used around the world, simplify the process because they are economical, smaller in size, they ensure fast and easy installation, and provide three measurements in one, namely, the bulk EC, VWC, and the soil temperature; thus, these sensors were selected for this study. Some studies [1,2,3,4,5,6] have reported that 5TE sensors have high suitability in agricultural fields when using the proposed calibration methods. The main perturbation of these sensors is that their measurements are only accurate in a limited range of soil environmental conditions. Numerous studies [1,2,3,4,5,6] have concluded that none of the low-cost sensors possess a level of performance consistent with the manufacturer’s specifications. Further studies [6,7,8,9] attributed this to the fact that these sensors (including ECH2O-5TE) are affected by the conditions of the soil environment. Mittelbach et al. (2011) [7] found that the sensor’s accuracy is inversely proportional to the soil water content (SWC) and is not sensitive if the SWC exceeds 40%. Ali et al. (2016) [10] found that the soil content of organic matter has a significant and independent influence on the accuracy of the tested sensors, and therefore, must be considered. Various studies have indicated that the accuracy of low-cost sensors is affected by the soil’s electrical conductivity [6,11,12,13,14,15,16] and temperature [6,10,15,16,17,18,19]. McCann et al. (2014) [8] reported that Decagon® 5TE sensors responded well to changes in moisture, temperature, and EC, but increased their moisture measurements at an EC concentration greater than 10 dS m−1. Many researchers confirmed the need to calibrate moisture sensors in situ for better accuracy [20,21,22,23,24]. Sakaki et al. (2011) [25] examined a rapid and effective method for calibrating dielectric soil moisture sensors of the ECH2O type by applying a two-point α-mixing model. These sensors reported high r2 values. Rosenbaum et al. (2010) [20] proposed that the calibration of ECH2O, EC-5, TE, and 5TE sensors should be divided into two parts: (1) the determination of sensor response–permittivity relationships using standard liquids with a defined reference permittivity, and (2) site-specific calibration between the permittivity and soil water content using a subset of sensors. Consequently, it was found that an improvement in accuracy can be achieved by calibrating each sensor separately. Schwartz et al. (2013) [26] evaluated the influence of soil permittivity on EC when employing TDR and 5TE with the use of calcium chloride salt (CaCl2) and found that the size and direction of the permittivity response varies greatly when the measuring instrument and soil quality varied. George et al. (2017) [27] found that the relationship between the square root of the EC (εs) and the soil water content (Ɵv) was dependent on the soil quality for low-operating-frequency sensors. Kizito et al. (2008) [28] reported that the frequency of the sensors (f), including the family of ECH2O sensors (EC-5 and ECH2O-TE), is the primary factor affecting their sensitivity to soil properties, and that 70 MHz was effective for measuring soil moisture. Kargas et al. (2014) [29] evaluated the impact of selected sensors’ frequencies (WET, 5TE, and ML2 sensors) on their accuracy in different types of soils and water qualities. It was found that the higher the frequency (f), the higher the reading accuracy and the lower the influence of EC on the measurements. This provides a possible criterion for the selection of sensors. Vaz et al. (2013) [30] evaluated standard calibration functions for nine different soil moisture sensors including (5TE) and found that, in general, low-frequency sensors are less expensive but more sensitive to the troublesome influences of the EC, temperature, and relative variability of the soil. Numerous researchers have derived many calibration equations for different factors that affect sensor measurement accuracy in situ [3,9,17,21,23,27,31,32]. Some of the researchers employed special equations to mitigate the influence of specific factors such as soil’s EC on measurement accuracy [11,12,13,14,33,34], eliminate the influence of temperature [35,36,37,38,39,40,41,42], or reduce the influence of soil density and texture [43] on the accuracy of the measurements of these sensors. Varble and Chávez (2011) [11] conducted a study using (CaCl2) to report on the influence of EC on the readings of a set of soil moisture sensors, including (5TE) sensors, and developed a linear equation that minimizes the manufacturer error.
The main objectives of this study were to investigate the influence of soil environment factors on the measurement accuracy of ECH2O-5TE sensors, in particular, (1) the soil moisture content levels, (2) soil electric conductivity, (3) soil temperature, (4) soil organic content, (5) soil texture, and (6) soil bulk density. Furthermore, this study also sought to formulate a simple equation corresponding to the results of these experiments with which to correct the influence of the mentioned factors on the ECH2O-5TE sensor’s measurement accuracy.

2. Materials and Methods

This study was conducted at the Department of Soil Sciences, College of Food and Agricultural Sciences, King Saud University, Riyadh, Saudi Arabia, and Al-Mohawis’s agriculture Farm at Thadiq, Saudi Arabia at (25.28500 N, 45.88363 E) and an altitude of 722 m above sea level.

2.1. Measurement Instruments

(1) 5TE: A total of 12 ECH2O-5TE sensors were used with 3 Em50 data loggers (METER Group, Inc., USA, formerly Decagon) as shown in Figure 1. (2) Em50 data logger: A 5-channel, self-contained data recorder designed for use with any ECH2O sensor. Two types of output data can be obtained by the device: raw count (unprocessed data) and processed data, which are converted to volumetric water content (m3 m−3) that is ready to use directly.

2.2. Soil

Three groups of soils were used in this study:
A.
In general, to test the influence of the factors, sandy loam soil was used as shown in Table 1 and Table 2.
B.
For specific experiments, to test the influence of soil texture on sensor measurement accuracy, two types of soils were used, as shown in Table 3. These soils were used alone or were mixed, according to the required percentages for the specific experiment.

2.3. Water

Two types of water were used in this experiment:
A.
Distilled water was used to test the influences of all mentioned factors except the decreasing salinity (EC) from bovine compost by leaching.
B.
Available irrigation water was used to remove the salinity from bovine compost by leaching. A water analysis is presented in Table 4.

2.4. Sporadic Materials and Devices Used

An electric oven, electronic balance, large normal scale, laptop, gas cylinder and stove for heating samples, refrigerator for sample freezing, 20 L pots, cans for drying samples, density tube, heating pots, other tools, and sodium chloride salt.

2.5. Bovine Compost

Bovine compost named Asas-Almazraa from the Al-Safi Organic Fertilizer Factory at Riyadh, Saudi Arabia, was used and analyzed according to the method described by [44]. The organic matter content was determined by the Walkley and Black procedure [45]. The average chemical properties of the compost used in this study are presented in Table 5.

2.6. Measuring VWC by Gravimetric Method and Sensors

The soil volumetric water content was determined by a gravimetric method as described by [46] and was measured by sensors. The sensor output of the processed data were converted from the raw data internally into values of volumetric water content as (m3 m−3), electric conductivity (dS m−1), and temperature (°C). The factory calibration was used in this study to investigate the results and obtain a correction equation. Sensors were inserted vertically into a 20 L plastic pot containing 17 kg of a soil sample at 15 cm in depth for a period of 15 min. An ECH2O-5TE sensor was connected to a continuous data logger (model EM50) and programmed to collect readings at 1 min intervals in order to determine the soil water content for soil moisture and EC tests.

2.7. Soil Moisture Level Impact on Sensor’s Measurement

Three groups of soil with different EC (1, 2.42, and 5 dS m−1) were prepared as described in the soil EC influencing section. Eight levels of water were added to each group (4, 12, 16, 19, 20, 23, 25, and 28% w/w). The sensors were inserted vertically into the soil samples and readings of the volumetric water content were taken at approximately 25 °C, while the actual VWC was measured by the gravimetric method by inserting a known-volume cylinder into the soil until the top edge of the cylinder was flush with the soil. Then, the cylinder was placed in a metal tin. The metal tins were immediately weighed and oven dried at 105 °C for 24 h; the metal tins were subsequently reweighed [46]. The water mass in the sample was converted to volumetric water content using both soil bulk density and the water density. The influences of soil moisture levels on the sensor’s measurement accuracy at temperatures of 3, 25, and 50 °C were measured for comparison. The measurements of soil moisture content were carried out at seven levels of water on the soil experiment (2, 5, 10, 14, 17, 22, and 27% w/w) at an EC of 2.42 dS m−1.

2.8. Soil Salinity (EC) Impact on Sensor’s Measurement

2.8.1. Preparing Soil Sample with Gradated Concentration Salt

The soil salinity concentration was expressed as the electrical conductivity (EC) in saturated soil paste as a reference regardless of the soil moisture content. Total of 100 quantities of sodium chloride ranging from 0.54 g to 54 g were weighed. Each quantity was dissolved in water and added to 17 kg of soil in a plastic pot and mixed well. The mixing was done on a plastic sheet and then air-dried. The ECe of the saturated soil paste for each mixed soil sample was determined and recorded as a reference. These mixed soils were used as an empirical soil sample for testing soil salinity factor.

2.8.2. Testing and Sampling Method

To study the salinity influence on these sensors, the prepared soil with NaCl was used in five levels of VWC. Each 17 kg of soil was placed in a 20 L plastic pot and mixed with 750 mL of distilled water at temperature close to 25 °C (by mixing heated and cold water), and the sensor was inserted vertically at 15 cm in depth for a period of 15 min. The ECH2O-5TE sensor was connected to a continuous data logger (model EM50, Decagon Devices, Inc., Pullman, WA, USA). The EM50 data logger was programmed to collect readings at 1 min intervals. Two gravimetric method soil samples were taken by a cylinder of known-volume inserted beside the sensor and placed in a metal tin. The metal tins were immediately weighed and oven dried at 105 °C for 24 h; the cylinders were subsequently reweighed [46]. The soil gravimetric water content was converted to volumetric water content by using both soil density and water density. The second, third, and fourth tests were added cumulatively at every testing time using 750 mL of distilled water at 25 °C in the same pot and examined in the same manner as the first test. For the final test, enough water was added to saturate the testing soil and was then tested.

2.8.3. ECe & ECa Testing

The electrical conductivity of the saturated soil paste (ECe) measured by the sensors was used as a steadier reference to investigate the influence of EC on the sensor’s measurement accuracy, instead of the apparent electrical conductivity (ECa) by the sensor readings at different levels of VWC. Thus, in this study, the EC indicates the soil electrical conductivity in saturated soil paste regardless of the soil moisture content.

2.8.4. Comparison of the VWC Measured by Sensors and by Gravimetric Method

The actual VWCs of 1000 samples (20 samples daily) were determined by the gravimetric method. The sensor reading of VWC at 25 °C at each EC concentration point vs. the actual VWC values were determined. The VWC values measured by sensors were compared with the actual VWC at each EC level.

2.9. Soil Temperature Impact on Sensor’s Measurement

A quantity of soil in an oven and a quantity of distilled water were heated to 60 °C. One of 7 quantities of heated water (0.4, 0.9, 1.6, 2.3, 2.9, 3.7, and 4.5 kg) was added to each 17 kg of the heated soil, then mixed well and placed in a 20 L pot. Then, the sensors were immediately inserted vertically into the soil sample, and two samples for VWC measurement were determined by the gravimetric method. Then, the pot was rapidly covered by nylon and a plastic sheet and was tightened with adhesive tape to keep the moisture inside the pot fixed by preventing the exchange of air currents with the outside. The sensors were adjusted at 2 min intervals. The temperature of the soil sample for each pot in the final measurement was close to 50–55 °C. The soil samples were placed in a freezer to cool for 24 h. Then, soil samples were brought out and left to return to the ambient temperature. The soil samples were opened, and two soil samples were taken immediately for drying in the oven. The actual VWC for each soil sample was determined.

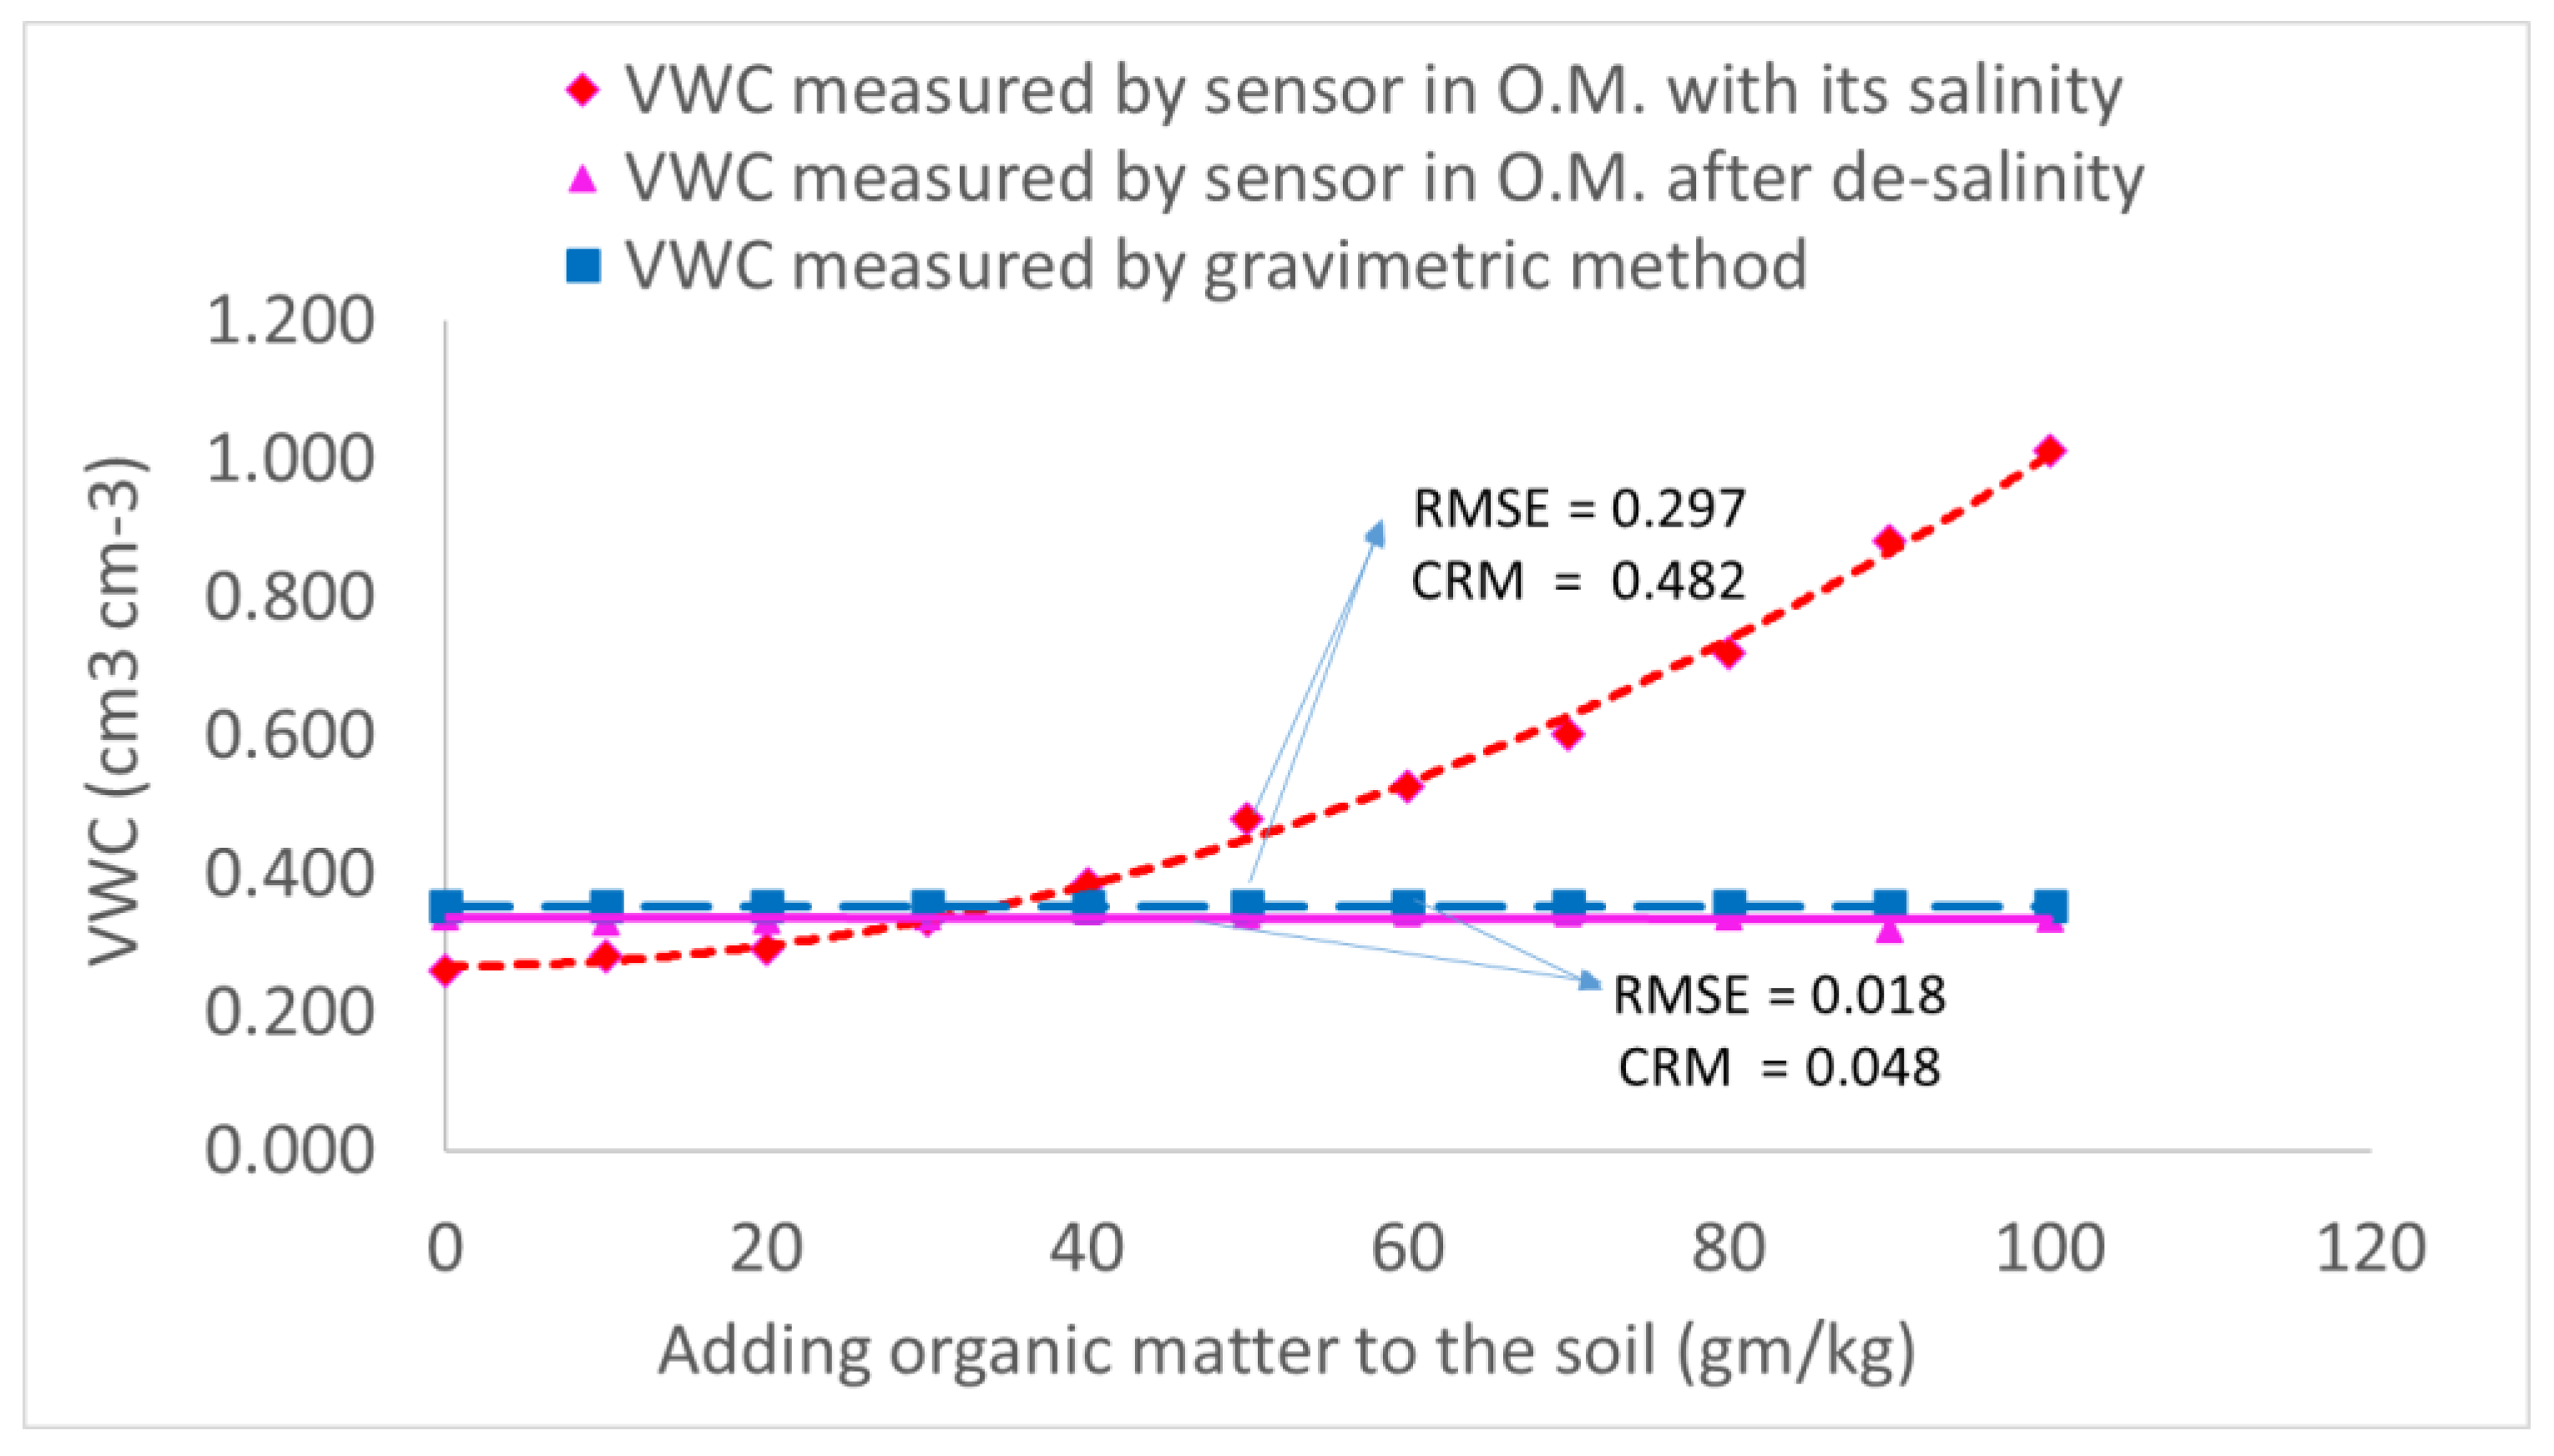
2.10. Bovine Compost Impact on Sensor’s Measurement

Two types of compost were used: high-EC compost (18 dS m−1) before leaching, and low-EC compost (1.8 dS m−1) that reduced its EC by leaching. The compost EC was reduced using tap water (EC = 0.98 dS m−1), filtering with a cloth bag from 18 dS m−1 until it reached 1.8 dS m−1, and then the compost was air dried. The empirical soil EC (Table 1) was adjusted to the same compost EC by NaCl. The soil samples were then sequentially subjected to 10 different compost rates of 10, 20, 30, 40, 50, 60, 70, 80, 90, and 100 g compost per kg of soil using both high- and low-EC compost, with 10 pots for each experiment. A total of 4 water rates of 60, 120, 180, and 240 mL kg−1 were used by adding 60 mL water per kg of soil cumulatively. After the compost and the soil with the appropriate water rate were well mixed and put into a 20 L pot, the sensor was vertically inserted in each pot at a depth of 15 cm for 15 min and measured at 2 min intervals at each testing point. Two soil samples were taken for actual VWC measurement by a gravimetric method at each testing point. Finally, the average of the sensor readings of the VWC before and after removing EC from the compost was compared to the actual VWC in both cases.

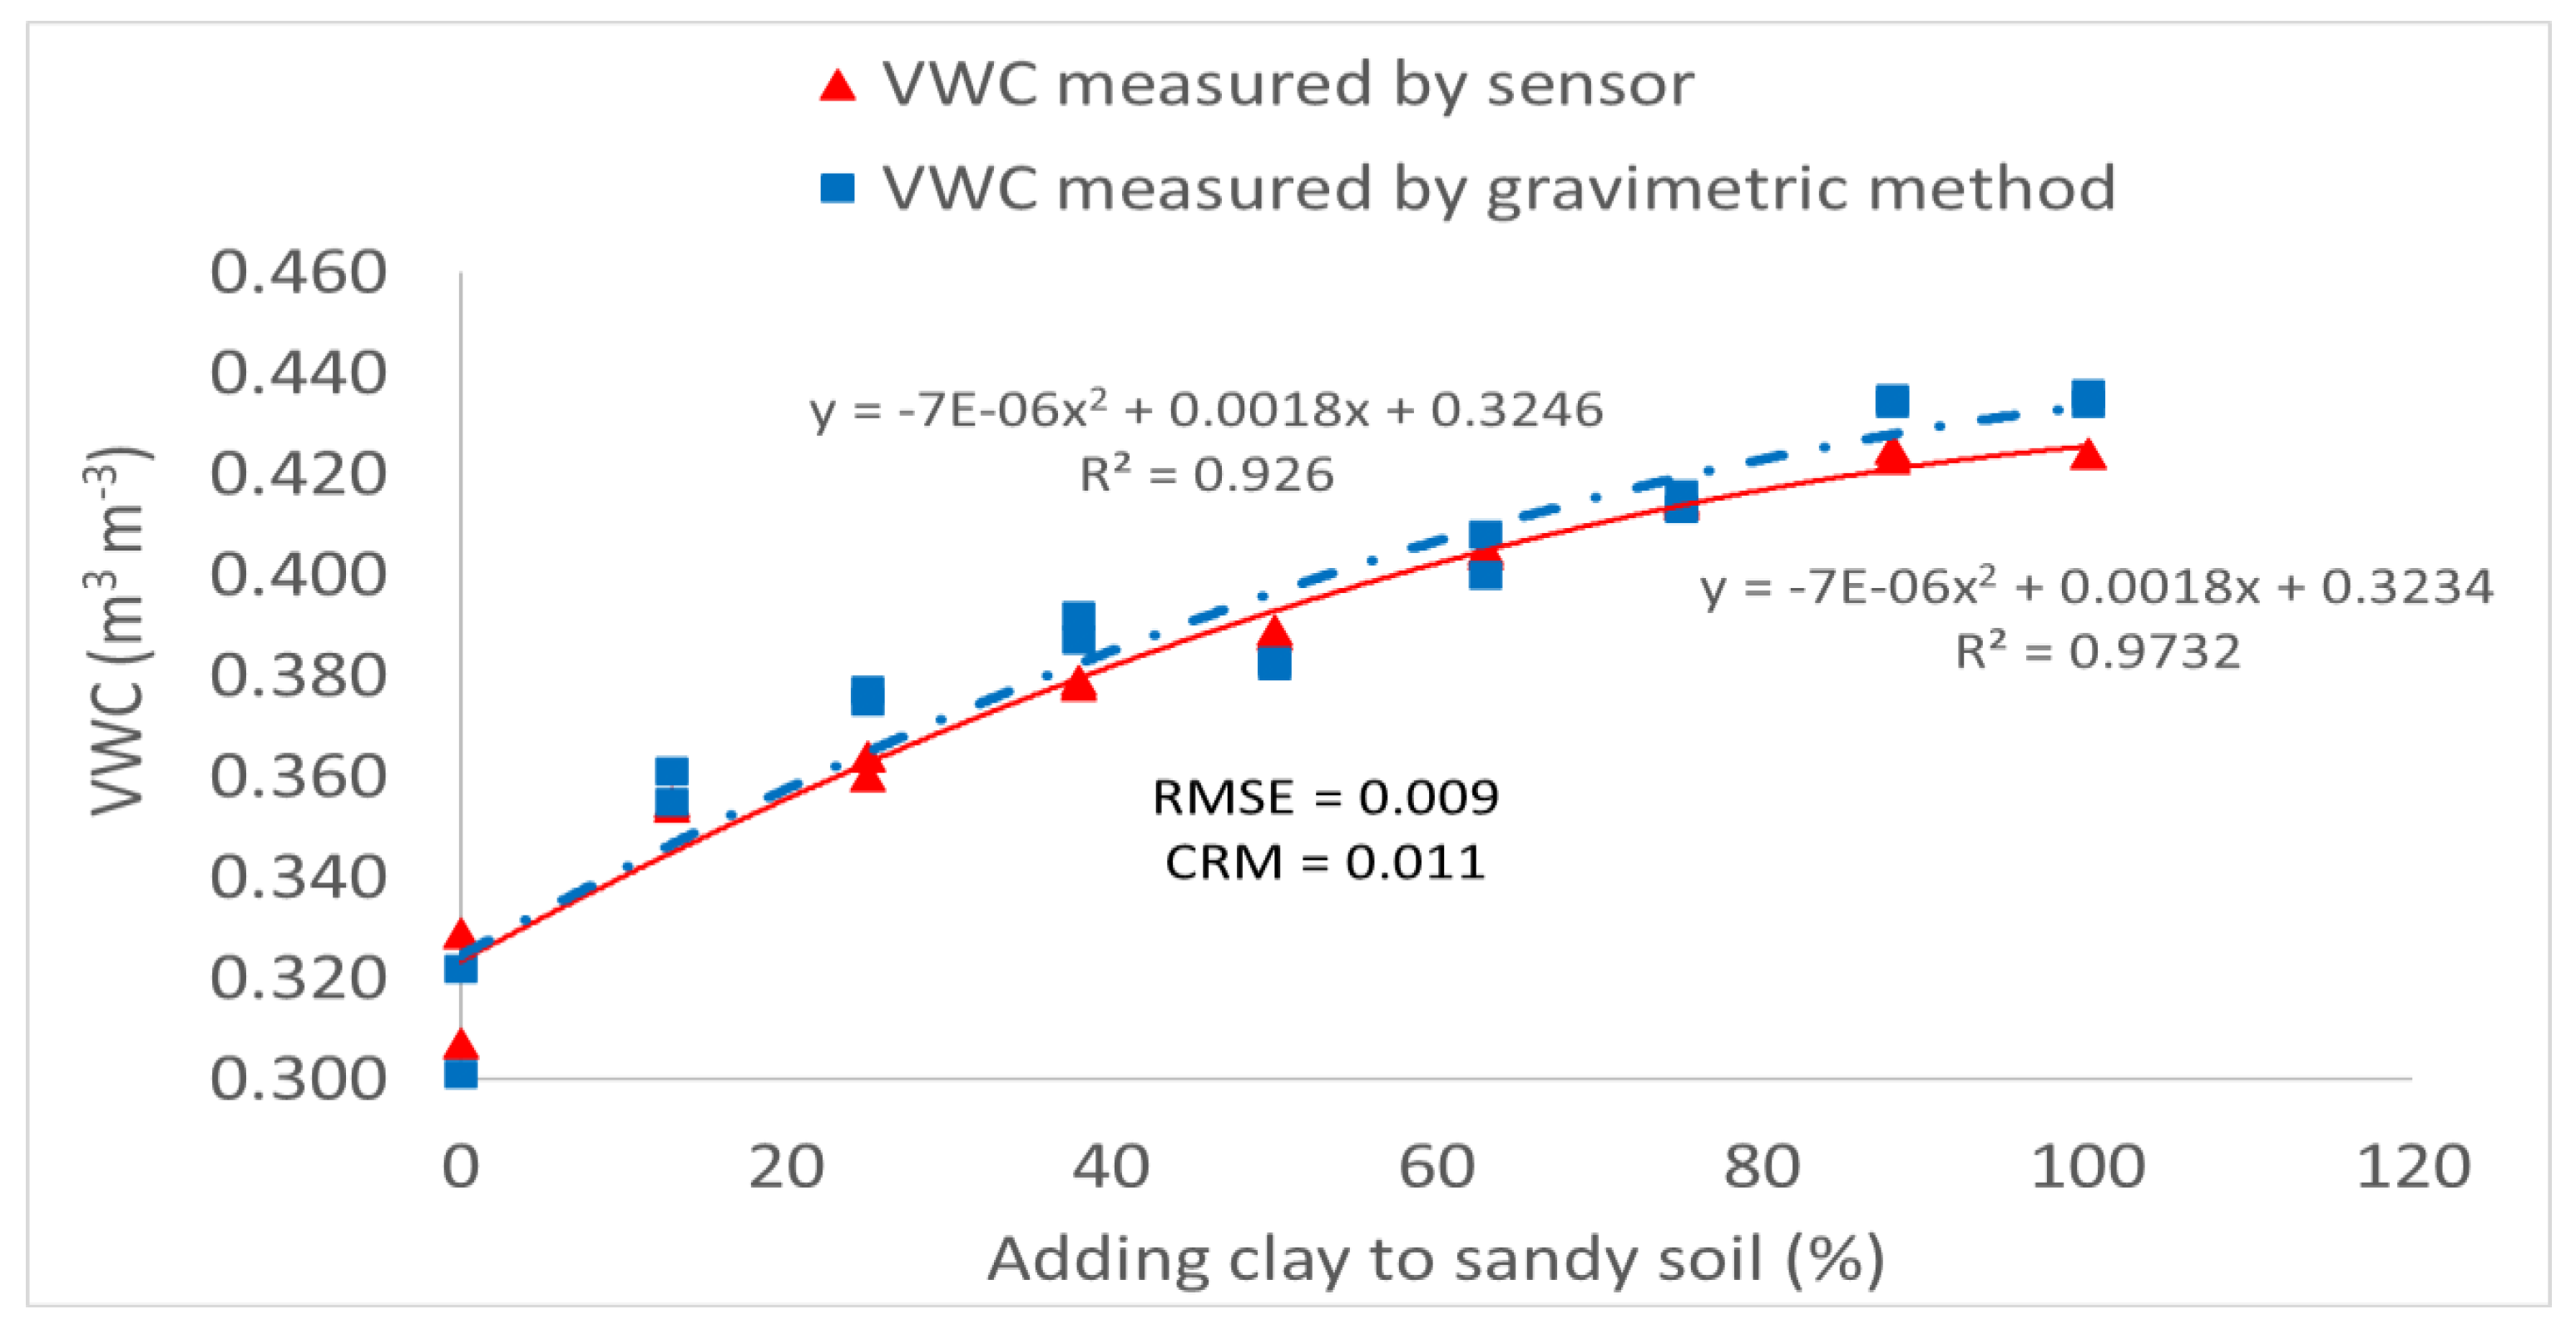
2.11. Soil Texture Impact on Sensor’s Measurement

Two types of soil were mixed to form soil sample: sand from dunes and clay sediment from a dam at 11 rates, to test the textures impact on sensor’s measurement accuracy. The clay soil was added to the sand soil gradually, by 10% of the total sample at each time, cumulatively until the testing sample had a 100% clay texture. Each sample was mixed and placed in a 20 L pot. The mixture soil was tested by two sensors at a depth of 15 cm for 15 min, and at 2 min intervals for the sensor readings at four levels of moisture. The VWC by sensors and the actual VWC by the gravimetric method at different clay content points were compared.

2.12. Soil Bulk Density ( ρ b ) Impact on Sensor’s Measurement

Three prepared soils at different concentrations of EC (1.4, 2.5, and 6.0 dS m−1) at four levels of VWC (60, 120, 180, and 240 mL per kg of soil) were used to test the influence of the soil bulk density. Two procedures for determining soil volume were conducted: (1) using a soil volume cylinder for the common gravimetric measurement method, and (2) changing the entire soil volume in a gradual cylindrical known-volumetric container by a mechanical pressing-down plate with two holes for the sensors. The total weight and total volume at every testing point were determined, and then the average ρb was taken. After adding the appropriate amount of water to the soil, this was mixed thoroughly, to confirm that the moisture was uniformly distributed throughout the container. Then, two sensors were installed in the container, and measuring started, by sampling via the gravimetric method as mentioned after every pressing. The desired ρb levels were achieved by pressing and changing the soil sample volume with a constant weight. The output of the sensors was then taken at different ρb levels. The VWC determined by the sensors and gravimetric methods at different points of the bulk density were compared. This experiment, which used three EC concentrations at four moisture levels, was then repeated twice.

2.13. Statistical Analysis

Four statistical indicators were used to evaluate the sensor measurements of VWC values: the coefficient of determination (r2), root-mean-square error (RMSE), relative root-mean-square error (RRMSE), and coefficient of residual mass (CRM). These measurements were determined by the sensor-based manufacturer and by proposed calibration equations against the actual VWC values determined by the gravimetric method. The root-mean-square error was calculated as:
RMSE = 1 n i = 1 n M s i M g i 2 0.5  
where Msi is the soil water content determined by the sensor based on the factory numbers or calculated by proposed calibration equation, Mgi is the real soil water content determined by the gravimetric method, and n is the number of measurement points. The relative root-mean-square error, proposed by Loague and Green (1991) [47] is calculated as:
RRMSE = 1 n i = 1 n M s i M g i 2 0.5 × 100 M g  
where Mg is the corresponding mean of the gravimetric measurement, calculated as:
M g = 1 n i = 1 n 100 M g i  
The coefficient of residual mass (Loague and Green, 1991) [47] is calculated by
CRM = i = 1 n M g i i = 1 n M s i i = 1 n M g i  
Positive values of CRM indicate that the sensor underestimates, and negative values indicate that the sensor overestimates of VWC. For a perfect fit between gravimetric method and sensor values or obtained values by proposed L&O equation, the values of RMSE and CRM should approach or equal zero. In addition, a statistical analysis using a statistical package for social sciences (IBM SPSS Statistics for Windows, Version 19.0, Armonk, NY, USA: IBM Corp., 2010) [48] was carried out.

3. Results and Discussion

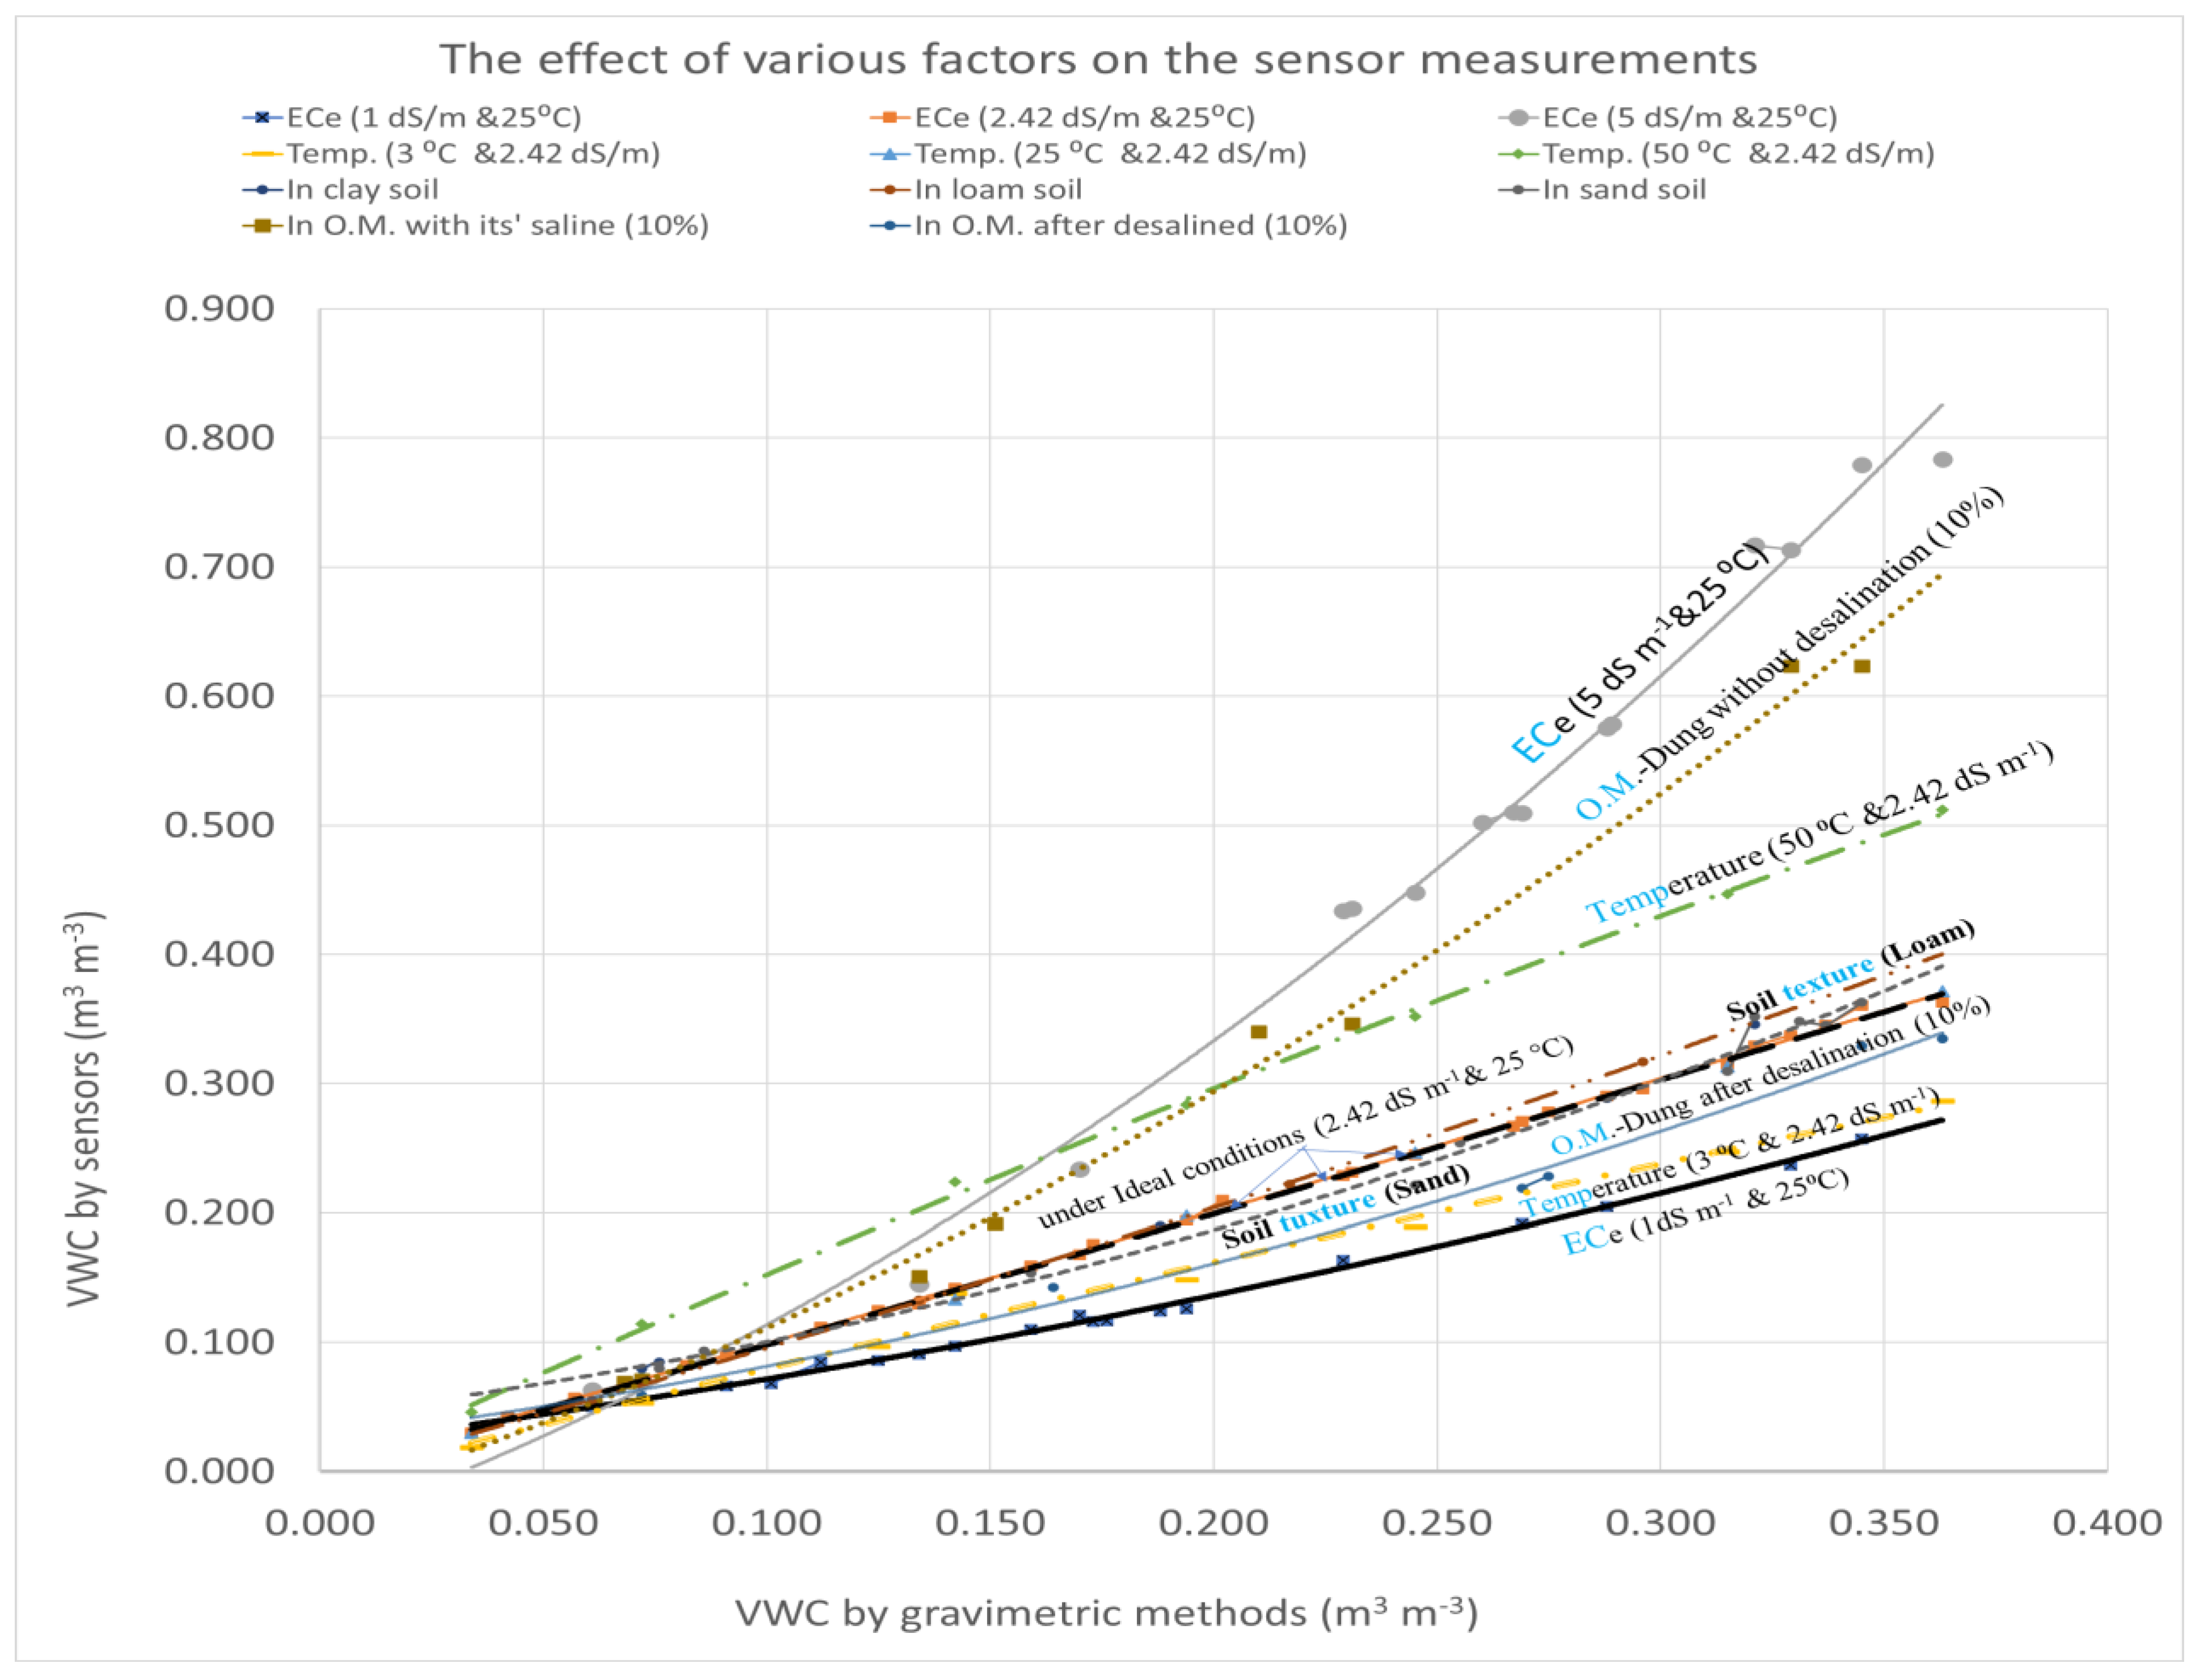
3.1. Combining the Analysis Results with the True Values Measured by the Gravimetric Method under Different Constraints

Figure 2 shows five factors influencing the sensor’s measurement under different conditions. It is clear from the figure the influence of salinity and temperature on the measurements, with an increasing or decreasing VWC.

3.2. Influence of Soil Moisture Content on 5TE Sensor Measurement Accuracy

Figure 3 and Figure 4 show that the influence of different factors on the sensor reading accuracy depends on the soil moisture level, the EC level, and the temperature. There was no significant impact on the measurement’s accuracy when the EC and temperature of the soil were 2.42 dS m−1 and 25 °C, respectively. However, the differences between the sensor readings and the real soil moisture content increased with increasing soil moisture levels, just as much as the differences in the soil EC and its temperature increased away from the indicated limits. This result agreed with the studies of Heidi et al. (2012) [1], that the accuracy of soil moisture sensor measurements is inversely proportional to the soil moisture content.

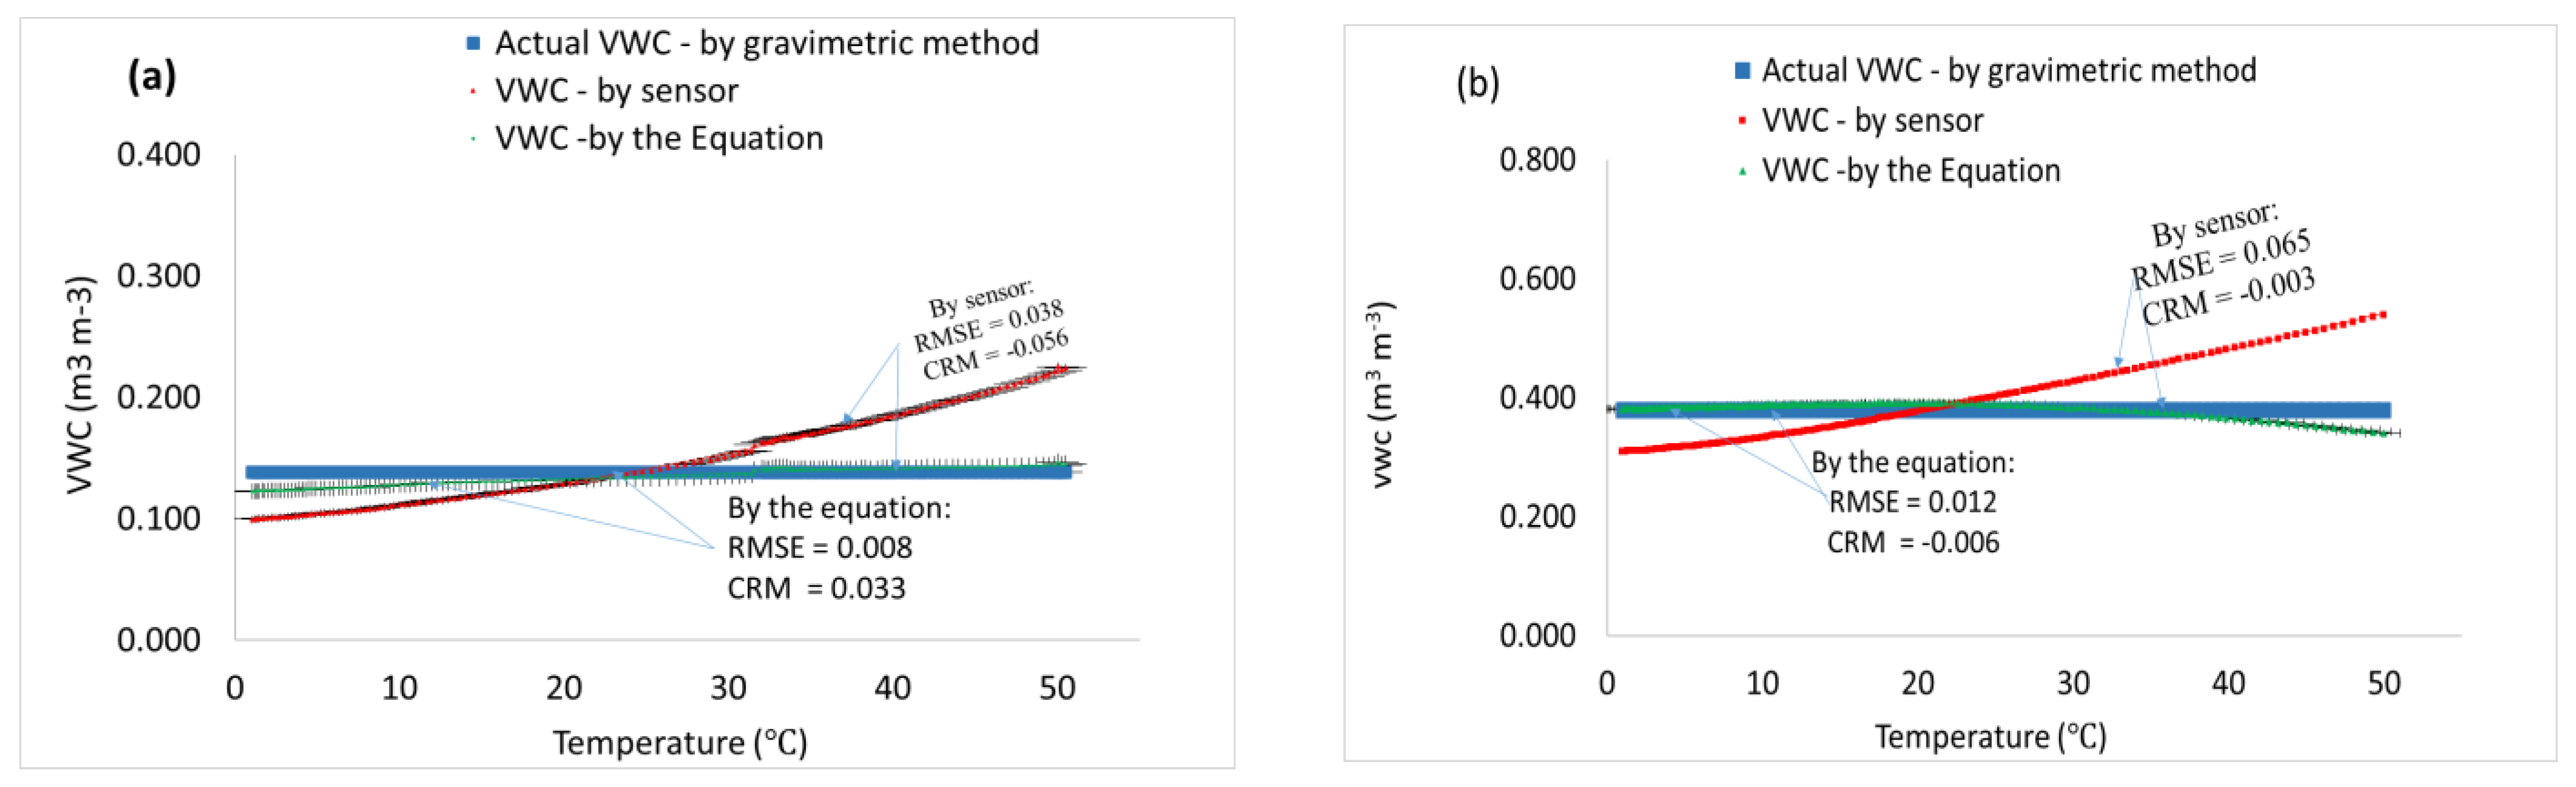
3.3. Influence of Soil Temperature on Sensor Measurement Accuracy

The sensor measurement accuracy of the VWC under different soil temperatures (from 0 to 50 °C) at a fixed EC of 2.42 dS m−1 was tested. Figure 5 shows that the measured VWC-value line intercepts the real-value line when the soil temperature was about 25 °C. However, the sensor readings were under- or overestimated when the soil temperature was lower or higher than 25 °C, respectively. This result agreed with many reported studies [10,11,14,41,42,43].

3.4. Influence of Organic Matter Content on Sensor Measurement Accuracy

Figure 6 shows that the sensor measurement accuracy, by the continuous addition of bovine compost containing its primary EC (18 dS m−1) to the testing soil at about 25 °C, was affected. With decreasing the compost salinity by leaching (EC = 1.8 dS m−1), there was no significant influence of compost addition (until 10% w/w) on the sensor measurement accuracy [6]. Some studies reported an independent influence of organic matter on sensor readings [10].

3.5. Influence of Soil Texture on Sensor Measurement Accuracy

This study focused on the addition of clay deposits to sand from dunes in order to form the required soil texture to investigate the influence of soil texture on the sensor measurement accuracy. Figure 7 shows that when the soil salinity level was fixed in both soils (at 2.45 dS m−1) and the temperature was at 25 °C, the influence of the gradual sand clay addition on the sensor accuracy was unsignificant but could be considered. However, its influence was clearly observed when the soil EC values deviated from the indicated limits. Nevertheless, these results do not contradict those of other studies that reported on the influence of clay on sensor readings. For example, Fernando et al. (2014a) [12] reported that sensor measurements in clay soil in an open field were overestimated, and Schwartz et al. (2013) [16] noted that soil permittivity is high in clay soils because of the increased concentration of soluble minerals compared to sandy soil in the same conditions, as well as the influences of saturation capacity and cation exchange capacity.

3.6. Influence of Soil Bulk Density on Sensor Measurement Accuracy

As illustrated in Figure 8, there was no significant influence of soil density on the sensor’s accuracy when the measurements were made at the soil EC of 2.42 dS m−1, while its influence was clearly observed when the values of the soil ECe deviated from the indicated limits. An increased or decreased EC level from the mentioned limit resulted that the sensor was over- or -underestimating the VWC values with the bulk density.

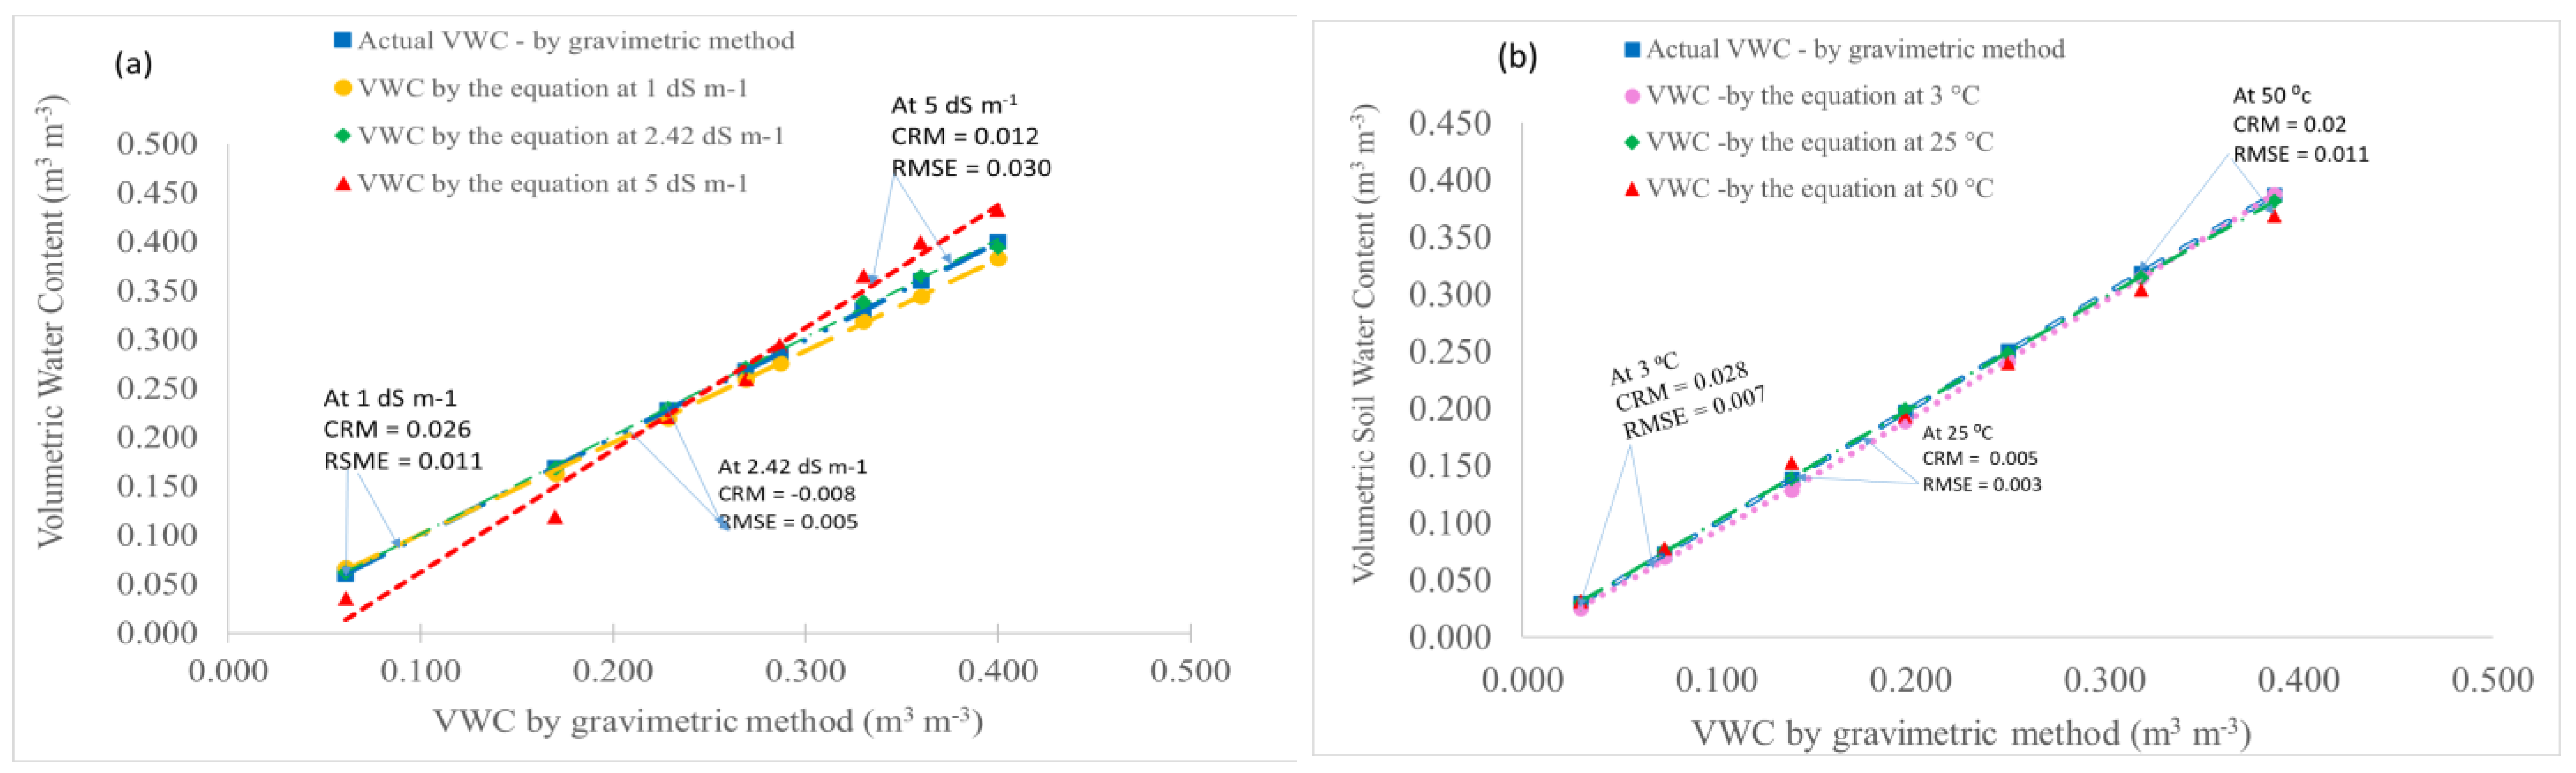
3.7. An Empirical Equation to Correct the Influence of EC and Temperature

Since there is a systematic relationship between the more affected factors (EC and temperature) and the sensor measurements, a multivariate polynomial empirical equation [Equation (5)] was developed to correct the sensor measurements of VWC values to the real VWC values immediately in situ. The concept of this equation is based on the direct use of the sensor’s output, which is internally processed data by the factory (instead of a raw count), because it is easily corrected by using the following equation:
ϴ v a = θ vs a E C e 2 + b E C e + c + d T 2 + e T + f 1  
whereas:
ϴva: Actual VWC (m3 m−3).
ϴvs: Sensor’s measurement of VWC (m3 m−3).
ECe: Electrical conductivity of the saturated soil paste (dS m−1) by sensors.
T: Soil temperature (°C) as measured by sensors.
a, b, c, d, e, and f are the equation constants depending on the soil texture.
Table 6 show the average values of the proposed L&O correction equation parameters for different soil textures.

3.8. Testing the Empirical Correction Equation

The influence of salinity and temperature with the correction equation on the sensor measurement accuracy of VWC values was tested at different statuses. Table 7 showed a correction test of the proposed L&O correction equation with the sensor measurements under different salinity concentrations and temperatures at different levels of moisture.

3.8.1. Testing Equation Performance with Increased Soil Moisture

Figure 9 shows a comparison between the actual VWC values measured by the gravimetric method and the VWC calculated by the proposed L&O correction equation in graded soil with increasing moisture at three levels of EC and temperature. Using Table 8, the RRMSE decreased with the proposed L&O correction equation from 31.2 and 109.4% to 4.3 and 11.5% at 1.0 and 5.0 dS m−1 soil salinity, respectively, and from 26.8 and 49.1% to 3.3 and 5.7% at 3 and 50 °C soil temperature, respectively.

3.8.2. Testing Equation to Correct Influence of Electric Conductivity (EC) at 25 °C

Figure 10 shows that the VWC values calculated by the proposed L&O correction equation were closest to the actual VWC as the EC gradually changed. According to Table 9, it appeared that the RRMSE decreased when using the proposed L&O correction equation from 49.2 and 53% to 6.6 and 5.3%, at the field capacity and saturated point, respectively.

3.8.3. Testing L&O Equation to Correct Influence of Temperature at ECe of 2.42 dS m−1

Figure 11 shows a comparison between the sensor measurements of VWC values by the gravimetric method and those calculated using the L&O equation. In Table 9, it seems that the RRMSE was reduced from 27.8 and 17.2% to 6.1 and 3%, respectively.

3.8.4. Testing Equation with Graded EC at Low and High Temperatures

Figure 12 shows a comparison between the VWC values measured by the sensor, the actual VWCs, and the VWC values calculated by the proposed L&O correction equation with a gradual change in the soil EC at (a) 5 °C and (b) 38 °C. A statistical analysis in Table 9 illustrates that the RMSE was decreased from 35.6 and 90.1% to 2.5 and 3% when using the proposed L&O equation.

3.8.5. Testing Equation to Correct for Influence of Both Temperature and Low or High EC

Figure 13 shows a comparison between the VWC values measured by the sensor, the actual VWC, and the VMC values resulted from the proposed correction equation as the temperature gradually changed at (a) 1.55 dS m−1 at low moisture and (b) 4.62 dS m−1 at the field capacity moisture. A statistical analysis in Table 9 indicates that the RMSE was decreased from 24.3 and 96.7% to 5.4 and 11.2%, respectively, when using the proposed L&O equation.

3.8.6. Multiple Comparisons

An analysis of variance (ANOVA) was performed using SPSS Statistics [48] in order to make multiple comparisons between the sensor readings of the VWC as measured by the gravimetric method and the results calculated by the proposed L&O correction equation using multiple comparisons: least significant difference (LSD) and a Dunnett t-test. The results presented in (Table 10) indicate significant differences between the average of the sensor readings and the actual VWC, at a salinity and temperature of 4.48 dS m−1 and 36.7 °C, respectively. There were no significant differences between the actual VWC values and the calculated values of the VWC by the proposed L&O correction equation using the same sensor readings.

3.8.7. Correlations

The correlation test results using the Pearson correlation are listed in Table 11. A strong significant correlation between the sensor readings of VWC values and the soil EC levels is indicated, while no statistically significant correlation is shown between the soil EC levels and the actual VWC, or the calculated values of VWC by proposed L&O equation.

4. Conclusions

The influence of six factors on the measurements of soil moisture sensors type ECH2O-5TE were studied and their influences were observed. These factors have a direct effect on the VWC measurements at varying proportions, but the influence of the salinity and temperature factors on the accuracy of these sensor measurements was the clearest, while the other factors interfered with their influence on soil salinity concentrations. These sensors worked properly in soil salinity and a temperature within 2.42 dS m−1 and 25 °C, respectively. In general, acceptable results were obtained by this sensor (using processed data by manufacturer programming) when the soil salinity and temperature ranged between 1.9–2.75 dS m−1 and 16–30 °C, respectively. A simplified empirical equation has been proposed to correct the influence of both salinity and temperature with special parameters that take the soil texture into account. This proposed L&O correction equation reduced the RMSE on the VWC measurements caused by salinity and temperature from 0.252 to 0.030 m3 m−3 and from 0.196 to 0.020 m3 m−3, respectively. The proposed L&O correction equation worked well in different conditions, with the soil salinity and temperature ranging from 0–50 °C and 0.35–6.07 dS m−1, respectively, with an accuracy of 93–97%.

Author Contributions

Conceptualization, I.I.L.; methodology, A.M.A.-O.; software, I.I.L.; validation, I.I.L.; formal analysis, I.I.L.; investigation, I.I.L.; resources, I.I.L.; data curation, I.I.L.; writing—original draft preparation, I.I.L.; writing—review and editing, A.M.A.-O.; visualization, I.I.L.; supervision, I.I.L.; project administration, A.M.A.-O.; funding acquisition, A.M.A.-O. All authors have read and agreed to the published version of the manuscript.

Funding

No research fund was received.

Data Availability Statement

The data presented in this study are available on request from the corresponding author.

Acknowledgments

The authors wish to thank King Saud University, Deanship of Scientific Research, College of Food and Agricultural Sciences, Research Center for supporting this work.

Conflicts of Interest

The authors declare no conflict of interest.

References

  1. Fares, A.; Abbas, F.; Maria, D.; Mair, A. Improved Calibration Functions of Three Capacitance Probes for the Measurement of Soil Moisture in Tropical Soils. Sensors 2011, 11, 4858–4874. [Google Scholar] [CrossRef] [PubMed]
  2. Ali, F.; Awal, R.; Bayabil, H.K. Soil water content sensor response to organic matter content under laboratory conditions. Sensors 2016, 16, 1239. [Google Scholar]
  3. Assouline, S.; Narkis, K.; Tyler, S.; Lunati, I.; Parlange, M.; Selker, J.S. On the Diurnal Soil Water Content Dynamics during Evaporation using Dielectric Methods. Vadose Zone J. 2010, 9, 709–718. [Google Scholar] [CrossRef] [Green Version]
  4. Baumhardt, R.L.; Lascano, R.J.; Eve, S.R. Soil material, temperature, and EC effects on calibration of multi sensor capacitance probes. Soil Sci. Soc. Am. J. 2000, 64, 1940–1946. [Google Scholar] [CrossRef]
  5. Li, B.; Wang, C.; Gu, X.; Zhou, X.; Ma, M.; Li, L.; Feng, Z.; Ding, T.; Li, X.; Jiang, T.; et al. Accuracy calibration and evaluation of capacitance-based soil moisture sensors for a variety of soil properties. Agric. Water Manag. 2022, 273, 107913. [Google Scholar] [CrossRef]
  6. Wu, B.; Han, H.; He, J.; Zhang, J.; Cui, L.; Jia, Z.; Yang, W. Field-Specific Calibration and Evaluation of ECH2 O EC-5 Sensor for Sandy Soils. Soil Sci. Soc. Am. J. 2014, 78, 70–78. [Google Scholar] [CrossRef]
  7. Czarnomski, N.M.; Moore, G.W.; Pypker, T.G.; Licata, J.; Bond, B.J. Precision and accuracy of three alternative instruments for measuring soil water content in two forest soils of the Pacific Northwest. Can. J. For. Res. 2005, 35, 18671876. [Google Scholar] [CrossRef] [Green Version]
  8. Elia, S.; Berti, A.; Teatini, P.; Morari, F. Simultaneous monitoring of soil water content and EC with a low-cost capacitance-resistance probe. Sensors 2012, 12, 17588–17607. [Google Scholar]
  9. Abbas, F.; Fares, A.; Fares, S. Field Calibrations of Soil Moisture Sensors in a Forested Watershed. Sensors 2011, 11, 6354–6369. [Google Scholar] [CrossRef] [Green Version]
  10. Fernando, V.; Martínez, D.; Molina, M.J.; Ingelmo, F.; De Paz, J.M. A combined equation to estimate the soil pore-water electrical conductivity: Calibration with the WET and 5TE sensors. Soil Res. 2014, 52, 419. [Google Scholar]
  11. Fernando, V.; De Paza, J.M.; Martínez, D.; Molina, M.J. Laboratory and field assessment of the capacitance sensors Decagon 10HS and 5TE for estimating the water content of irrigated soils. Agric. Water Manag. 2014, 132, 111–119. [Google Scholar]
  12. Ganjegunte, G.K.; Sheng, Z.; Clark, J.A. Evaluating the accuracy of soil water sensors for irrigation scheduling to conserve freshwater. Appl. Water Sci. 2012, 2, 119–125. [Google Scholar] [CrossRef] [Green Version]
  13. Gasch, C.K.; Brown, D.J.; Brooks, E.S.; Yproposedek, M.; Poggio, M.; Cobos, D.R.; Campbell, C.S. A pragmatic, automated approach for retroactive calibration of soil moisture sensors using a two-step, soil-specific correction. Comput. Electron. Agric. 2017, 137, 29–40. [Google Scholar] [CrossRef] [Green Version]
  14. George, K.; Persson, M.; Kanelis, G.; Markopoulou, I. Prediction of soil solution electrical conductivity by the permittivity corrected linear model using a dielectric sensor. J. Irrig. Drain. Eng. 2017, 143, 8. [Google Scholar]
  15. Mittelbach, H.; Lehner, I.; Seneviratne, S.I. Comparison of four soil moisture sensor types under field conditions in Switzerland. J. Hydrol. 2012, 430-431, 39–49. [Google Scholar] [CrossRef]
  16. IBM Corp. IBM SPSS Statistics for Windows, Version 19.0; IBM Corp.: Armonk, NY, USA, 2010.
  17. Jae-Kwon, S.; Shin, W.-T.; Cho, J.-Y. Laboratory and field assessment of the decagon 5TE and GS3 sensors for estimating soil water content in saline-alkali reclaimed soils. J. Commun. Soil Sci. Plant Anal. 2017, 48, 2268–2279. [Google Scholar]
  18. Kapilaratne, R.J.; Lu, M. Automated general temperature correction method for dielectric soil moisture sensors. J. Hydrol. 2017, 551, 203–216. [Google Scholar] [CrossRef]
  19. Kargas, G.; Kerkides, P. Water content determination in mineral and organic porous media by ML2 theta probe. Irrig. Drain. 2008, 57, 435–449. [Google Scholar] [CrossRef]
  20. Kargas, G.; Kerkides, P.; Seyfried, M. Response of Three Soil Water Sensors to Variable Solution Electrical Conductivity in Different Soils. Vadose Zone J. 2014, 13, 9. [Google Scholar] [CrossRef]
  21. Kizito, F.; Campbell, C.S.; Cobos, D.R.; Teare, B.L.; Carter, B.; Hopmans, J.W. Frequency, electrical conductivity and temperature analysis of a low-cost capacitance soil moisture sensor. J. Hydrol. 2008, 352, 367–378. [Google Scholar] [CrossRef]
  22. Chow, L.; Xing, Z.; Rees, H.W.; Meng, F.; Monteith, J.; Stevens, L. Field Performance of Nine Soil Water Content Sensors on a Sandy Loam Soil in New Brunswick, Maritime Region, Canada. Sensors 2009, 9, 9398–9413. [Google Scholar] [CrossRef] [PubMed]
  23. Loague, K.; Green, R.E. Statistical and graphical methods for evaluating solute transport models: Overview and application. J. Contam. Hydrol. 1991, 7, 51–73. [Google Scholar] [CrossRef]
  24. Louki, I.I.; Al-Omran, A.M.; Aly, A.A.; Al-Harbi, A.R. Sensor Effectiveness For Soil Water Content Measurements under Normal and Extreme Conditions. Irrig. Drain. 2019, 68, 979–992. [Google Scholar] [CrossRef]
  25. Martin, K.; Kodešová, R. Influence of temperature on soil water content measured by ECH2O-TE sensors. Int. Agrophysics 2012, 26, 259–269. [Google Scholar]
  26. McCann, I.R.; Fraj, I.B.; Dakheel, A. Evaluation of the Decagon® 5TE sensor as a tool for irrigation and EC management in a sandy soil. Acta Hortic. 2014, 1054, 153–160. [Google Scholar] [CrossRef]
  27. Mittelbach, H.; Casini, F.; Lehner, I.; Teuling, A.; Seneviratne, S. Soil moisture monitoring for climate research: Evaluation of a low-cost sensor in the framework of the Swiss Soil Moisture Experiment (SwissSMEX) campaign. J. Geophys. Res. Earth Surf. 2011, 116, D05111. [Google Scholar] [CrossRef] [Green Version]
  28. Mohammed, A.M.; Cho, H. Response of the ECH2O soil moisture probe in electrically conductive soils. Environ. Control Biol. 2006, 44, 225–230. [Google Scholar]
  29. Nelson, D.W.; Sommers, L.E. Total Carbon, Organic Carbon and Organic Matter. In Methods of Soil Analysis, 2nd ed.; Part 3; Sparks, D.L., Ed.; SSSA Book Series No. 5. ASA; SSSA: Madison, WI, USA, 1996; pp. 961–1010. [Google Scholar]
  30. Peters, J.; Combs, S.; Hoskins, B.; Jarman, J.; Kovar, J.; Watson, M.; Wolf, A.; Wolf, N. Recommended Methods of Manure Analysis; Produced by Cooperative Extension Publishing Operations; ASA: Madison, WI, USA, 2003. [Google Scholar]
  31. Qu, W.; Bogena, H.; Huisman, J.; Vereecken, H. Calibration of a Novel Low-Cost Soil Water Content Sensor Based on a Ring Oscillator. Vadose Zone J. 2013, 12, 2. [Google Scholar] [CrossRef]
  32. Reynolds, S.G. The gravimetric methods of soil moisture determination. J. Hydrol. 1970, 11, 258–283. [Google Scholar] [CrossRef]
  33. Rosenbaum, U.; Huisman, J.A.; Vrba, J.; Vereecken, H.; Bogena, H.R. Correction of temperature and electrical conductivity influencings on dielectric permittivity measurements with ECH2O sensors. Vadose Zone J. 2011, 10, 582–593. [Google Scholar] [CrossRef]
  34. Rosenbaum, U.; Huisman, J.A.; Weuthen, A.; Vereecken, H.; Bogena, H.R. Sensor-to-sensor variability of the ECH2O EC-5, TE, and 5TE sensors in dielectric liquids. Vadose Zone J. 2010, 9, 181–186. [Google Scholar] [CrossRef]
  35. Ojo, E.R.; Bullock, P.R.; Fitzmaurice, J. Field Performance of Five Soil Moisture Instruments in Heavy Clay Soils. Soil Sci. Soc. Am. J. 2014, 79, 20–29. [Google Scholar]
  36. Rowlandson, T.L.; Berg, A.A.; Bullock, P.R.; Ojo, E.R.; McNairn, H.; Wiseman, G.; Cosh, M.H. Evaluation of several calibration procedures for a portable soil moisture sensor. J. Hydrol. 2013, 498, 335–344. [Google Scholar] [CrossRef]
  37. Sakaki, T.; Limsuwat, A.; Illangasekare, T.H. A simple method for calibrating dielectric soil moisture sensors: Laboratory validation in sands. Vadose Zone J. 2011, 10, 526–531. [Google Scholar] [CrossRef]
  38. Schwartz, R.C.; Casanova, J.; Pelletier, M.; Evett, S.; Baumhardt, R. Soil Permittivity Response to Bulk Electrical Conductivity for Selected Soil Water Sensors. Vadose Zone J. 2013, 12, 2. [Google Scholar] [CrossRef]
  39. Singh, J.; Lo, T.; Rudnick, D.; Dorr, T.; Burr, C.; Werle, R.; Shaver, T.; Muñoz-Arriola, F. Performance assessment of factory and field calibrations for electromagnetic sensors in a loam soil. Agric. Water Manag. 2018, 196, 87–98. [Google Scholar] [CrossRef]
  40. Svatopluk, M.; Báťková, K.; Legese, W.M. Laboratory performance of five selected soil moisture sensors applying factory and own calibration equations for two soil media of different bulk density and EC levels. Sensors 2016, 16, 1912. [Google Scholar]
  41. Saito, T.; Fujimaki, H.; Yasuda, H.; Inoue, M. Empirical Temperature Calibration of Capacitance Probes to Measure Soil Water. Soil Sci. Soc. Am. J. 2009, 73, 1931–1937. [Google Scholar] [CrossRef]
  42. Tadaomi, S.; Fujimaki, H.; Yasuda, H.; Inosako, K.; Inoue, M. Calibration of temperature influencing on dielectric probes using time series field data. Vadose Zone J. 2013, 12, 2. [Google Scholar]
  43. Saito, T.; Yasuda, H.; Sakurai, M.; Acharya, K.; Sueki, S.; Inosako, K.; Yoda, K.; Fujimaki, H.; Elbasit, M.A.A.; Eldoma, A.M.; et al. Monitoring of Stem Water Content of Native and Invasive Trees in Arid Environments Using GS3 Soil Moisture Sensors. Vadose Zone J. 2016, 15, 3. [Google Scholar] [CrossRef] [Green Version]
  44. Elsen, H.V.D.; Ritsema, C.; Seeger, M.; Keesstra, S. Averaging Performance of Capacitance and Time Domain Reflectometry Sensors in Nonuniform Wetted Sand Profiles. Vadose Zone J. 2014, 13, 1–13. [Google Scholar]
  45. Varble, J.L.; Chávez, J.L. Performance evaluation and calibration of soil water content and potential sensors for agricultural soils in eastern Colorado. Agric. Water Manag. 2011, 101, 93–106. [Google Scholar] [CrossRef]
  46. Vaz Carlos, M.P.; Jones, S.; Meding, M.; Tuller, M. Evaluation of standard calibration functions for eight electromagnetic soil moisture sensors. Vadose Zone J. 2013, 12, 2. [Google Scholar]
  47. Wojciech, S. Temperature dependence of time domain reflectometry-measured soil dielectric permittivity. J. Plant Nutr. Soil Sci. 2009, 172, 186–193. [Google Scholar]
  48. Satoh, Y.; Kakiuchi, H. Calibration method to address influences of temperature and electrical conductivity for a low-cost soil water content sensor in the agricultural field. Agric. Water Manag. 2021, 255, 107015. [Google Scholar] [CrossRef]
Figure 1. ECH2O-5TE sensors in all rubs of testing.
Agronomy 13 00051 g001
Figure 2. The influence of various factors on sensor measurements.
Agronomy 13 00051 g002
Figure 3. Correlation between actual VWC by gravimetric method and the sensor at three levels of (a) salinity concentration and (b) temperature.
Agronomy 13 00051 g003
Figure 4. Influence of EC on sensor measurements at (a) field capacity and (b) saturated points.
Agronomy 13 00051 g004
Figure 5. Influence of soil temperature on sensor measurements at (a) field capacity and (b) saturated points.
Agronomy 13 00051 g005
Figure 6. Influence of organic matter on sensor measurements before and after desalination.
Agronomy 13 00051 g006
Figure 7. Influence of soil texture on sensor measurements.
Agronomy 13 00051 g007
Figure 8. Influence of soil bulk density on sensor measurements in low-salinity (1.4 dS m−1), moderate (2.3 dS m−1), and high-salinity soil (6 dS m−1).
Agronomy 13 00051 g008
Figure 9. Comparison between actual VWC values measured by gravimetric method and calculated by L&O equation in graded increasing soil moisture at three levels of (a) EC and (b) temperature.
Agronomy 13 00051 g009
Figure 10. Comparison between VWC values measured by sensor, by gravimetric method, and by proposed L&O correction equation with a gradual increase in soil EC at 25 °C, tested at (a) soil moisture at field capacity and (b) soil moisture at saturated point.
Agronomy 13 00051 g010
Figure 11. Comparison between VWC values measured by sensor, by gravimetric method, and by proposed L&O correction equation with gradual increase in soil temperature at 2.42 dS m−1 at (a) field capacity moisture and (b) saturated points.
Agronomy 13 00051 g011
Figure 12. Comparison between VWC values measured by sensors using gravimetric method and proposed L&O correction equation with gradual increase in soil salinity at (a) 5 °C and (b) 38 °C.
Agronomy 13 00051 g012
Figure 13. Comparison between VWC values measured by the sensors using gravimetric method and calculated by proposed L&O correction equation with gradually increasing soil temperature at (a) 1.55 dS m−1 in low moisture and (b) 4.62 dS m−1 in field-capacity moisture.
Agronomy 13 00051 g013
Table 1. Mechanical analysis of general empirical soil.
Saturation Percentage SP%CaCO3 (%)Sand (%)Silt (%)Clay (%)TextureEC dS m−1CEC
meq/100 gm
2418.9275.3511.3213.33Sandy Loam1.0911.54
Table 2. Routine analysis of general empirical soil.
pHNa+ meq/LK+ meq/LCa2+ meq/LMg2+ meq/LHCO3 meq/LCl mmeq/LSO42− meq/L
8.243.630.7333.22.223.895.04
Table 3. Mechanical analysis of specific test soils.
SoilSand (%)Silt (%)Clay (%)TextureEC dS m−1CEC meq/100 gm
194.972.013.02sand2.5 *4.83
216.5039.2444.27clay2.523.69
* Soil EC was adjusted with sodium chloride (NaCl).
Table 4. Irrigation water analysis used for leaching to remove salinity from bovine compost.
EC dS m−1pHNa+ ppmK+ ppmCa2+ ppmMg2+ ppmHCO3 ppmCl ppmSO42− ppm
0.987.381193.71971519058135
Table 5. Chemical properties of bovine compost.
Analytical CompositionPrimary and Secondary Elements
Organic Matter40–50%Total Nitrogen1.5–2.5%
pH6.5–7.5Phosphorus0.7–1.5%
Moisture20–25%Potassium0.5–1.2%
C/N Ratio20–25:1Calcium0.5–1%
EC (dS m−1)18–19
Table 6. Constant values of correction equation for measuring soil moisture sensors by soil texture.
Soil Textureɑbcdef
Loam Soil0.040.050.6450.000120.0060.775
Sandy Soil0.076−0.1330.8778.77 × 10−50.01160.603
Clay Soil0.0370.0370.6940.000160.000850.864
Table 7. Sensor measurement corrections using the proposed L&O correction equation under different soil salinity and temperatures (in loam soil samples).
T
ECe
(dS m−1)
θvs
(m3 m−3)
θvw
(m3 m−3)
θv-L&O
Equ. (m3 m−3)
T
ECe
(dS m−1)
θvs
(m3 m−3)
θvw
(m3 m−3)
θv-L&O
Equ. (m3 m−3)
19.02.500.0510.0600.054251.000.0500.0610.068
19.72.500.1240.1310.129251.000.0860.1160.116
20.52.500.2090.2140.216251.000.1030.1430.140
21.02.500.3000.2960.309251.000.1210.1700.165
23.92.500.4060.4000.404251.000.1420.1870.193
24.42.610.0300.0300.028251.000.1700.2230.231
24.92.610.0750.0730.072251.000.1980.2590.269
26.92.610.1430.1390.133251.000.2540.3300.345
26.82.570.3900.3790.3682.02.610.0190.0300.023
50.52.610.0470.0300.0333.02.610.0560.0730.067
47.12.610.0440.0300.0322.32.610.1000.1390.121
50.12.610.1160.0730.0813.12.590.2980.3790.358
49.32.610.1140.0730.08018.34.590.1060.0800.067
48.32.610.1120.0730.07920.44.590.1760.1220.108
47.32.610.1100.0730.07922.54.590.2450.1630.147
46.42.610.1070.0730.07822.04.590.2780.1780.168
50.02.610.2240.1390.15522.44.590.3230.2020.194
50.52.610.2230.1390.15422.54.590.3720.2150.223
49.92.610.2200.1390.15321.84.590.3650.2310.221
49.52.610.2180.1390.15222.24.590.4000.2370.241
50.02.720.5120.3790.34623.54.590.4670.2660.277
49.32.710.5090.3790.34824.24.590.5620.3090.331
48.62.710.5050.3790.34924.74.590.6740.3220.394
48.02.710.5010.3790.34925.74.590.7430.4070.430
47.42.690.4970.3790.35026.74.590.8120.4920.464
Table 8. Statistics results of testing proposed L&O correction equation vs. actual VWC values at three salinity levels, and temperature impact on sensor readings of VWC (m3 m−3) in gradually increasing soil moisture as determined by R2, RMSE, RRMSE, and CRM.
Evaluation ExperimentnR2RMSE (m3 m−3)RRMSE (%)CRM
SensorEquationSensorEquationSensorEquationSensorEquation
EC (1.0 dS m−1) at 25 °C80.99850.99960.0720.01131.24.30.2860.034
EC (2.42 dS m−1) at 25 °C80.99970.99840.0030.0051.41.8−0.005−0.008
EC (5.0 dS m−1) at 25 °C80.99220.98490.2520.030109.411.5−0.874−0.012
Temp. (3 °C) at 2.42 dS m−170.99920.99980.0530.00726.83.30.2370.028
Temp. (25 °C) at 2.42 dS m−170.99990.99990.0040.0031.91.50.0100.005
Temp. (50 °C) at 2.42 dS m−170.99770.99770.0980.01149.15.7−0.4390.020
Table 9. Statistical analysis of performance comparison of sensor and proposed L&O correction equation for correcting gradual increase in salinity and temperature on sensor readings as determined by RMSE, RMSE, and CRM in field capacity and saturated point moisture.
Evaluation ExperimentnRMSE (m3 m−3)RRMSE (%)CRM
SensorEquationSensorEquationSensorEquation
Salinity impact at field capacity4240.0860.01249.26.6−0.071−0.006
Salinity impact at saturated point8220.1960.020535.3−0.271−0.005
Salinity impact on low temp. 5 °C at saturated point140.1640.01235.62.50.0380.021
Salinity impact on high temp. 38 °C at saturated point180.3020.01090.13.0−0.5770.012
Temperature impact at field capacity1490.0380.00827.86.1−0.0560.033
Temperature impact at saturated point1570.0650.01217.23−0.003−0.006
Temperature impact on low EC- 1.55 dS m−1 at low moisture100.0180.00124.35.40.150−0.003
Temperature impact on high EC- 4.48 dS m−1 at field capacity270.2190.02596.711.2−0.7780.062
Table 10. Variance analysis of sensor readings of VWC as a function of salinity level and temperature, compared with actual VWC values by gravimetric method and calculated VWC by proposed L&O equation. Dependent variable: values of VWC.
(I) Measured in High Salinity and Temperature (4.48 dS m−1 and 36.7 °C)(J) Measured in High Salinity and Temperature (4.48 dS m−1 and 36.7 °C)Mean Difference
(I–J)
Std. ErrorSig.95% Confidence Interval
Lower BoundUpper Bound
LSDMeasured by sensorsCalculated by L&O equation0.164125 *0.0309460.0000.099770.22848
Control (measured by gravimetric method)0.167625 *0.0309460.0000.103270.23198
Calculated by L&O equationMeasured by sensors−0.164125 *0.0309460.000−0.22848−0.09977
Control (measured by gravimetric method)0.0035000.0309460.911−0.060860.06786
Control (measured by gravimetric method)Measured by sensors−0.167625 *0.0309460.000−0.23198−0.10327
Calculated by L&O equation−0.0035000.0309460.911−0.067860.06086
Dunnett t
(2-sided) a
Measured by sensorsControl (measured by gravimetric method)0.167625 *0.0309460.0000.094270.24098
Calculated by L&O equationControl (measured by gravimetric method)0.0035000.0309460.991−0.069850.07685
* Mean difference is significant at 0.05 level. a Dunnett t-tests treat one group as a control and compare all other groups against it.
Table 11. Correlation between salinity levels, average sensor readings of VWC, actual VWC values, and calculated values of VWC by proposed L&O equation.
Measured by SensorsSalinity Impact at 25 °CCalculated by L&O EquationMeasured by Gravimetric Method
Pearson correlationMeasured by sensors1.0000.9600.412−0.076
Salinity impact at 25 °C0.9601.0000.214−0.256
Calculated by L&O equation0.4120.2141.0000.844
Measured by gravimetric method−0.076−0.2560.8441.000
Sig. (1-tailed)Measured by sensors.0.0000.0450.382
Salinity impact at 25 °C0.000.0.1970.153
Calculated by L&O equation0.0450.197.0.000
Measured by gravimetric method0.3820.1530.000.
NMeasured by sensors18181818
Salinity impact at 25 °C18181818
Calculated by L&O equation18181818
Measured by gravimetric method18181818
Dependent variable: Values of VWC.
Disclaimer/Publisher’s Note: The statements, opinions and data contained in all publications are solely those of the individual author(s) and contributor(s) and not of MDPI and/or the editor(s). MDPI and/or the editor(s) disclaim responsibility for any injury to people or property resulting from any ideas, methods, instructions or products referred to in the content.

