

Optimizing Water and Nitrogen Management for Green Pepper (Capsicum annuum L.) under Drip Irrigation in Sub-Tropical Monsoon Climate Regions
Abstract
:1. Introduction
2. Materials and Methods
2.1. Experimental Site
2.2. Experimental Design
2.3. Measurements and Calculations
2.3.1. Yield
2.3.2. ET, WUE and NUE
- (1)
- Evapotranspiration (ET) was calculated using water balance method.
- (2)
- Water use efficiency (WUE)
- (3)
- Nitrogen use efficiency (NUE)
2.3.3. Statistical Analysis
3. Results
3.1. Yield
3.2. WUE
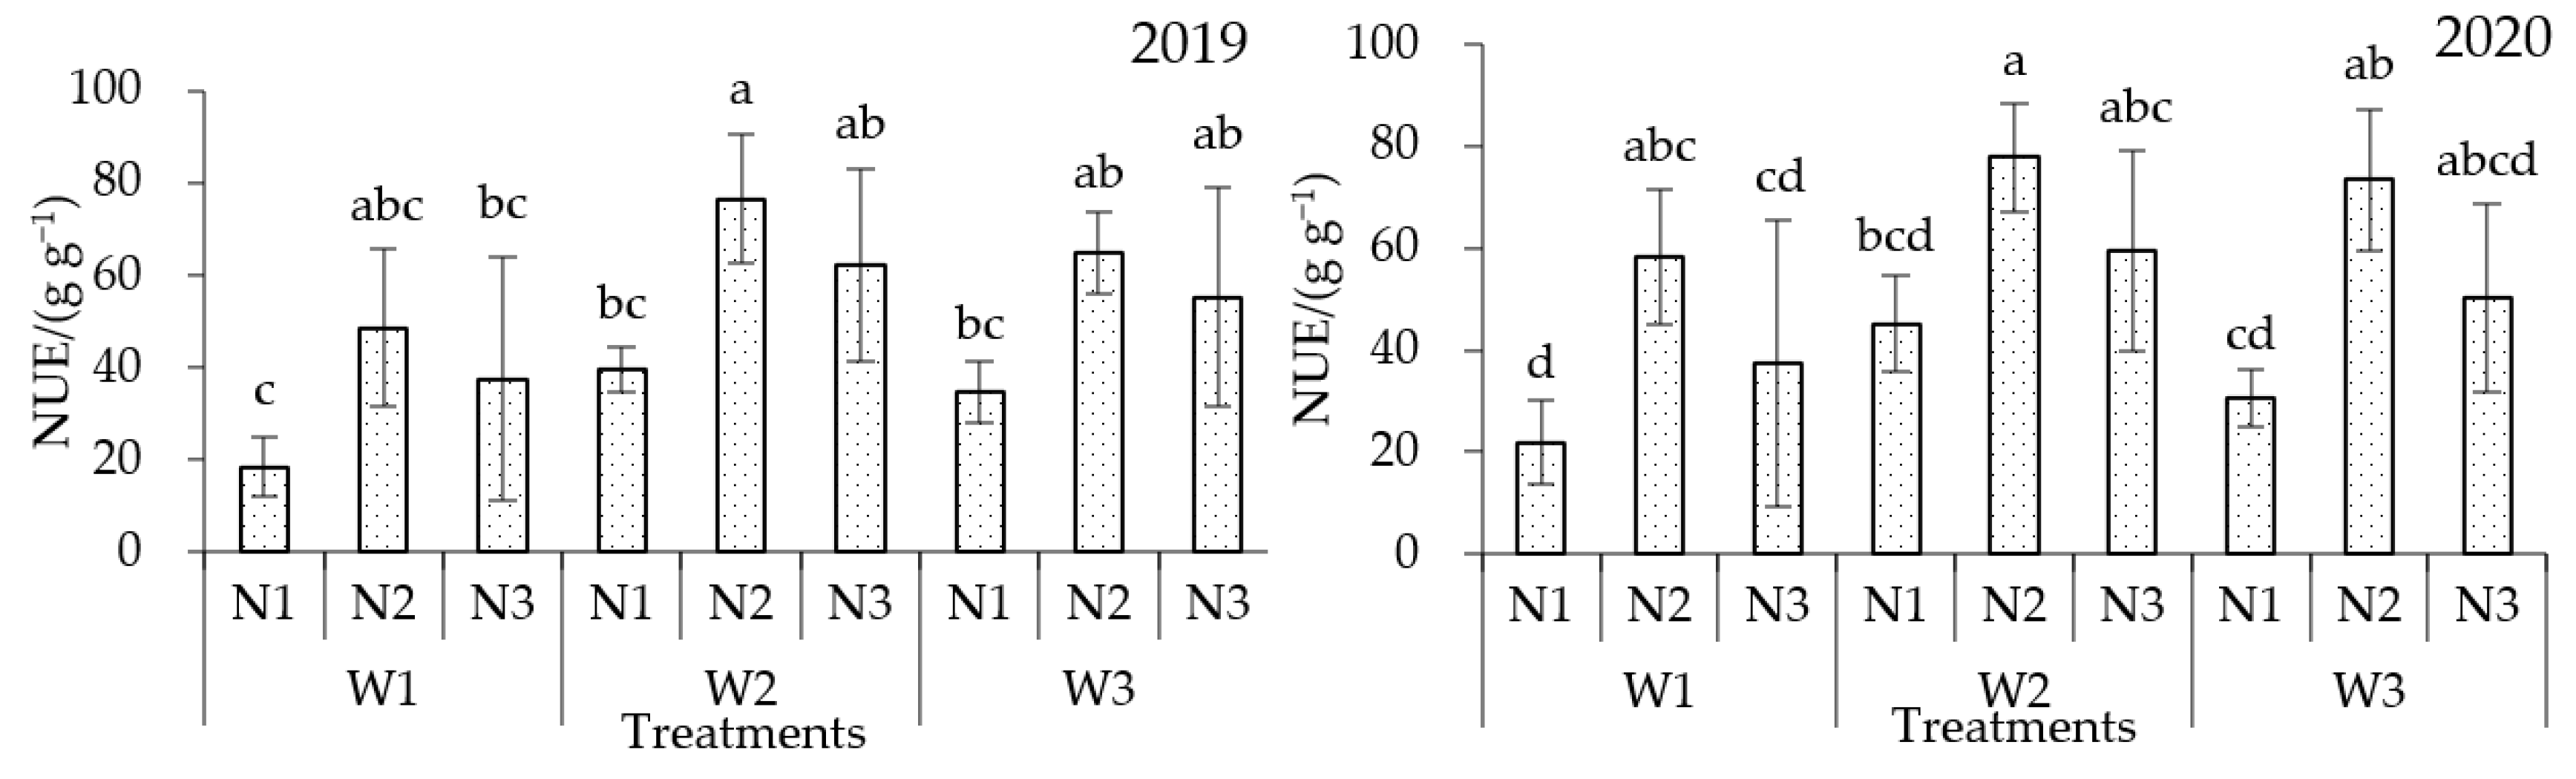
3.3. NUE
3.4. Model Development and Evaluation
3.5. The Strategy for SWC-N Management Based on Comprehensive Benefits
4. Discussion
4.1. Effects of Different Water Level and Napp Rate on the Yield
4.2. Effects of Different Water Level and Napp Rate on the WUE and NUE
4.3. Determination of Optimal Combination of SWC and Napp Rate
5. Conclusions
Author Contributions
Funding
Institutional Review Board Statement
Informed Consent Statement
Data Availability Statement
Conflicts of Interest
References
- Zheng, K.; Fang, C.; Sun, F.Z. Quality classification of green pepper based on deep learning. J. Shandong Univ. Tech. 2020, 4, 18–23. (In Chinese) [Google Scholar]
- Badr, M.A.; El-Tohamy, W.A.; Zaghloul, A.M. Yield and water use efficiency of potato grown under different irrigation and nitrogen levels in an arid region. Agric. Water Manag. 2012, 110, 9–15. [Google Scholar] [CrossRef]
- Ramu, K.; Watanabe, T.; Uchino, H.; Sahrawat, K.L.; Wani, S.P.; Ito, O. Fertilizer induced nitrous oxide emissions from Vertisols and Alfisols during sweet sorghum cultivation in the Indian semi-arid tropics. Sci. Total Envir. 2012, 438, 9–14. [Google Scholar] [CrossRef] [PubMed] [Green Version]
- Kunrath, T.R.; Lemaire, G.; Sadras, V.O.; Gastal, F. Water use efficiency in perennial forage species: Interactions between nitrogen nutrition and water deficit. Field Crop Res. 2018, 222, 1–11. [Google Scholar] [CrossRef]
- Wu, Y.; Yan, S.C.; Fan, J.L.; Zhang, F.C.; Xiang, Y.Z.; Zheng, J.; Guo, J.J. Responses of growth, fruit yield, quality and water productivity of greenhouse tomato to deficit drip irrigation. Sci. Hortic. 2021, 275, 109710. [Google Scholar] [CrossRef]
- Müller, T.; Bouleaua, C.R.; Peronab, P. Optimizing drip irrigation for eggplant crops in semi-arid zones using evolving thresholds. Agric. Water Manag. 2016, 117, 54–65. [Google Scholar] [CrossRef] [Green Version]
- Trentacoste, E.R.; Puertas, C.M.; Sadras, V.O. Effect of irrigation and tree density on vegetative growth, oil yield and water use efficiency in young olive orchard under arid conditions in Mendoza, Argentina. Irrig. Sci. 2015, 33, 429–440. [Google Scholar] [CrossRef]
- Liu, M.G.; Wang, Z.K.; Mu, L.; Xu, R.; Yang, H.M. Effect of regulated deficit irrigation on alfalfa performance under two irrigation systems in the inland arid area of midwestern China. Agric. Water Manag. 2021, 248, 106764. [Google Scholar] [CrossRef]
- Sun, Y.; Zhang, J.; Wang, H.Y.; Wang, L.G.; Li, H.U. Identifying optimal water and nitrogen inputs for high efficiency and low environment impacts of a greenhouse summer cucumber with a model method. Agric. Water Manag. 2019, 212, 23–34. [Google Scholar] [CrossRef]
- Nadeem, M.Y.; Zhang, J.W.; Zhou, Y.; Ahmad, S.; Ding, Y.F.; Li, G.H. Quantifying the impact of reduced nitrogen rates on grain yield and nitrogen use efficiency in the wheat and rice rotation system of the Yangtze river region. Agronomy 2022, 11, 920. [Google Scholar] [CrossRef]
- Waraich, E.A.; Saifullah, A.R.; Ehsanullah, M.Y. Role of mineral nutrition in alleviation of drought stress in plants. Aust. J. Crop SCI. 2011, 5, 764–777. [Google Scholar]
- Yu, C.Q.; Huang, X.; Chen, H.; Godfray, H.C.J.; Wright, J.S.; Hall, J.W.; Gong, P.; Ni, S.Q.; Qiao, S.C.; Huang, G.R.; et al. Managing nitrogen to restore water quality in China. Nature 2019, 547, 516–520. [Google Scholar] [CrossRef] [PubMed]
- Wang, Y.; Zhang, X.Y.; Chen, J.; Chen, A.J.; Wan, L.Y.; Guo, X.Y.; Niu, Y.L.; Liu, S.R.; Mi, G.H.; Gao, Q. Reducing basal nitrogen rate to improve maize seedling growth, water and nitrogen use efficiencies under drought stress by optimizing root morphology and distribution. Agric. Water Manag. 2019, 212, 328–337. [Google Scholar] [CrossRef]
- Wan, Z.Y.; Luo, Y.; Liu, H.; Zhang, Q.M.; Luo, X.L. Analysis on the change trend of surface water quality in Jiangxi province from 2016 to 2018. Jiangxi Sci. 2020, 38, 28–30. (In Chinese) [Google Scholar]
- Rathore, V.S.; Nathawat, N.S.; Bhardwaj, S.; Sasidharan, R.P.; Yadava, B.M.; Kumar, M.; Santra, P.; Yadava, N.D.; Yadav, O.P. Yield, water and nitrogen use efficiencies of sprinkler irrigated wheat grown under different irrigation and nitrogen levels in an arid region. Agric. Water Manag. 2017, 187, 232–245. [Google Scholar] [CrossRef]
- Barrett, C.E.; Zotarelli, L.; Paranhos, L.G.; Dittmar, P.; Fraisse, C.W.; Vansickle, J. Optimization of irrigation and N-fertilizer strategies for cabbage plasticulture system. Sci. Hortic. 2018, 234, 323–334. [Google Scholar] [CrossRef]
- Wang, H.D.; Li, J.; Cheng, M.H.; Zhang, F.C.; Wang, X.K.; Fan, J.L.; Wu, L.F.; Fang, D.P.; Zou, H.Y.; Xiang, Y.Z. Optimal drip fertigation management improves yield, quality, water and nitrogen use efficiency of greenhouse cucumber. Sci. Hortic. 2019, 243, 357–366. [Google Scholar] [CrossRef]
- Du, Y.D.; Cao, H.X.; Liu, S.Q.; Gu, X.B.; Cao, Y.X. Response of yield, quality, water and nitrogen use efficiency of tomato to different levels of water and nitrogen under drip irrigation in Northwestern China. J. Integr. Agric. 2017, 16, 1153–1161. [Google Scholar] [CrossRef] [Green Version]
- Kiymaz, S.; Ertek, A. Yield and quality of sugar beet (Beta vulgaris L.) at different water and nitrogen levels under the climatic conditions of Krsehir, Turkey. Agric. Water Manag. 2015, 158, 156–165. [Google Scholar]
- Fatchurrahman, D.; Kuramoto, M.; Riza, D.F.A.; Ogawa, Y.; Suzuki, T.; Kondo, N. Fluorescence time series monitoring of different parts of green pepper (Capsicum annuum L.) under different storage temperatures. Comput. Electron. Agric. 2021, 179, 105850. [Google Scholar]
- Ahmad, R.; Ahmad, N.; Alkhars, S.; Alkhars, A.; Alyousif, M.; Bukhamseen, A.; Abuthayn, S.; Aqeel, M.; Aljamea, A. Green accelerated solvent extraction (ASE) with solvent and temperature effect and green UHPL-DAD analysis of phenolics in pepper fruit (Capsicum annum L.). J. Food Compos. Anal. 2021, 97, 103766. [Google Scholar] [CrossRef]
- He, J. Best Management Practice Development with the CERES-Maize Model for Sweet Corn Production in North Florida. Ph.D. thesis, University of Florida, Gainesville, FL, USA, 2008. [Google Scholar]
- Sidhu, H.S.; Jat, M.L.; Singh, Y.; Sidhu, R.K.; Gupta, N.; Singh, P.; Singh, P.; Jat, H.S.; Gerard, B. Sub-surface drip fertigation with conservation agriculture in a rice-wheat system: A breakthrough for addressing water and nitrogen use efficiency Agric. Water Manag. 2019, 216, 273–283. [Google Scholar] [CrossRef]
- Che, Z.; Wang, J.; Li, J.S. Effects of water quality, irrigation amount and nitrogen applied on soil salinity and cotton production under mulched drip irrigation in arid Northwest China. Agric. Water Manag. 2021, 231, 106738. [Google Scholar] [CrossRef]
- Kuai, J.; Li, X.; Li, Z.; Xie, Y.; Wang, B.; Zhou, G. Leaf carbohydrates assimilation and metabolism affect seed yield of rapeseed with different waterlogging tolerance under the interactive effects of nitrogen and waterlogging. J. Agron. Crop Sci. 2020, 6, 823–836. [Google Scholar] [CrossRef]
- Kong, Q.H.; Li, G.Y.; Wang, Y.H.; Wen, Y.G. Influences of subsurface drip irrigation and surface drip irrigation on bell pepper growth under different fertilization condition. Trans. CSAE 2010, 7, 21–25. (In Chinese) [Google Scholar]
- Yavuz, D.; Seymen, M.; Yavuz, N.; Tukmen, O. Effects of irrigation interval and quantity on the yield and quality of confectionary pumpkin grown under field conditions. Agric. Water Manag. 2015, 159, 290–298. [Google Scholar] [CrossRef]
- Ucar, Y.; Kazaz, S.; Eraslan, F.; Baydar, H. Effects of different irrigation water and nitrogen levels on the wateruse, rose flower yield and oil yield of Rosa damascena. Agric. Water Manag. 2017, 182, 94–102. [Google Scholar] [CrossRef]
- Amouzou, K.A.; Lamers, J.P.A.; Naab, J.B.; Borgemeister, C.; Vlek, P.L.G.; Becker, M. Climate change impact on water-and nitrogen-use efficiencies and yields of maize and sorghum in the northern Benin dry savanna, West Africa. Field Crop Res. 2019, 235, 104–117. [Google Scholar] [CrossRef]
- Trosta, B.; Prochnow, A.; Meyer-Aurich, A.; Drastig, K.; Baumeckerc, M.; Ellmer, F. Effects of irrigation and nitrogen fertilization on the greenhouse gasemissions of a cropping system on a sandy soil in northeast Germany. Eur. J. Agron. 2016, 81, 117–128. [Google Scholar] [CrossRef]
- Cheng, M.H.; Hao, Z.Y.; Yang, S.L.; Jiao, X.Y.; Fan, H.Y. The interactive impact of water and nitrogen on greenhouse green pepper under film-mulched drip irrigation. J. Irrig. Drain. 2018, 11, 50–56. (In Chinese) [Google Scholar]
- Kurai, T.; Morey, S.R.; Wani, S.P.; Watanabe, T. Efficient rates of nitrogenous fertilizer for irrigated sweet sorghum cultivation during the post-rainy season in the semi-arid tropics. Eur. J. Agron. 2015, 71, 63–72. [Google Scholar] [CrossRef]
- Liao, Q.; Gu, S.J.; Kang, S.Z.; Du, T.S.; Tong, L.; Wood, J.D.; Ding, R.S. Mild water and salt stress improve water use efficiency by decreasing stomatal conductance via osmotic adjustment in field maize. Sci. Total Environ. 2022, 805, 150364. [Google Scholar] [CrossRef] [PubMed]
- Zurweller, B.A.; Rowland, D.L.; Mulvaney, M.J.; Tillman, B.L.; Migliaccio, K.; Wright, D.; Erickson, J.; Payton, P.; Vellidis, G. Optimizing cotton irrigation and nitrogen management using a soil water balance model and in-season nitrogen applications. Agric. Water Manag. 2019, 216, 306–314. [Google Scholar] [CrossRef]
- Xu, G.W.; Wang, H.Z.; Zhai, Z.H.; Sun, M.; Li, Y.J. Effect of water and nitrogen coupling on root morphology and physiology, yield and nutrition utilization for rice. Trans. CSAE 2015, 10, 132–141. (In Chinese) [Google Scholar]
- Ma, D.D.; Chen, L.; Qu, H.C.; Wang, Y.L.; Misselbrook, T.; Jiang, R. Impacts of plastic film mulching on crop yields, soil water, nitrate, and organic carbon in Northwestern China: A meta-analysis. Agric. Water Manag. 2018, 202, 166–173. [Google Scholar] [CrossRef]
- Qin, W.; Assinck, F.B.T.; Heinen, M.; Oenema, O. Water and nitrogen use efficiencies in citrus production: A meta-analysis. Agric. Ecosyst. Environ. 2016, 222, 103–111. [Google Scholar] [CrossRef]
- Ruiz, M.B.; Andre, K.E.D.; Otegui, M.E. Phenotypic plasticity of maize grain yield and related secondary traits: Differences between inbreds and hybrids in response to contrasting water and nitrogen regimes. Field Crop Res. 2019, 239, 19–29. [Google Scholar] [CrossRef]
- Dai, Z.G.; Fei, L.J.; Huang, D.L.; Zeng, J.; Chen, L.; Cai, Y.H. Coupling effects of irrigation and nitrogen levels on yield, water and nitrogen use efficiency of surge-root irrigated jujube in a semiarid region. Agric. Water Manag. 2019, 213, 146–154. [Google Scholar] [CrossRef]
- Dai, Z.G.; Fei, L.J.; Zeng, J.; Huang, D.L.; Liu, T. Optimization of water and nitrogen management for surge-root irrigated apple trees in the Loess Plateau of China. J. Integr. Agric. 2021, 20, 260–273. [Google Scholar] [CrossRef]


| Physical Properties | Chemical Properties | ||||||
|---|---|---|---|---|---|---|---|
| Bulk Density (g cm−3) | Field Capacity(%) | pH | EC (dS m−1) | Orgnic C (mg m−3) | Available N (mg kg−1) | Available P (mg kg−1) | Available K (mg kg−1) |
| 1.3 | 29.2 | 5.9 | 0.91 | 26.2 | 26.79 | 41.53 | 174.34 |
| Treatment | SWC (%θFC) | Urea (g plant−1) | |||
|---|---|---|---|---|---|
| Seedling Stage | Flowering and Fruit Setting Stage | Full Fruit Stage | Late Fruiting Stage | ||
| W1N1 | ~95 | 80~95 | 80~95 | not irrigated | 6.0 |
| W1N2 | ~95 | 80~95 | 80~95 | 3.0 | |
| W1N3 | ~95 | 80~95 | 80~95 | 1.5 | |
| W1N4 | ~95 | 80~95 | 80~95 | 0.0 | |
| W2N1 | ~95 | 65~80 | 65~80 | 6.0 | |
| W2N2 | ~95 | 65~80 | 65~80 | 3.0 | |
| W2N3 | ~95 | 65~80 | 65~80 | 1.5 | |
| W2N4 | ~95 | 65~80 | 65~80 | 0.0 | |
| W3N1 | ~95 | 50~65 | 50~65 | 6.0 | |
| W3N2 | ~95 | 50~65 | 50~65 | 3.0 | |
| W3N3 | ~95 | 50~65 | 50~65 | 1.5 | |
| W3N4 | ~95 | 50~65 | 50~65 | 0.0 | |
| Indicators | COD mg L−1 | TN mg L−1 | NH4-N mg L−1 | TP mg L−1 | TK mg L−1 | pH |
|---|---|---|---|---|---|---|
| Content | 23.66 | 3.18 | 3.13 | 0.11 | 7.31 | 6.6 |
| 2019 | 2020 | |||||||
|---|---|---|---|---|---|---|---|---|
| ET | Yield | WUE | NUE | ET | Yield | WUE | NUE | |
| SWC | ** | ** | ** | ** | ** | ** | ** | * |
| N | ** | ** | ** | ** | ** | ** | ** | ** |
| SWC×N | ns | ** | ** | ** | ns | ** | ** | ** |
| Target | I | Napp | Yield | WUE | NUE |
|---|---|---|---|---|---|
| Maximum yield | 41.37 | 4.50 | 609.34 | 11.23 | 55.38 |
| Maximum WUE | 30.65 | 4.21 | 516.16 | 14.70 | 70.57 |
| Maximum NUE | 30.54 | 3.37 | 507.99 | 14.46 | 74.34 |
| Target | I | Napp | Yield | WUE | NUE |
|---|---|---|---|---|---|
| C1 | 33.96 | 3.82 | 562.83 | 14.32 | 72.09 |
| C2 | 34.63 | 3.78 | 569.95 | 14.17 | 71.69 |
| C3 | 36.09 | 3.91 | 584.97 | 13.79 | 69.55 |
Disclaimer/Publisher’s Note: The statements, opinions and data contained in all publications are solely those of the individual author(s) and contributor(s) and not of MDPI and/or the editor(s). MDPI and/or the editor(s) disclaim responsibility for any injury to people or property resulting from any ideas, methods, instructions or products referred to in the content. |
© 2022 by the authors. Licensee MDPI, Basel, Switzerland. This article is an open access article distributed under the terms and conditions of the Creative Commons Attribution (CC BY) license (https://creativecommons.org/licenses/by/4.0/).
Share and Cite
Dai, Z.; Zhao, X.; Yan, H.; Qin, L.; Niu, X.; Zhao, L.; Cai, Y. Optimizing Water and Nitrogen Management for Green Pepper (Capsicum annuum L.) under Drip Irrigation in Sub-Tropical Monsoon Climate Regions. Agronomy 2023, 13, 34. https://doi.org/10.3390/agronomy13010034
Dai Z, Zhao X, Yan H, Qin L, Niu X, Zhao L, Cai Y. Optimizing Water and Nitrogen Management for Green Pepper (Capsicum annuum L.) under Drip Irrigation in Sub-Tropical Monsoon Climate Regions. Agronomy. 2023; 13(1):34. https://doi.org/10.3390/agronomy13010034
Chicago/Turabian StyleDai, Zhiguang, Xinyu Zhao, Hui Yan, Long Qin, Xiaoli Niu, Long Zhao, and Yaohui Cai. 2023. "Optimizing Water and Nitrogen Management for Green Pepper (Capsicum annuum L.) under Drip Irrigation in Sub-Tropical Monsoon Climate Regions" Agronomy 13, no. 1: 34. https://doi.org/10.3390/agronomy13010034