Article

How Much Phosphorus Uptake Is Required for Achieving Maximum Maize Grain Yield? Part 2: Impact of Phosphorus Uptake on Grain Quality and Partitioning of Nutrients

by
Chad J. Penn
1,*,
James J. Camberato
2 and
Matthew A. Wiethorn
2
1
National Soil Erosion Research Laboratory, USDA Agricultural Research Service, 275 S. Russell St., West Lafayette, IN 47907, USA
2
Department of Agronomy, Purdue University, West Lafayette, IN 47907, USA
*
Author to whom correspondence should be addressed.
Agronomy 2023, 13(1), 258; https://doi.org/10.3390/agronomy13010258
Submission received: 3 December 2022 / Revised: 23 December 2022 / Accepted: 9 January 2023 / Published: 14 January 2023
(This article belongs to the Section Soil and Plant Nutrition)

Abstract

:
Previous studies have shown that excess phosphorus (P) uptake by maize can lead to a decreased grain yield. Part one of this study demonstrated that maize experienced luxury consumption of P in three phases of P uptake. The objective of this work was to further explore how P uptake indirectly impacts the uptake of other nutrients and their translocation within the plant to explain the yield penalty associated with luxury P consumption. Three maize hybrids were grown under optimal conditions using sand-culture hydroponics for precise control of the root environment. Plants were grown to maturity with six different P concentrations followed by biomass and nutrient partitioning analysis of various maize parts. All non-P nutrients achieved maximum grain content at P uptake levels that coincided with the maximum grain yield, while the partitioning of K, Mg, Mn, B, N, S, and Fe into other non-grain tissue continued with further P uptake. With luxury P consumption beyond the point corresponding with maximum grain yield, the N, S, Fe, Cu, and Zn grain content significantly decreased along with the grain yield. With luxury P consumption, Cu, Zn, and Fe accumulated in the roots. Grain production with luxury P uptake may have been limited by P-inhibited translocation of Cu, Zn, and Fe from roots to grain. This decrease in translocation did not prevent further non-grain tissue growth since those nutrients were not as limiting as they were for grain. Data suggest that these micronutrients limited protein production, which was evident from the decrease in grain N and S content and concentration that coincided with the decrease in grain yield concomitant with luxury P uptake.

1. Introduction

Precise soil phosphorus (P) recommendations are important for maximizing economic and agronomic efficiency, while simultaneously minimizing non-point P pollution. The first step in the development of a process-based and mass-balance P recommendation tool was to determine the minimum mass of P uptake required to achieve the maximum grain yield. To accomplish this, Penn et al. [1] used a sand-culture hydroponics method for determining the minimum P uptake mass required to achieve the maximum maize grain yield. This system prevented confounding factors between soil and plants and allowed for the precise control of the plant root environment as well as nutrient bioavailability. Averaged over three hybrids, the authors found that the critical P uptake mass value was 580 mg P plant−1, which was similar to what could be ascertained from a meta-analysis of field-grown maize [2]. Beyond that critical level, maize continued P uptake corresponding to increased biomass production of non-grain tissues until reaching 730 mg P plant−1. Interestingly, it was found that this luxury consumption of P beyond 580 mg P plant−1 resulted in a significant decrease in grain yield, despite the non-grain tissue biomass continuing to increase. This suggests that there may be some antagonism between P and other nutrients, which may explain the decrease in grain yield. For example, previous studies have shown such interactions between P and Fe, Cu, and Zn [3,4,5,6,7]. Therefore, the objective of this research was (i) to explore the cause of the maize grain yield decrease with luxury consumption of P, and (ii) to assess how P uptake affected the uptake of other nutrients. We hypothesized that P uptake indirectly impacted the uptake of other nutrients and their translocation within the plant; more specifically, that luxury consumption of P could decrease the maize grain yield by limiting translocation of other essential nutrients.

2. Materials and Methods

Three maize hybrids (P1197CYXR, D57VP51, and DKC64-69) were grown to maturity (R6) in a semi-automated growth room utilizing sand-culture hydroponics. Details of the room and conditions are found in Wiethorn et al. [8] and Penn et al. [1]. Specifically, Wiethorn et al. provided photographs illustrating various components in the growth room. Briefly, all light, temperature, and moisture conditions were controlled. All nutrients were added via drip irrigation to individual plants grown in 28 L pots containing silica sand media, previously demonstrated by Wiethorn et al. [8] not to sorb or desorb any nutrients. Target concentrations for N, K, S, Mg, Ca, Fe, Zn, B, Mn, Cu, and Mo were 180, 120, 74, 35, 80, 2, 0.05, 0.25, 0.25, 0.02, and 0.01 mg L−1, respectively. Nutrient solutions were made using lab-grade chemicals and de-ionized water (DI). To deliver the nutrient P concentration treatments of 4, 8, 12, 15, 20, and 22 mg P L−1, concentrated P (from K2HPO4) solution in DI water was injected into the fertigation system using 6 nutrient injectors (Dosatron model D25F1, 1:100 fixed ratio injector). There were four replications of each treatment and the final solution pH was 7.1. Prior to V6, pots were fertigated 4 times per day at approximately 120 mLs per event and doubled to 240 mLs per event beyond V6.
Plants were harvested 120 days after planting and separated into stem (including tassel and cob), leaf (including husk), grain, and root. Plant tissues were weighed after drying at 65 °C for 5d. Dried plant tissues were then ground to pass a 0.50 mm screen using a Thomas Wiley Mill model ED-5 (Arthur H. Thomas Co., Philadelphia, PA, USA). Plant tissues (2 g for grain and 1 g for other tissue types) were digested with 15 mL of concentrated nitric acid on a BD40HT graphite heating block (Lachat Instruments, Milwaukee, WI, USA) by heating to 140 °C for 60 min, followed by the addition of 2 mL of 30% hydrogen peroxide. Then, heating was continued for another 60 min at 160 °C, followed by a final heating cycle at 180 °C for 60 min. Digested samples were brought to a final volume of 25 mL with nanopure DI water, and P, K, S, Mg, Ca, Fe, Zn, B, Mn, Cu, and Mo were determined with inductively coupled plasma atomic emission spectroscopy (ICP-AES; Optima 8300, Thermo Fisher Scientific Inc., Waltham, MA, USA). Resulting digestates for macronutrient and micronutrient analysis were tested with 7-fold dilution and without dilution, respectively, in order to ensure that sample values fell within standard curves. Plant tissues were also analyzed for total N content by dry combustion (LECO, St. Joseph, MI, USA). Concentrations of elements in plant tissue samples from ICP-AES analysis were used with sample weights to calculate the mass uptake of nutrients. Grain yield was adjusted to 15.5% moisture content; all other plant parts are presented on a dry basis. Nutrient concentrations in all plant parts are presented on a dry weight basis.
Pots were arranged in a split-block randomized complete block design in which hybrids were the main block and P treatments were randomized within blocks (four replications). Analysis of variance (ANOVA) was performed using statistical analysis software (SAS version 9.4, 2016) to determine whether there was a significant (p ≤ 0.05) interaction between hybrid and P treatment among plant tissue nutrient concentrations and content. Because there were no such interactions, simple statistics (mean and standard deviation) are presented across hybrids within each P treatment, as well as across P treatments within each hybrid. For each non-P nutrient, the PROC NLIN (i.e., non-linear) procedure of SAS was conducted on the relationships between the total P uptake mass and nutrient grain uptake mass, as well as between the total P uptake mass and total nutrient uptake mass, to estimate the “breakpoint” total P uptake mass in which there was a significant change in the relationships. This was executed in two ways: fitting data to a linear-plateau or a linear-linear equation, which was evaluated based on p-value and R2 of each model. While “uptake” and “content” are used somewhat interchangeably, please note that the term “content” is used to describe the nutrient mass contained in each plant part while “uptake” is mostly used to refer to the total nutrient mass in the entire plant. Nutrient concentrations will only be referred to as “concentration”.

3. Results and Discussion

Since there were no significant interactions between hybrid and P treatment for nutrient uptake (not shown), values were averaged across the three hybrids and four replications. Not only did P treatment have a large impact on P uptake, as shown in Table 1 and discussed in Wiethorn et al. [8], but the uptake of all other nutrients was substantially impacted. Similar to the total uptake of nutrients, Table 1 also shows that the root:shoot ratio for each nutrient generally increased with P application as a result of further plant growth. As described in Penn et al. [1], the increased P uptake increased the maize grain yield and biomass of all plant parts. However, it was observed that beyond the total P uptake of 580 mg P plant−1 (i.e., optimal P uptake for maximum grain yield, Pgy), the grain yield decreased even though the biomass of other plant parts continued to increase, thereby indicating luxury consumption of P with regard to grain yield. Beyond Pgy, total biomass reached a peak that corresponded with total P uptake of 730 mg P plant−1 (Pbm), and the total P uptake continued to increase with no further increase in total biomass.
Treating the P addition as the independent variable allowed us to examine how the P uptake influenced the other nutrients in each plant part. Figure 1, Figure 2 and Figure 3 illustrate this in the context of the threshold P uptake values, Pgy and Pbm, where the grain yield and total biomass reached a maximum, respectively. Visual references for Pgy and Pbm are indicated by the blue and red lines, respectively.

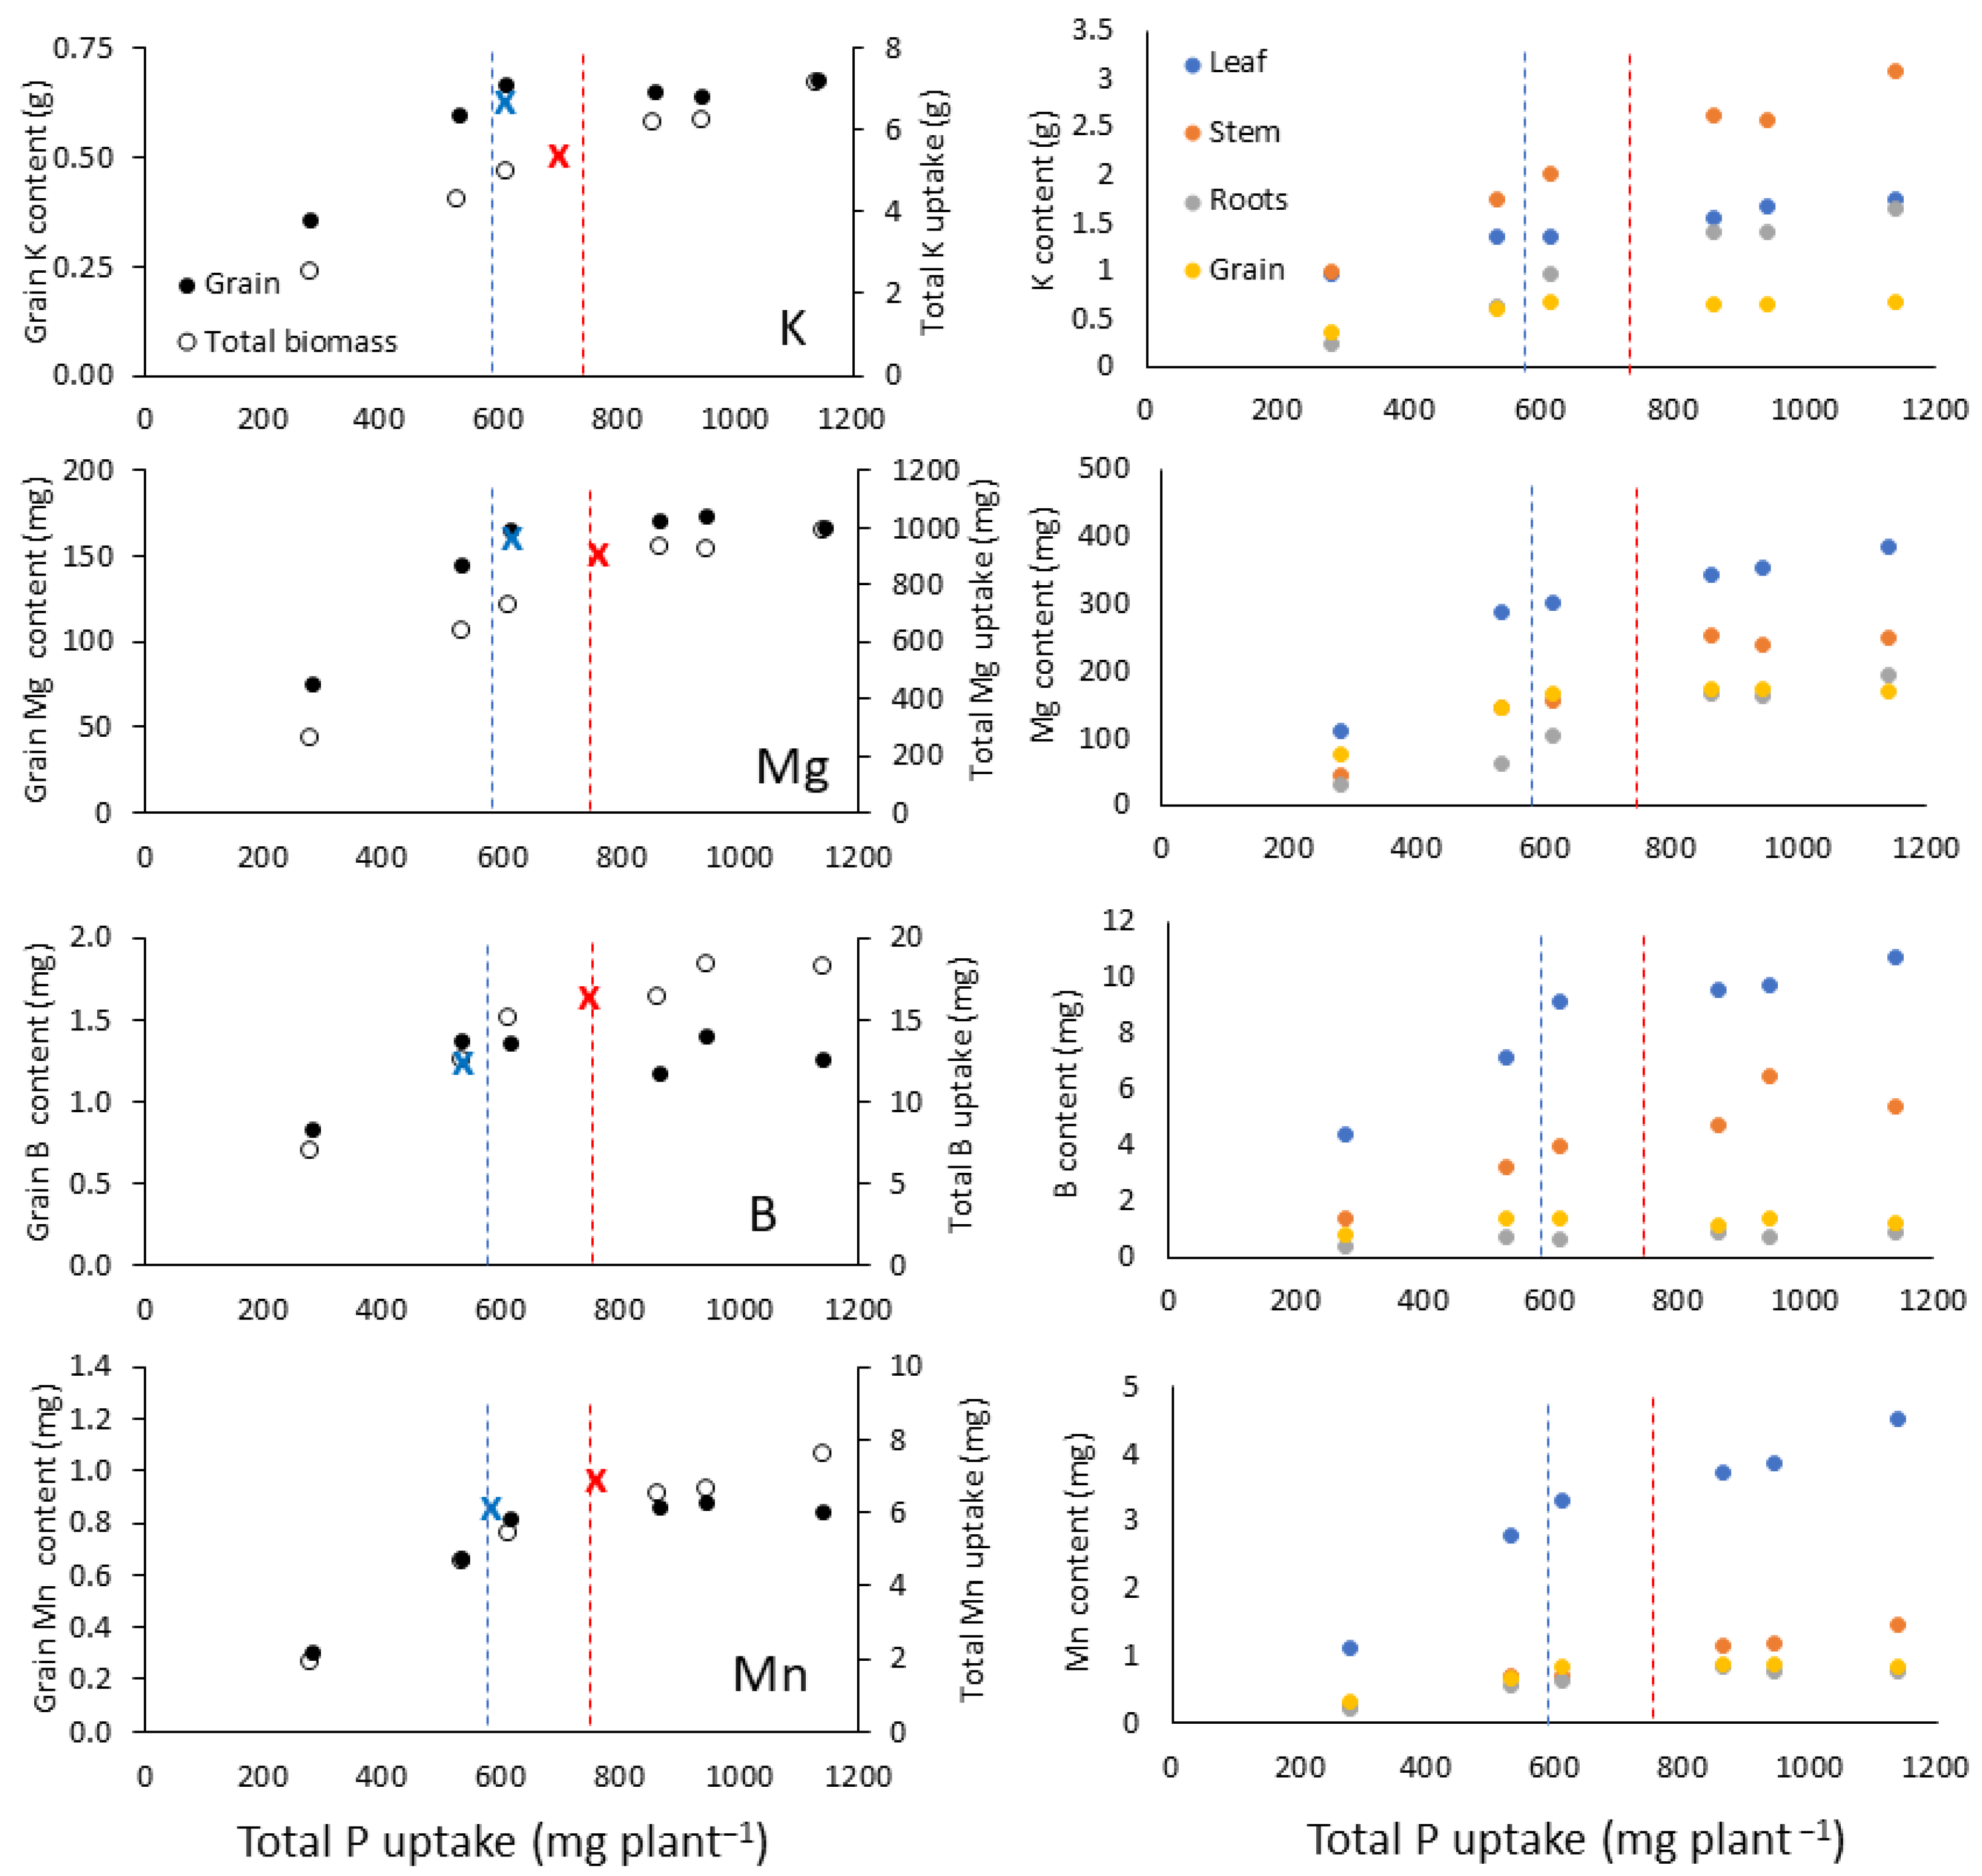
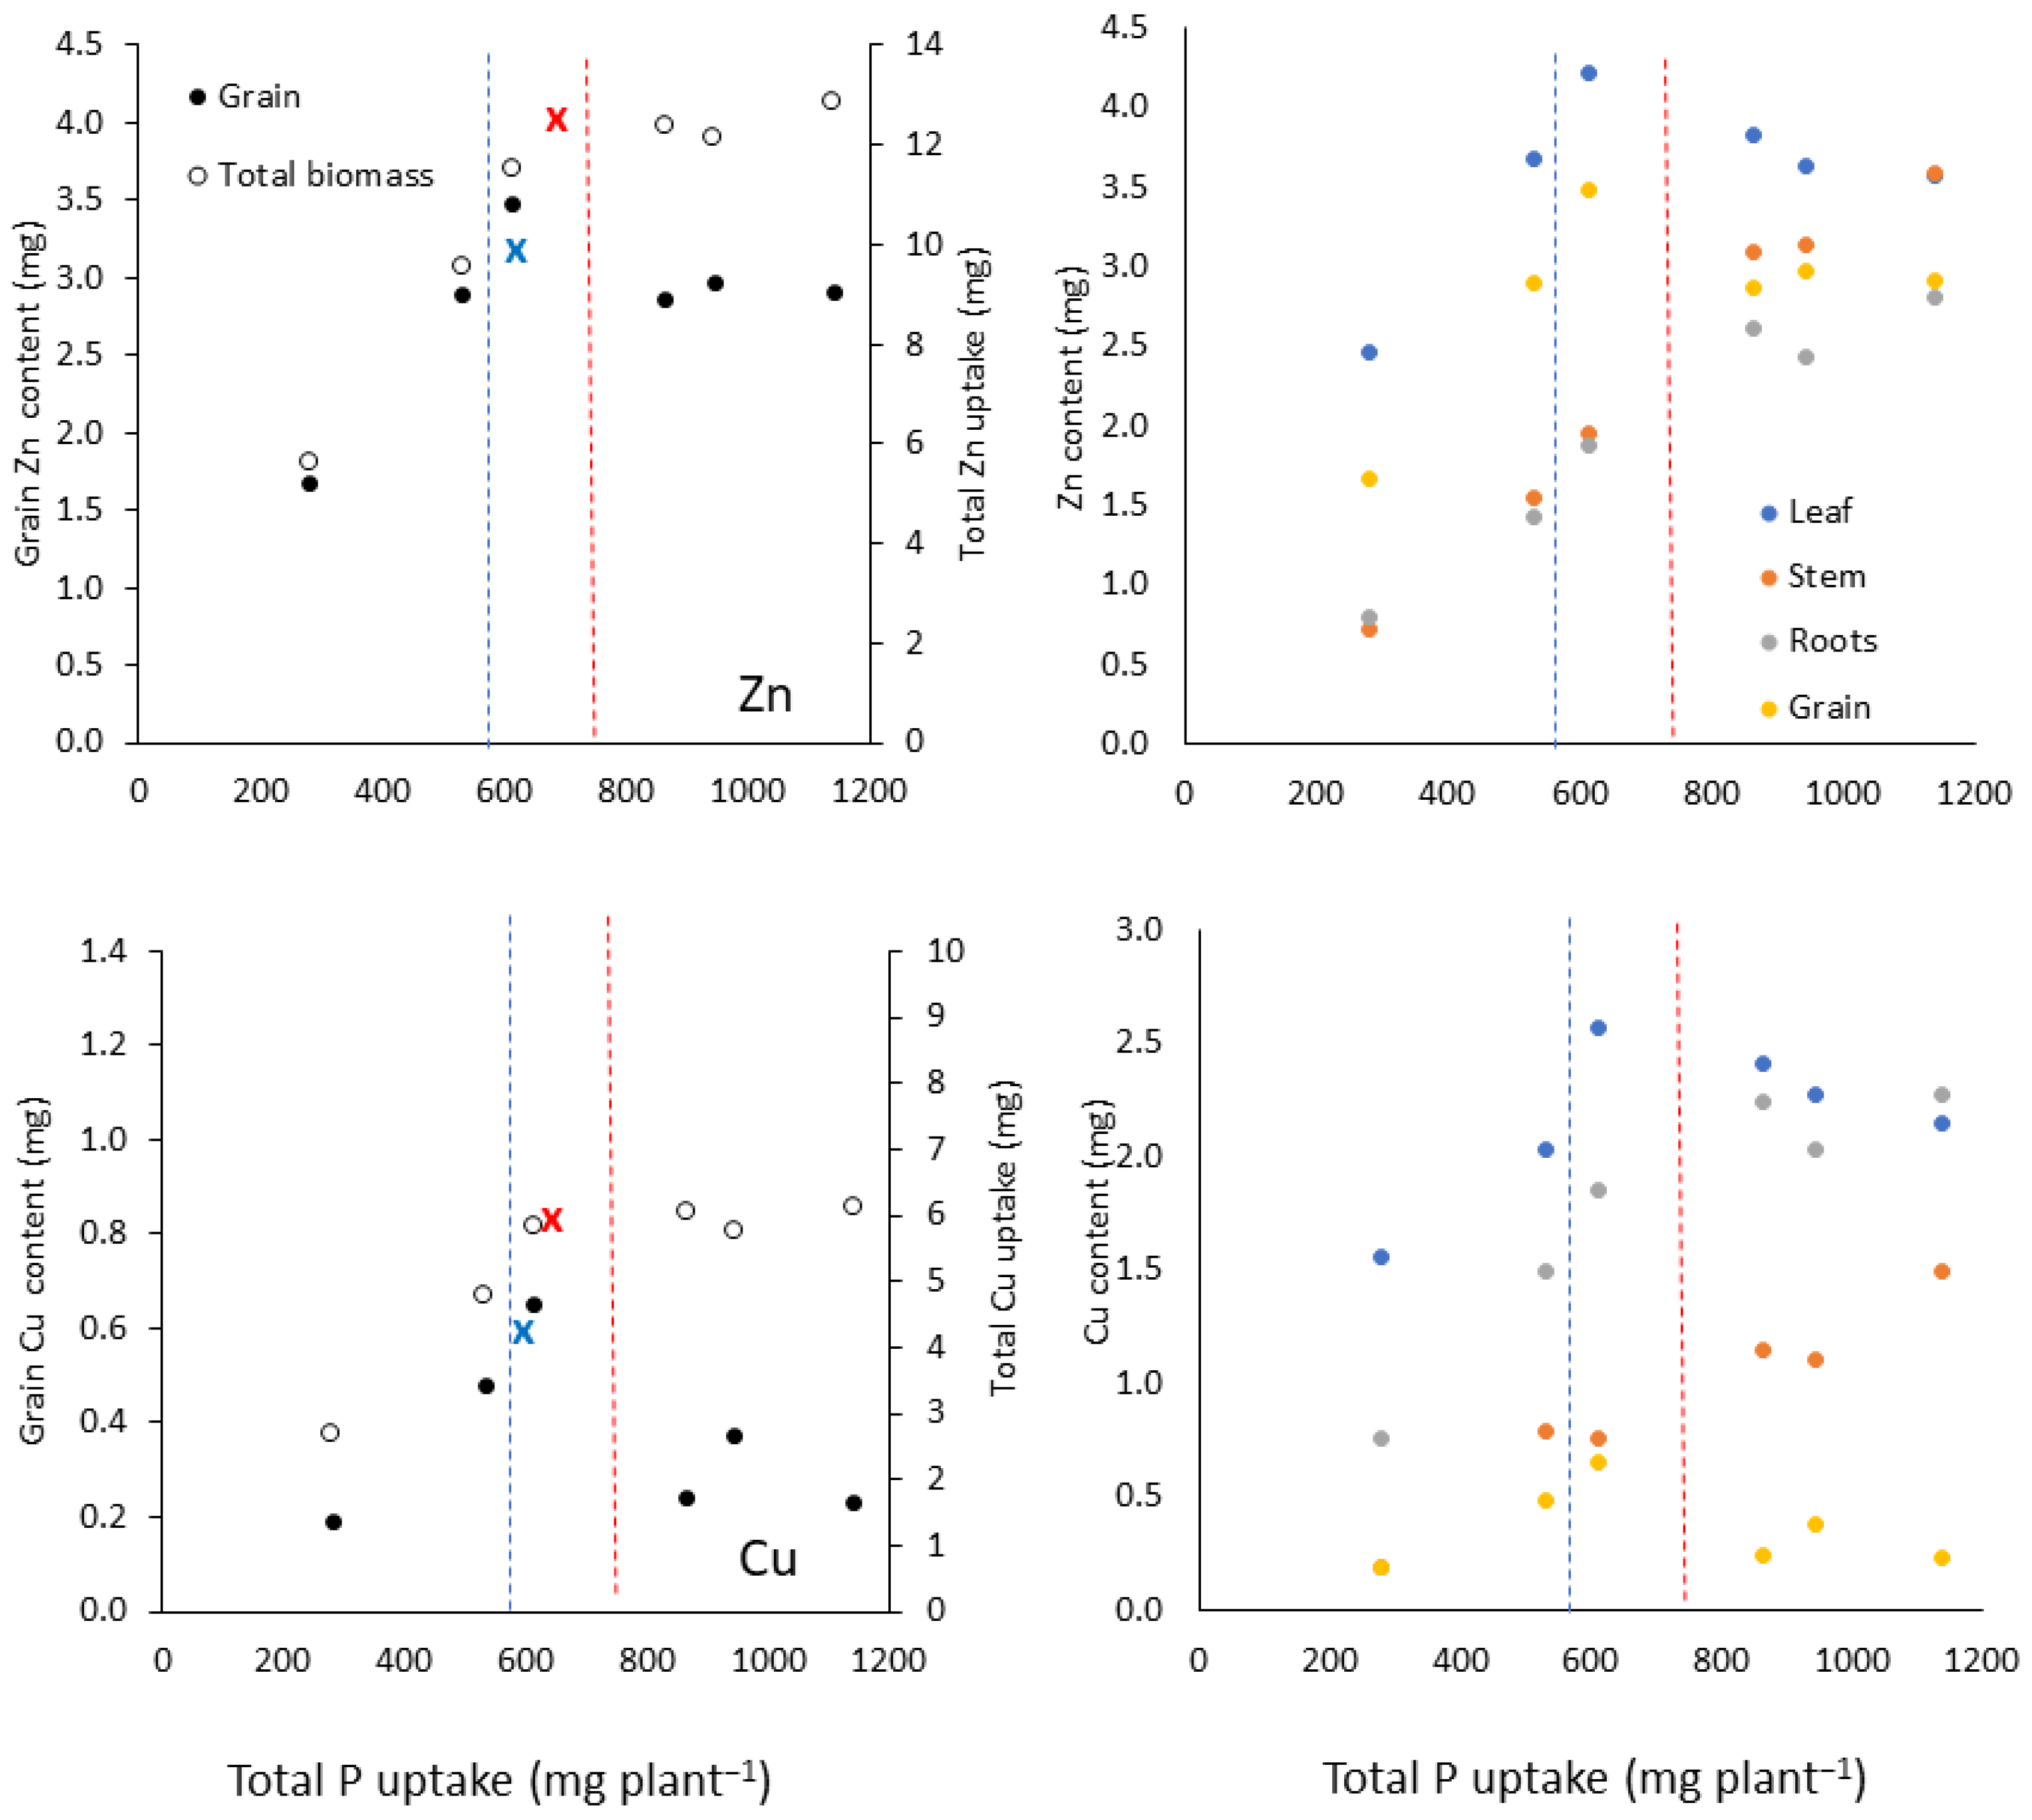
3.1. Nutrient Partitioning in Response to Phosphorus Uptake

As a function of total P uptake, three general patterns were observed for the content of other nutrients in the grain and the total uptake of these nutrients: (i) the grain nutrient content reached a plateau at the total P uptake value corresponding to the maximum grain yield, yet the total nutrient content of non-grain tissues continued with further P uptake (K, Mg, B, Mn; Figure 1); (ii) the grain nutrient content decreased at the P uptake value corresponding to maximum grain yield, while further uptake of these nutrients continued although it partitioned into non-grain plant parts (N, S, Fe; Figure 2); and (iii) the grain nutrient content reached a plateau at the P uptake value corresponding to maximum grain yield, followed by a decrease in grain nutrient content, while the total content reached a maximum (Zn, Cu; Figure 3). The “breakpoint” indicating the total P uptake value associated with a significant change in the relationship between total P uptake and grain content of the other nutrients is listed in Table 2, Table 3 and Table 4 and shown in Figure 1, Figure 2 and Figure 3 with a blue “X”. Similarly, the breakpoint P uptake level indicating a significant change in the relationship between total P uptake and total nutrient uptake is listed in Table 2, Table 3 and Table 4 and additionally indicated in Figure 1, Figure 2 and Figure 3 with a red “X”. Notice that, for all the nutrients, the P uptake level associated with the maximum grain nutrient content mostly coincided with Pgy (Figure 1, Figure 2 and Figure 3, blue line; Table 2, Table 3 and Table 4). For group 1 and 2 nutrients, the P uptake level associated with the maximum total uptake (red “X”) generally coincided with Pbm.
Figure 1. Potassium (K), magnesium (Mg), boron (B), and manganese (Mn) uptake and partitioning as a function of total phosphorus (P) uptake averaged over three maize cultivars and four replications. Dashed lines indicate total P uptake values where maximum grain yield (blue) and maximum biomass (red) were attained, 580 and 730 mg P plant−1, respectively. Potassium, Mg, B, and Mn responded similarly, as each reached a plateau in grain nutrient content at the P uptake value corresponding to the maximum grain yield, yet total nutrient uptake continued with further P uptake. “X” marks the breakpoint where a statistically significant change in slope occurs for grain content (blue) and total uptake (red), with values listed in Table 2. Equations for nutrient partitioning relationship are shown in Table 2. “Stem” includes stem, cob, and tassel, and “Leaf” includes leaves and husk.
Agronomy 13 00258 g001
Table 2. Statistical “breakpoint” for group 1 nutrients (K, Mg, B, and Mn) indicating the P uptake level per plant that corresponds to a change in the slope for the relationship with “Leaf” (leaves + husk), “Stem” (stem + cob + tassel), roots, grain, and total plant nutrient content, shown in Figure 1. Breakpoints are listed for the superior model, either linear-plateau or linear-linear, based on p value and R2. Corresponding intercept and slope values are listed for each model. “Slope2” indicates the second slope value after the breakpoint in the linear-linear model and, therefore, are not applicable (NA) to the linear-plateau model. “Joint level” indicates the nutrient content (i.e., y axis of Figure 1) associated with the breakpoint value. ***, **, and * indicate the significant effect of P treatment on nutrient content and root:shoot ratio at p ≤ 0.001, ≤0.01, and ≤0.05, respectively.
NutrientPlant PartModelP Uptake BreakpointInterceptSlopeSlope2Joint LevelR2
(mg P plant−1)mg or g plant−1mg or g
mg P−1
mg or g mg P−1mg or g plant−1
K (g)LeafLinear-linear6280.630.0010.00071.410.98 ***
StemLinear-linear6640.120.0030.00182.160.99 ***
RootsLinear-linear832−0.360.0020.00091.330.99 ***
GrainLinear-plateau5950.0940.001NA0.660.99 ***
TotalLinear-linear6790.500.0070.00365.440.99 **
Mg (g)LeafLinear-linear533−890.710.162880.99 ***
StemLinear-plateau840−540.36NA2450.99 ***
RootsLinear-plateau1041−370.22NA1920.97 **
GrainLinear-plateau630−0.810.27NA1700.99 ***
TotalLinear-plateau760−1391.4NA9500.99 ***
B (mg)LeafLinear-linear6120.500.0140.00358.780.98 ***
StemLinear-plateau823−0.770.008NA5.530.90 **
RootsLinear-plateau8000.160.0008NA0.850.82 *
GrainLinear-plateau5270.310.002NA1.310.84 *
TotalLinear-plateau7340.330.024NA17.70.97 **
Mn (mg)LeafLinear-linear583−0.790.0070.0023.140.99 ***
StemLinear-plateau8900.160.004NA4.150.90 **
RootsLinear-plateau742−0.130.001NA0.790.98 ***
GrainLinear-plateau647−0.1200.002NANA0.99 ***
TotalLinear-plateau747−1.100.011NANA0.97 **
Figure 2. Nitrogen (N), sulfur (S), and iron (Fe) uptake and partitioning as a function of total phosphorus (P) uptake, averaged over three maize cultivars and four replications. Dashed lines indicate total P uptake values where maximum grain yield (blue) and biomass (red) were attained, 580 and 730 mg P plant−1, respectively. Grain content and total uptake of N, S, and Fe grouped together as each decreased after reaching a plateau at the P uptake value corresponding with the maximum grain yield (blue line), yet total nutrient content increased in other plant parts with further P uptake. “X” marks the breakpoint where a statistically significant change in the slope occurs for grain content (blue) and total uptake (red), with values listed in Table 3. Equations for the nutrient partitioning relationship are shown in Table 3. “Stem” includes stem, cob, and tassel, and “Leaf” includes leaves and husk.
Agronomy 13 00258 g002
Table 3. Statistical “breakpoint” for group 2 nutrients (N, S, and Fe) indicating the P uptake level per plant that corresponds to a change in slope for the relationship with “Leaf” (leaves + husk), “Stem” (stem + cob + tassel), roots, grain, and total plant nutrient content, shown in Figure 2. Breakpoints are listed for the superior model, either linear-plateau or linear-linear, based on p value and R2. Corresponding intercept and slope values are listed for each model. “Slope2” indicates the second slope value after the breakpoint in the linear-linear model and, therefore, are not applicable (NA) to the linear-plateau model. “Joint level” indicates the nutrient content (i.e., y axis of Figure 2) associated with the breakpoint value. ***, **, and * indicate the significant effect of P treatment on nutrient content and root:shoot ratio at p ≤ 0.001, ≤0.01, and ≤0.05, respectively.
NutrientPlant PartModelP Uptake BreakpointInterceptSlopeSlope2Joint LevelR2
(mg P plant−1)mg or g plant−1mg or g
mg P−1
mg or g mg P−1mg or g plant−1
N (g)LeafLinear-plateau9260.380.001NA1.320.93 **
StemLinear-linear864−0.340.0030.0022.330.99 **
RootsLinear-plateau758−0.270.002NA1.270.97 ***
GrainLinear-linear5230.5030.006−0.0013.640.95 *
TotalLinear-plateau7180.820.010NA7.710.98 **
S (g)LeafLinear-plateau526−45.60.77NA3900.96 ***
StemLinear-linear757−48.90.370.152290.99 **
RootsLinear-plateau828−1260.72NA4700.99 ***
GrainLinear-linear57032.20.41−0.0752640.98 *
TotalLinear-plateau703−1452.1NA13550.99 ***
Fe (mg)LeafLinear-plateau8550.470.006NA5.570.99 ***
StemLinear-linear885−1.390.0080.0065.830.99 ***
RootsLinear-plateau745−5.310.062NA2.620.94 **
GrainLinear-linear5890.160.006−0.00143.580.96 *
TotalLinear-plateau758−5.70.08NA560.97 **
Figure 3. Zinc (Zn) and copper (Cu) uptake and partitioning as a function of total phosphorus (P) uptake averaged over three maize cultivars and four replications. Dashed lines indicate the total P uptake values where maximum grain yield (blue) and biomass (red) were attained, 580 and 730 mg P plant−1, respectively. Grain content and total uptake of Zn and Cu grouped together as each decreased after reaching a plateau at the P uptake value corresponding with maximum grain yield (blue line), and no further total uptake occurred with further P uptake. “X” marks the breakpoint where a statistically significant change in the slope occurs for grain content (blue) and total uptake (red), with values listed in Table 4. Equations for the nutrient partitioning relationship are shown in Table 4. “Stem” includes stem, cob, and tassel, and “Leaf” includes leaves and husk.
Agronomy 13 00258 g003
Table 4. Statistical “breakpoint” for group 3 nutrients (Zn and Cu) indicating the P uptake level per plant that corresponds to a change in slope for the relationship with “Leaf” (leaves + husk), “Stem” (stem + cob + tassel), roots, grain, and total plant nutrient content, as shown in Figure 3. Breakpoints are listed for the superior model, either linear-plateau or linear-linear, based on p value and R2. Corresponding intercept and slope values are listed for each model. “Slope2” indicates the second slope value after the breakpoint in the linear-linear model and, therefore, is not applicable (NA) to the linear-plateau model. “Joint level” indicates the nutrient content (i.e., y axis of Figure 3) associated with the breakpoint value. ***, **, and * indicate the significant effect of P treatment on nutrient content and root:shoot ratio at p ≤ 0.001, ≤0.01, and ≤0.05, respectively.
NutrientGrain or Total ContentModelP Uptake BreakpointInterceptSlopeSlope2Joint LevelR2
(mg P plant−1)mg plant−1mg mg P−1mg mg P−1mg plant−1
Zn (mg)LeafLinear-linear6131.150.005−0.0014.100.98 *
StemLinear-linear864−0.460.0040.0022.970.99 ***
RootsLinear-linear846−0.080.0030.00092.490.98 *
GrainLinear-linear6120.290.005−0.000953.310.96 *
TotalLinear-plateau6830.780.017NA12.50.99 ***
Cu (mg)LeafLinear-linear6740.80.003−0.0012.590.88 *
StemLinear-linear532−0.390.0020.0010.710.97 *
RootsLinear-plateau731−0.140.003NA2.180.97 ***
GrainLinear-linear612−0.130.0012−0.00070.580.80 *
TotalLinear-plateau6430.0940.0092NA6.00.97 **

3.1.1. Group 1 Nutrients: K, Mg, B, and Mn

Group 1 nutrients (Figure 1, Table 2) continued to increase in different plant parts after grain content reached a maximum. Mg, B, and Mn were mostly partitioned into leaf components, while K was deposited mostly into stem components. After the maximum grain content was reached, K and Mg continued to be deposited into the stem, leaf, and root components, while B and Mn only continued to accumulate in the stem and leaf, with the root content no longer increasing. The distribution of plant K and Mg was similar at Pgy and greater P uptake levels. Below Pgy levels, the proportion of total plant K content in the leaf was greater than at the Pgy level. The partitioning of Mg across plant tissues was similar when P uptake was ≥532 mg P plant−1. At a lesser P uptake, a higher percentage of Mg was partitioned to the grain than at higher P uptake levels. The leaf contained 59% of the biomass Mn when peak Mn content occurred near Pbm. The proportion of biomass Mn allocated to the stem increased from ~13% to ~19%, with P uptake increasing from Pgy to Pbm, while biomass Mn allocated to the grain decreased from ~16% to ~11%. The leaf, stem, and grain Mn concentration was significantly affected by P treatment (p < 0.01), although Mn concentration changed very little when P uptake exceeded 280 mg P plant−1, averaging 36, 6, 6, and 4 mg Mn kg−1 in the leaf, stem, root, and grain, respectively.

3.1.2. Group 2 Nutrients: N, S, and Fe

The decrease in grain partitioning for the nutrients in groups 2 and 3 with additional P uptake beyond Pgy was determined to be statistically significant based on a comparison of the linear-linear to linear-plateau models (Table 3 and Table 4). In that case, the linear-linear model produced a greater R2 value and a negative slope after the breakpoint. For the group 2 nutrients (N, S, and Fe), even though the nutrient partitioning into the grain decreased with further P uptake after Pgy, the plant continued to uptake those nutrients and deposit into the stem, roots, and leaf components (Figure 2, Table 3). N, S, and Fe were mostly partitioned into the grain and stem, roots and leaf components, and roots, respectively. Stem N content more than doubled at P uptake levels > Pgy, whereas leaf component and root N content increased by 40–50%. The increase in the leaf N content was roughly comparable to the reduction in grain N content. In contrast, the reduction in grain S content with P uptake beyond Pgy was primarily reflected in the increased root S content. Surprisingly, 29–35% of total plant S content was found in the roots at P levels > Pgy. Root S content (470 mg) at the three highest P rates was 71 and 21% greater than stem (263 mg) or leaf (388 mg) components, respectively.
Grain Fe content peaked at 3.6 mg plant−1 at a P content close to Pgy. Grain Fe content decreased by ~6% with further P uptake to the point of Pbm, and declined by 21% at the highest level of grain P content. Total Fe content plateaued near Pbm at 54 mg Fe plant−1. Root Fe was ~75% of the total Fe content at P uptake levels near Pgy. Between Pgy and Pbm, the root accumulated ~4x more Fe than the stem and leaf combined. The concentration of Fe in the leaf and grain was minimally affected by the P content and was 48 and 28 mg Fe kg−1, respectively. Unsurprisingly, P treatment did not significantly impact the leaf and grain Fe concentration at the p = 0.05 level. The root Fe concentration was much higher than that in the leaf or grain, averaging 313 mg Fe kg−1 across all P rates. Based on these observations, it appeared that excess P content reduced the translocation of Fe from root to shoot, which has been previously noted in maize [3].

3.1.3. Group 3 Nutrients: Zn and Cu

Group 3 nutrients (Zn and Cu) peaked at a P uptake near Pgy, and then the grain Zn and Cu contents decreased with further P uptake (Figure 3, Table 4). However, unlike the nutrients in group 2, the total uptake no longer increased with additional P uptake. Zn and Cu were mostly present in the leaf components and least in the roots (Zn) and grain (Cu). At the highest P uptake, the Zn contents in the leaf and stem were similar (3.6 mg Zn plant−1), but at lower P uptake, leaf tissue contained up to 3-fold more Zn than stem tissue. In addition to the declining grain Zn and Cu content with P uptake beyond Pgy, the leaf content of Zn and Cu also decreased. In contrast, the stem and root Zn and Cu content continued to increase with increased P uptake.
The root and stem had similar Zn content at P uptake ≤ Pgy, but, at higher P uptake, the Zn content was greater in the stem than the root. The increase in Zn in the root and stem at >Pgy was slightly greater than the decrease in the grain and leaf. Leaf Zn concentration decreased significantly (p < 0.01) with each increment of P from ~50 to ~30 mg Zn kg−1; whereas the stem, root, and grain remained relatively constant across the range of P rates, averaging 15, 19, and 15 mg Zn kg−1, respectively (i.e., P treatment had no significant effect on the stem, root, and grain Zn concentration). This contrasts with Zhang et al. [9] who found a 5 mg Zn kg−1 decline in grain Zn with P rates from 0 to 200 kg P ha−1 in a 2-year field study. The decline in the stover (leaf and stem) Zn concentration in their study was less consistent than that seen in grain, but was in the range of 4–5 mg Zn kg−1 lower for most P rates compared to the 0 kg P ha−1 rate. The authors concluded that the reductions in arbuscular mycorrhizal fungi with increased P fertilization decreased Zn uptake.
Similar to the response seen with Zn, grain and leaf Cu declined (~64 and ~17%, respectively) after reaching peak content, despite biomass Cu remaining static after the plateau breakpoint occurring at 643 mg P plant−1 (Figure 3 and Table 4). At P uptake > Pgy, the Cu content of the stem and root increased at a similar magnitude to the decreases in grain and leaf Cu. The root and leaf Cu contents were similar at P uptake ≥ Pgy, and were each 1.5–2-fold greater than stem Cu content. Awan and Abbasi [4], in a greenhouse experiment, measured a substantial reduction in above-ground tissue Cu concentration at maize tasseling with addition of P equivalent to 100 kg P ha−1, compared to 50 kg P ha−1. This occurred without a reduction in dry weight at 0 or 5 kg Cu ha−1. The authors suggested that P and Cu might interact in the soil, affecting “absorption and translocation of P and Cu within maize plants”.
The Cu concentration in the grain peaked at 2.9 mg Cu kg−1 at optimal P uptake and declined to 1.4 mg Cu kg−1, averaged across the three highest P contents. The leaf Cu concentration was reduced from 30 to 20 mg Cu kg−1 with P uptake > Pgy, while the stem Cu was unaffected by P fertilization rates greater than 4 mg P L−1, averaging 6.5 mg Cu kg−1 at P rates > 4 mg P L−1. Root Cu concentration ranged from 16 to 21 mg Cu kg−1 and was unaffected by P rate. Consequently, the Cu concentrations in leaf and grain only were found to be significantly impacted by the P application rate (p < 0.01). In a two-year field study, the application of P fertilizer at rates ranging from 12.5 to 200 kg P ha−1 decreased the Cu concentration in grain (~23% at the highest P rate) and stover (all above-ground plant tissues, except grain), compared to no P fertilization [5]. Grain and stover Cu at 200 kg P ha−1 were ~1.5 and 4 to 6 mg Cu kg−1, respectively. The concentration of Fe in grain and straw was unaffected by P rate, ranging narrowly in grain from ~18 to ~20 mg Fe kg−1 in each year of the study, with stover averaging ~150 mg Fe kg−1 in the first year of the study and ~200 mg Fe kg−1 in the second year.

3.2. Nutrient Partitioning and the Decrease in Grain Yield with Excess P Uptake

The changes in nutrient partitioning, including P, with increased P uptake may explain the observation in Penn et al. [1], where grain yield significantly decreased with P uptake beyond 580 mg P plant−1. As previously discussed, all three nutrient groups reached a peak in grain content at approximately the P uptake level corresponding with the maximum grain yield (i.e., Pgy). However, groups 1 and 2 continued to deposit nutrients into other plant parts with increasing P uptake. In contrast, the content of group 3 nutrients (Zn and Cu) in non-grain tissue did not continue with further P uptake beyond Pgy (Figure 3). We hypothesize that the decrease in grain yield at P uptake levels > Pgy is partly due to lesser grain protein production arising from poor Zn, Cu, and Fe translocation to the grain.
First, Cu, Zn, and Fe accumulated in the roots simultaneously as grain content decreased with P uptake beyond Pgy (Figure 2 and Figure 3). Phosphorus also accumulated in the roots [1]. Four main theories exist for how excessive P can promote Cu, Zn, and Fe problems: excess soil P may (i) reduce the Cu, Zn, and Fe solubility in the soil via precipitation and, therefore, prevent uptake [10,11,12,13,14,15]; (ii) excess P in the plant may prevent the translocation of the nutrients to the grain [3,6,12,16,17,18,19,20,21,22]; (iii) excessive dilution of tissue concentrations in response to P [12,23]; or (iv) reduced mycorrhizal infection of roots [24].
While visible symptoms of Cu, Zn, or Fe deficiency did not occur, Shulka and Morris [25] demonstrated that visual symptoms are not necessary in cases of deficiency in maize; rather, “hidden hunger” may be occurring. Since soil was excluded from this study by utilizing silica-sand culture, the possibility of a reduced Cu, Zn, and Fe grain content by precipitation with P externally can be eliminated. Moreover, speciation modeling of the concentrated nutrient solutions using MINTEQ [26] did not predict the precipitation of any solid metal phosphates or metal-phosphate complexes, except for solution Mg and Ca-phosphate complexes, which represented less than 0.2% of solution Mg and Ca. More than 99% of the solution Cu, Zn, and Fe were predicted to be complexed with EDTA. In neither case was visible precipitation observed. Next, while mycorrhizal infection was unlikely under these conditions, it would not be necessary for micronutrient uptake since all nutrients were already supplied via solution with no sorption to silica-sand. Finally, excessive dilution of Cu, Zn, and Fe due to increased biomass production can be ruled out since the leaf concentrations were within the sufficiency range for mature plants [27]. Interestingly, the grain nutrient concentrations of Zn and Fe were mostly unaffected with P uptake > Pgy, while the grain Cu concentration decreased. Using the same data set, Wiethorn et al. [8] listed the nutrient concentrations for all plant parts and showed that none were considered deficient.
Awan and Abbasi [4] postulated that increasing P fertilization of a sandy loam soil reduced above-ground plant Cu content via Cu precipitation within roots and inhibition of Cu uptake. Similar to this study, Zhang et al. [9] applied increasing P rates (0 to 200 kg P ha−1) to maize and observed that further P uptake beyond reaching maximum grain yield resulted in significant decreases in grain Zn and Cu content. Not only did the grain content decrease with increased P uptake from 440 to 550 mg P plant−1 (not including roots), but the total shoot Zn and Cu content decreased. Specifically, Zn and Cu content decreased from about 3.2 to 2.9 and 1.0 to 0.9 mg plant−1, respectively. However, it is impossible to ascertain the mechanism from their study, since roots were not harvested. Sayafa [6] found that increasing the P application rate to maize from 0 to 75 mg L−1 resulted in a significant decrease in the Cu uptake rate, from 2.38 to 0.27 ng g−1 root day−1 (fresh root weight). In addition, the author noted an antagonistic effect of Zn on Cu uptake rate. Iszaki [7] evaluated the effect of P fertilization on maize production and nutrient partitioning; high P applications reduced Cu and Zn concentrations in tissue, but with no decrease in yield.
More research has been conducted on P–Zn than for P–Cu interactions in maize; several authors have shown how excessive P decreases Zn content in the shoots as well as the yield [6,18,20,21,22,28]. Safaya [6] evaluated maize yield and nutrient uptake in soil within a greenhouse under treatments of varying P:Zn ratios. In the absence of additional Zn, increasing P concentrations decreased the dry matter of both roots and shoots, while application of Zn to high P treatments increased the yield, producing the highest mass of roots and shoots for the experiment. After further evaluation of nutrient uptake, the author found that increased P reduced Zn concentration and uptake, and resulted in a four-fold greater Zn uptake in the roots than in the shoots compared to the lesser P application rates. The author hypothesized that excess P inhibits Zn uptake by reducing its translocation through the endodermis into the root xylem, and lowering its rate of uptake through the epidermal or surface cell layer of the root. Similarly, Warnock [20] grew maize for 56 days at several P:Zn application ratios and measured relative Zn mobility with regard to its ability to translocate from the roots to the shoot. The relative mobility of Zn decreased with increasing P:Zn application ratio, indicating an accumulation of Zn in the roots, i.e., preventing translocation to the shoots. Increasing the P application rate from 65 to 100 kg ha−1 with no additional Zn application on a calcareous soil reduced the yield of maize roots, stem, and leaves from 3.6, 2.2, and 5.5 g pot−1 to 2.4, 1.7, and 3.5 g pot−1, respectively [22]. Drissi et al. [29] grew maize for silage on a soil with low levels of extractable Zn, and applied several combinations of three levels of Zn and four levels of P. Phosphorus application did not increase biomass production unless Zn was also applied. Increasing P application rate without applying additional Zn caused a decrease in the kernel dry weight, kernels per ear, shoot Zn concentration, and an increase in root Zn concentration. In a long-term fertility study on maize, Bogdanovic et al. [30] found that P fertilizer treatment decreased the Zn concentration in the stalks (from 21 to 7 mg kg−1) and leaves (from 30 to 13 mg kg−1).
In the current study, it appears that excess P uptake inhibited the translocation of Cu, Zn, and Fe to the grain, causing a decrease in grain yield. Specifically, these nutrients accumulated in the roots in the same fashion as P. It is likely that these micronutrients were bound with phytate, which has a strong affinity for micronutrients, decreasing their solubility [31,32]. In addition, Cu and Zn were the only nutrients in which their total uptake reached a maximum that coincided at the same P uptake level that coincided with both maximum grain Cu and Zn content and maximum grain yield (Figure 3), i.e., beyond the maximum grain Cu and Zn content and yield, further P uptake did not result in any increase in total Cu and Zn uptake. However, it is interesting that while the decreased Cu and Zn in grain resulting from root accumulation could cause a decrease in grain yield, the plant continued to produce further biomass in its non-grain parts. One possible explanation is that Cu and Zn limit grain production more than other types of plant tissue. Furthermore, recall that the grain N and S content decreased with excess P uptake, which signifies a decrease in protein content; grain concentrations of N and S also decreased after reaching the maximum yield. The protein content of maize grain is typically around 7.8% [33], and no other maize tissue contains appreciable protein. The zein protein that dominates maize is composed of amino acids that are rich in N, while some additionally contain S. Specifically, zein contains S-rich amino acids, methionine, and cysteine [33]. Although Cu, Zn, and Fe are not components of amino acids that comprise zeins, each is considered a necessary cofactor in the synthesis of amino acids [34,35,36,37]. Therefore, since Cu, Zn, and Fe translocation to grain was inhibited by excess P in the roots (Figure 2 and Figure 3), the plant became limited in its ability to utilize N and S to produce amino acids and proteins, resulting in a concomitant reduction in grain N and S content as well as grain yield. We hypothesize that N and S that could not be utilized to synthesize more grain was instead used for further growing plant parts that contain less protein: specifically, increased stem biomass for N, and leaf and roots for S (Figure 2). Cakmak et al. [38] noted that Fe and proteins are intimately co-located in seed tissues, in addition to a high positive correlation between Zn, Fe, and protein in seeds [39], suggesting that “protein is a sink for Zn and Fe”.

4. Implications and Conclusions

Potassium, Mg, Mn, B, N, S, Fe, Cu, and Zn all achieved maximum grain content at P uptake levels that coincided with the maximum grain yield, while the partitioning of K, Mg, Mn, B, N, S, and Fe into other non-grain tissue continued with further P uptake. With P luxury consumption beyond the point of maximum grain yield, N, S, Fe, Cu, and Zn grain content significantly decreased along with grain yield, even though total plant uptake continued for N, S, and Fe, and increased the total biomass via non-grain tissue. Based on the change in nutrient partitioning with P uptake, Cu, Zn, and Fe accumulated in the roots with further P uptake beyond the 580 mg P plant−1 required for achieving the maximum grain yield. Partitioning of P into roots also increased with further P uptake. Ultimately, further grain production with luxury P uptake was limited by P-inhibited translocation of Cu, Zn, Fe, or some combination, from roots to grain. This decrease in translocation did not prevent further non-grain tissue growth since those nutrients were not as limiting as they are for grain. We hypothesized that those micronutrients limited protein production, which was evident from the decrease in N and S grain content which coincided with the decrease in grain yield, concomitant with luxury P uptake.
Although excess P uptake or fertilization resulting in a decreased grain yield due to decreased Cu, Zn, or Fe has been noted on several occasions, the exact mechanism was not known, since soil P tie-up of micronutrients usually cannot be separated from tie-up in the roots. This study, however, eliminated the possibility of soil nutrient tie-up and provided strong evidence for reduced yield occurring from a decrease in grain protein due to poor micronutrient translocation from root micronutrient tie-up with P. While luxury P consumption by maize certainly occurs in the field, as discussed in part one of this companion paper [1], it is more likely that it results in a plateau rather than a decrease in grain yield, as observed in the current study. Several studies over five decades have provided field evidence for decreased grain yield with increased P applications due to its effects on micronutrient availability and utilization. First, this is likely to only occur on soils that are limited in their ability to supply Cu, Zn, or Fe, e.g., sandy or low-organic matter soils. Second, in light of the results of this study and others, it is possible that grain yield could be increased further with increased P fertility accompanied by increased micronutrient supply/availability. An alternative theory is that the maize grain yield had already reached its maximum genetic potential after 580 mg P uptake plant−1, and any further addition of micronutrients to the high P treatments would not increase the grain yield beyond the highest level observed; i.e., it would only prevent the grain production from decreasing. Regardless, luxury P consumption did not decrease total biomass production, so this would not be a problem if the maize were intended to be used for purposes other than grain use, such as silage or biofuel feedstock, although silage protein content can be very important to animal diets. Future experiments conducted using silica-sand growing media may be utilized to further our understanding of how P interacts with micronutrients within the plant and its effects on yield. Such information will be useful to help balance fertility programs and provide more specific soil fertility recommendations.

Author Contributions

Conceptualization, C.J.P., J.J.C. and M.A.W.; methodology, C.J.P., M.A.W. and J.J.C.; formal analysis, C.J.P. and J.J.C.; investigation, C.J.P. and J.J.C.; original draft preparation, C.J.P.; writing—review and editing, J.J.C. and M.A.W.; project administration, C.J.P.; funding acquisition, C.J.P. All authors have read and agreed to the published version of the manuscript.

Funding

This research was a contribution from the Long-Term Agroecosystem Research (LTAR) network. LTAR is supported by the United States Department of Agriculture.

Data Availability Statement

Data are contained within the article.

Conflicts of Interest

The authors declare no conflict of interest. The funders had no role in the design of the study; in the collection, analyses, or interpretation of the data; in the writing of the manuscript; or in the decision to publish the results.

Abbreviations

Pgy, optimal P uptake for maximum grain yield; Pbm, optimal P uptake for maximum total biomass production

References

  1. Penn, C.J.; Camberato, M.W. How Much Phosphorus Uptake is Required for Achieving Maximum Maize Grain Yield? Part 1: Luxury Consumption and Implications for Yield. Agronomy 2023, 13, 95. [Google Scholar] [CrossRef]
  2. Ciampitti, I.A.; Vyn, T.J. Nutrient sufficiency concepts for modern corn hybrids: Impacts of management practices and yield levels. Crop Manag. 2014, 13, 1–7. [Google Scholar] [CrossRef] [Green Version]
  3. Mathan, K.K.; Amberger, A. Influence of iron on the uptake of phosphorus by maize. Plant Soil 1977, 46, 413–422. [Google Scholar] [CrossRef]
  4. Awan, Z.I.; Abbasi, M.K. Interactive effect of phosphorus and copper on maize growth. Pakistan J. Agric. Res. 2000, 16, 105–108. [Google Scholar]
  5. Zhang, W.; Zou, C.; Chen, X.; Liu, Y.; Liu, D.; Yang, H.; Deng, Y.; Chen, X. Phosphorus application decreased copper concentration but not iron in maize grain. Agronomy 2020, 10, 1716. [Google Scholar] [CrossRef]
  6. Safaya, N.M. Phosphorus-zinc interaction in relation to absorption rates of phosphorus, zinc, copper, manganese, and iron in corn. Soil Sci. Soc. Am. J. 1976, 40, 719–722. [Google Scholar] [CrossRef]
  7. Izsáki, Z. Effects of phosphorus supplies on the nutritional status of maize (Zea mays L.). Commun. Soil Sci. Plant Anal. 2014, 45, 516–529. [Google Scholar] [CrossRef]
  8. Wiethorn, M.; Penn, C.; Camberato, J. A Research Method for Semi-Automated Large-Scale Cultivation of Maize to Full Maturity in an Artificial Environment. Agronomy 2021, 11, 1898. [Google Scholar] [CrossRef]
  9. Zhang, W.; Chen, X.-X.; Liu, Y.-M.; Liu, D.-Y.; Chen, X.-P.; Zou, C.-Q. Zinc uptake by roots and accumulation in maize plants as affected by phosphorus application and arbuscular mycorrhizal colonization. Plant Soil 2017, 413, 59–71. [Google Scholar] [CrossRef]
  10. Loneragan, J.F. The effect of applied phosphate on the uptake of zinc by flax. Aust. J. Biol. Sci. 1951, 4, 108–114. [Google Scholar] [CrossRef] [PubMed] [Green Version]
  11. Bingham, F.T. Relation between phosphorus and micronutrients in plants. Soil Sci. Soc. Am. J. 1963, 27, 389–391. [Google Scholar] [CrossRef]
  12. Olsen, S.R. Micronutrient interactions. In Micronutrients in Agriculture; Dinauer, R.C., Ed.; Soil Science Society of America: Madison, WI, USA, 1972; pp. 243–264. [Google Scholar]
  13. Tagwira, F.; Piha, M.; Mugwira, L. Effect of pH, and phosphorus and organic matter contents on zinc availability and distribution in two Zimbabwean soils. Commun. Soil Sci. Plant Anal. 1992, 23, 1485–1500. [Google Scholar] [CrossRef]
  14. Tagwira, F.; Piha, M.; Mugwira, L. Zinc studies in Zimbabwean soils: Effect of lime and phosphorus on growth, yield, and zinc status of maize. Commun. Soil Sci. Plant Anal. 1993, 24, 717–736. [Google Scholar] [CrossRef]
  15. Hamilton, M.A.; Westermann, D.T.; James, D.W. Factors affecting zinc uptake in cropping systems. Soil Sci. Soc. Am. J. 1993, 57, 1310–1315. [Google Scholar] [CrossRef] [Green Version]
  16. Burleson, C.A.; Dacus, A.D.; Gerard, C.J. Effect of Phosphorus Fertilization on the Zinc Nutrition of Several Irrigated Crops. Soil Sci. Soc. Am. J. 1961, 5, 365–368. [Google Scholar] [CrossRef]
  17. Langin, E.J.; Ward, R.C.; Olson, R.A.; Rhoades, H.F. Factors responsible for poor response of corn and grain sorghum to phosphorus fertilization: II. Lime and P placement effects on P-Zn relations. Soil Sci. Soc. Am. J. 1962, 26, 574–578. [Google Scholar] [CrossRef]
  18. Stukenholtz, D.D.; Olsen, R.J.; Gogan, G.; Olson, R.A. On the mechanism of phosphorus-zinc interaction in corn nutrition. Soil Sci. Soc. Am. J. 1966, 30, 759–763. [Google Scholar] [CrossRef]
  19. Sharma, K.C.; Krantz, B.A.; Brown, A.L.; Quick, J. Interaction of Zn and P in Top and Root of Corn and Tomato 1. Agron. J. 1968, 60, 453–456. [Google Scholar] [CrossRef]
  20. Warnock, R.E. Micronutrient uptake and mobility within corn plants (Zea mays L.) in relation to phosphorus-induced zinc deficiency. Soil Sci. Soc. Am. J. 1970, 34, 765–769. [Google Scholar] [CrossRef]
  21. Adriano, D.C.; Paulsen, G.M.; Murphy, L.S. Phosphorus-Iron and Phosphorus-Zinc Relationships in Corn (Zea mays L.) Seedlings as Affected by Mineral Nutrition 1. Agron. J. 1971, 63, 36–39. [Google Scholar] [CrossRef]
  22. Orabi, A.A.; Abdallah, A.; Mashadi, H.; Barakat, A.H. Zinc-phosphorus relationship in the nutrition of corn plants (Zea mays L.) grown on some calcareous soils. Plant Soil 1981, 59, 51–59. [Google Scholar] [CrossRef]
  23. Loneragan, J.F.; Grove, T.S.; Robson, A.D.; Snowball, K. Phosphorus toxicity as a factor in zinc-phosphorus interactions in plants. Soil Sci. Soc. Am. J. 1979, 43, 966–972. [Google Scholar] [CrossRef]
  24. Moraghan, J.T.; Mascagni, H.J., Jr. Environmental and soil factors affecting micronutrient deficiencies and toxicities. Micronutr. Agric. 1991, 4, 371–425. [Google Scholar]
  25. Shulka, U.C.; Morris, H.D. Relative efficiency of several zinc sources for corn. Agron. J 1967, 59, 200–202. [Google Scholar]
  26. Allison, J.D.; Brown, D.S.; Novo-Gradac, K.J. MINTEQA2/PRODEFA2, A Geochemical Assessment Model for Environmental Systems: Version 3.0 User’s Manual; Environmental Research Laboratory; Office of Research and Development; US Environmental Protection Agency: Washington, DC, USA, 1991.
  27. Campbell, C. Reference Sufficiency Ranges for Plant Analysis in the Southern Region of the United States; Southern Region Agricultural Experiment Station: Fayetteville, AR, USA, 2000. [Google Scholar]
  28. Karimian, N. Effect of nitrogen and phosphorus on zinc nutrition of corn in a calcareous soil. J. Plant Nutr. 1995, 18, 2261–2271. [Google Scholar] [CrossRef]
  29. Drissi, S.; Aït Houssa, A.; Bamouh, A.; Coquant, J.-M.; Benbella, M. Effect of zinc-phosphorus interaction on corn silage grown on sandy soil. Agriculture 2015, 5, 1047–1059. [Google Scholar] [CrossRef] [Green Version]
  30. Bogdanovic, D.; Ubavic, M.; Cuvardic, M. Effect of phosphorus fertilization on Zn and Cd contents in soil and corn plants. Nutr. Cycl. Agroecosystems 1999, 54, 49–56. [Google Scholar] [CrossRef]
  31. Lönnerdal, B. Phytic acid–trace element (Zn, Cu, Mn) interactions. Int. J. Food Sci. Technol. 2002, 37, 749–758. [Google Scholar] [CrossRef]
  32. Schlemmer, U.; Frølich, W.; Prieto, R.M.; Grases, F. Phytate in foods and significance for humans: Food sources, intake, processing, bioavailability, protective role and analysis. Mol. Nutr. Food Res. 2009, 53, S330–S375. [Google Scholar] [CrossRef]
  33. Shukla, R.; Cheryan, M. Zein: The industrial protein from corn. Ind. Crops Prod. 2001, 13, 171–192. [Google Scholar] [CrossRef]
  34. Sharma, A.; Patni, B.; Shankhdhar, D.; Shankhdhar, S.C. Zinc–an indispensable micronutrient. Physiol. Mol. Biol. Plants 2013, 19, 11–20. [Google Scholar] [CrossRef] [PubMed]
  35. Clemens, S. Metal ligands in micronutrient acquisition and homeostasis. Plant. Cell Environ. 2019, 42, 2902–2912. [Google Scholar] [CrossRef] [PubMed] [Green Version]
  36. Talib, E.A.; Outten, C.E. Iron-sulfur cluster biogenesis, trafficking, and signaling: Roles for CGFS glutaredoxins and BolA proteins. Biochim. Biophys. Acta BBA-Mol. Cell Res. 2021, 1868, 118847. [Google Scholar] [CrossRef] [PubMed]
  37. Hendrix, S.; Verbruggen, N.; Cuypers, A.; Meyer, A.J. Essential trace metals in plant responses to heat stress. J. Exp. Bot. 2022, 73, 1775–1788. [Google Scholar] [CrossRef] [PubMed]
  38. Cakmak, I.; Pfeiffer, W.H.; McClafferty, B. Biofortification of durum wheat with zinc and iron. Cereal Chem. 2010, 87, 10–20. [Google Scholar] [CrossRef]
  39. Peterson, C.J.; Johnson, V.A.; Mattern, P.J. Inluence of Cultivar and Environment on Mineral and Protein Concentrations of Wheat Flour, Bran, and Grain. Cereal Chem. 1986, 63, 183–186. [Google Scholar]
Table 1. Nutrient content and partitioning per maize plant for leaves and husk (Leaf), stem, cob and tassel (Stem), roots, grain, and total biomass, shown for each phosphorus (P) treatment and averaged over four reps and three hybrids. ** and * indicate the significant effect of the P treatment on the nutrient content and root:shoot ratio at p ≤ 0.01 and ≤0.05, respectively. Std: standard deviation.
P Treatment (mg L−1)Leaf (mg)Stem (mg)Roots (mg)Grain (mg)Total Biomass (mg)Root:Shoot
N
Avg **StdAvg **StdAvg **StdAvg **StdAvg **StdAvg **Std
4664165556357299192218256037007740.090.05
89431641366584801240346766865766960.140.04
129601421410403976306373254170786880.160.06
1512624562456153612713353336143683259820.180.05
20120539824951486116647130701274793714020.170.05
2214264402970101213685172956951872110890.180.07
K
Avg **StdAvg **StdAvg **StdAvg **StdAvg **StdAvg **Std
49703129851472372293606625525930.090.08
81345514173428962332159911843018930.170.08
12135737420155979663416706450087260.240.08
1515454702606924139946365127962029610.300.12
20165769425658501398651642249626315110.290.12
22174355030696141652921676230714012420.300.16
P
Avg **StdAvg **StdAvg **StdAvg **StdAvg **StdAvg *Std
430619613521825280280.050.02
85044723341440154532550.070.03
125512562244164581476131460.100.10
1590521641517928532213864650.100.04
20943921617387415472469431080.100.05
22158833151111195954826311401820.130.08
S
Avg **StdAvg **StdAvg **StdAvg *StdAvg **StdAvg **Std
41715252198050146294481170.210.12
836610115545237892485010061780.320.12
1239565169523301332558711501660.410.18
153639425410746014225412113311950.540.20
203849124413746736323311613274470.520.34
22417792909948328321810814083620.510.25
Mg
Avg **StdAvg **StdAvg **StdAvg **StdAvg **StdAvg *Std
410931431730267513257660.130.10
828765146466334145196401010.110.06
12300531565010445165157261140.170.07
15344111252101164103171709311920.220.16
2035393237137163107173679272560.200.10
223851212477819291167489912240.240.08
Fe
Avg **StdAvg **StdAvg **StdAvg **StdAvg **StdAvgStd
42.10.61.00.811101.80.516112.11.23
83.81.22.81.331133.30.841143.10.97
124.00.63.51.430153.61.041162.61.20
155.41.85.73.243113.21.457403.23.09
205.51.46.13.342222.91.657232.91.28
225.81.47.22.237182.91.153192.30.98
Zn
Avg **StdAvg **StdAvg **StdAvg **StdAvg **StdAvg **Std
42.50.50.70.40.80.41.70.361.20.160.06
83.71.01.60.91.40.52.90.5102.00.180.06
124.20.91.91.01.90.93.50.3122.50.190.08
153.81.63.12.52.60.82.91.2123.10.290.11
203.61.33.12.12.41.03.01.1122.80.250.08
223.61.23.61.42.81.52.91.1132.80.280.14
B
Avg **StdAvg **StdAvgStdAvgStdAvg **StdAvgStd
44.41.21.40.80.380.270.80.371.50.060.04
87.21.43.32.50.720.621.40.6134.00.060.03
129.21.73.92.10.610.291.40.3153.20.040.02
159.62.24.72.80.910.301.20.6163.50.060.02
209.82.06.55.80.740.221.40.7186.20.050.02
2210.73.35.43.10.900.951.30.6185.20.050.04
Cu
AvgStdAvg **StdAvg **StdAvg *StdAvg **StdAvgStd
41.60.640.20.070.80.360.190.092.70.70.440.25
82.00.630.80.731.50.730.480.484.81.50.500.24
122.60.800.80.361.91.020.650.635.82.20.490.26
152.41.131.10.482.20.840.240.156.01.40.620.24
202.30.891.10.512.01.040.380.435.81.30.560.31
222.10.901.50.512.31.380.230.136.11.90.600.37
Mn
Avg **StdAvg **StdAvg **StdAvg **StdAvg **StdAvgStd
41.10.310.240.120.210.110.310.091.90.50.120.05
82.80.770.690.450.550.260.670.194.71.20.130.05
123.30.770.700.210.610.240.820.145.41.00.130.05
153.71.071.140.570.840.530.860.436.51.50.150.08
203.80.871.200.660.750.300.880.366.71.30.130.04
224.51.021.460.550.770.440.840.337.61.30.110.06
Disclaimer/Publisher’s Note: The statements, opinions and data contained in all publications are solely those of the individual author(s) and contributor(s) and not of MDPI and/or the editor(s). MDPI and/or the editor(s) disclaim responsibility for any injury to people or property resulting from any ideas, methods, instructions or products referred to in the content.

