
Evaluation of Monitored Erosion Events in the Context of Characteristics of Source Areas in Czech Conditions

 , , and
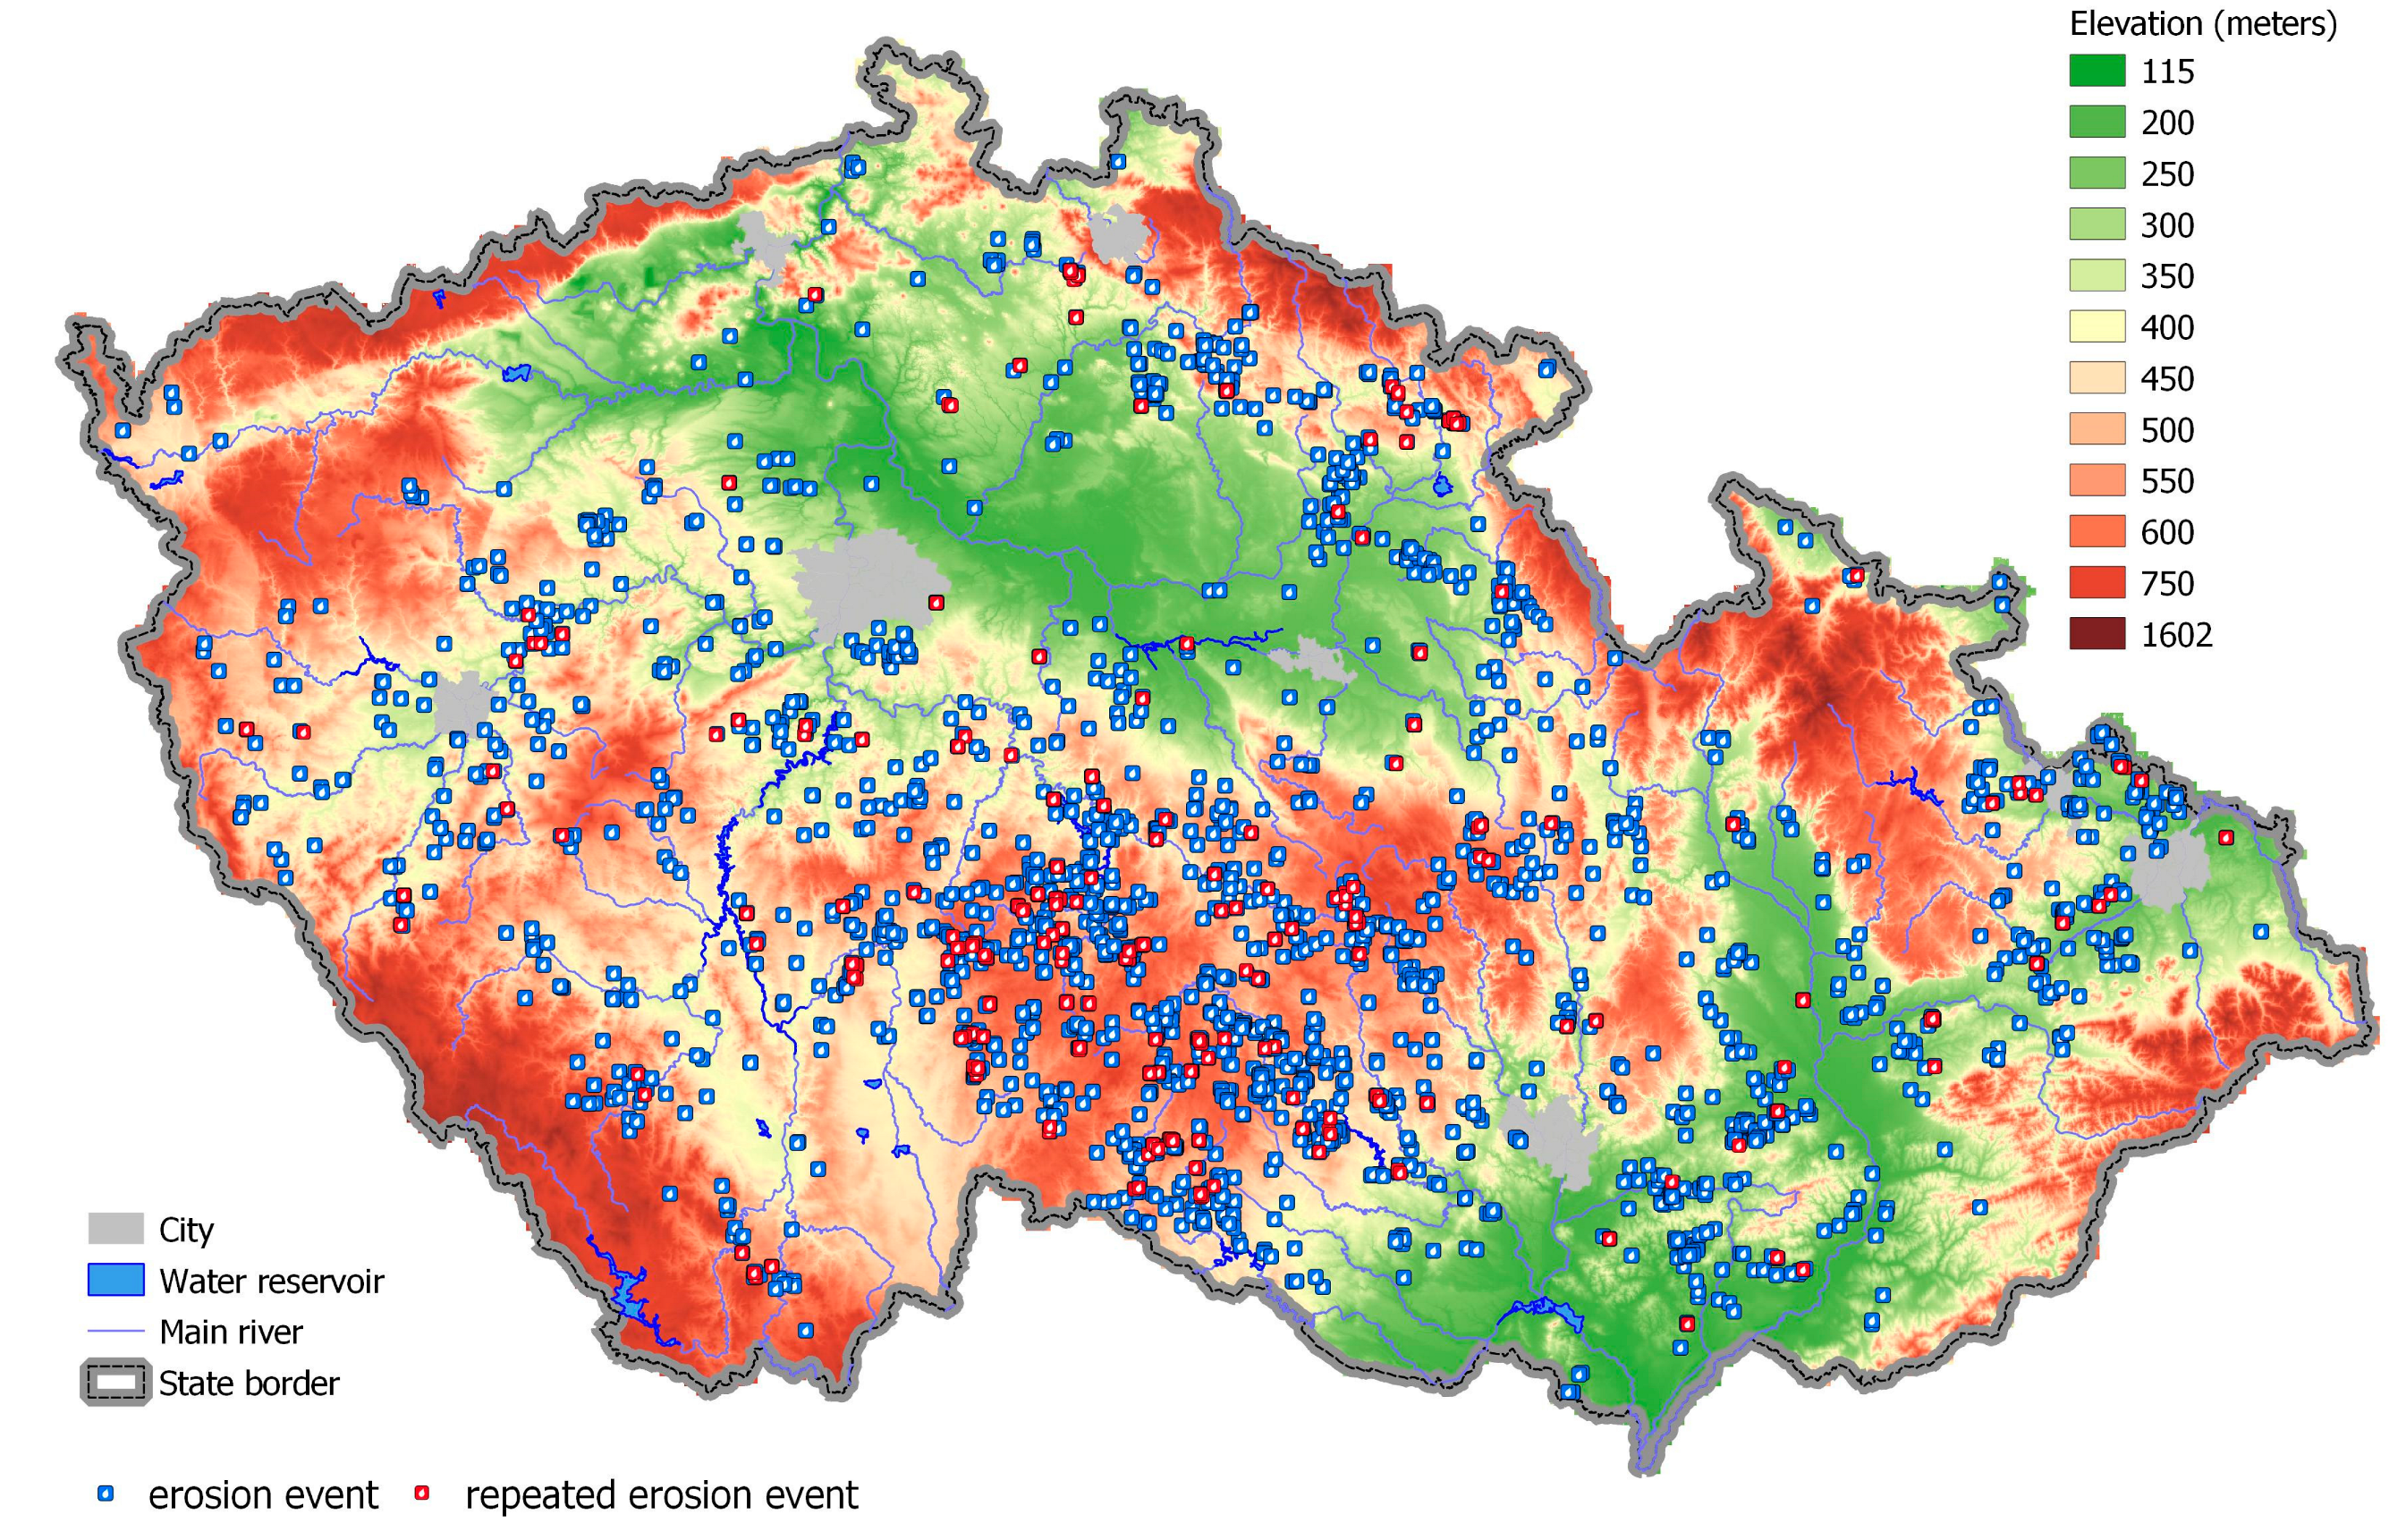
Abstract
:1. Introduction
2. Materials and Methods
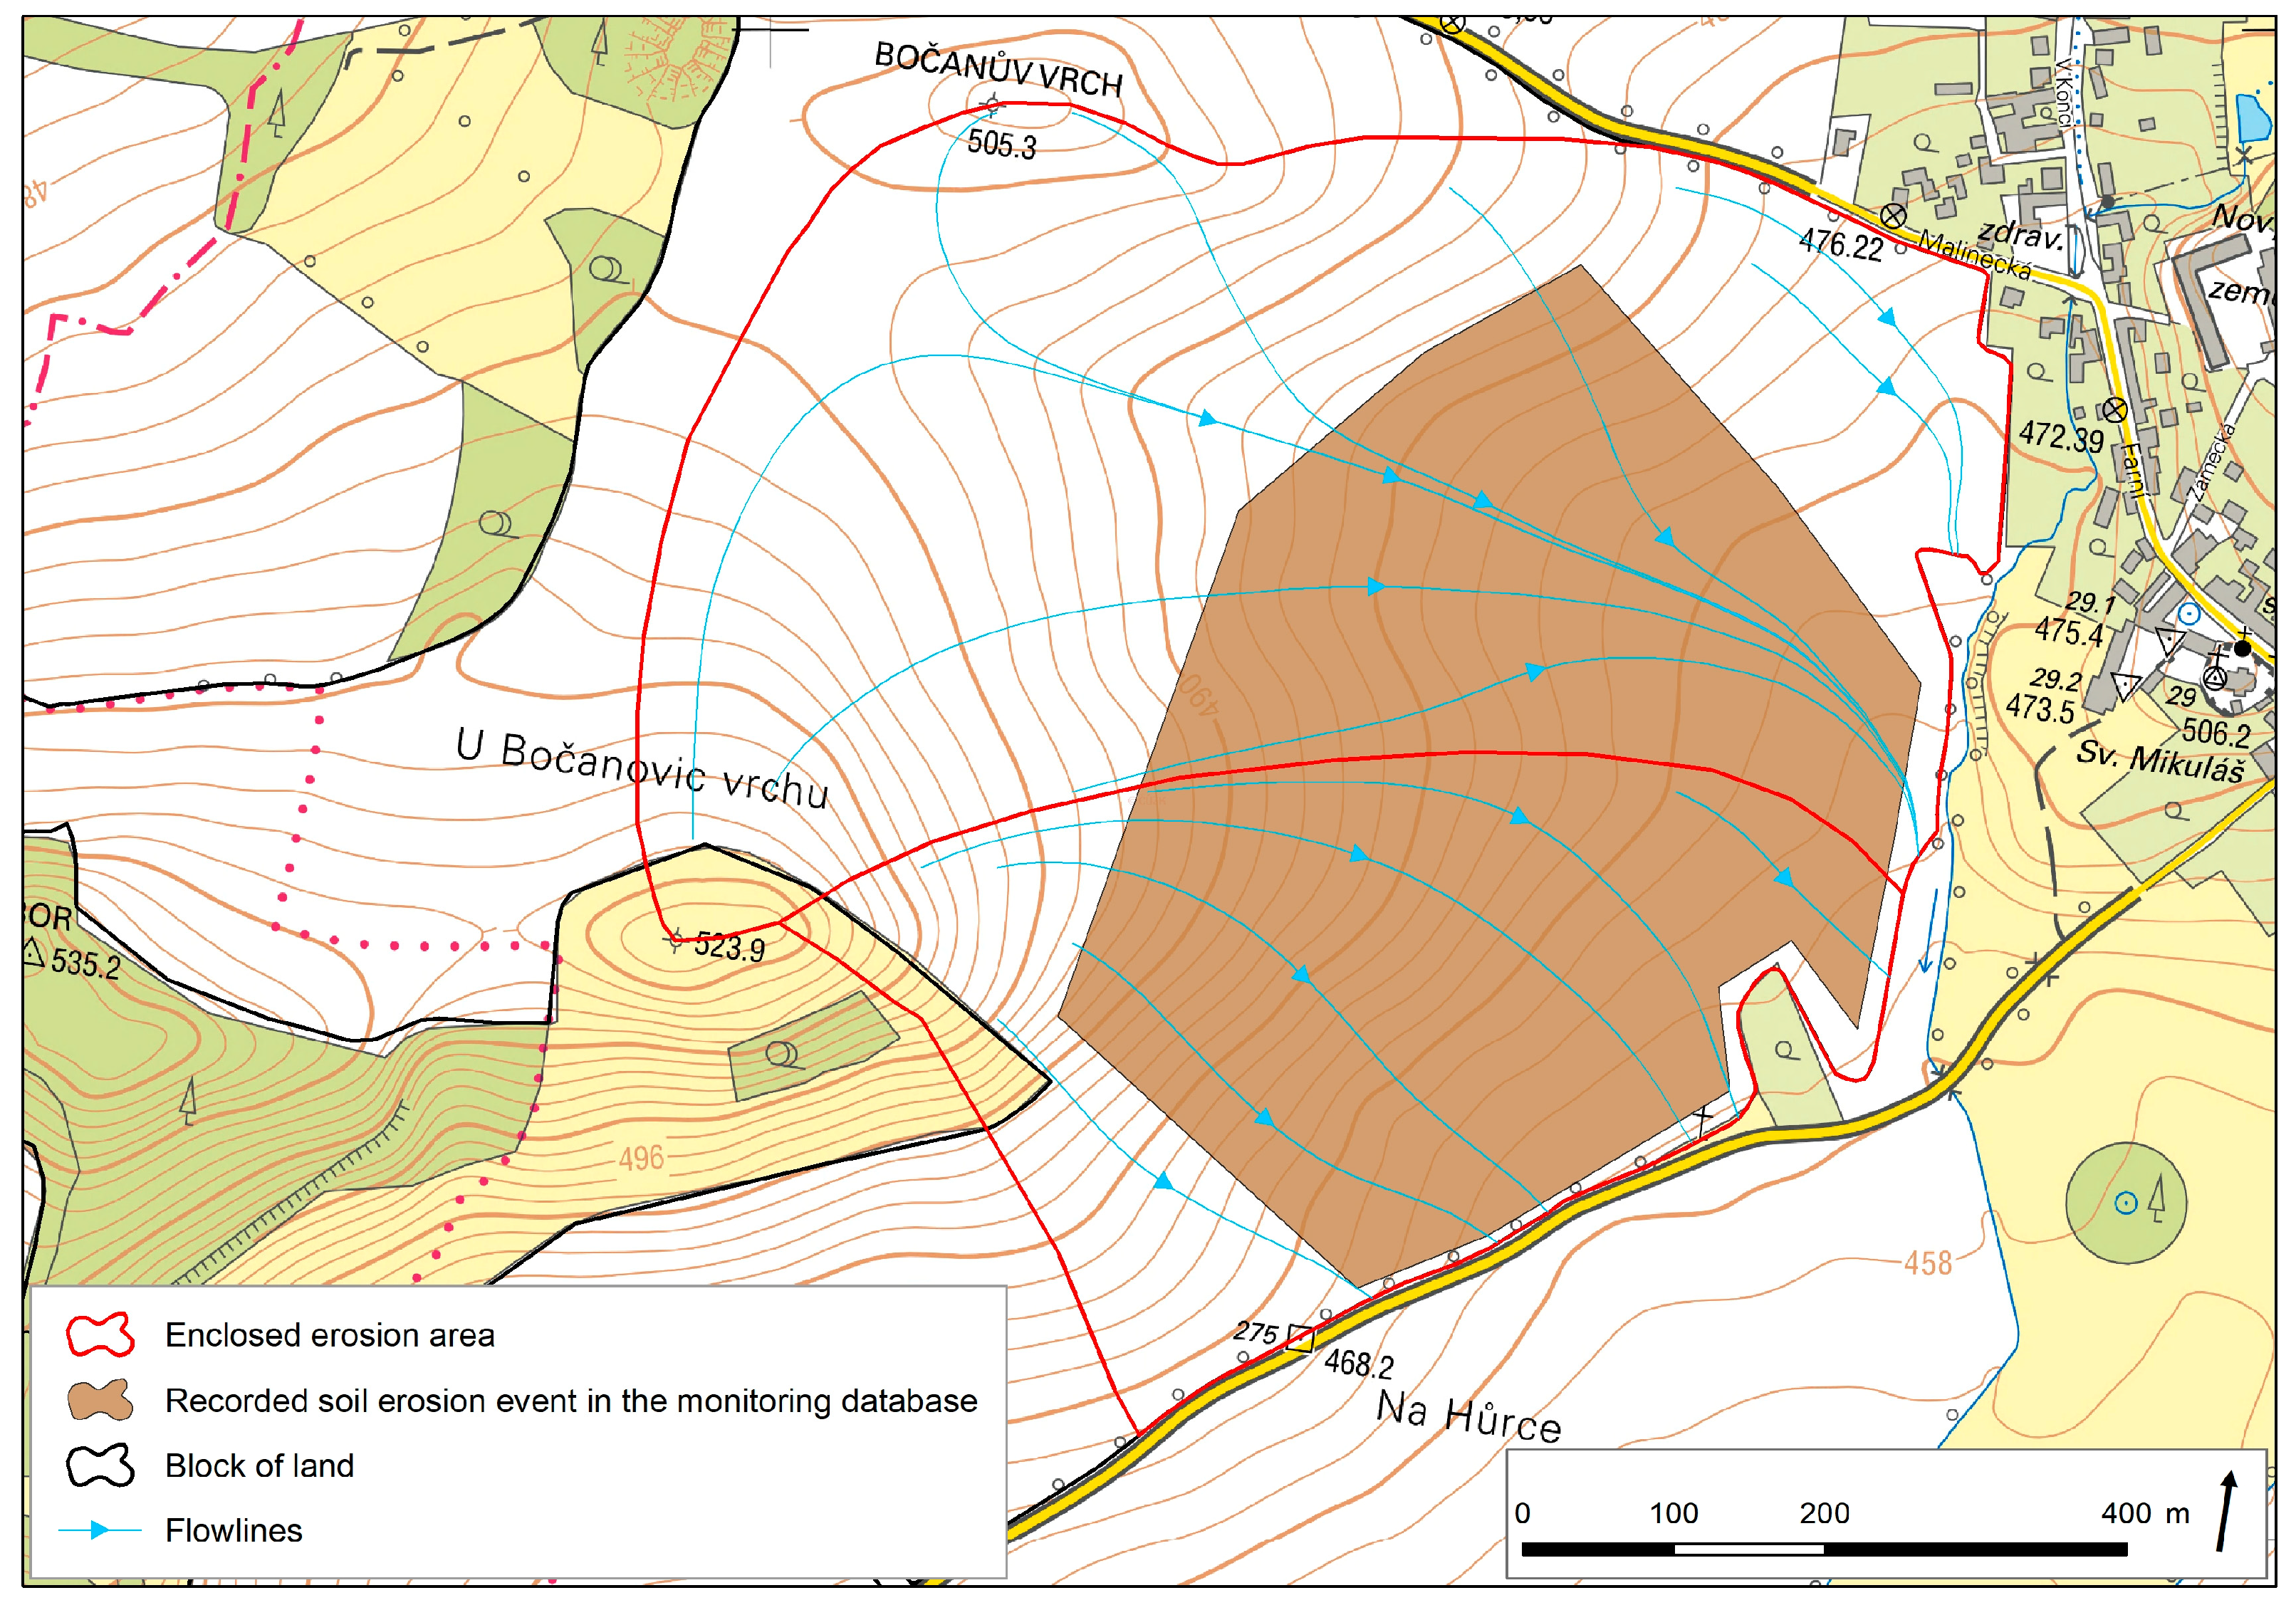
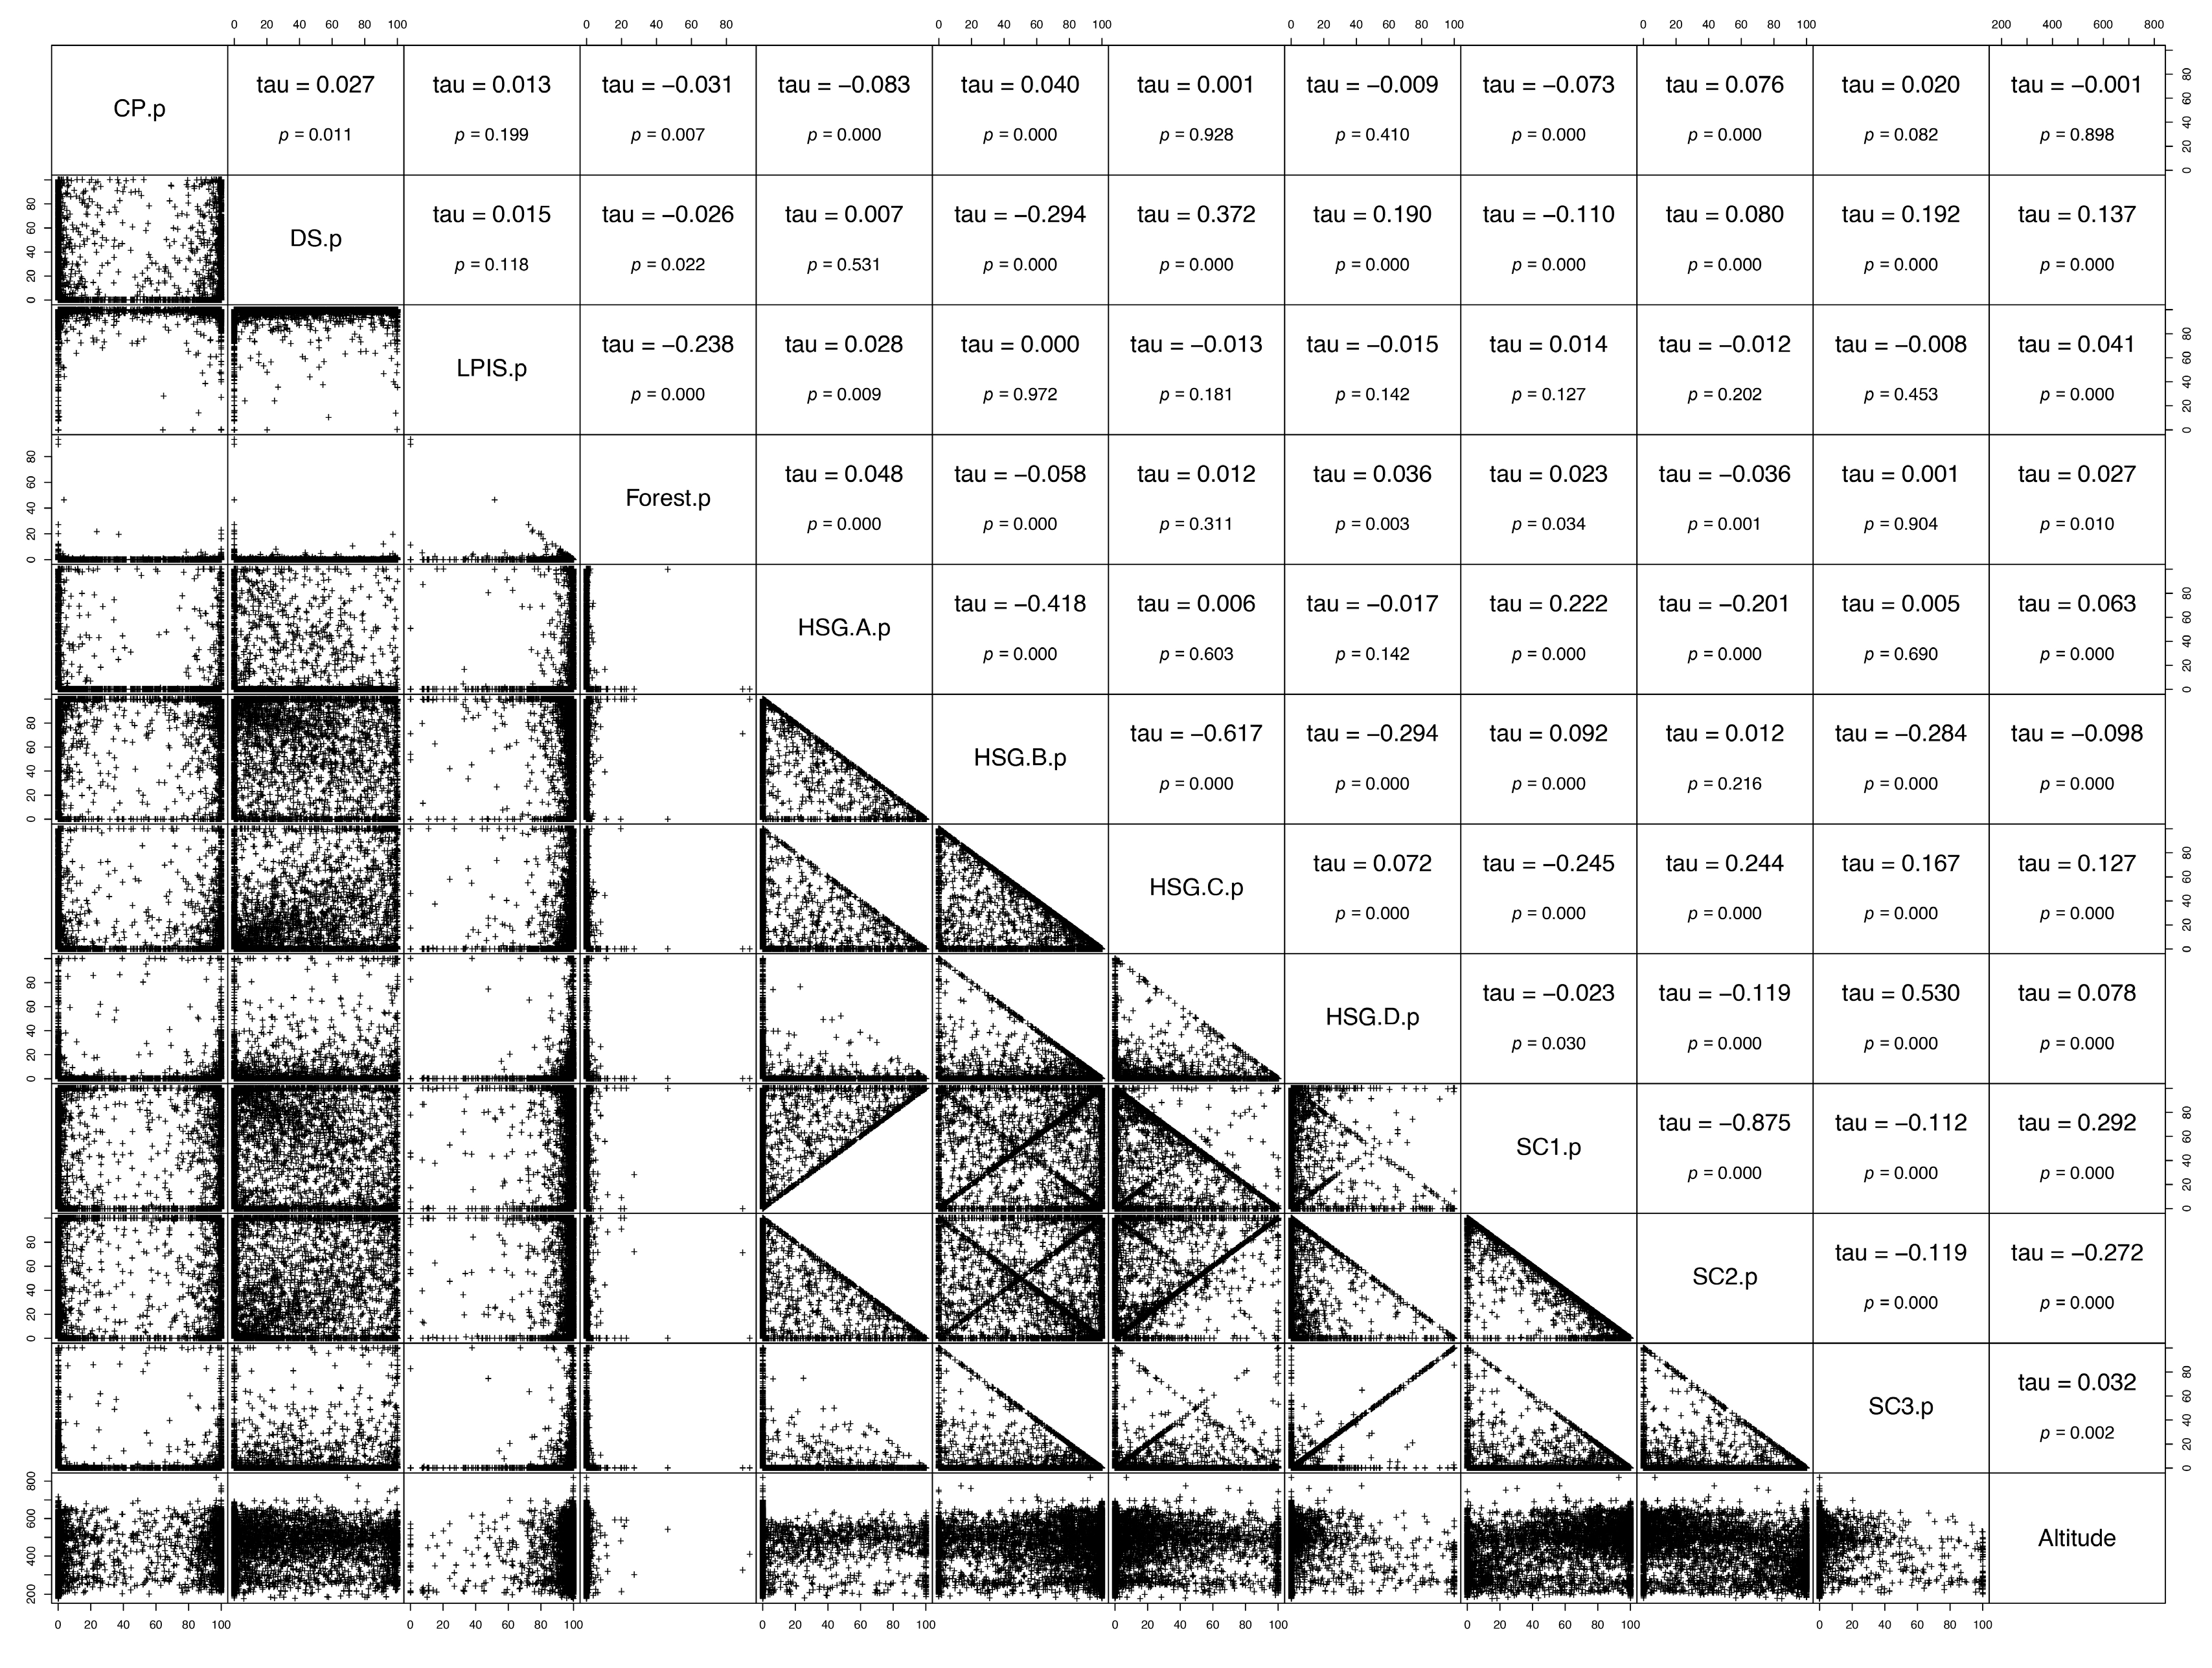
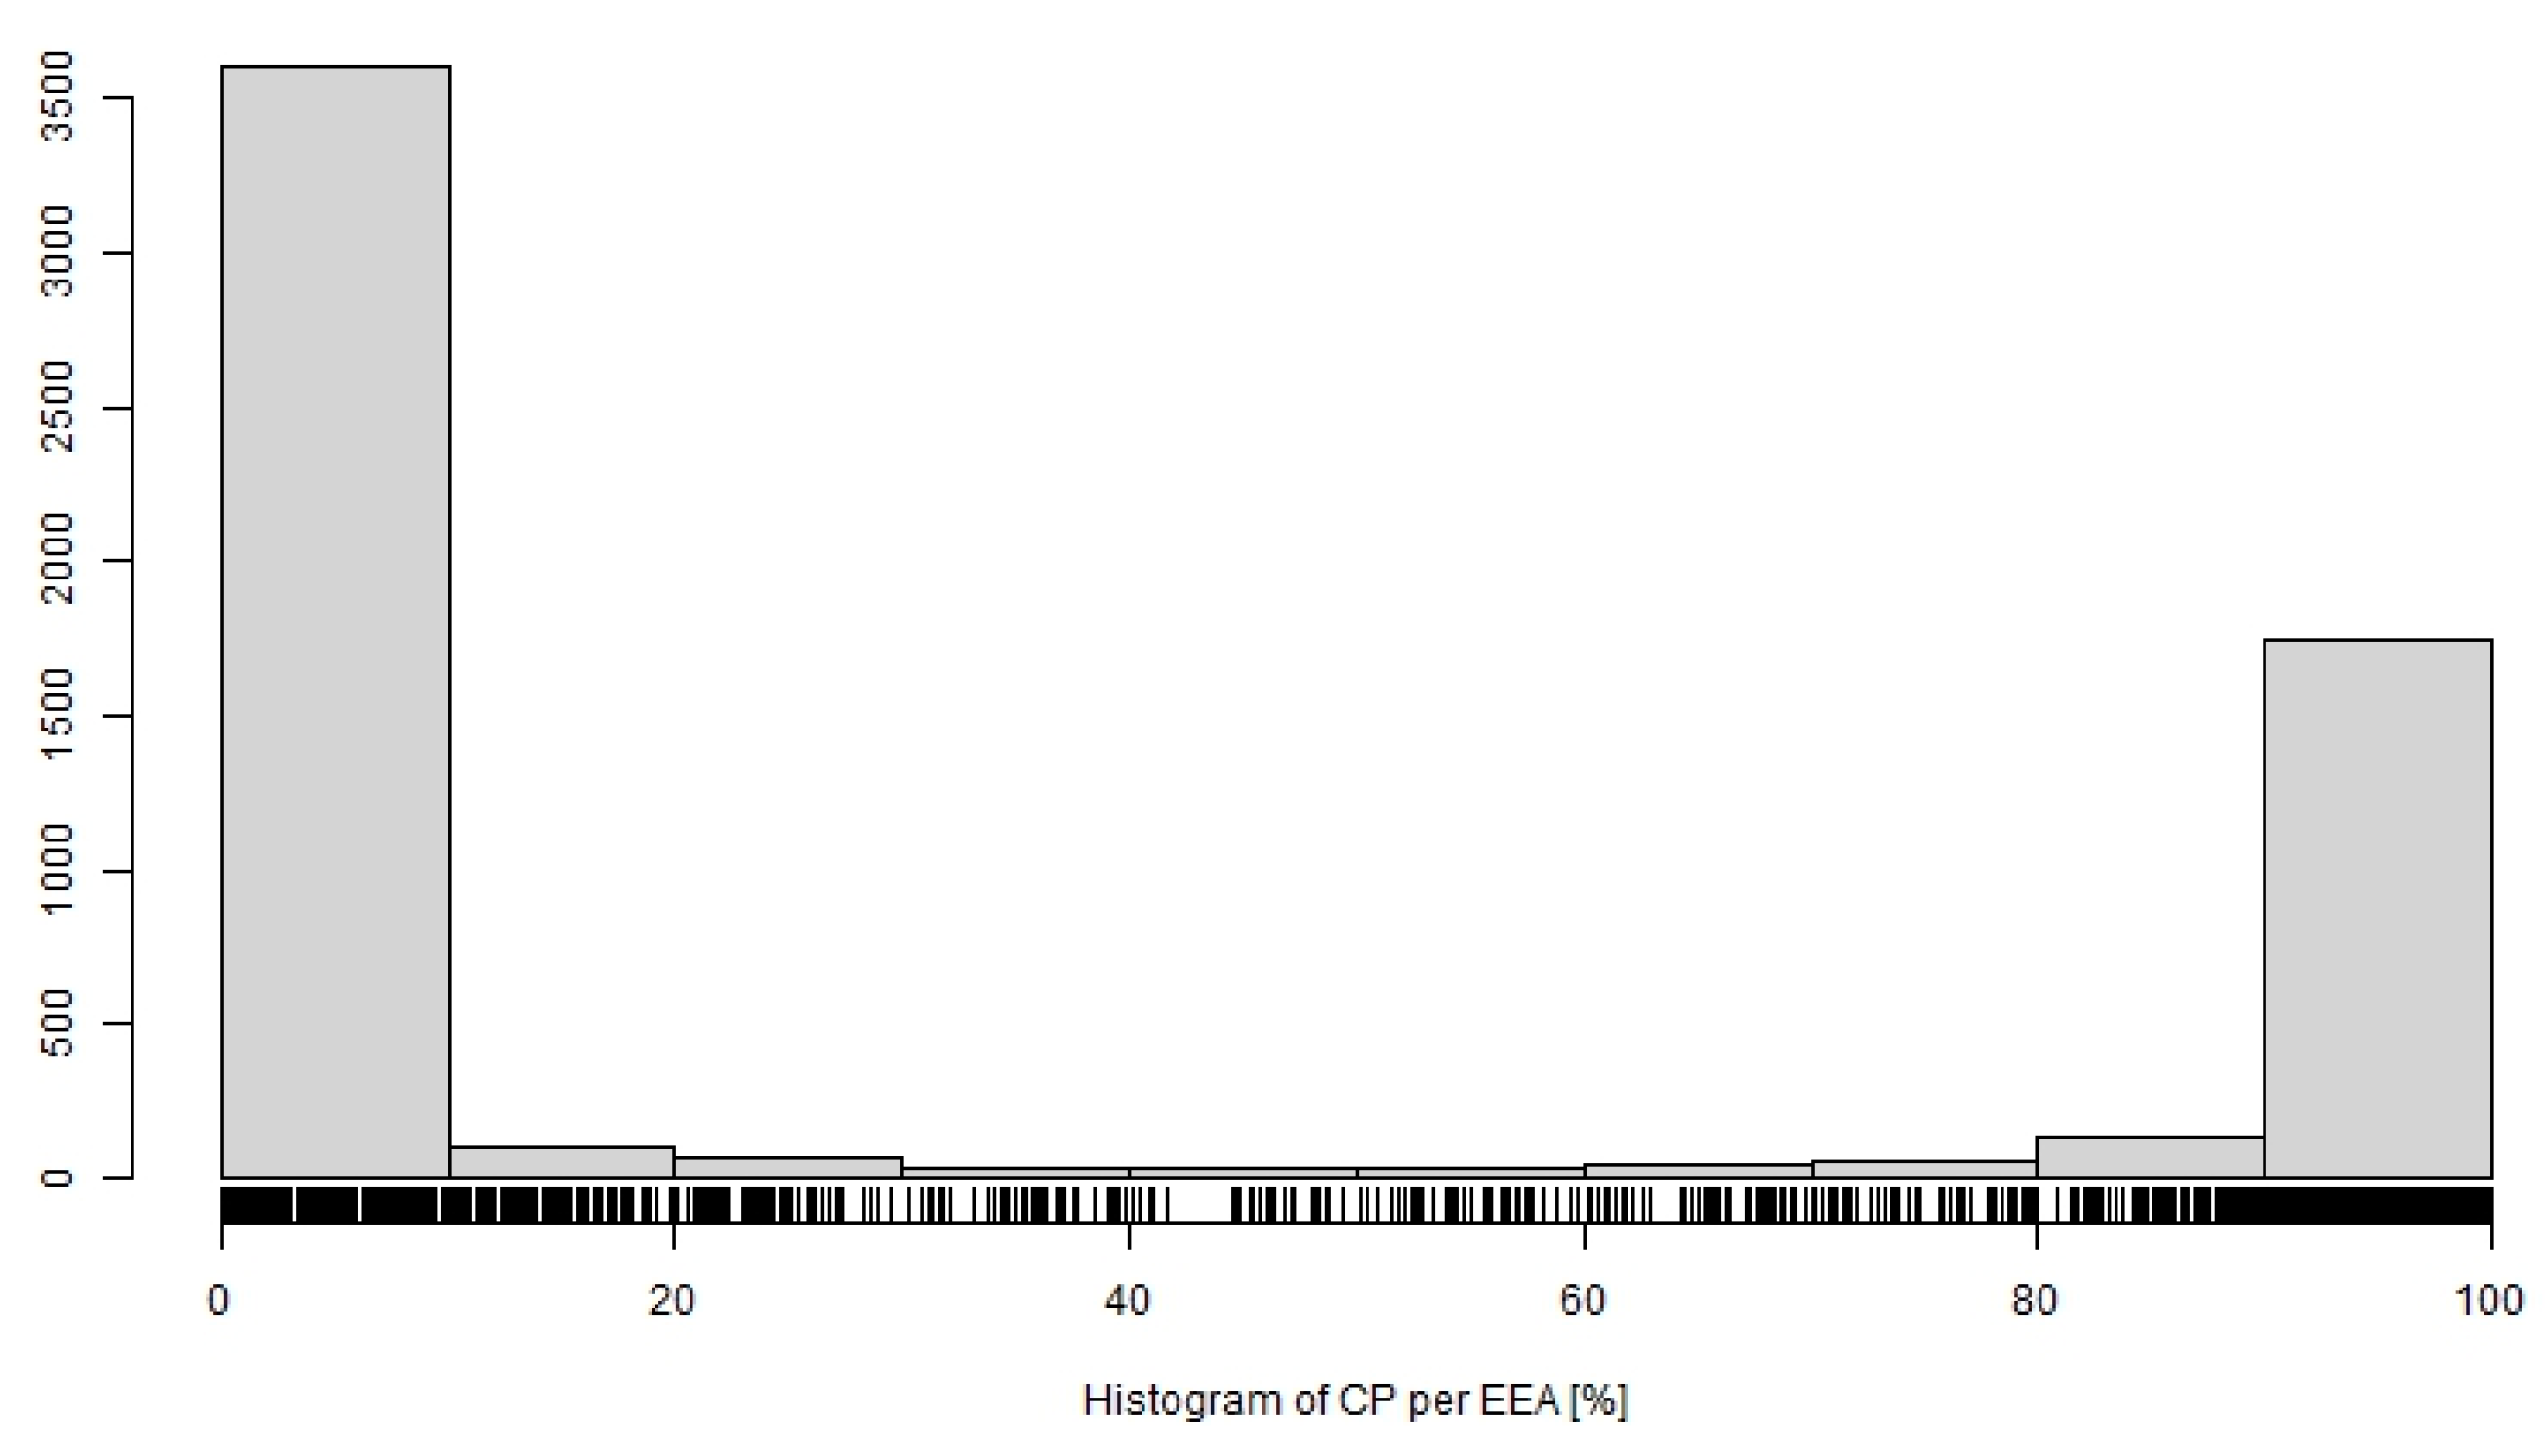
- Distribution of EEAs according to the share of contributing areas of critical points (CPs) being the places where generated paths of concentrated surface run-off enter urbanised spaces [38]. Flooding risk arises from the threat to built-up areas lying below a given critical point. Municipal areas include whole urban zones (residential buildings in particular).
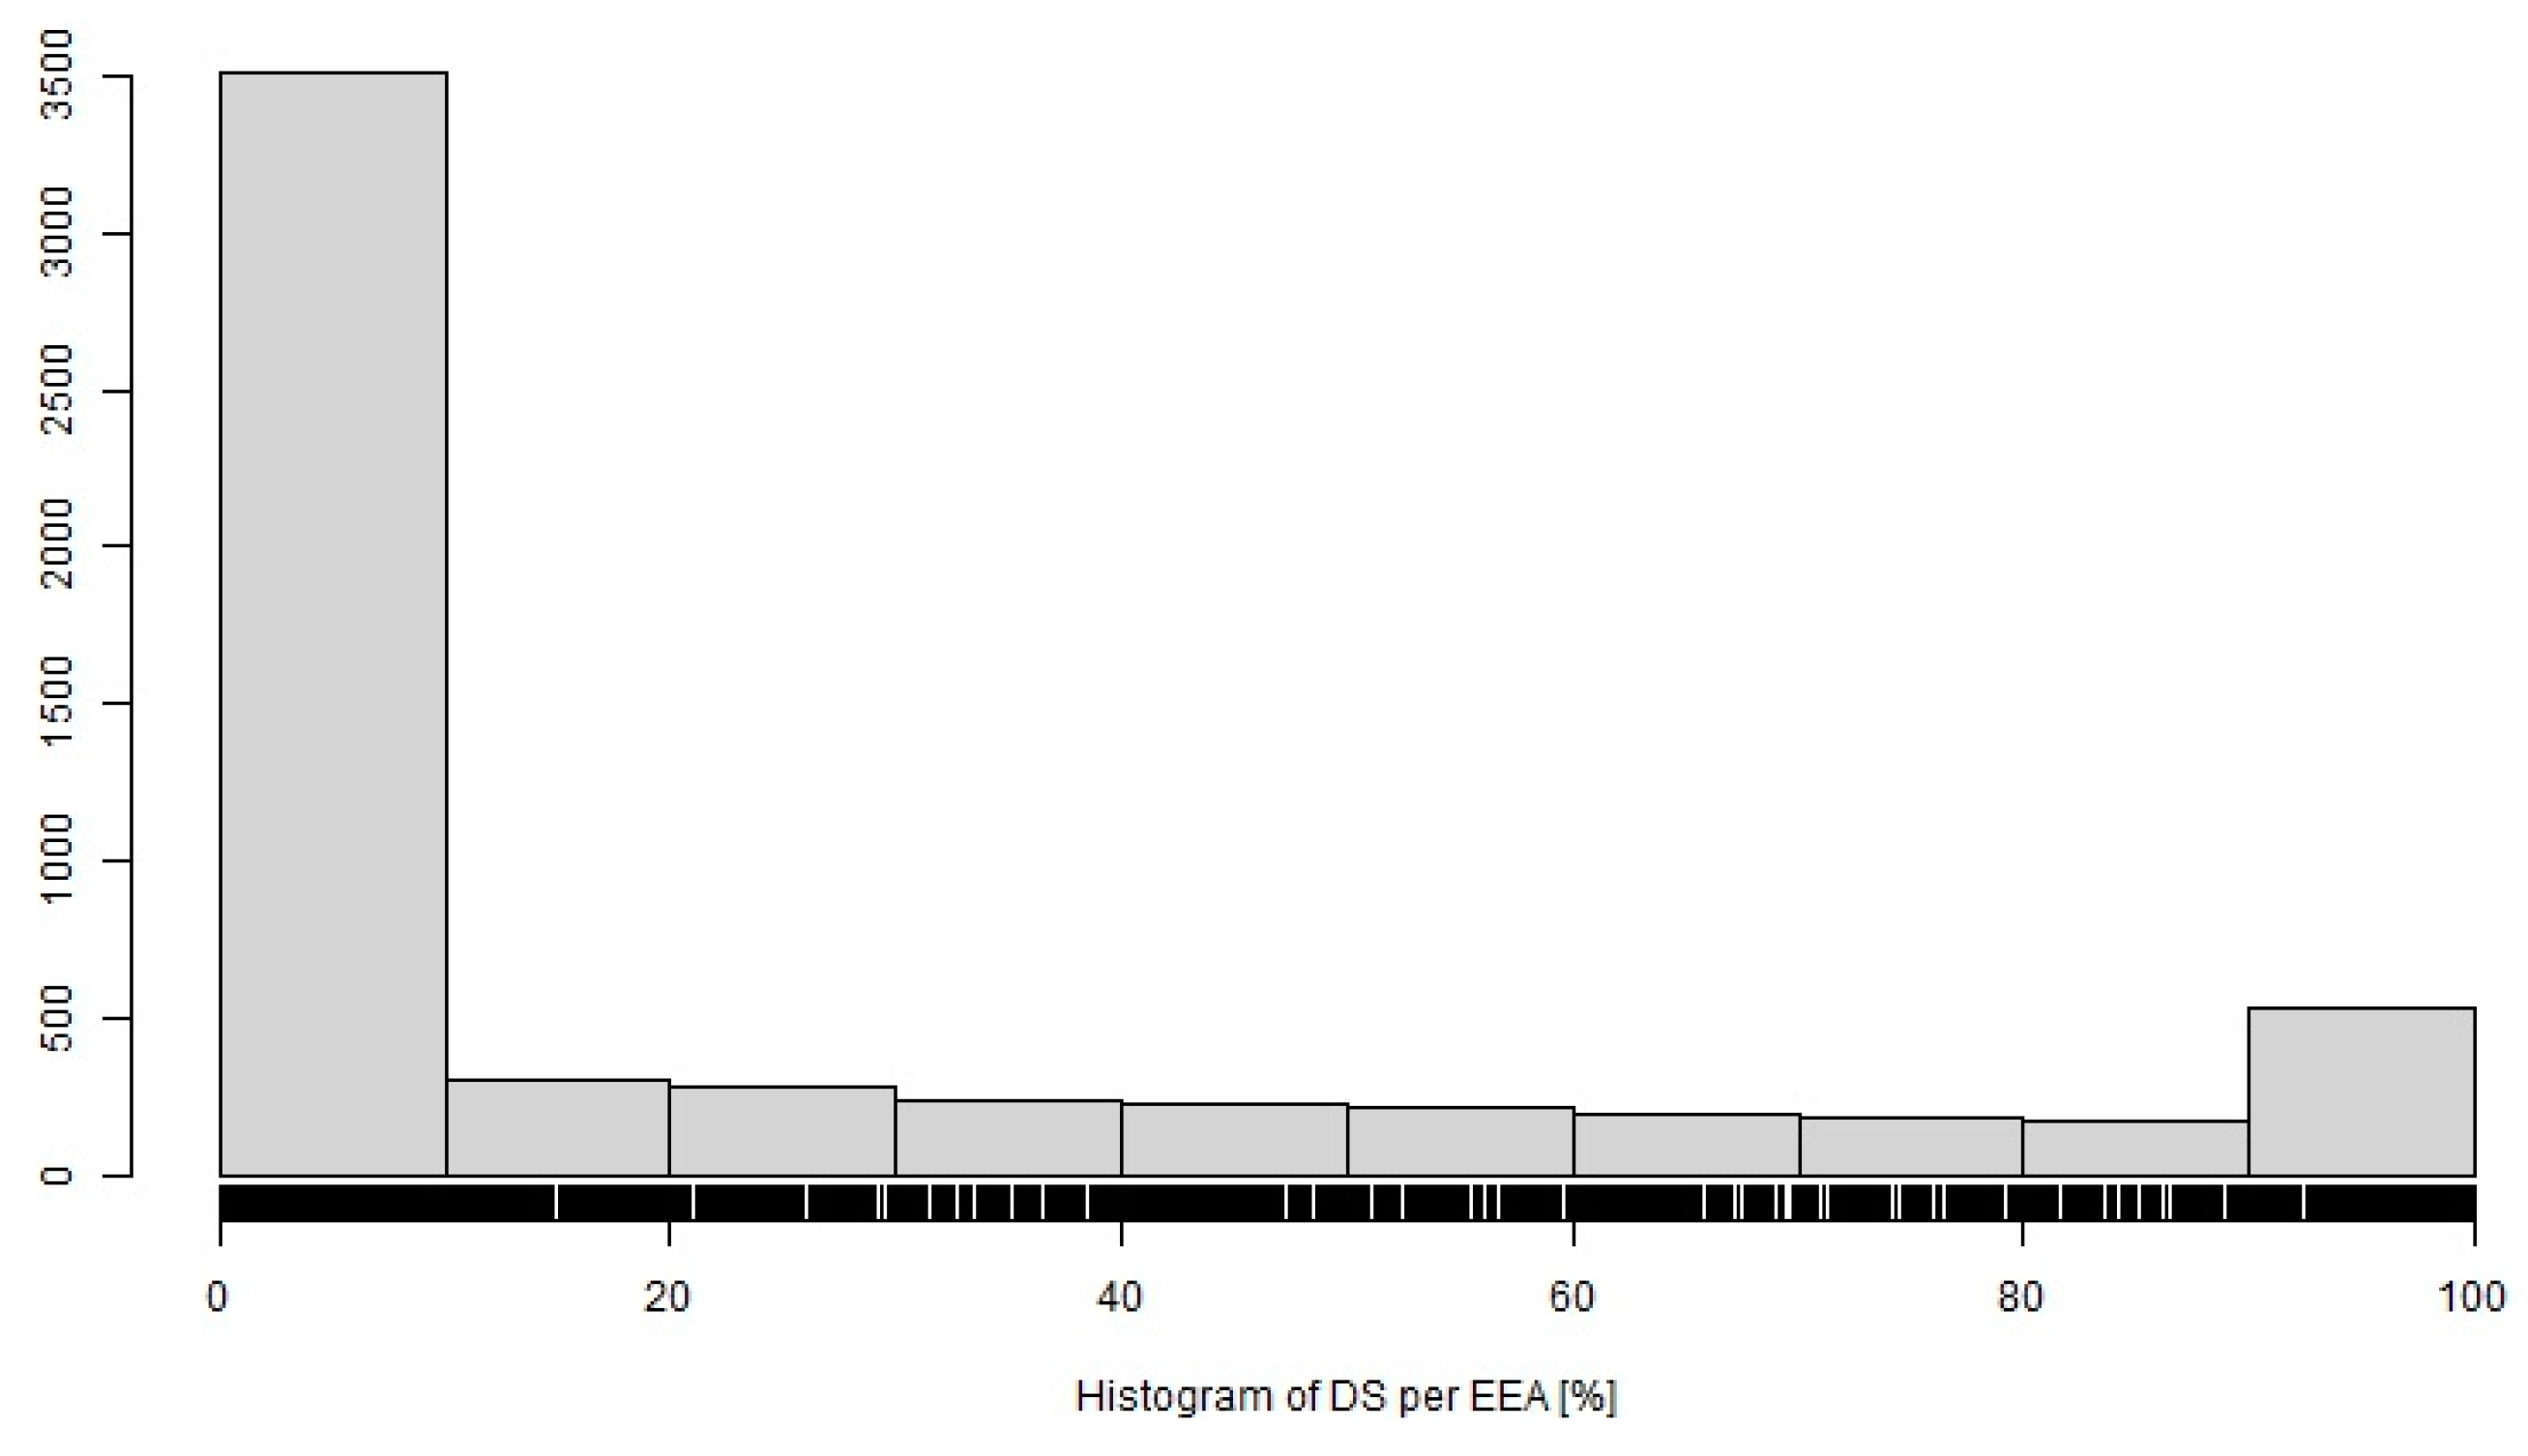
- Share of drainage systems (DS) in an EEA.
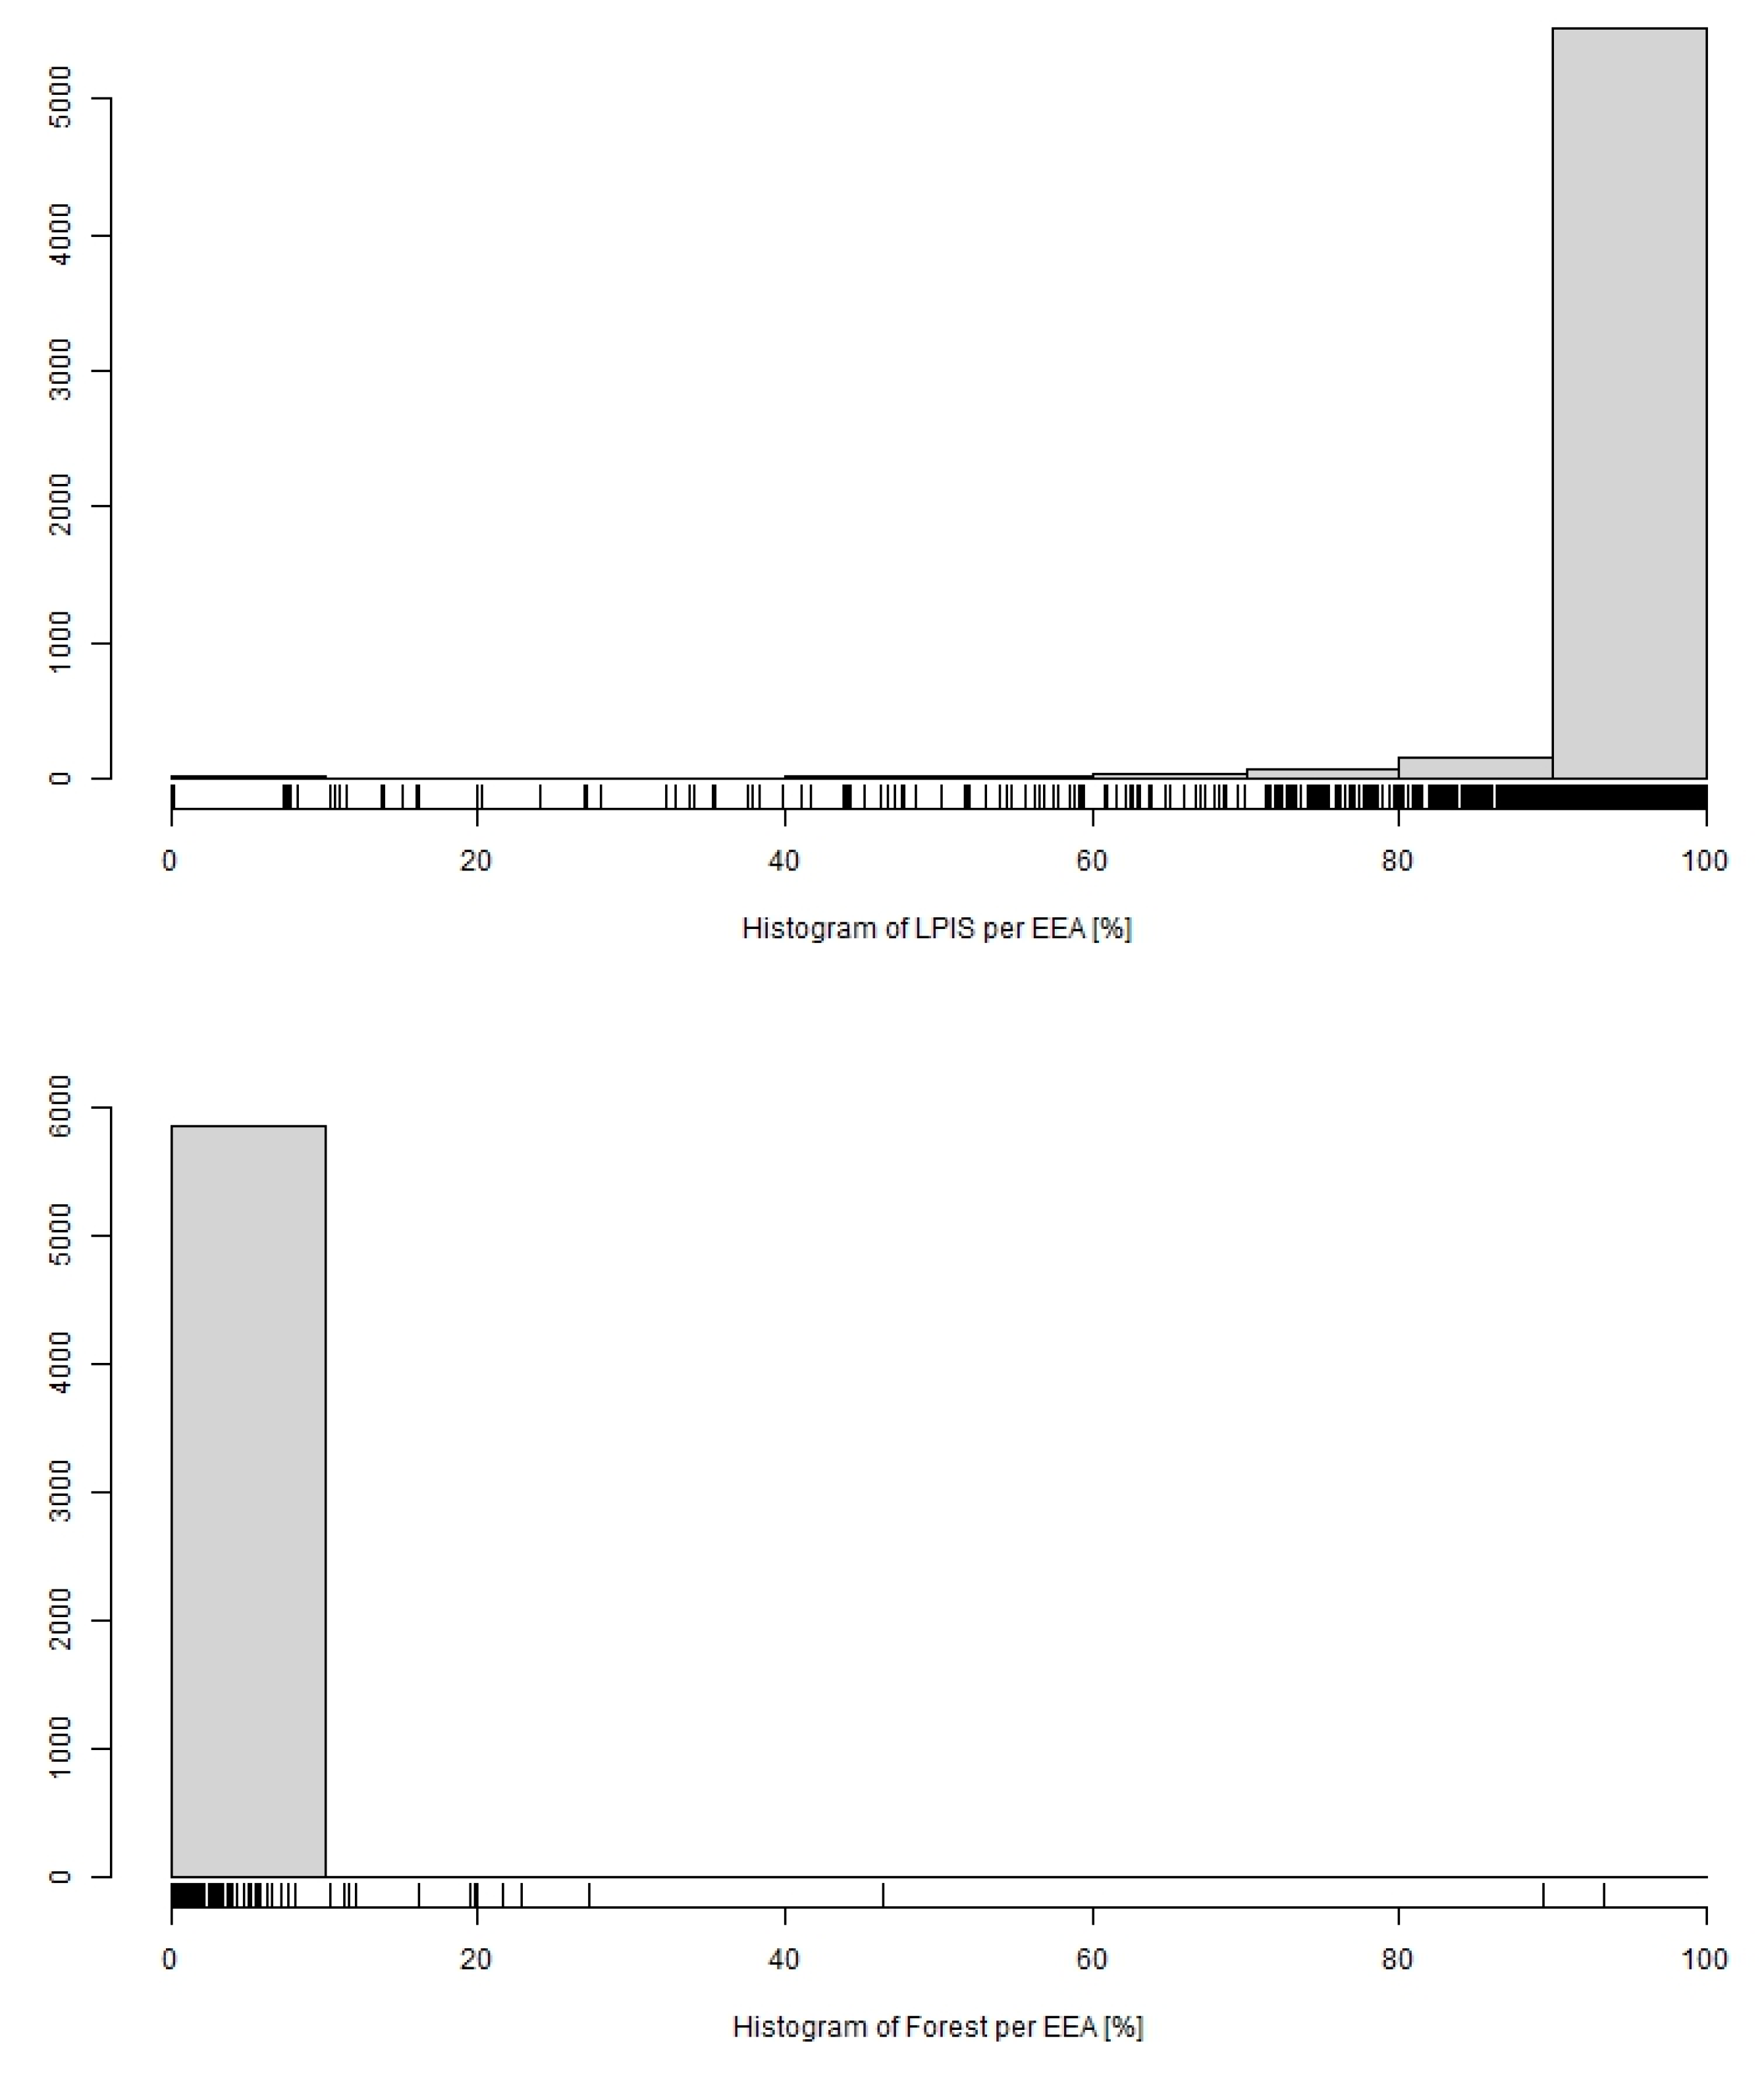
- Percentage of land types in an EEA according to the registry of the Land Parcel Identification System (LPIS), https://eagri.cz/public/app/lpisext/lpis/verejny2/plpis/ (accessed on 11 November 2021).
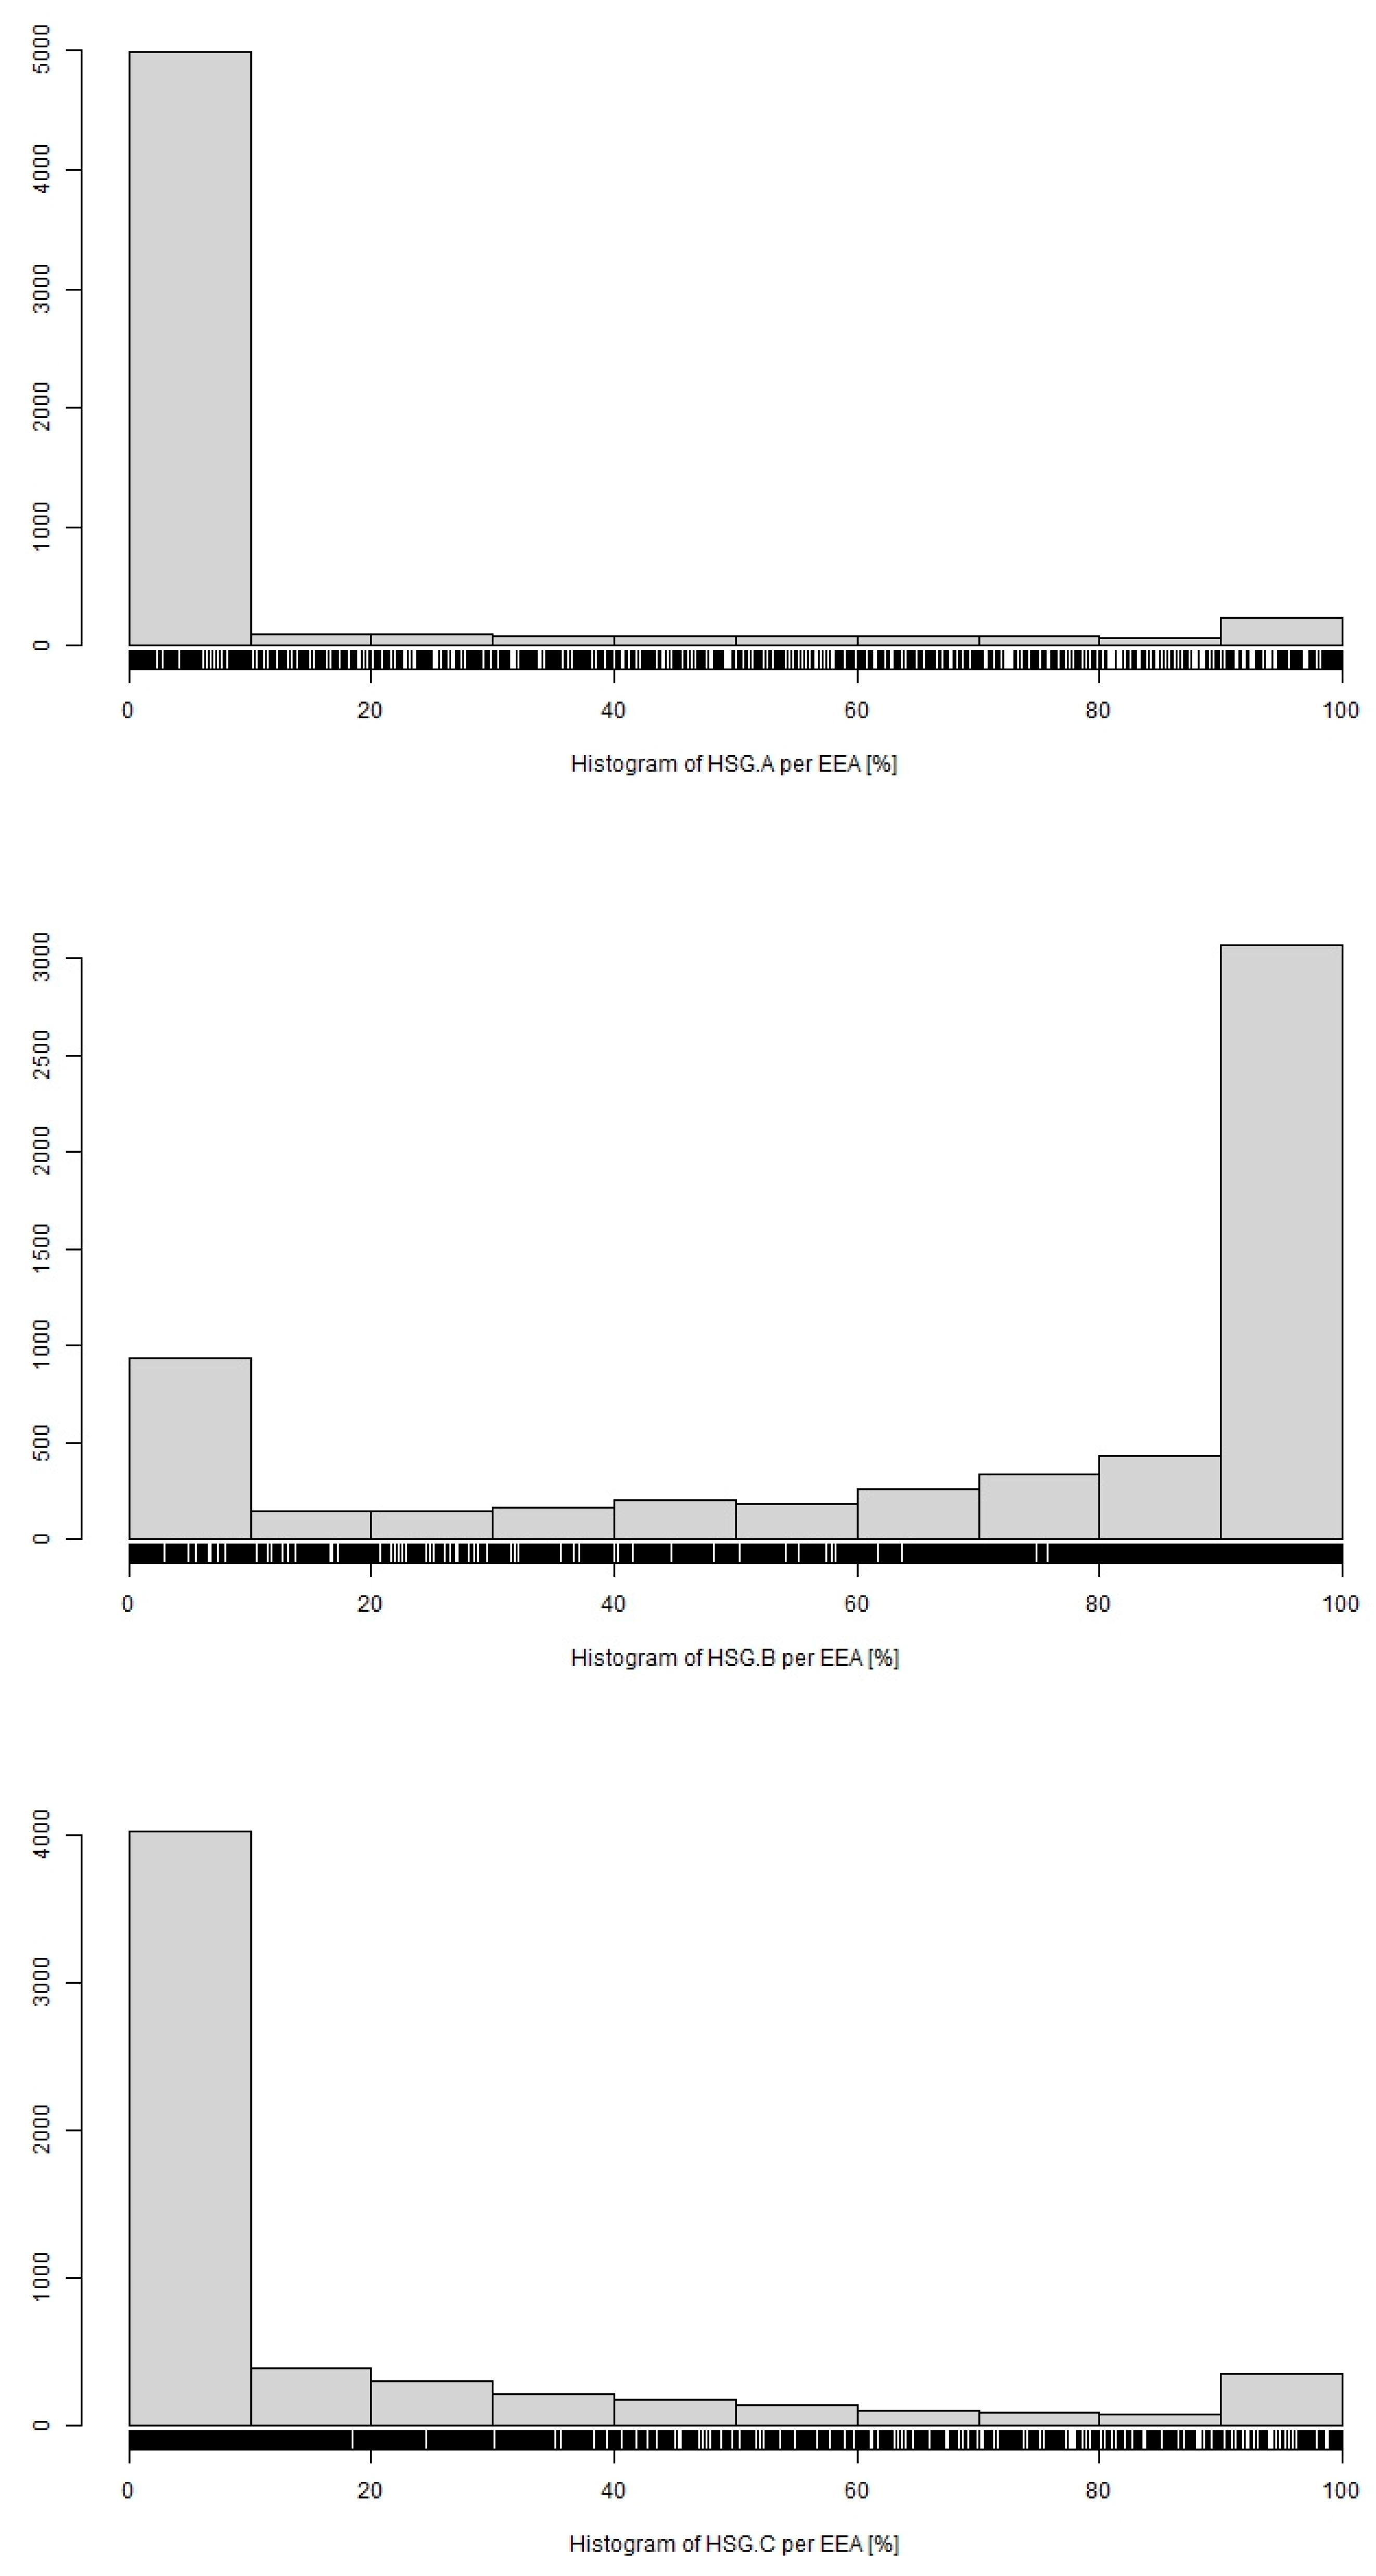
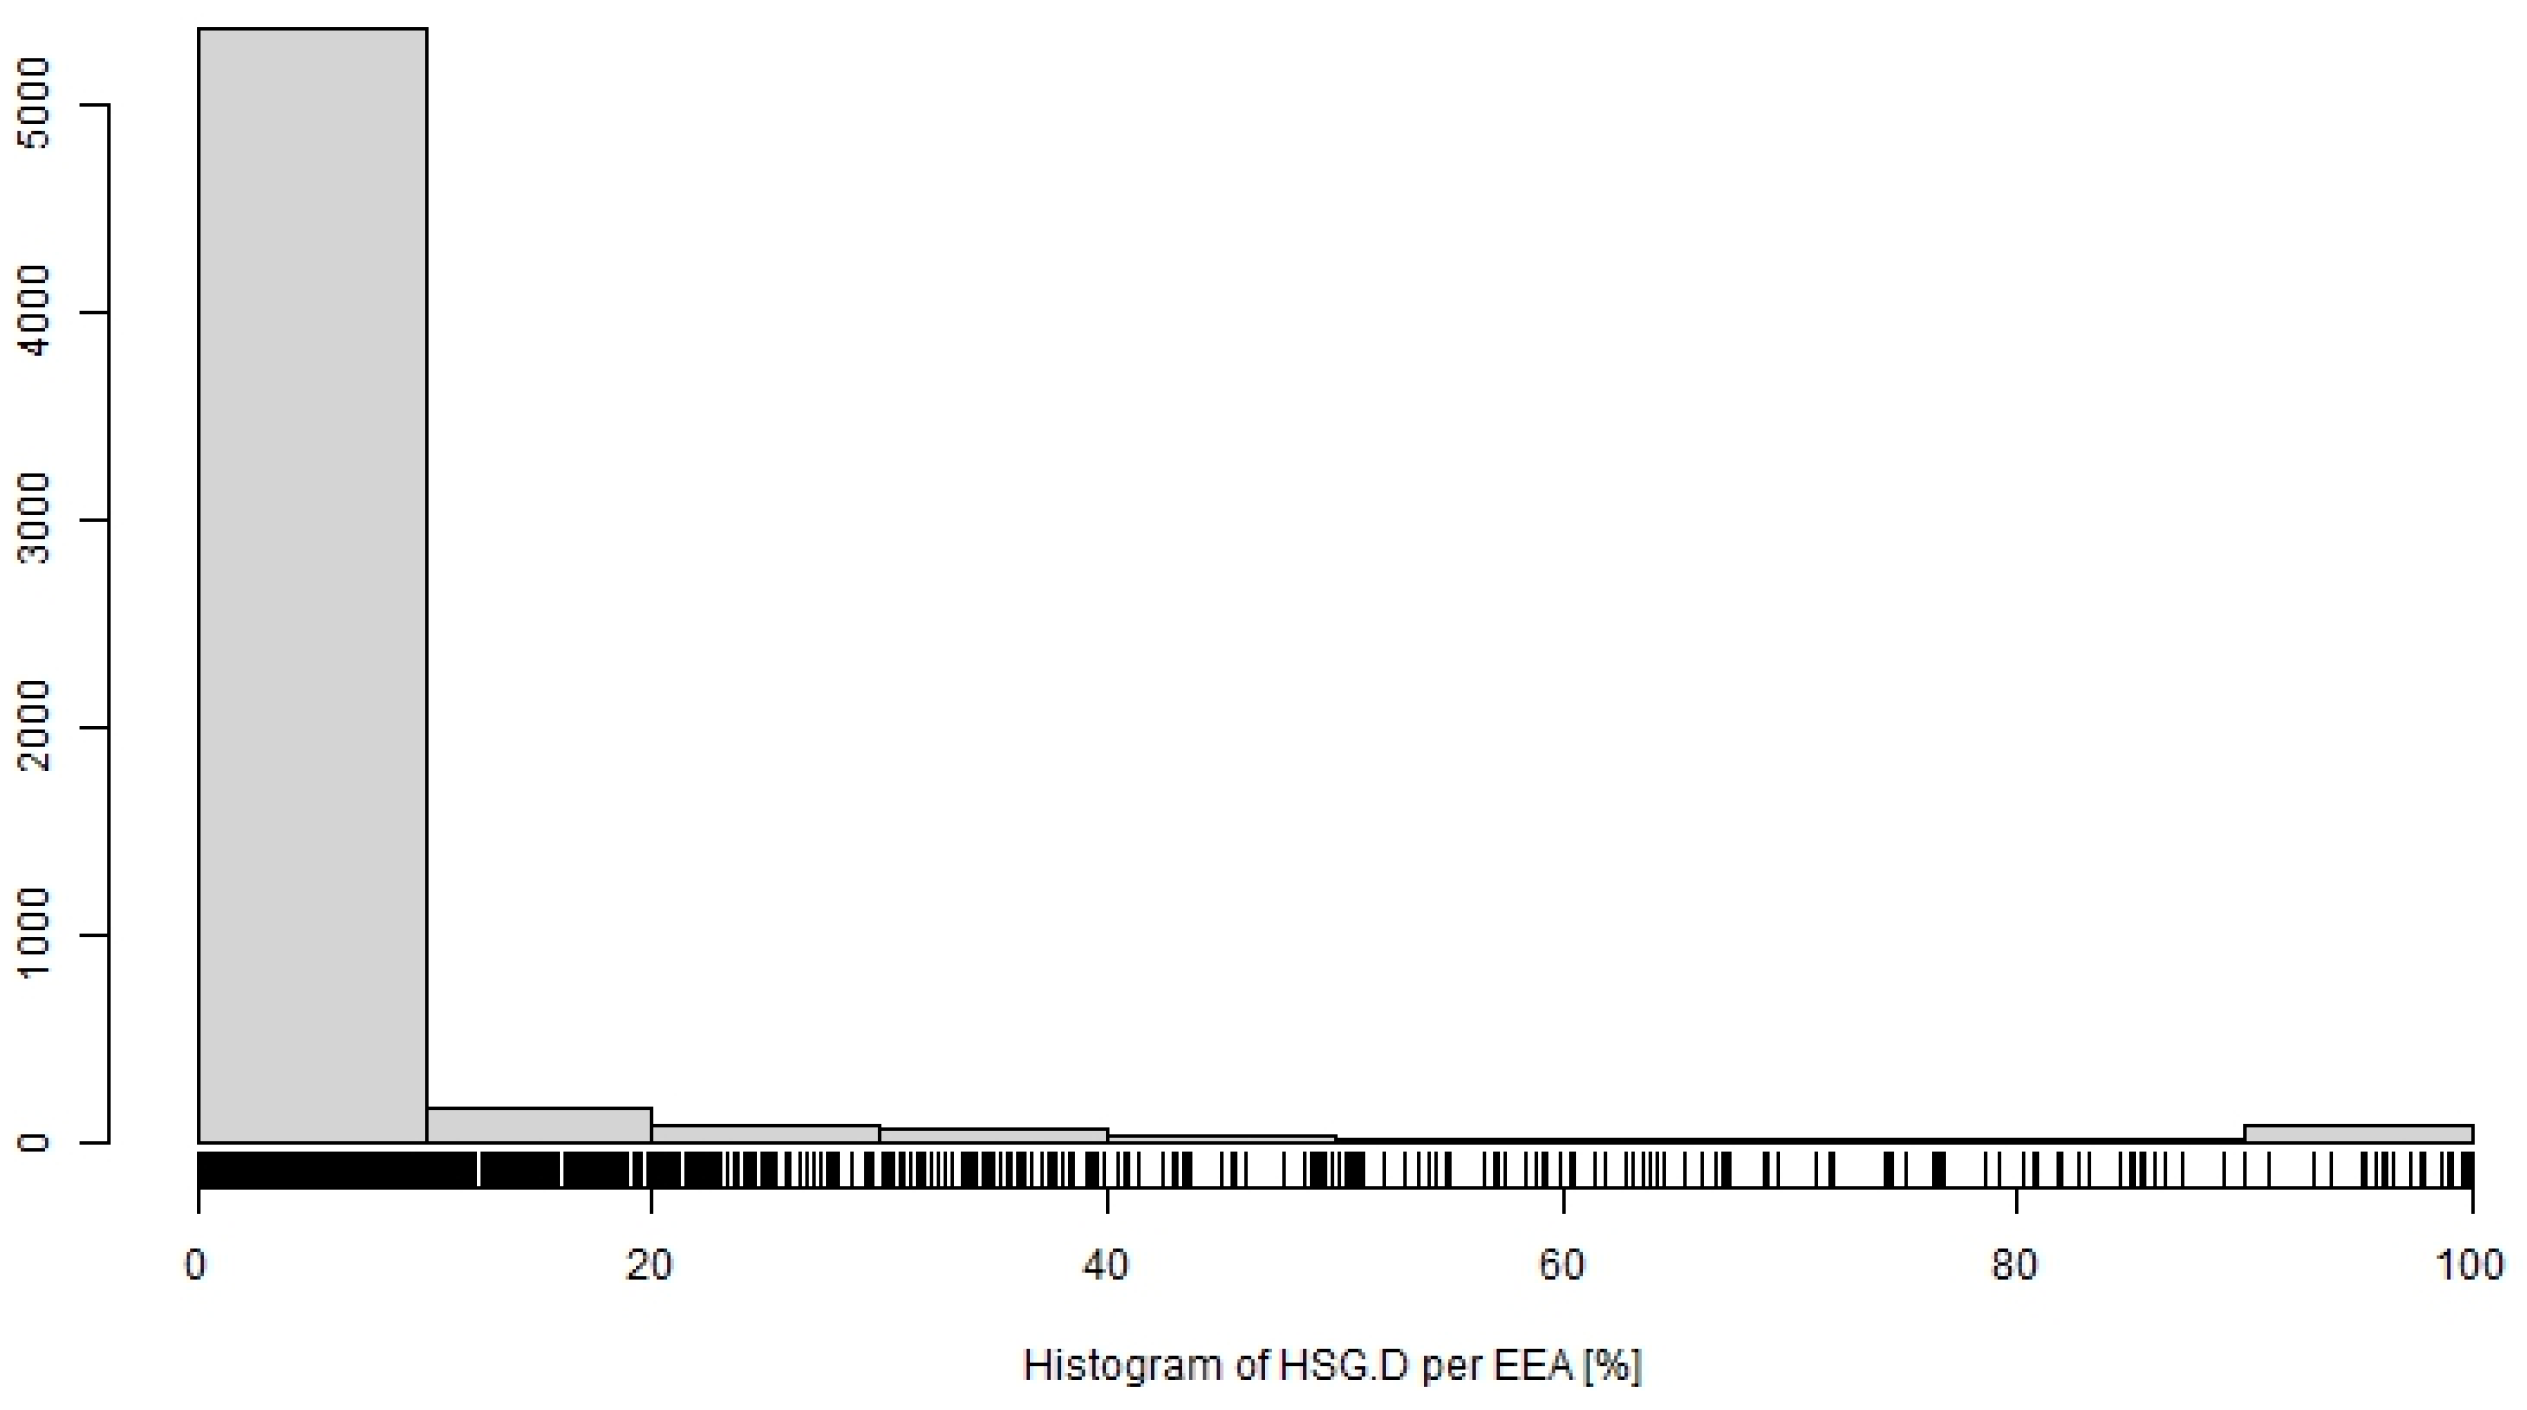
- Hydrologic Soil Group (HSG) share in an EEA by the category, A—soils with a high infiltration rate, B—soils with an average infiltration rate, C—soils with a low infiltration rate, D—soils with a very low infiltration rate.
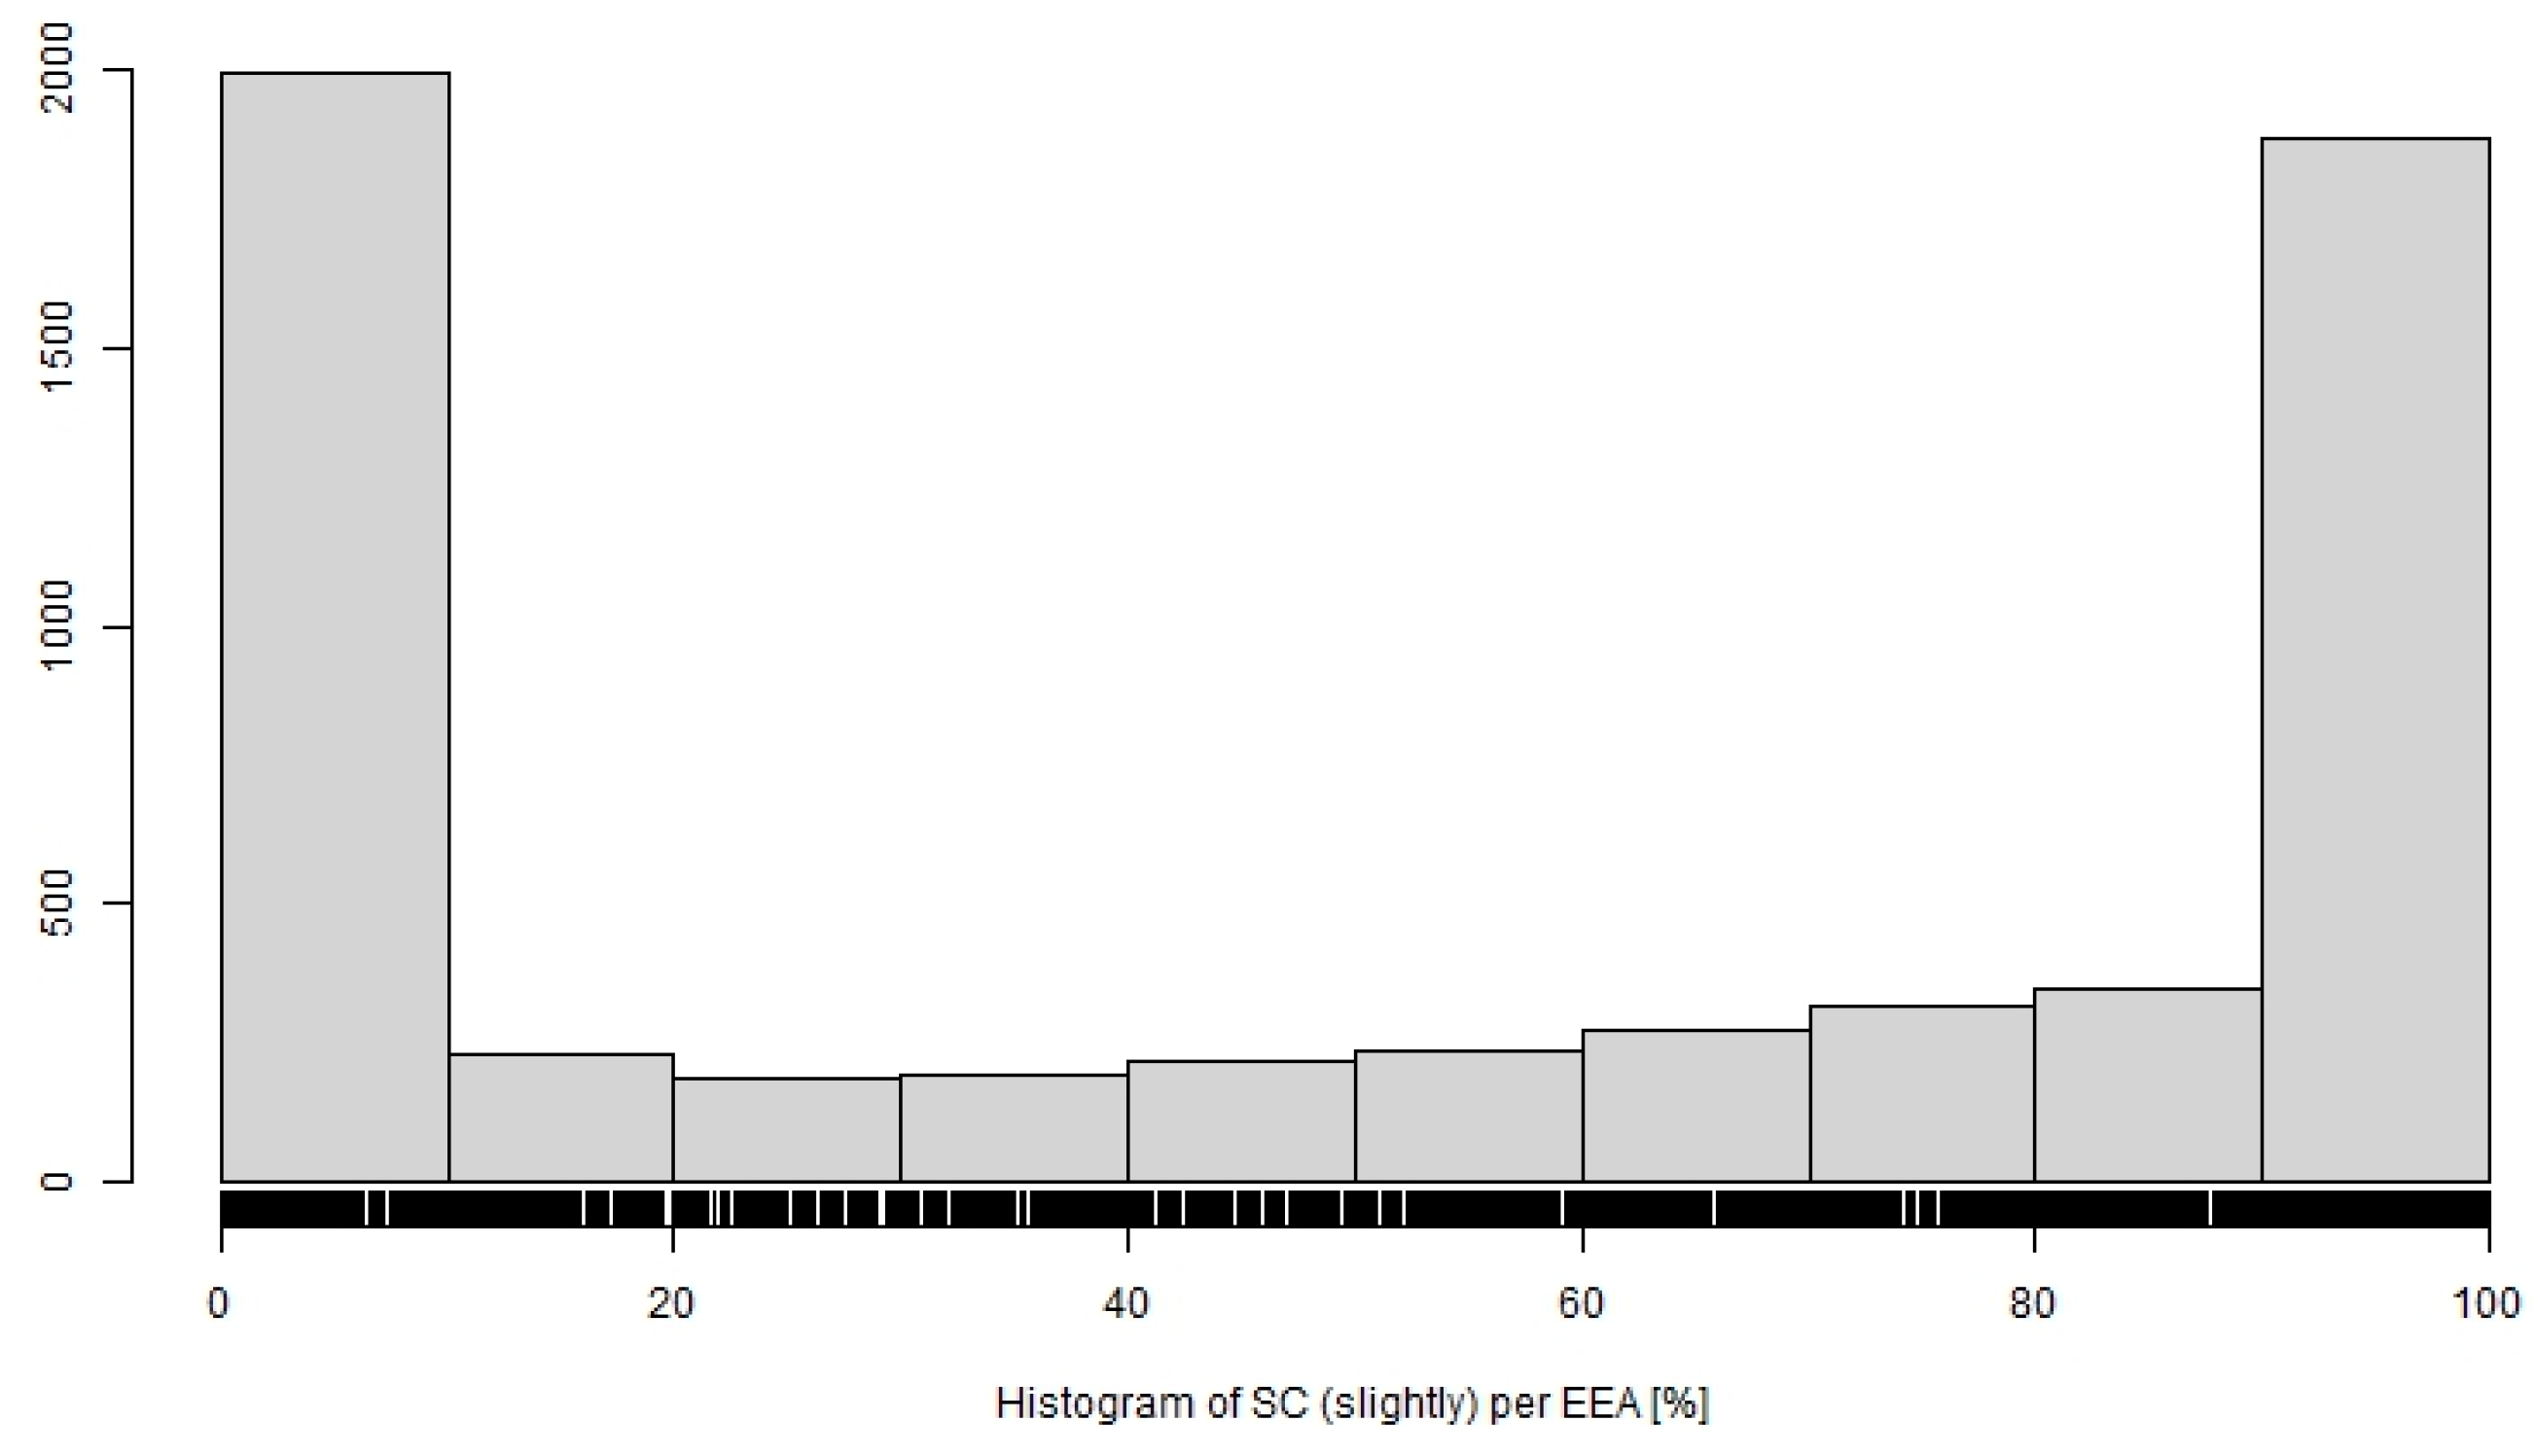
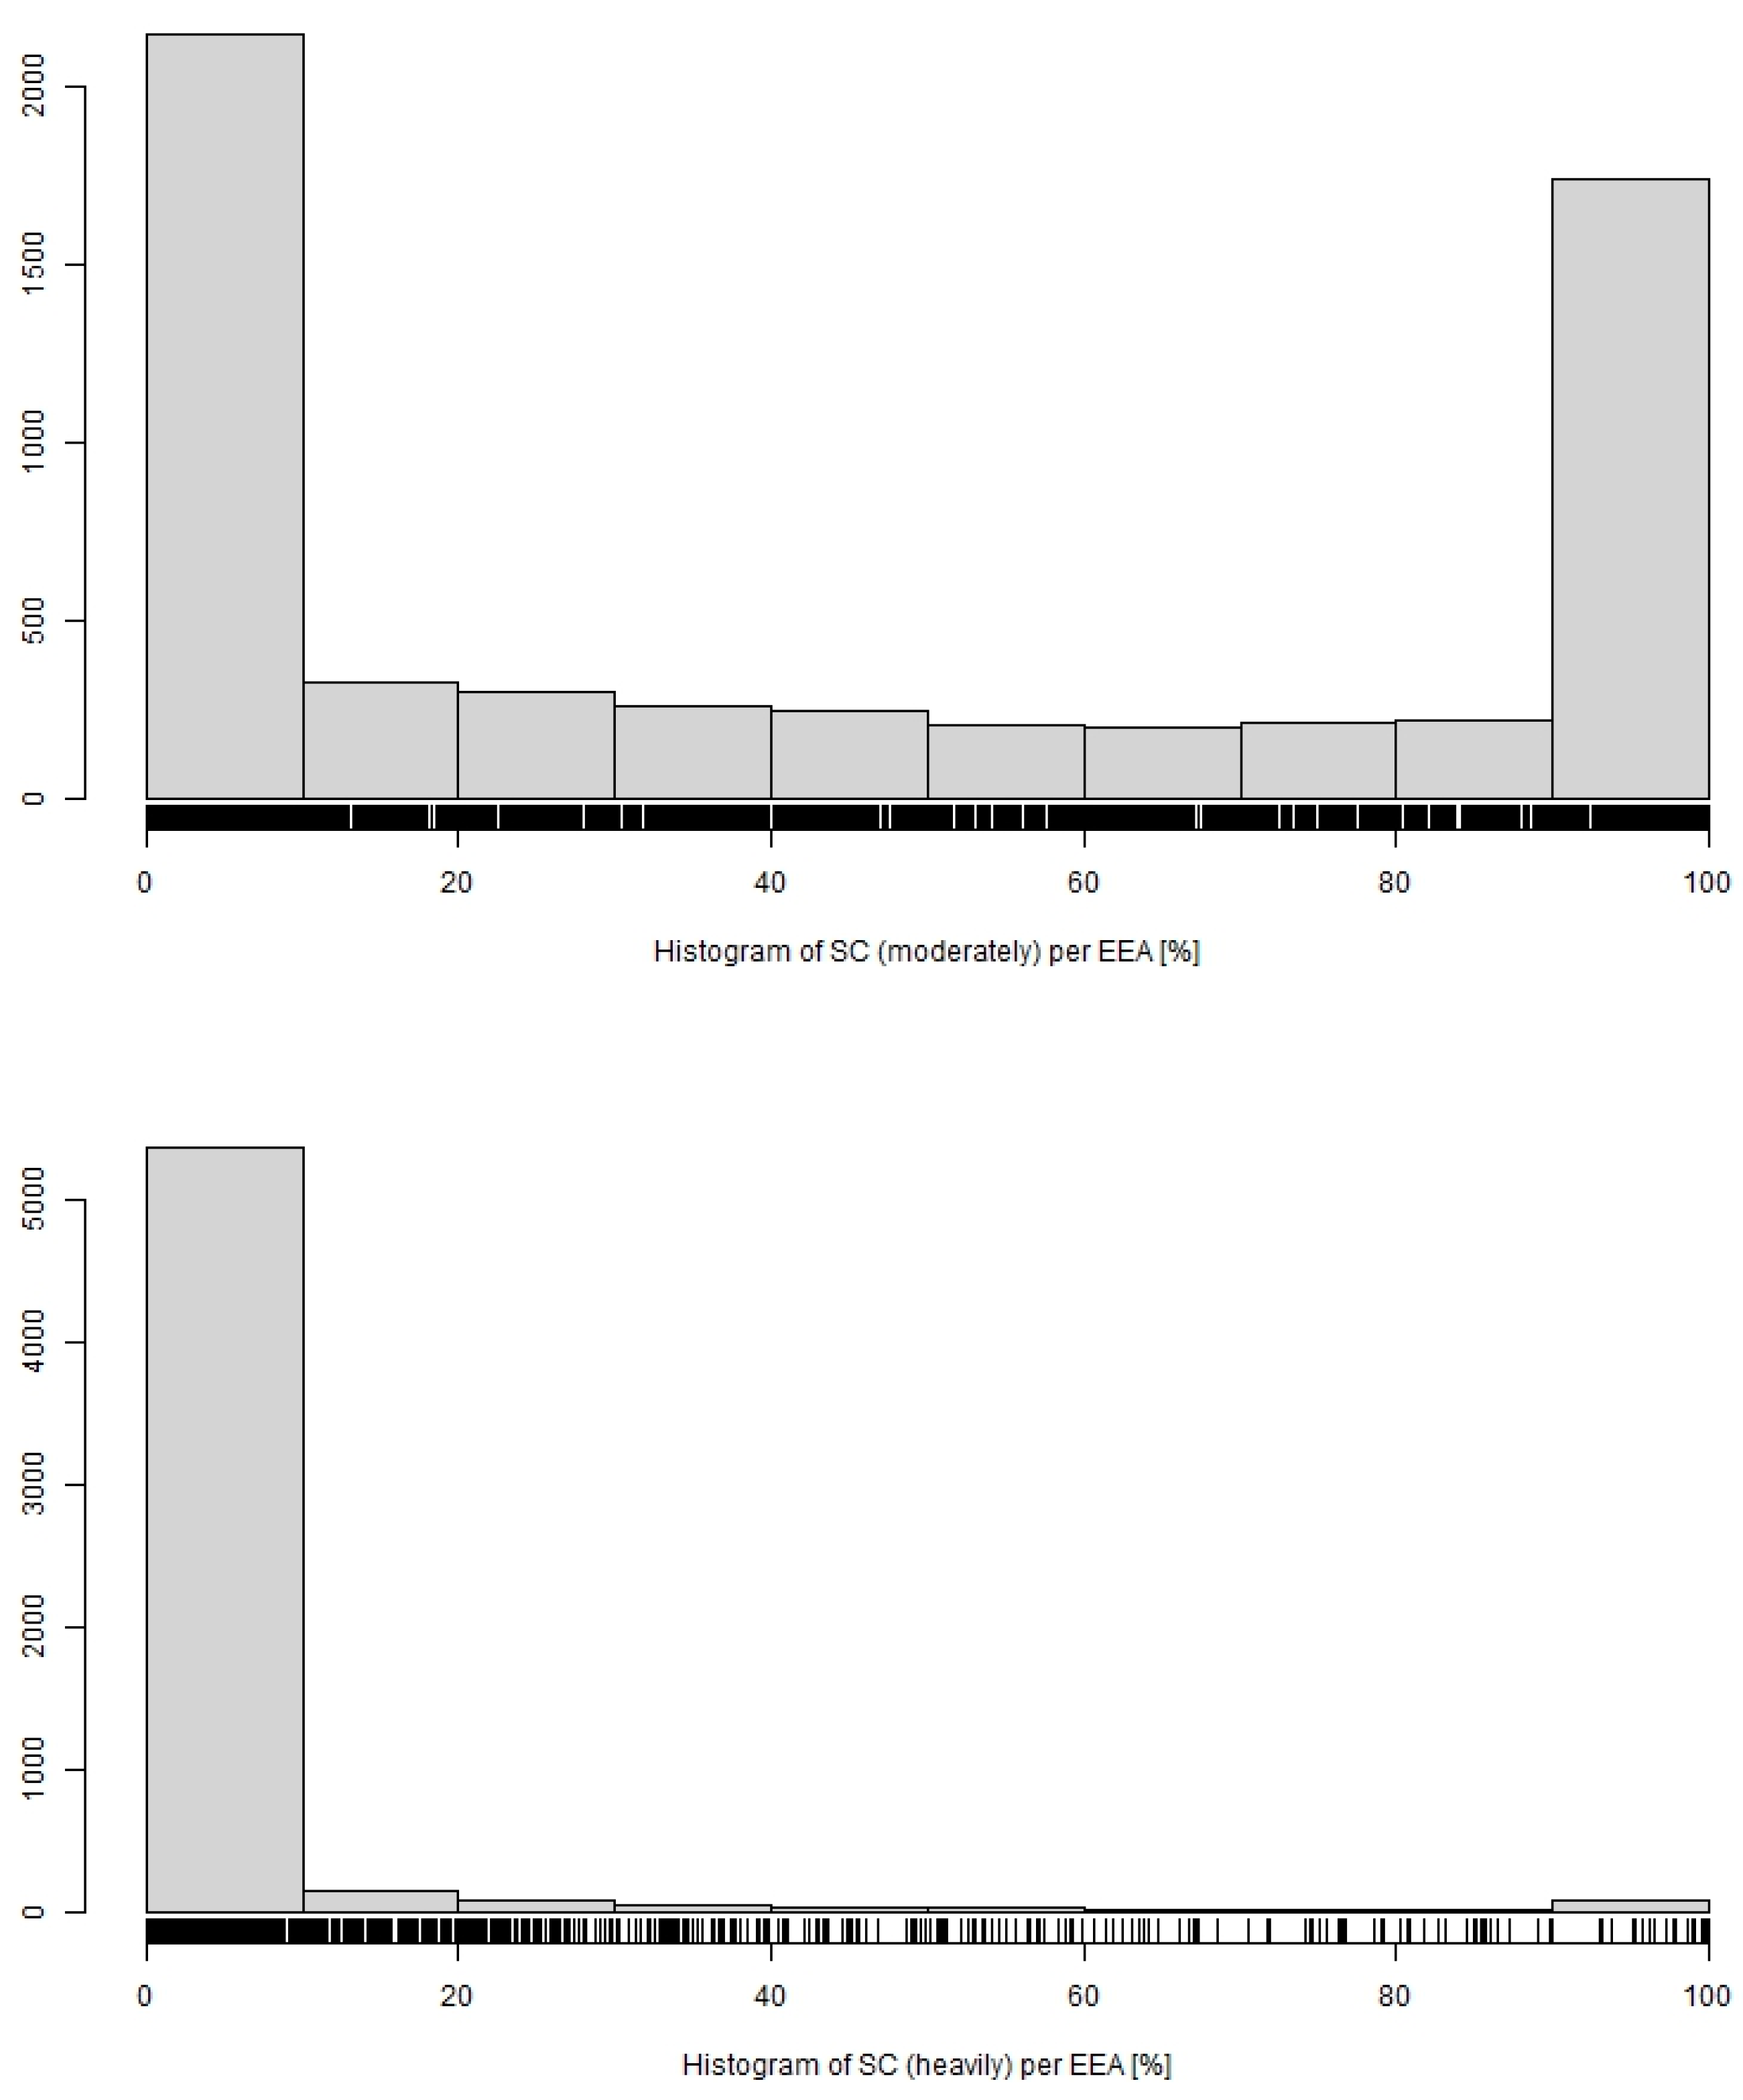
- Proportion of soil compaction susceptibility categories in an EEA (SC1 slightly, SC2 moderately, SC3 heavily).
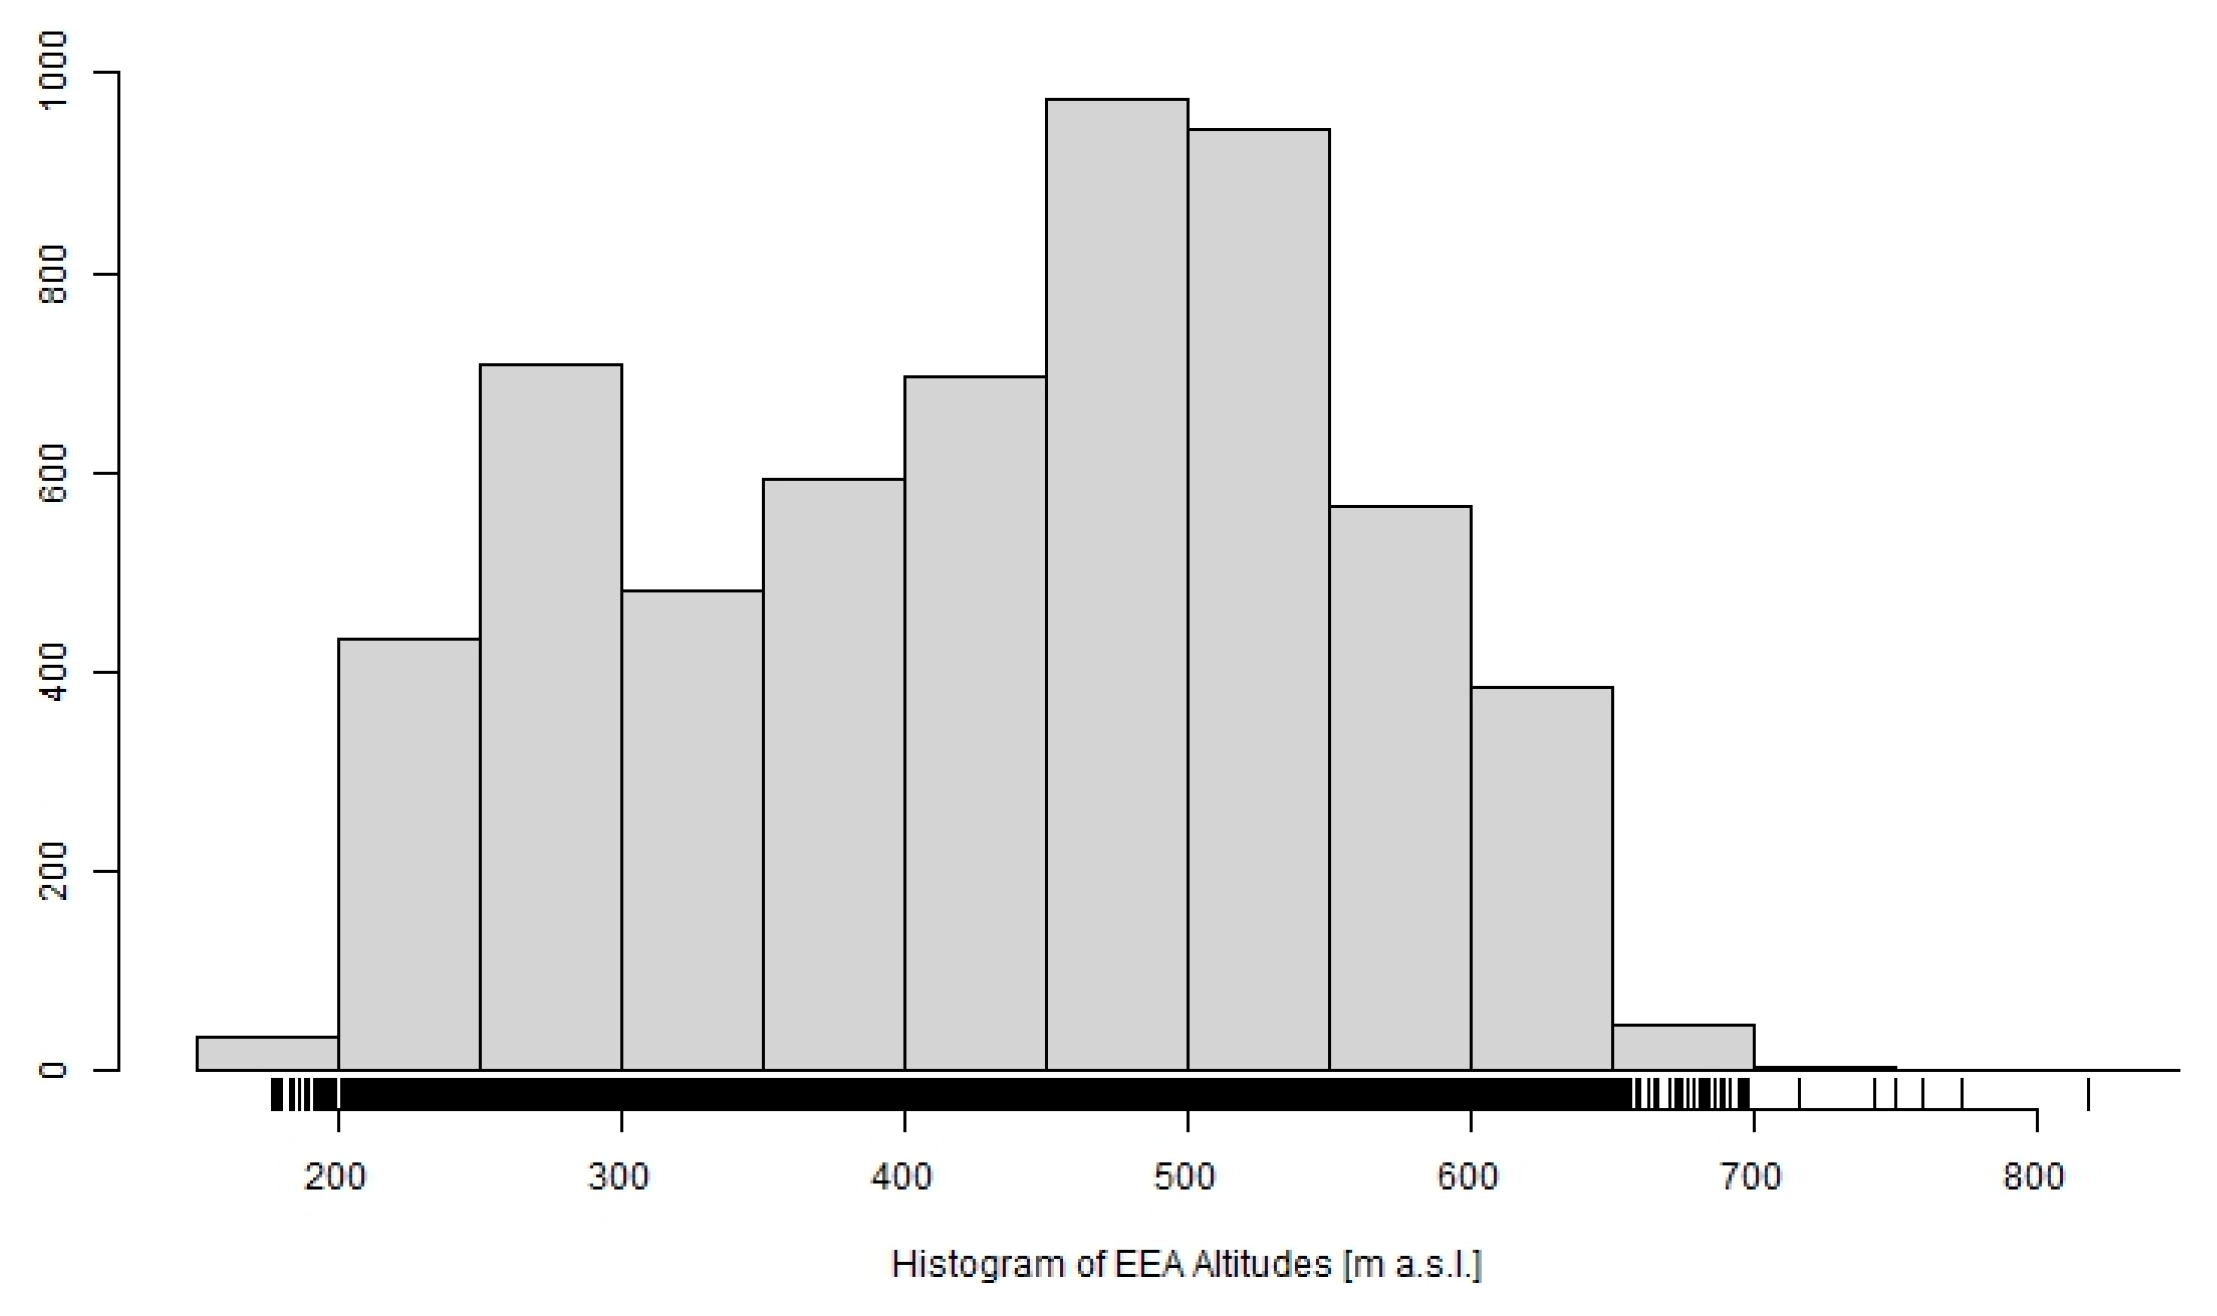
- Distribution of EEAs by altitude. 67% of the Czech Republic territory lies below 500 m above the sea level, 32% in the range 500–1000 m, and ~ 1% above 1000 m.
3. Results and Discussion
4. Conclusions
Author Contributions
Funding
Data Availability Statement
Conflicts of Interest
References
- Eurostat. Agriculture, Forestry and Fishery Statistics 2020 Edition; Cook, E., Ed.; Eurostat: Luxembourg, 2020. [CrossRef]
- Šarapatka, B.; Šterba, O. Optimization of Agriculture in Relation to the Multifunctional Role of the Landscape. Landsc. Urban Plan. 1998, 41, 145–148. [Google Scholar] [CrossRef]
- World Meteorological Organization. Natural hazards and disaster risk reduction. Available online: https://public.wmo.int/en/our-mandate/focus-areas/natural-hazards-and-disaster-risk-reduction (accessed on 1 November 2022).
- Markonis, Y.; Rakovec, O.; Svoboda, M.; Trnka, M.; Kumar, R.; Hanel, M. Europe under Multi-Year Droughts: How Severe Was the 2014–2018 Drought Period? Environ. Res. Lett. 2021, 16, 034062. [Google Scholar] [CrossRef]
- Stagl, J.; Hattermann, F.F.; Koch, H. Modelling of Climate Change Impacts on River Flow Regime and Discharge of the Danube River Considering Water Management Effects. Geophys. Res. Abstr. 2013, 15, 4677. [Google Scholar]
- United Nations. Floods and Climate Change: Sustainable Development and Other Imaginations. Available online: https://www.un.org/en/chronicle/article/floods-and-climate-change-sustainable-development-and-other-imaginations (accessed on 6 March 2022).
- Mei, C.; Liu, J.; Wang, H.; Yang, Z.; Ding, X.; Shao, W. Science of the Total Environment Integrated Assessments of Green Infrastructure for Flood Mitigation to Support Robust Decision-Making for Sponge City Construction in an Urbanized Watershed. Sci. Total Environ. 2018, 639, 1394–1407. [Google Scholar] [CrossRef] [PubMed]
- Bauer, M.; Kavka, P.; Krasa, J. Experimental Research of Soil Erosion Processes in the Czech Republic. In Proceedings of the SGEM 2014 International Multidisciplinary Scientific GeoConferences (SGEM), Albena, Bulgaria, 17–26 June 2014. [Google Scholar]
- Poesen, J. Challenges in Gully Erosion Research. Landf. Anal. 2011, 17, 5–6. [Google Scholar]
- Dotterweich, M. Geomorphology the History of Human-Induced Soil Erosion: Geomorphic Legacies, Early Descriptions and Research, and the Development of Soil Conservation—A Global Synopsis. Geomorphology 2013, 201, 1–34. [Google Scholar] [CrossRef]
- Morgan, R.P.C. Soil Erosion and Conservation; Blackwell Publishing: Oxford, UK, 2005. [Google Scholar]
- Toy, T.J.; Foster, G.R.; Renard, K.G. Soil Erosion: Processes, Prediction, Measurement, and Control; John Wiley & Sons Inc.: Hoboken, NJ, USA, 2002. [Google Scholar]
- Javed, A.; Khanday, M.Y.; Rais, S. Watershed Prioritization Using Morphometric and Land Use/Land Cover Parameters: A Remote Sensing and GIS Based Approach. J. Geol. Soc. 2011, 78, 63–75. [Google Scholar] [CrossRef]
- Rains, S.A.; Coe, K.; Harwood, J. Incivility and Political Identity on the Internet: Intergroup Factors as Predictors of Incivility in Discussions of News Online. J. Comput. Commun. 2017, 22, 163–178. [Google Scholar] [CrossRef] [Green Version]
- Thomas, J.; Joseph, S.; Thrivikramji, K.P. Assessment of Soil Erosion in a Monsoon-Dominated Mountain River Basin in India Using RUSLE-SDR and AHP India Using RUSLE-SDR and AHP. Hydrol. Sci. J. 2018, 63, 542–560. [Google Scholar] [CrossRef]
- Rodrigo-Comino, J.; Senciales, J.M.; Sillero-Medina, J.A.; Gyasi-Agyei, Y.; Ruiz-Sinoga, J.D.; Ries, J.B. Analysis of Weather-Type-Induced Soil Erosion in Cultivated and Poorly Managed Abandoned Sloping Vineyards in the Axarquía Region (Málaga, Spain). Air Soil Water Res. 2019, 12, 1178622119839403. [Google Scholar] [CrossRef]
- Khazaei, M.R.; Zahabiyoun, B.; Saghafian, B. Assessment of Climate Change Impact on Floods Using Weathergenerator and Continuous Rainfall-Runoff Model. Int. J. Clim. 2011, 32, 1997–2006. [Google Scholar] [CrossRef]
- Rawat, J.S. Monitoring Land Use/Cover Change Using Remote Sensing and GIS Techniques: A Case Study of Hawalbagh Block, District Almora, Uttarakhand, India. Egypt. J. Remote Sens. Space Sci. 2015, 18, 77–84. [Google Scholar] [CrossRef] [Green Version]
- Rahman, R.; Shi, Z.H.; Chongfa, C.; Dun, Z. Principal Component Analysis (SPCA) Assessing Soil Erosion Hazard—A Raster Based GIS Approach with Spatial Principal Component Analysis (SPCA). Earth Sci. Inform. 2015, 8, 853–865. [Google Scholar] [CrossRef]
- Mou, F.I.; Bhuiyan, N.T.; Alvee, F.M.; Rahman, A.; Maliha, M. Estimation of Erosion–Accretion Using Remote Sensing Approach: A Case Analysis on Teknaf Coastline. In Advances in Civil Engineering; Scott, A., Saitoh, M., Pal, S.K., Eds.; Springer: Berlin/Heidelberg, Germany, 2020; pp. 419–430. [Google Scholar]
- Koutsovili, E.I.; Tzoraki, O.; Theodossiou, N.; Gaganis, P. Numerical Assessment of Climate Change Impact on the Hydrological Regime of a Small Mediterranean River, Lesvos Island, Greece. Acta Hort. Reg. 2021, 24, 28–48. [Google Scholar] [CrossRef]
- Albrecht, J.; Hartmann, T. Land for Flood Risk Management—Instruments and Strategies of Land Management for Polders and Dike Relocations in Germany. Environ. Sci. Policy 2021, 118, 36–44. [Google Scholar] [CrossRef]
- Li, Y.; Wang, S.; Xu, T.; Li, J.; Zhang, Y.; Xu, T. Novel Designs for the Reliability and Safety of Supercritical Water Oxidation Process for Sludge Treatment. Process Saf. Environ. Prot. 2021, 149, 385–398. [Google Scholar] [CrossRef]
- Borrelli, P.; Robinson, D.A.; Panagos, P.; Lugato, E.; Yang, J.E.; Alewell, C.; Wuepper, D.; Montanarella, L.; Ballabio, C. Land Use and Climate Change Impacts on Global Soil Erosion by Water (2015–2070). PNAS 2020, 117, 21994–22001. [Google Scholar] [CrossRef]
- Panagos, P.; Borrelli, P.; Poesen, J.; Ballabio, C.; Lugato, E.; Meusburger, K.; Montanarella, L.; Alewell, C. Environmental Science & Policy the New Assessment of Soil Loss by Water Erosion in Europe. Environ. Sci. Policy 2015, 54, 438–447. [Google Scholar] [CrossRef]
- Bronstert, A.; Agarwal, A.; Boessenkool, B.; Crisologo, I.; Fischer, M.; Heistermann, M.; Köhn-reich, L.; López-tarazón, J.A.; Moran, T.; Ozturk, U.; et al. Science of the Total Environment Forensic Hydro-Meteorological Analysis of an Extreme Flash Flood: The 2016-05-29 Event in Braunsbach, SW Germany. Sci. Total Environ. 2018, 630, 977–991. [Google Scholar] [CrossRef]
- Yin, S.; Zhu, Z.; Wang, L.; Liu, B.; Xie, Y.; Wang, G.; Li, Y. Regional Soil Erosion Assessment Based on a Sample Survey and Geostatistics. Hydrol. Earth Syst. Sci. 2018, 22, 1695–1712. [Google Scholar] [CrossRef] [Green Version]
- Prosdocimi, M.; Jordán, A.; Tarolli, P.; Keesstra, S.; Novara, A.; Cerdà, A. Science of the Total Environment the Immediate Effectiveness of Barley Straw Mulch in Reducing Soil Erodibility and Surface Runoff Generation in Mediterranean Vineyards. Sci. Total Environ. 2016, 547, 323–330. [Google Scholar] [CrossRef] [PubMed]
- Lanckriet, S.; Asfaha, T.; Frankl, A.; Zenebe, A.; Nyssen, J. Sediment in Alluvial and Lacustrine Debris Fans as an Indicator for Land Degradation around Lake Ashenge (Ethiopia). L. Degrad. Dev. 2016, 27, 258–269. [Google Scholar] [CrossRef] [Green Version]
- Igaz, D.; Šinka, K.; Varga, P.; Aydin, E. The Evaluation of the Accuracy of Interpolation Methods in Crafting Maps of Physical and Hydro-Physical Soil Properties. Water 2021, 13, 212. [Google Scholar] [CrossRef]
- Janeček, M.; Dostál, T.; Kozlovsky-Dufková, J.; Dumbrovský, M.; Hůla, J.; Kadlec, V.; Konečná, J.; Kovář, P.; Krása, J.; Kubátová, E.; et al. Methodical Handbook—Protection of Agricultural Soils from the Soil Erosion; Publishing House of the Czech Technical University: Prague, Czech Republic, 2012. (In Czech) [Google Scholar]
- Holý, J. Erosion and the Environment; Publishing House of the Czech Technical University: Prague, Czech Republic, 1994. (In Czech) [Google Scholar]
- Antal, J.; Maderková, L.; Čimo, J.; Drgoňová, K. Analyses of Calculation Methods for Determination of Rain Erosivity for Slovak Republic. Acta Sci. Pol. Form. Circumiectus 2015, 14, 5–14. [Google Scholar] [CrossRef]
- Amsalu, T.; Mengaw, A. GIS Based Soil Loss Estimation Using RUSLE Model: The Case of Jabi Tehinan Woreda. Nat. Resour. 2014, 5, 616–626. [Google Scholar] [CrossRef] [Green Version]
- Appels, W.M.; Bogaart, P.W.; van der Zee, S.E. Surface Runoff in Flat Terrain: How Field Topography and Runoff Generating Processes Control Hydrological Connectivity. J. Hydrol. 2016, 534, 493–504. [Google Scholar] [CrossRef]
- Vanmaercke, M.; Panagos, P.; Vanwalleghem, T.; Hayas, A.; Foerster, S.; Borrelli, P.; Rossi, M.; Torri, D.; Casali, J.; Borselli, L.; et al. Earth-Science Reviews Measuring, Modelling and Managing Gully Erosion at Large Scales: A State of the Art. Earth-Science Rev. 2021, 218, 103637. [Google Scholar] [CrossRef]
- Žížala, D.; Juřicová, A.; Kapička, J.; Novotný, I. The Potential Risk of Combined Effects of Water and Tillage Erosion on the Agricultural Landscape in Czechia. J. Maps 2021, 17, 428–438. [Google Scholar] [CrossRef]
- Drbal, K.; Dumbrovský, M.; Muchová, Z.; Sobotková, V.; Štěpánková, P.; Šarapatka, B. Mitigation of Flood Risks with the Aid of the Critical Points Method. Agronomy 2022, 12, 1300. [Google Scholar] [CrossRef]
- Liu, T.; Bruins, R.J.F.; Heberling, M.T. Factors Influencing Farmers’ Adoption of Best Management Practices: A Review and Synthesis. Sustainability 2018, 10, 432. [Google Scholar] [CrossRef] [Green Version]
- Spânu, I.-A.; Ozunu, A.; Petrescu, D.C.; Petrescu-Mag, R.M. A Comparative View of Agri-Environmental Indicators and Stakeholders’ Assessment of Their Quality. Agriculture 2022, 12, 490. [Google Scholar] [CrossRef]
- Blann, K.L.; Anderson, J.L.; Sand, G.S.; Vondracek, B. Effects of Agricultural Drainage on Aquatic Ecosystems: A Review. Crit. Rev. Environ. Sci. Technol. 2006, 39, 909–1001. [Google Scholar] [CrossRef]
- Bengtson, R.; Carter, C.E.; Fouss, J.L.; Southwick, L.M. Agricultural Drainage and Water Quality in Mississippi Delta. J. Irrig. Drain. Eng. 1995, 121, 292–295. [Google Scholar] [CrossRef]
- Häggblom, O.; Salo, H.; Turunen, M.; Nurminen, J.; Alakukku, L.; Myllys, M.; Koivusalo, H. Impacts of Supplementary DrainAge on the Water Balance of a Poorly Drained Agricultural Field. Agric. Water Manag. 2019, 223, 105568. [Google Scholar] [CrossRef]
- Skagges, R.W. Field Evaluation of a Water Management Simulation Model. Trans. ASAE 1982, 25, 666–674. [Google Scholar] [CrossRef]
- Istok, J.D.; Kling, G.F. Effect of Subsurface Drainage on Runoff and Sediment Yield from an Agricultural Watershed in Western Oregon, U.S.A. J. Hydrol. 1983, 65, 279–291. [Google Scholar] [CrossRef]
- Øygarden, L.; Kværner, J.; Jenssen, P.D. Soil Erosion via Preferential Flow to Drainage Systems in Clay Soils. Geoderma 1997, 76, 65–86. [Google Scholar] [CrossRef]
- McGowan, M.; Williams, J.; Monteith, J. The Water Balance of an Agricultural Catchment in the Water Balance. Eur. J. Soil Sci. 1980, 31, 245–262. [Google Scholar] [CrossRef]
- Reid, I.; Parkinson, R.J. The Nature of the Tile-Drain Outflow Hydrograph in Heavy Clay Soils. J. Hydrol. 1984, 72, 289–305. [Google Scholar] [CrossRef]
- Verheijen, F.G.A.; Jones, R.J.A.; Rickson, R.J.; Smith, C.J.; Bastos, A.C.; Keizer, J.J. Concise Overview of European Soil Erosion Research and Evaluation. Acta Agric. Scand. Sect. B Soil Plant Sci. 2012, 62 (Suppl. 2), 185–190. [Google Scholar] [CrossRef]
- Graves, A.R.; Morris, J.; Deeks, L.K.; Rickson, R.J.; Kibblewhite, M.G.; Harris, J.A.; Farewell, T.S.; Truckle, I. The Total Costs of Soil Degradation in England and Wales. Ecol. Econ. 2015, 119, 399–413. [Google Scholar] [CrossRef]
- Alaoui, A.; Rogger, M.; Peth, S.; Blöschl, G. Does Soil Compaction Increase Floods? A Review. J. Hydrol. 2018, 557, 631–642. [Google Scholar] [CrossRef]
- Stalham, M.A.; Allen, E.J.; Herry, F.X. Effects of Soil Compaction on Potato Growth and Its Removal by Cultivation. Res. Rev. 2015, 261, 1–60. [Google Scholar]
- Schack-Kirchner, H.; Fenner, P.T.; Hildebrand, E.E. Different Responses in Bulk Density and Saturated Hydraulic Conductivity to Soil Deformation by Logging Machinery on a Ferralsol under Native Forest. Soil Use Manag. 2007, 23, 286–293. [Google Scholar] [CrossRef]
- Bednář, M.; Šarapatka, B. Relationships between Physical—Geographical Factors and Soil Degradation on Agricultural Land. Environ. Res. 2018, 164, 660–668. [Google Scholar] [CrossRef]


Disclaimer/Publisher’s Note: The statements, opinions and data contained in all publications are solely those of the individual author(s) and contributor(s) and not of MDPI and/or the editor(s). MDPI and/or the editor(s) disclaim responsibility for any injury to people or property resulting from any ideas, methods, instructions or products referred to in the content. |
© 2023 by the authors. Licensee MDPI, Basel, Switzerland. This article is an open access article distributed under the terms and conditions of the Creative Commons Attribution (CC BY) license (https://creativecommons.org/licenses/by/4.0/).
Share and Cite
Gebhart, M.; Dumbrovský, M.; Šarapatka, B.; Drbal, K.; Bednář, M.; Kapička, J.; Pavlík, F.; Kottová, B.; Zástěra, V.; Muchová, Z. Evaluation of Monitored Erosion Events in the Context of Characteristics of Source Areas in Czech Conditions. Agronomy 2023, 13, 256. https://doi.org/10.3390/agronomy13010256
Gebhart M, Dumbrovský M, Šarapatka B, Drbal K, Bednář M, Kapička J, Pavlík F, Kottová B, Zástěra V, Muchová Z. Evaluation of Monitored Erosion Events in the Context of Characteristics of Source Areas in Czech Conditions. Agronomy. 2023; 13(1):256. https://doi.org/10.3390/agronomy13010256
Chicago/Turabian StyleGebhart, Michal, Miroslav Dumbrovský, Bořivoj Šarapatka, Karel Drbal, Marek Bednář, Jiří Kapička, František Pavlík, Blanka Kottová, Vojtěch Zástěra, and Zlatica Muchová. 2023. "Evaluation of Monitored Erosion Events in the Context of Characteristics of Source Areas in Czech Conditions" Agronomy 13, no. 1: 256. https://doi.org/10.3390/agronomy13010256