1. Introduction
Precision agriculture includes new techniques and technologies for automated driving; the testing of soil physical, chemical and hydrological properties; cartography; direct or remote crop sensing and mapping; the use of GIS; variable tillage; and pesticide, fertilizer and sowing material distribution in agricultural fields [
1]. Many of these precision technologies are based on data digitalization. Digitalization makes farm production more efficient and environmentally friendly. Currently, digital tools are available for large-scale farms. Some of these tools are not only part of agricultural machinery but are also available as apps and digital platforms for smartphones [
2].
The main purpose of seeding is to incorporate seeds at a certain distance and depth in a seed bed. A correct and uniform sowing depth provides a better cultivation area per seed [
3]. This is very important for the uniform timing of crop emergence and germination rate [
4] and, later, for crop development and productivity [
5]. The main problem in seeding is the strength of soil resistance, which constantly changes depending on the physical and mechanical properties of the soil and the effect of seeding uniformity [
6]. Soil texture, moisture content, compaction, resistance and other soil physical properties can determine the variability in position of the seeding coulters [
4,
7]. For conventional-usual seeding machines, the seeding depth is determined manually before sowing by changing the position of the gauge wheels in relation to the seeding coulters [
8]. In precision seeders, tractor suspensions (hitches), hydraulic cylinders, electro-hydraulic downforce control systems, electric motors with a mechanical drive, pneumatic systems and magnetorheological cylinders are used for sowing depth adjustment [
8,
9,
10,
11]. In the study of Karayel and Özmerzi [
12], the least variation of sowing depth was found using a side gauge as depth-control component. This component provided a better uniformity of the vertical seed distribution and the percentage of germination. Rear press wheel for depth control showed weak results because it sunk into loose soil and created the deepest and most variable seeding depth. The existing downforce control systems have been mainly developed by John Deere (Deere & Company, Moline, Illinois, USA) active pneumatic downforce system with Seed Star™ tracking technology, Precision Planting (Precision Planting LLC, Illinois, USA) Airforce
® and DeltaForce
® downforce control system with 20/20 tracking SeedSense system and AG Leader (Ag Leader Technology, Iowa, USA) SureForceTM hydraulic control system with InCommand
® monitor [
13]. In our experiment, we used a Horsch Avatar 6.16 SD seed drill, in which the downforce system helps to maintain the same seeding depth and reduces it as needed depending on variations in soil-particle-size distribution, texture, organic matter content and moisture and penetration resistance [
14]. Unfortunately, electronics and computers systems increase the cost of machines [
15].
There are sensor-based and map-based systems for precision seeding. In our experiment, we used a soil electrical conductivity map for the maintenance of seeding depth. According to the soil conductivity, a field is divided into zones with unique sowing depths [
16,
17]. Heavier soils have higher electrical conductivity because of larger proportions of clay and silt. Such soils have a higher water content and more favorable conditions for rapid seed germination [
18]. Therefore, seeding depth decreases with the increase in clay content (formally, electrical conductivity) [
19]. Conversely, the sowing depth is increased as the sand content in the soil increases.
Variable fertilization, pest and disease control and seeding rate systems have been in development for the last 2–3 decades, but the automatic maintenance of crop seeding depth according to the maps of soil properties, such as soil electrical conductivity, is still under study, especially in the fields with a high variation in soil topography, texture, penetration resistance, aggregate size distribution, etc. During last two decades, Lithuanian scientists (as well the authors of this study) performed many investigations on the testing of different crop seed bed conditions as well as seeding depth. However, automated seeding depth maintenance based on the results of the soil electrical conductivity maps have never been investigated in the Baltic States. Therefore, the objectives of our study are (i) to analyze the soil structural composition, stability, penetration resistance, seeding depth, germination and seedling biomass of winter wheat seeds in different zones of an experimental field according to electrical conductivity and seeding treatments and (ii) to ascertain the correlations among soil electrical conductivity and soil properties, soil properties, seeding depth, seed germination, seedling development and crop productivity.
2. Materials and Methods
2.1. Site Description
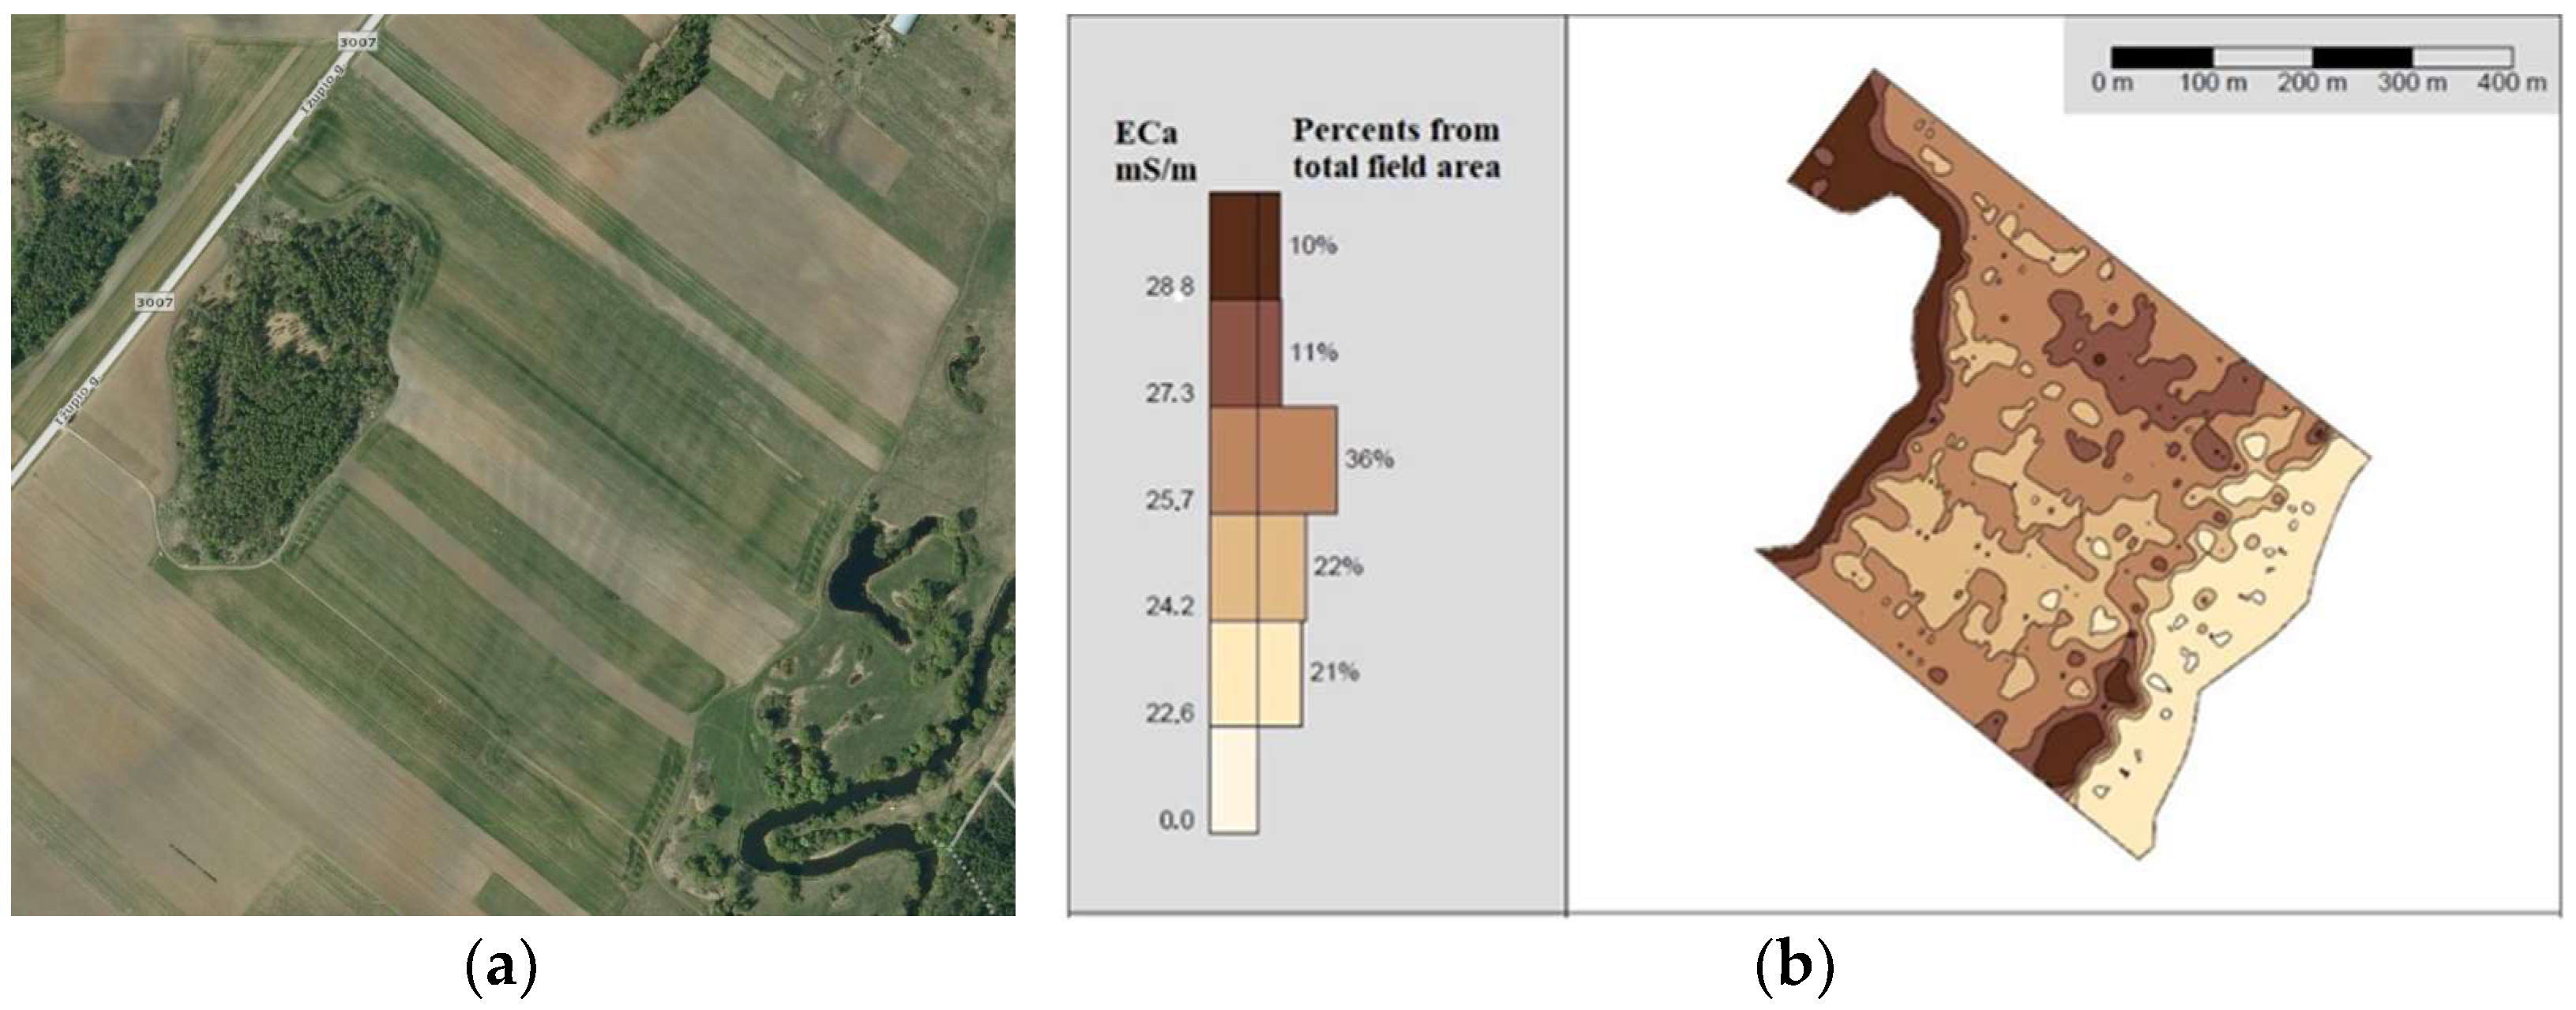
A stationary on-farm field experiment was performed in the Panevėžys district (Lithuania) during 2020–2022. The data from the 2021–2022 winter wheat vegetative season are discussed. Experimental studies were carried out in an area of 22.4 ha (
Figure 1a). The total width of the field was 450 m and the length was 600 m.
The territory of the experimental site was in the zone with an average annual precipitation of 600–650 mm. The vegetative period of the winter wheat lasted about 190–210 days. Cambisols were dominant in the region of the experiment. The topsoil was up to 25–30 cm in thickness. The average pH of the field topsoil was 7.3, and the content of available phosphorus was 42 mg·kg−1, while that of available potassium was 121 mg·kg−1, that of available magnesium was 149 mg·kg−1 and that of organic matter was 20 g·kg−1.
2.2. Experimental Design
In the experimental field, five different zones (from EZ1 (dark brown) to EZ5 (light brown)) were distinguished according to the apparent soil electrical conductivity (true granulometric content) (
Figure 1b and
Table 1). In most zones, sandy loam was dominant. Zone EZ5 was characterized by loamy sand.
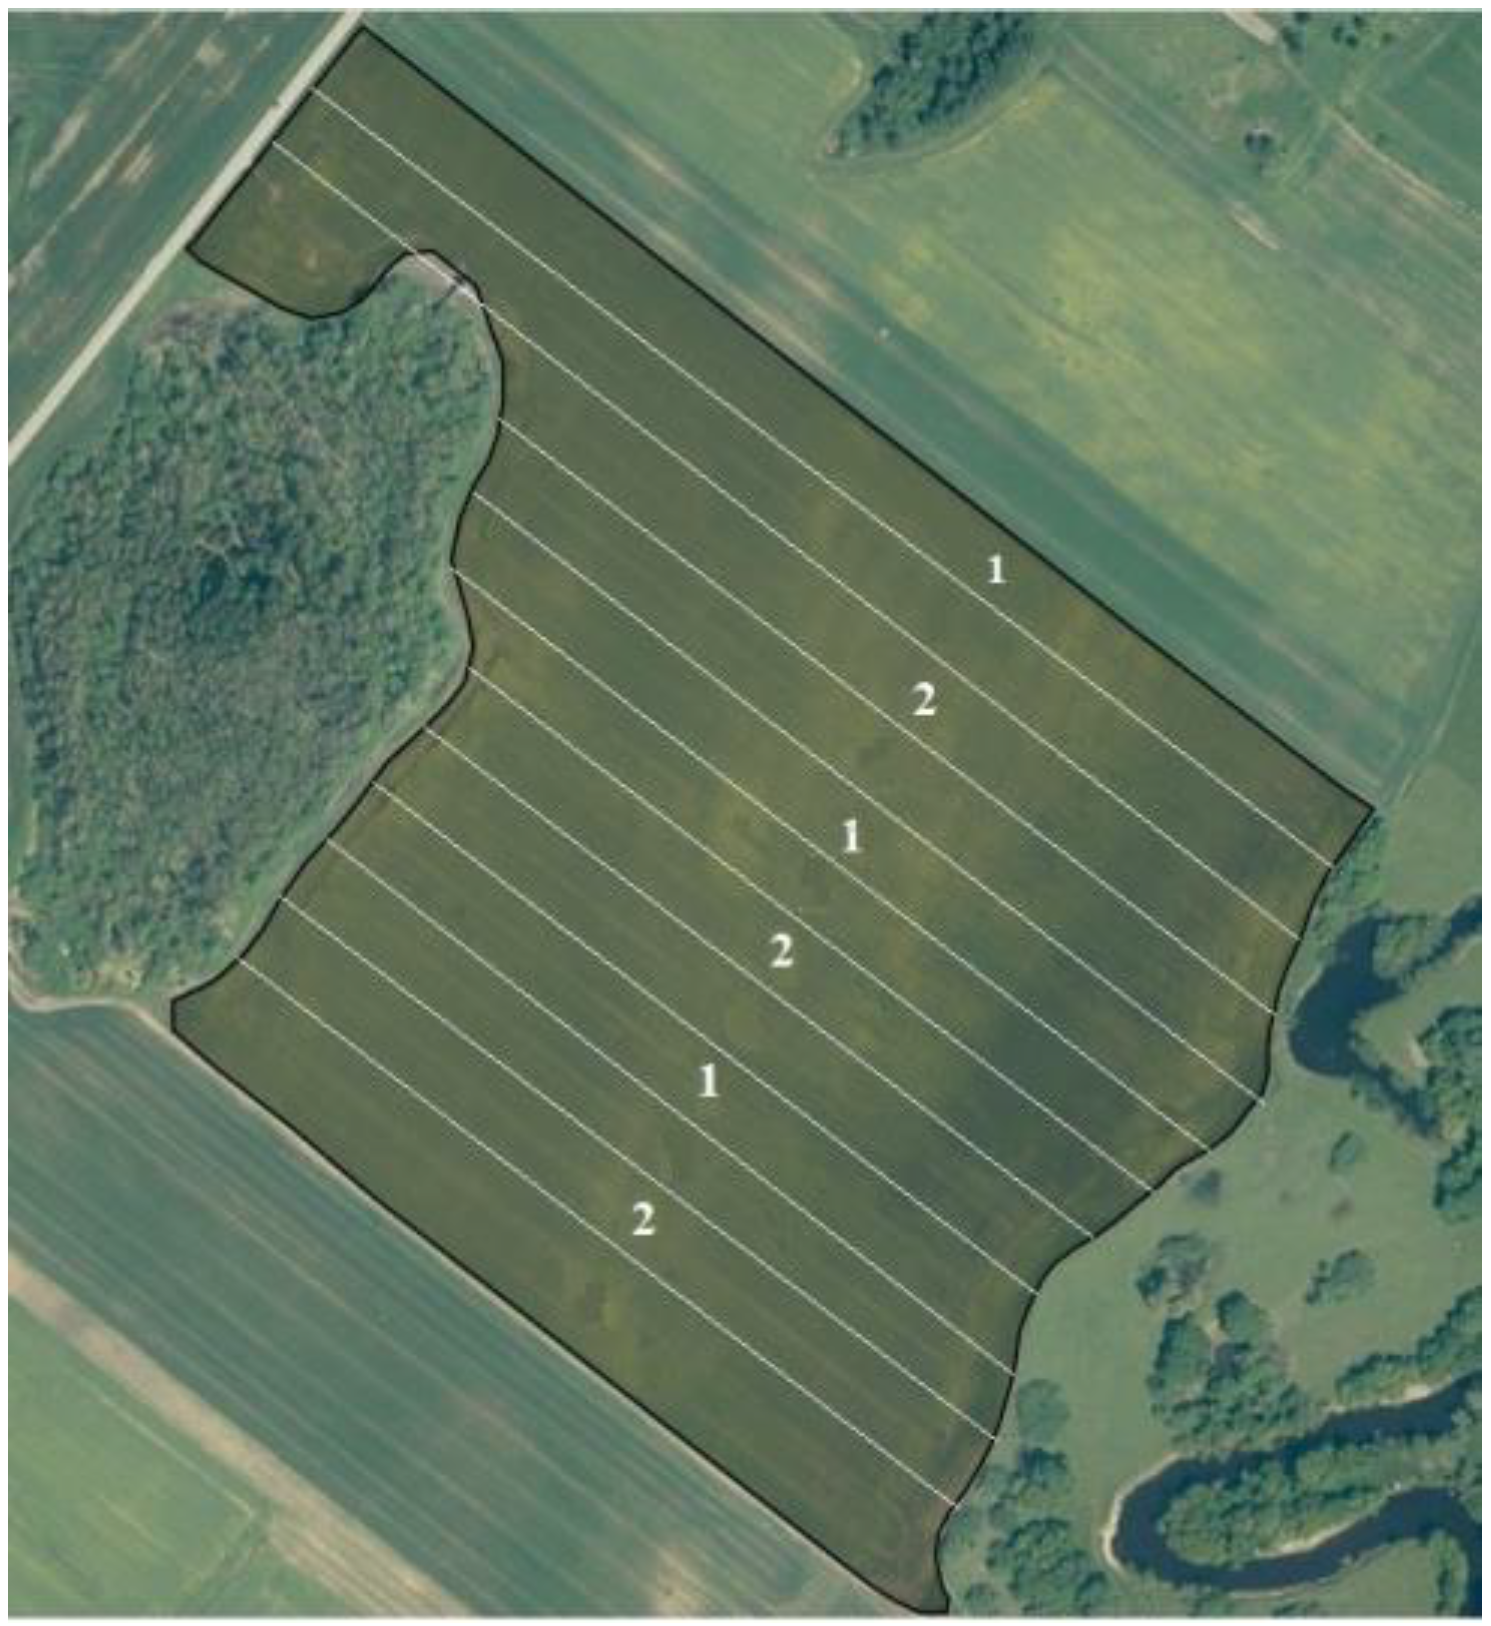
Seeding method was considered as factor A in the experiment. It consisted of two treatments: (1) uniform seeding depth and (2) variable seeding depth (
Figure 2).
The different zones of the experimental field (EZ1–EZ5) determined according to electrical conductivity were named as the five treatments for experimental factor B. Three replications were performed for each treatment. The length of each experimental plot was 600 m and the width was 36 m.
2.3. Agronomic Practices
In our experiment, the pre-crop of winter wheat was peas. A no-till system was applied. The winter wheat seeding rate was 4.02 million seeds ha
−1, or about 180 kg ha
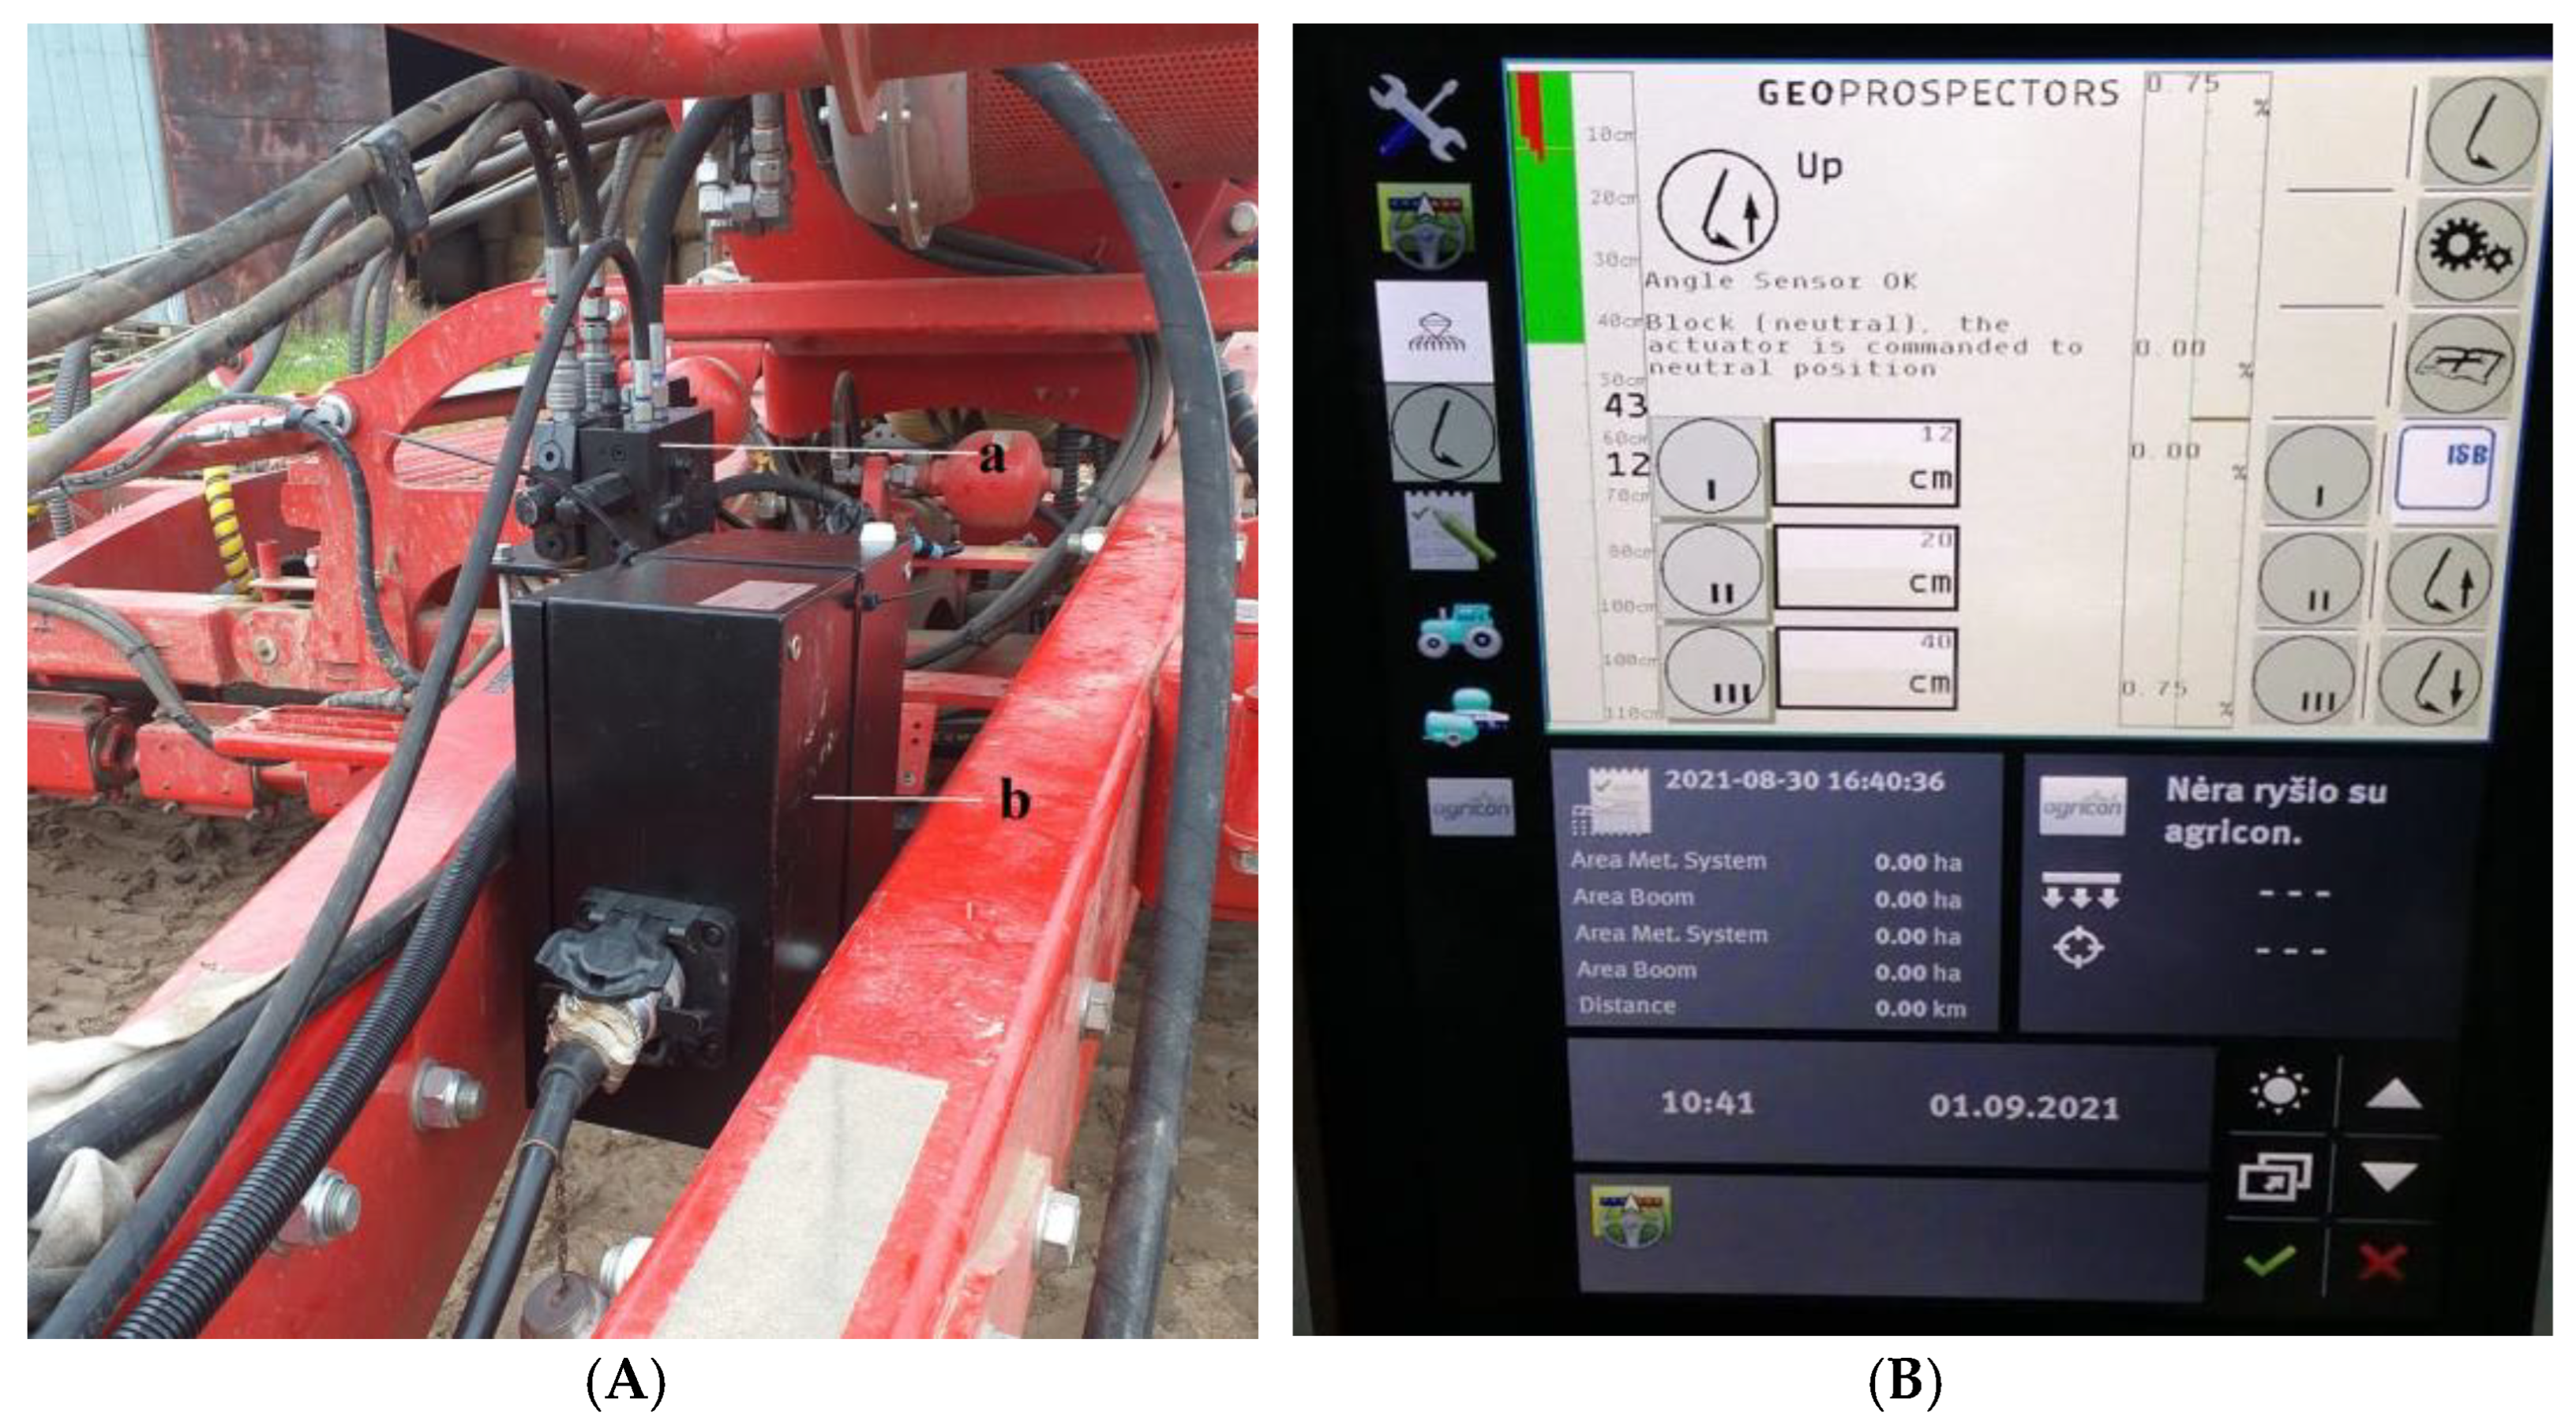
−1. The ‘Skagen’ variety was sown. A Horsch Avatar 6.16 SD (HORSCH Industrietechnik GmbH, Ronneburg, Germany) direct seeding seeder with a working width of 6 m was selected for seeding winter wheat, which, using telematic automatic control tools, performed the technological seeding process perfectly according to the specified task. For depth control, a hydraulic system DepthXControl (Geoprospectors GmbH, Traiskirchen, Austria) was used. It was mounted on the frame of the Horsch Avatar seeding machine. A map of the variable seeding depth was loaded onto a computer on the tractor. According to the map and the GPS coordinates of the seeding machine, the computer sent a signal to an Isobus control unit that transmitted a signal to the hydraulics control unit, which changed the pressure in the frame cylinders. In this way, the cylinders were displaced or retracted, thereby changing the level of clamping of the seeder disks into the soil. A position sensor mounted on the frame with the cylinders using a spring sent information to the terminal about the distance of the frame cylinders from the ground surface (
Figure 3).
Winter wheat was sown with a distance of 167 mm between rows. The seeding speed was 10 km·h−1.
Complex N12P52 fertilizer was incorporated locally at a uniform rate of 100 kg·ha−1 near the seeds. The remaining N12P52 fertilizer was spread at a uniform rate of 75 kg·ha−1 after seeding. KCL60 potassium fertilizer was spread after seeding at a uniform rate of 90 kg·ha−1. The first nitrogen fertilization was carried out at the BBCH 23 growth stage with 60 kg N·ha−1 (KAS32 and TIO10) of liquid fertilizer. The second N fertilization was carried out at the growth stage of BBCH 32. An amount of 70 kg N·ha−1 (KAS32 and TIO10) of liquid fertilizer was applied. The third fertilization was carried out at the growth stage of BBCH 47, with 50 kg N·ha−1 (34% ammonium nitrate) applied.
To protect crops from lodging, Regucil at 0.2 l·ha−1 and Cycocel at 0.5 l·ha−1 (average solution rate of 150 l·ha−1) were used as growth regulators for the first application (BBCH 30). For the second application (BBCH 47), the growth regulator Terpal at 0.7 l·ha−1 and the fungicide Ascra Xpro at 0.8 l·ha−1 (average solution rate of 150 l·ha−1) were used. For the third application (BBCH 59), Orius at 0.75 l·ha−1 (average solution rate 100 l·ha−1) was applied as a fungicide. Nuance at 0.01 g·ha−1 and MCPA 0.7 l·ha−1 (solution rate of 150 l·ha−1) were used as herbicides (BBCH 23).
2.4. Methods and Analysis
In order to determine the differences in the soil properties of the field zones and to create an accurate soil-sampling plan, soil scanning was performed using an EM-38 MK-2 electrical conductivity scanner device (Geonics Ltd., Mississauga, ON, Canada) before the experimental field studies. The measurement of the apparent electrical conductivity (mS m−1) between the soil depths of 0 and 150 cm was carried out by driving a Toyota all-terrain vehicle at a speed of 10–15 km h−1 while pulling the EM-38 MK-2 device, which was placed on a plastic sled, and obtaining measurements at 24 m intervals. After the field measurements of soil electrical conductivity, all field electrical conductivity information was sent via the internet using a 4G connection from an off-road Panasonic Toughbook CF 19 computer (Panasonic Holding Corporation, Osaka, Japan) to an office computer and converted to csv format using the Convert EM-38 MK-2 (Geonics Ltd., Mississauga, Canada) program. Later, using the Open-Source Geographic Information System (QGIS), 5 zones (EZ1–EZ5) with different characteristics were created with an average area of 4 ha each, taking into account the similar characteristics of the soil in the field. Using automatic soil-sampling equipment manufactured by Agricon GmbH (Ostrau, Germany) and Adigo AS (Langhus, Norway), representative soil samples were obtained, and various soil properties, such as pH and P, K, Mg and organic matter contents, were determined. In each zone, up to 20 soil samples were obtained automatically while driving along the zone’s trajectory. A total of 5 compound soil samples of 300–500 g each with different properties were created from different zones. In the Agrolab GmbH accredited laboratory (Landshut, Germany), the samples were tested. The methods of analysis included: pHkCl and ISO 10390 (potentiometric); the P2O5, K2O and A-L methods (P, spectrometric; K, atomic emission spectrometric); magnesium (Mg); and LVP D–13: 2016, Issue 2.
The sampling and measurements of soil granulometric compositions (texture), structural composition, stability and penetration resistance were performed in 30 experiment locations according to the zones of electrical conductivity at the renewal of winter wheat vegetation in spring. The sampling layer was mainly 0–20 cm (penetration resistance of up to 50 cm in depth).
Soil granulometric composition (texture) was determined in the laboratory of the Lithuanian Research Center for Agriculture and Forestry according to ISO standard 11277-2020.
Soil aggregate size distribution (structure) and its stability were determined by obtaining soil samples from five places in each experimental spot. After that, an average composite sample was formed, which was left to dry in laboratory conditions. After the soil dried, a 200 g soil sample was weighed and sieved through sieves with different hole diameters. In this way, the structure of the soil was determined. Optimum soil structure was considered when megastructures (soil particles with diameters >10 mm) made up no more than 20–25%, macrostructures (0.25–10 mm) made up no more than 60% and microstructures (<0.25 mm) made up no more than 5% of the sample [
20,
21,
22]. The stability of the soil structure (ability not to disintegrate in water) was determined by the method of wet sieving the soil, using a Retsch screening apparatus (Retsch GmbH, Haan, Germany). An average soil sample of 50 g was made from the obtained soil fractions and was left for 10 min to soak in a glass cylinder with water to remove air from the structural particles of the soil and fill all the pores of the soil with water. After a set time, a set of sieves with hole diameters from 5 to 0.25 mm was collected in a larger container with water. After sieving in water, persistent (unwashed) soil particles were collected in separate metal plates and were dried with the sample in a drying cabinet at a temperature of 105 °C to a constant mass. The dried samples were cooled and weighed, and the percentage of stabile soil particles was calculated. The optimum stability of the soil structure in water was obtained when >50% of the soil particles were not destroyed [
22].
We determined the penetration resistance of the soil in the experiment with a penetrologger (Royal Eijkelkamp, Giesbeek, The Netherlands) with the addition of moisture measurements in the top soil (0–5 cm soil layer). Measurements were performed in 5 locations up to 1–2 m away from the test point.
The ANOVA (vers. 4.0) and STAT_ENG (vers. 1.55) programs of the SELEKCIJA software (vers. 5.00, author Dr. Pavelas Tarakanovas. Lithuanian Institute of Agriculture, Akademija, Kedainiu distr., Lithuania) were used. The correlation analysis matrix included data on soil electrical conductivity, soil structure and stability in water, seeding depth, seed germination and the air-dried biomass of seedlings.
3. Results and Discussion
3.1. Soil Physical Properties
In our experiment, the seeding method (factor A) did not have a significant effect on the soil structural composition (
Table 2). In conventionally seeded plots (uniform seeding), we found slightly higher proportions of mega- and microstructures, and fewer macrostructures. The amounts of macrostructures in all measuring spots of the experiment were higher than the minimal requirements (≥60%). However, the amounts of microstructures were too high, exceeding 5%. This could be due to a higher amount of sand particles in the soil. The stability of the soil in the experiment was, on average, 63% and met the model requirements (>50%).
As expected, the soil structural compositions significantly differed between soil zones (factor B) divided according to electrical conductivity. The highest differences were between EZ1 and EZ5. In EZ1, the amount of megastructures was nearly four times higher than that in EZ5. In addition, the amount of macrostructures was also the lowest, with a significant value. For locations in EZ5, the highest significant amount of microstructures was found. In EZ1, the proportion of microstructures met the model requirements. Unexpectedly, the highest soil stability was found in EZ5, despite the high content of sand and the large amount of microstructures. In addition, the interaction between seeding method and soil zone was significant for soil stability only.
Soil texture, tillage and seeding methods can affect soil structural composition (aggregate size distribution) [
23,
24]. We found that sand and silt contents in the soil correlated with the soil structural composition. The amounts of sand and silt correlated with the percentages of soil macrostructures (
r = −0.585 and 0.607, respectively;
p > 0.05), microstructures (
r = 0.895 and −0.904, respectively;
p ≤ 0.010 > 0.001) and stability (
r = 0.743 and −0.754, respectively;
p ≤ 0.05 > 0.01).
The impact of seeding method on penetration resistance in soil different layers was not significant. However, the differences among the experimental zones were clearer in the 11–20 cm layer (
Table 3). In EZ5, the highest soil penetration resistance was mainly observed in this layer. Despite this, soil penetration resistance reached 2.5 kPa and had no negative effect on seedling development [
25]. The interactions with other experimental factors were not significant.
In our experiment, soil electrical conductivity partly correlated with soil penetration resistance in the 0–5 cm soil layer (r = −0.533; p > 0.05), because the amounts of sand and silt also correlated with penetration resistance (r = 0.509 and −0.512, respectively; p > 0.05). In addition, we found a strong correlation between topsoil moisture content and penetration resistance (r = −0.782; p ≤ 0.010 > 0.001).
On average, seeding treatments (factor A) did not have a significant impact on the top-soil moisture content (
Table 4). However, the differences among soil zones (factor B) in the experiment were mainly significant. In EZ1, EZ2 and EZ3 had the highest electrical conductivity values, and the silt, clay and moisture contents in the topsoil of these zones were also the highest.
A correlation analysis of the research data showed that the strongest significant correlation was between soil electrical conductivity and topsoil moisture content (r = 0.893, p ≤ 0.010 > 0.001). The proportions of soil granulometric particles (sand, silt and clay) had weak correlations with soil moisture content, while soil electrical conductivity was highly correlated with the sand (r = −0.867; p ≤ 0.010 > 0.001) and silt (r = 0.871; p ≤ 0.010 > 0.001) proportions in the soil.
3.2. Winter Wheat Seeding Depth, Germination and Development
The optimal seeding depth for the most cereals is 30–50 mm [
26,
27]. In intensively tilled soils, the seeding depth is usually higher than in soils that are minimally tilled or not tilled [
28,
29]. Thus, in our experiment, the theoretical uniform seeding depth was 30 mm. On average, the seeding method did not affect seeding depth significantly. However, in the plots without a maintained seeding depth system, the seeding depth varied from 29.38 to 33.17 mm among the soil zones (
Table 5). As was expected, in the plots with variable seeding depths, the variation was higher, ranging from 27.74 to 33.12 mm. On average, the seeding depth was the highest in EZ5 (32.67 mm). The factorial interactions were not significant.
Variation in seeding depth was mainly correlated with topsoil moisture content (
r = 0.460;
p > 0.05). Soil penetration resistance in the upper layers was not high, and seeding depth was a limiting factor, although Mouazen et al. [
30] pointed out that soil compaction, bulk density and root penetration resistance were the main factors limiting plant growth and crop yield.
In our experiment, on average, neither the seeding method nor the experimental zones had a significant effect on seed germination (
Table 6). Despite this, in sampling spots with variable seeding depths, seeds sprouted more abundantly, and the germination of winter wheat reached 99% in EZ3 and EZ4.
Soil aggregate size distribution in a crop seedbed affects the germination, development and productivity of crops [
31,
32]. In our experiment, the soil physical properties were close to optimal for seed germination because we found weak correlations between the soil aggregate distribution, stability, penetration resistance, moisture content and seed germination. The seeding depth met the requirements in the experiment; therefore the correlation between seeding depth and seed germination was weak. However, plenty of authors pointed out the relationships between seeding depth and the germination of different crops [
20,
32,
33,
34,
35,
36,
37,
38].
The rapid development of seedlings ensures higher productivity for crops [
39]. The average air-dried biomass of the seedlings weakly varied among the seeding treatments and experimental zones (
Table 7). The factorial interactions were also not significant. However, when we used a variable seeding depth, the average biomass values of seedlings were similar in the two most different experimental zones (EZ1 and EZ5). This was a positive effect; we did not see this kind of stability in uniform seeding.
Seeding depth was weakly correlated with seedling air-dried biomass. Kirby [
40] found stronger relationships. In our experiment, the air-dried biomass of seedlings was partly correlated with soil penetration resistance for the 0–5 and 6–10 cm depths ((
r = −0.697,
p ≤ 0.05 > 0.01) and
r = −0.508 (
p > 0.05), respectively), as well as with topsoil moisture content (
r = 0.460,
p > 0.05).
3.3. Winter Wheat Grain Productivity Parameters
The effect of factor A (seeding method) was insignificant. However, in variable seeding depths, the yield of grain was, on average, about 300 kg ha
−1 higher than that for uniform seeding (
Table 8). The highest yields of grain were found in EZ1, EZ2 and EZ4 and were significantly higher than that in EZ5 with the sandy soil.
We found average correlations between the yield of grain and the proportion of sand in the soil (r = −0.506, p > 0.05), the amount of soil macrostructures (r = 0.698, p ≤ 0.05 > 0.01) and the amount of microstructures (r = −0.690, p ≤ 0.05 > 0.01).
In our experiment, due to many drought periods during the winter wheat vegetative season, the 1000-grain mass values were not high and did not vary between treatments and field zones significantly (
Table 9).
We found an average correlation between the 1000-grain mass and seeding depth (
r = −0.538,
p > 0.05). The yield of grain was weakly correlated with the 1000-grain mass. In our earlier investigations, winter wheat was uniformly seeded with a mechanical drill using disk sowing shares at depths between 38.5 and 40.5 mm. We found correlations between seeding depth and yield of grain (
r = 0.883,
p > 0.05;
Y = −9.097 + 0.5x), as well as between seeding depth and 1000-grain mass (
r = −0.993,
p > 0.05;
Y = 70.217−0.5x) [
41].
4. Conclusions
Soil electrical conductivity was highly correlated with the sand (r = −0.867; p ≤ 0.010 > 0.001) and silt (r = 0.871; p ≤ 0.010 > 0.001) contents, as well as with the topsoil moisture content (r = 0.893, p ≤ 0.010 > 0.001).
On average, the seeding method did not have a significant effect on the tested soil physical properties. The soil properties differed among the soil electrical conductivity zones.
Winter wheat seeding depth varied between the two most different soil electrical conductivity zones (EZ1 and EZ5) from 27.74 to 33.12 mm, respectively. Despite this, in the sampling spots with variable seeding depths, seeds sprouted more abundantly, and the germination of winter wheat reached 99% (in EZ3 and EZ4).
The seeding method did not affect the yield of winter wheat significantly. However, the highest yield was observed in the plots with variable seeding depths. In EZ1, EZ2 and EZ4, the yields of grain were the highest and were significantly higher than those in the loamy sand of EZ5. The 1000-grain mass was not affected by either the seeding method or field zones.
The results suggest the need for further research in fields with higher variation in soil electrical conductivity. A greater variability in soil electrical conductivity could increase the variability in seeding depth and reveal the interactions of factors in more detail.

 ,
, 


