
Mixtures of Commercial Lentil Cultivars Show Inconsistent Results on Agronomic Parameters but Positive Effects on Yield Stability

Abstract
:1. Introduction
2. Materials and Methods
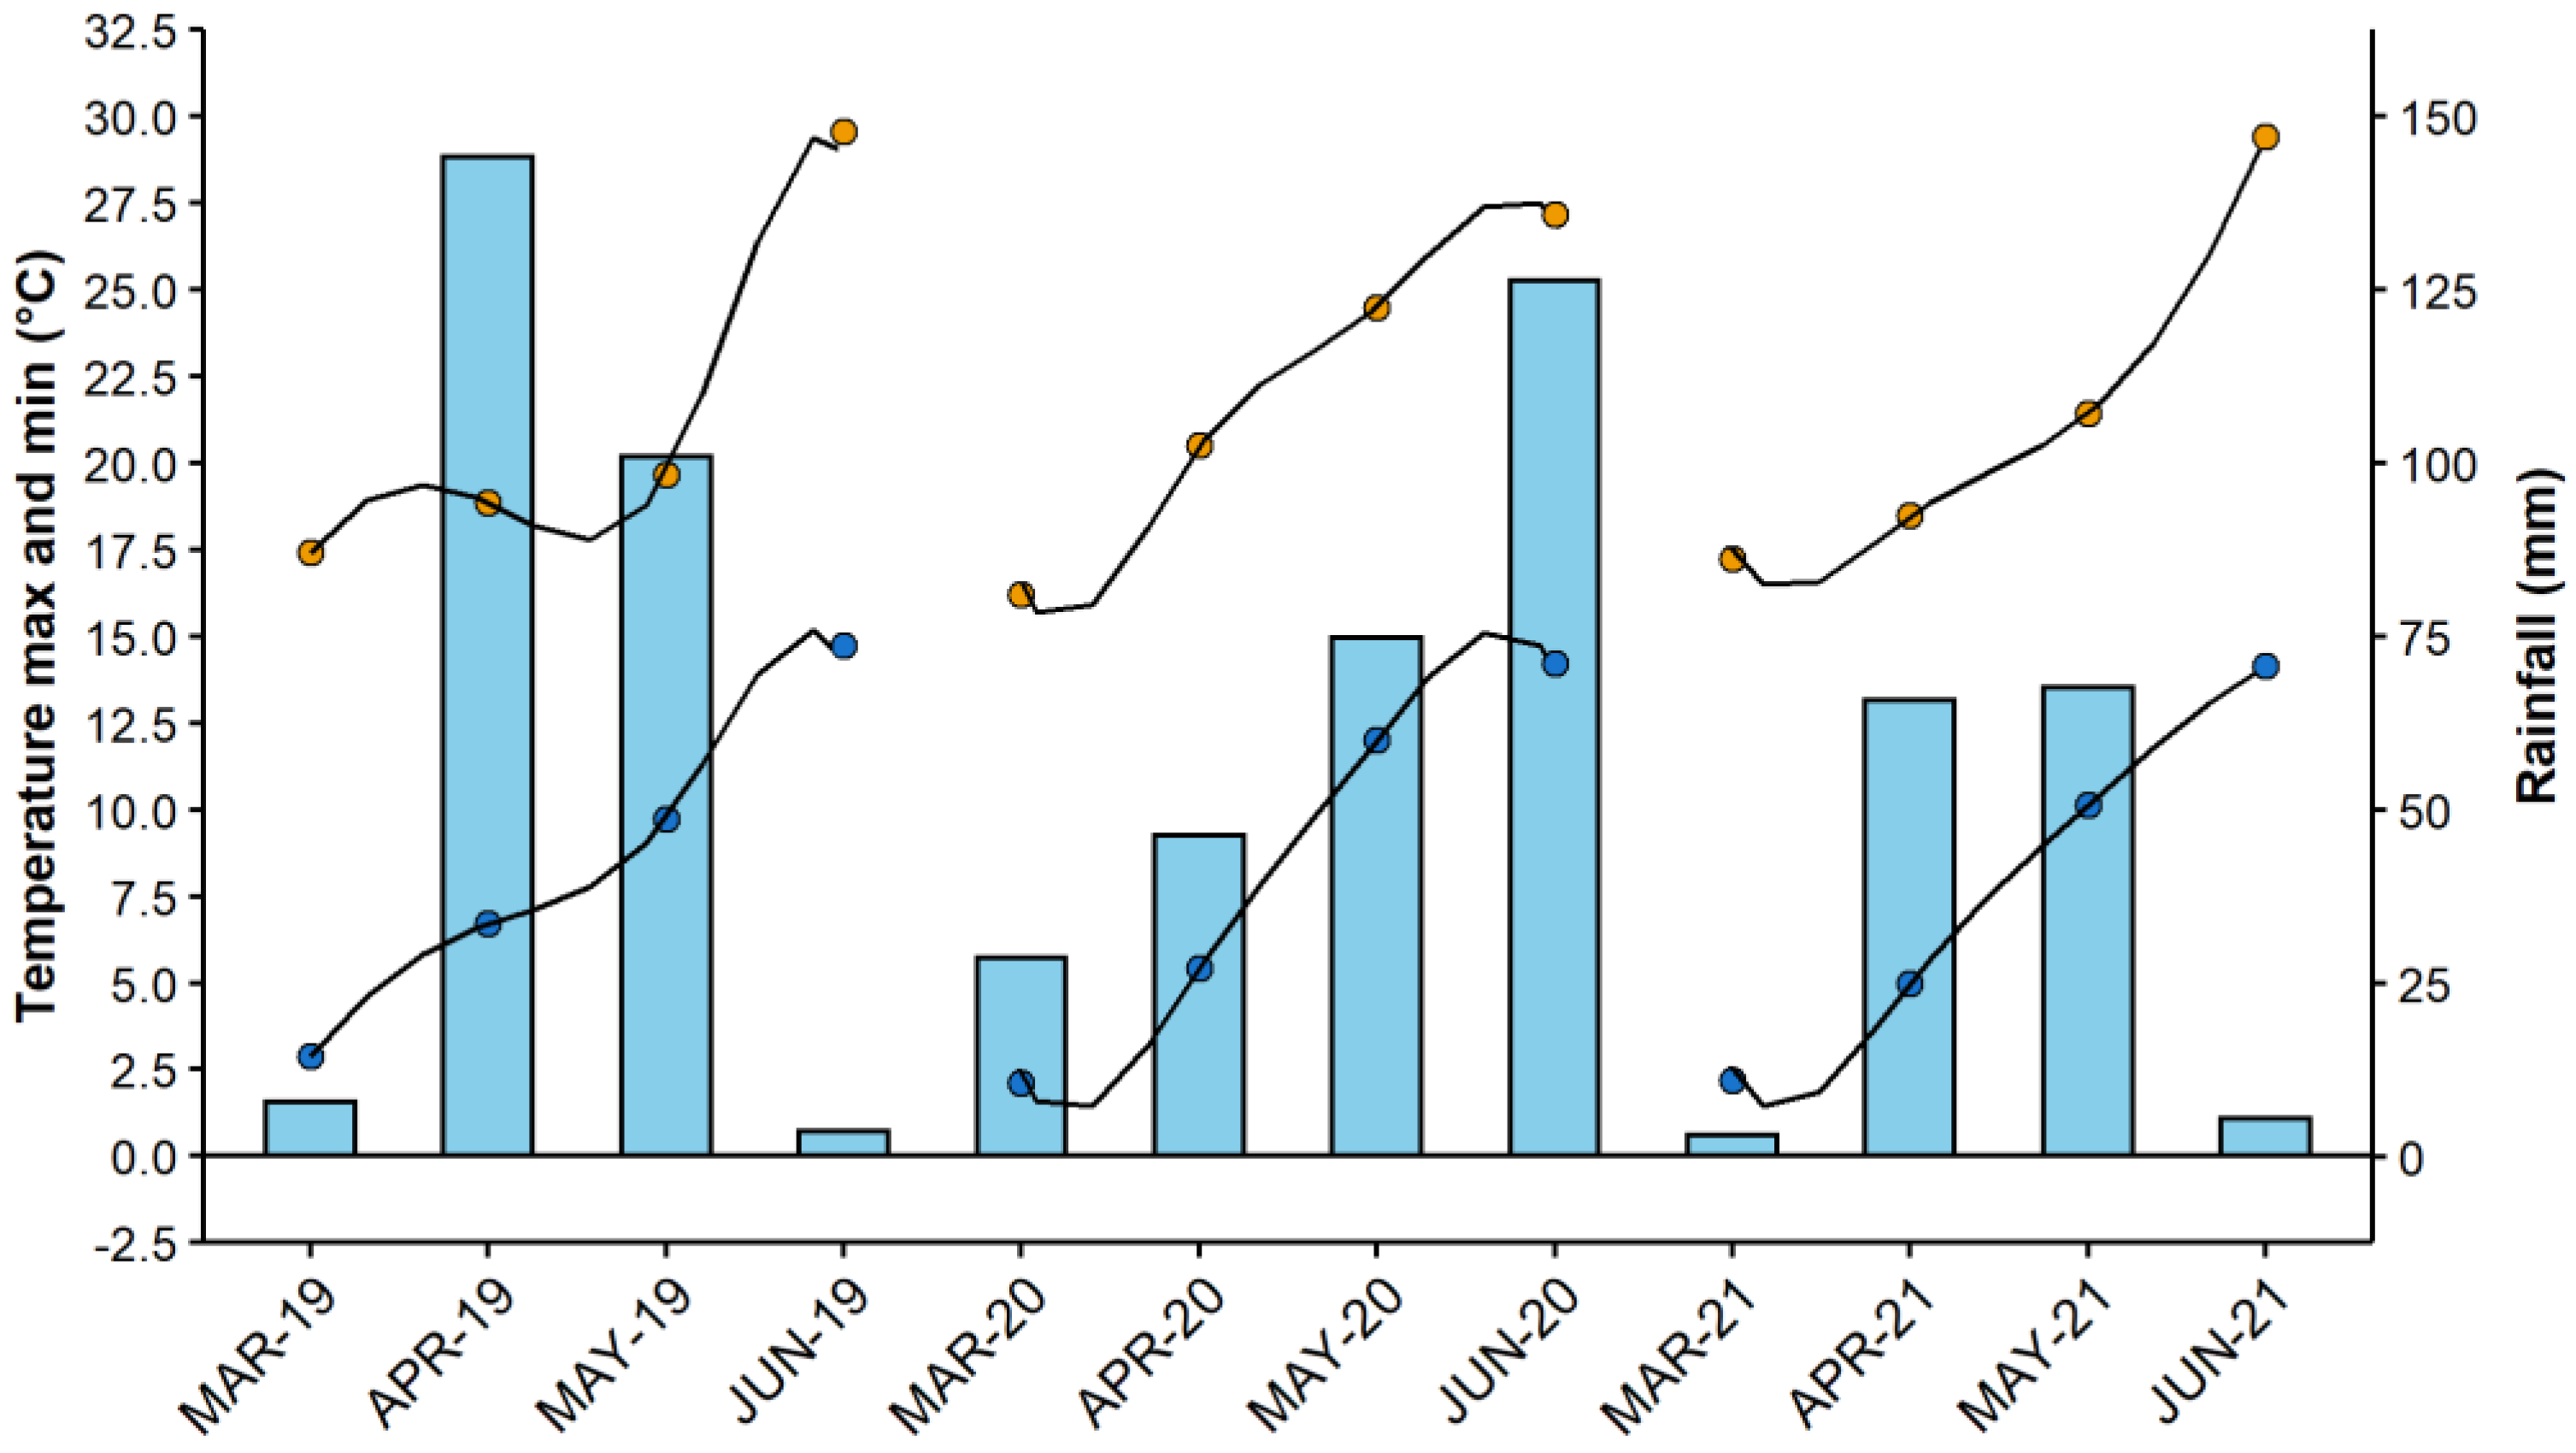
2.1. Soil, Plants and Growing Conditions
2.2. Sampling Procedure and Analysis
2.3. Statistical Analysys
3. Results
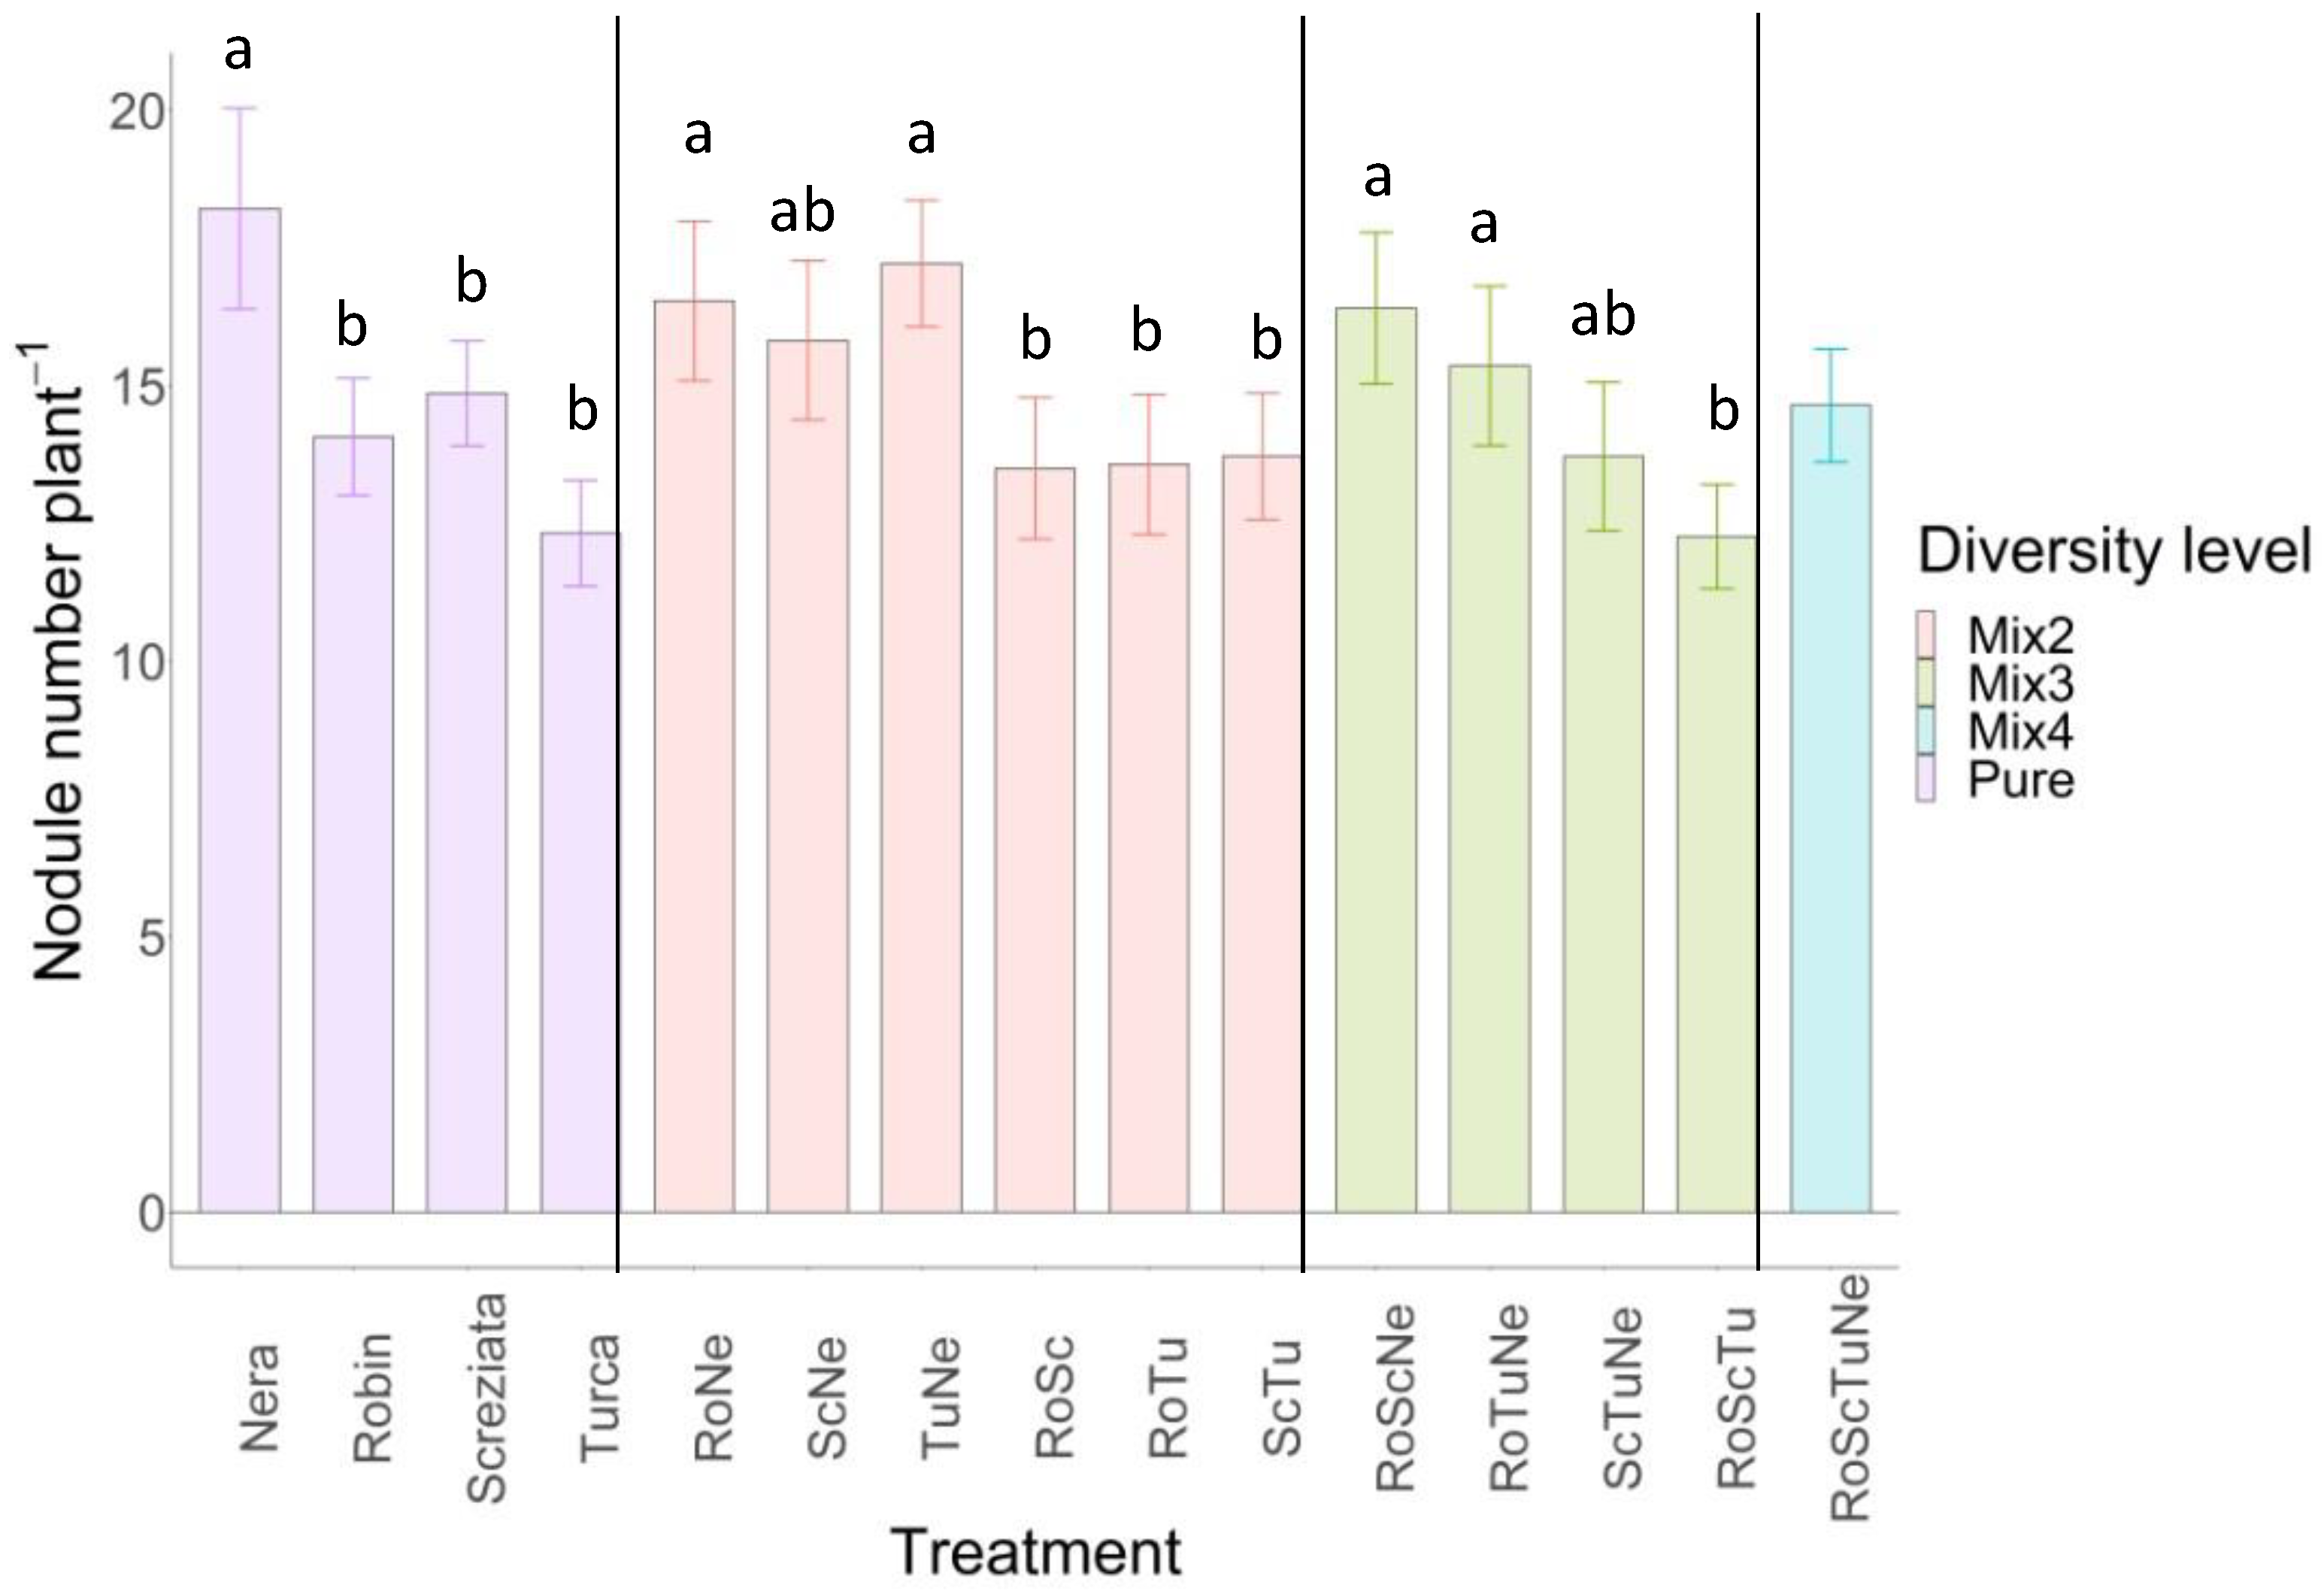
3.1. Nodule Number
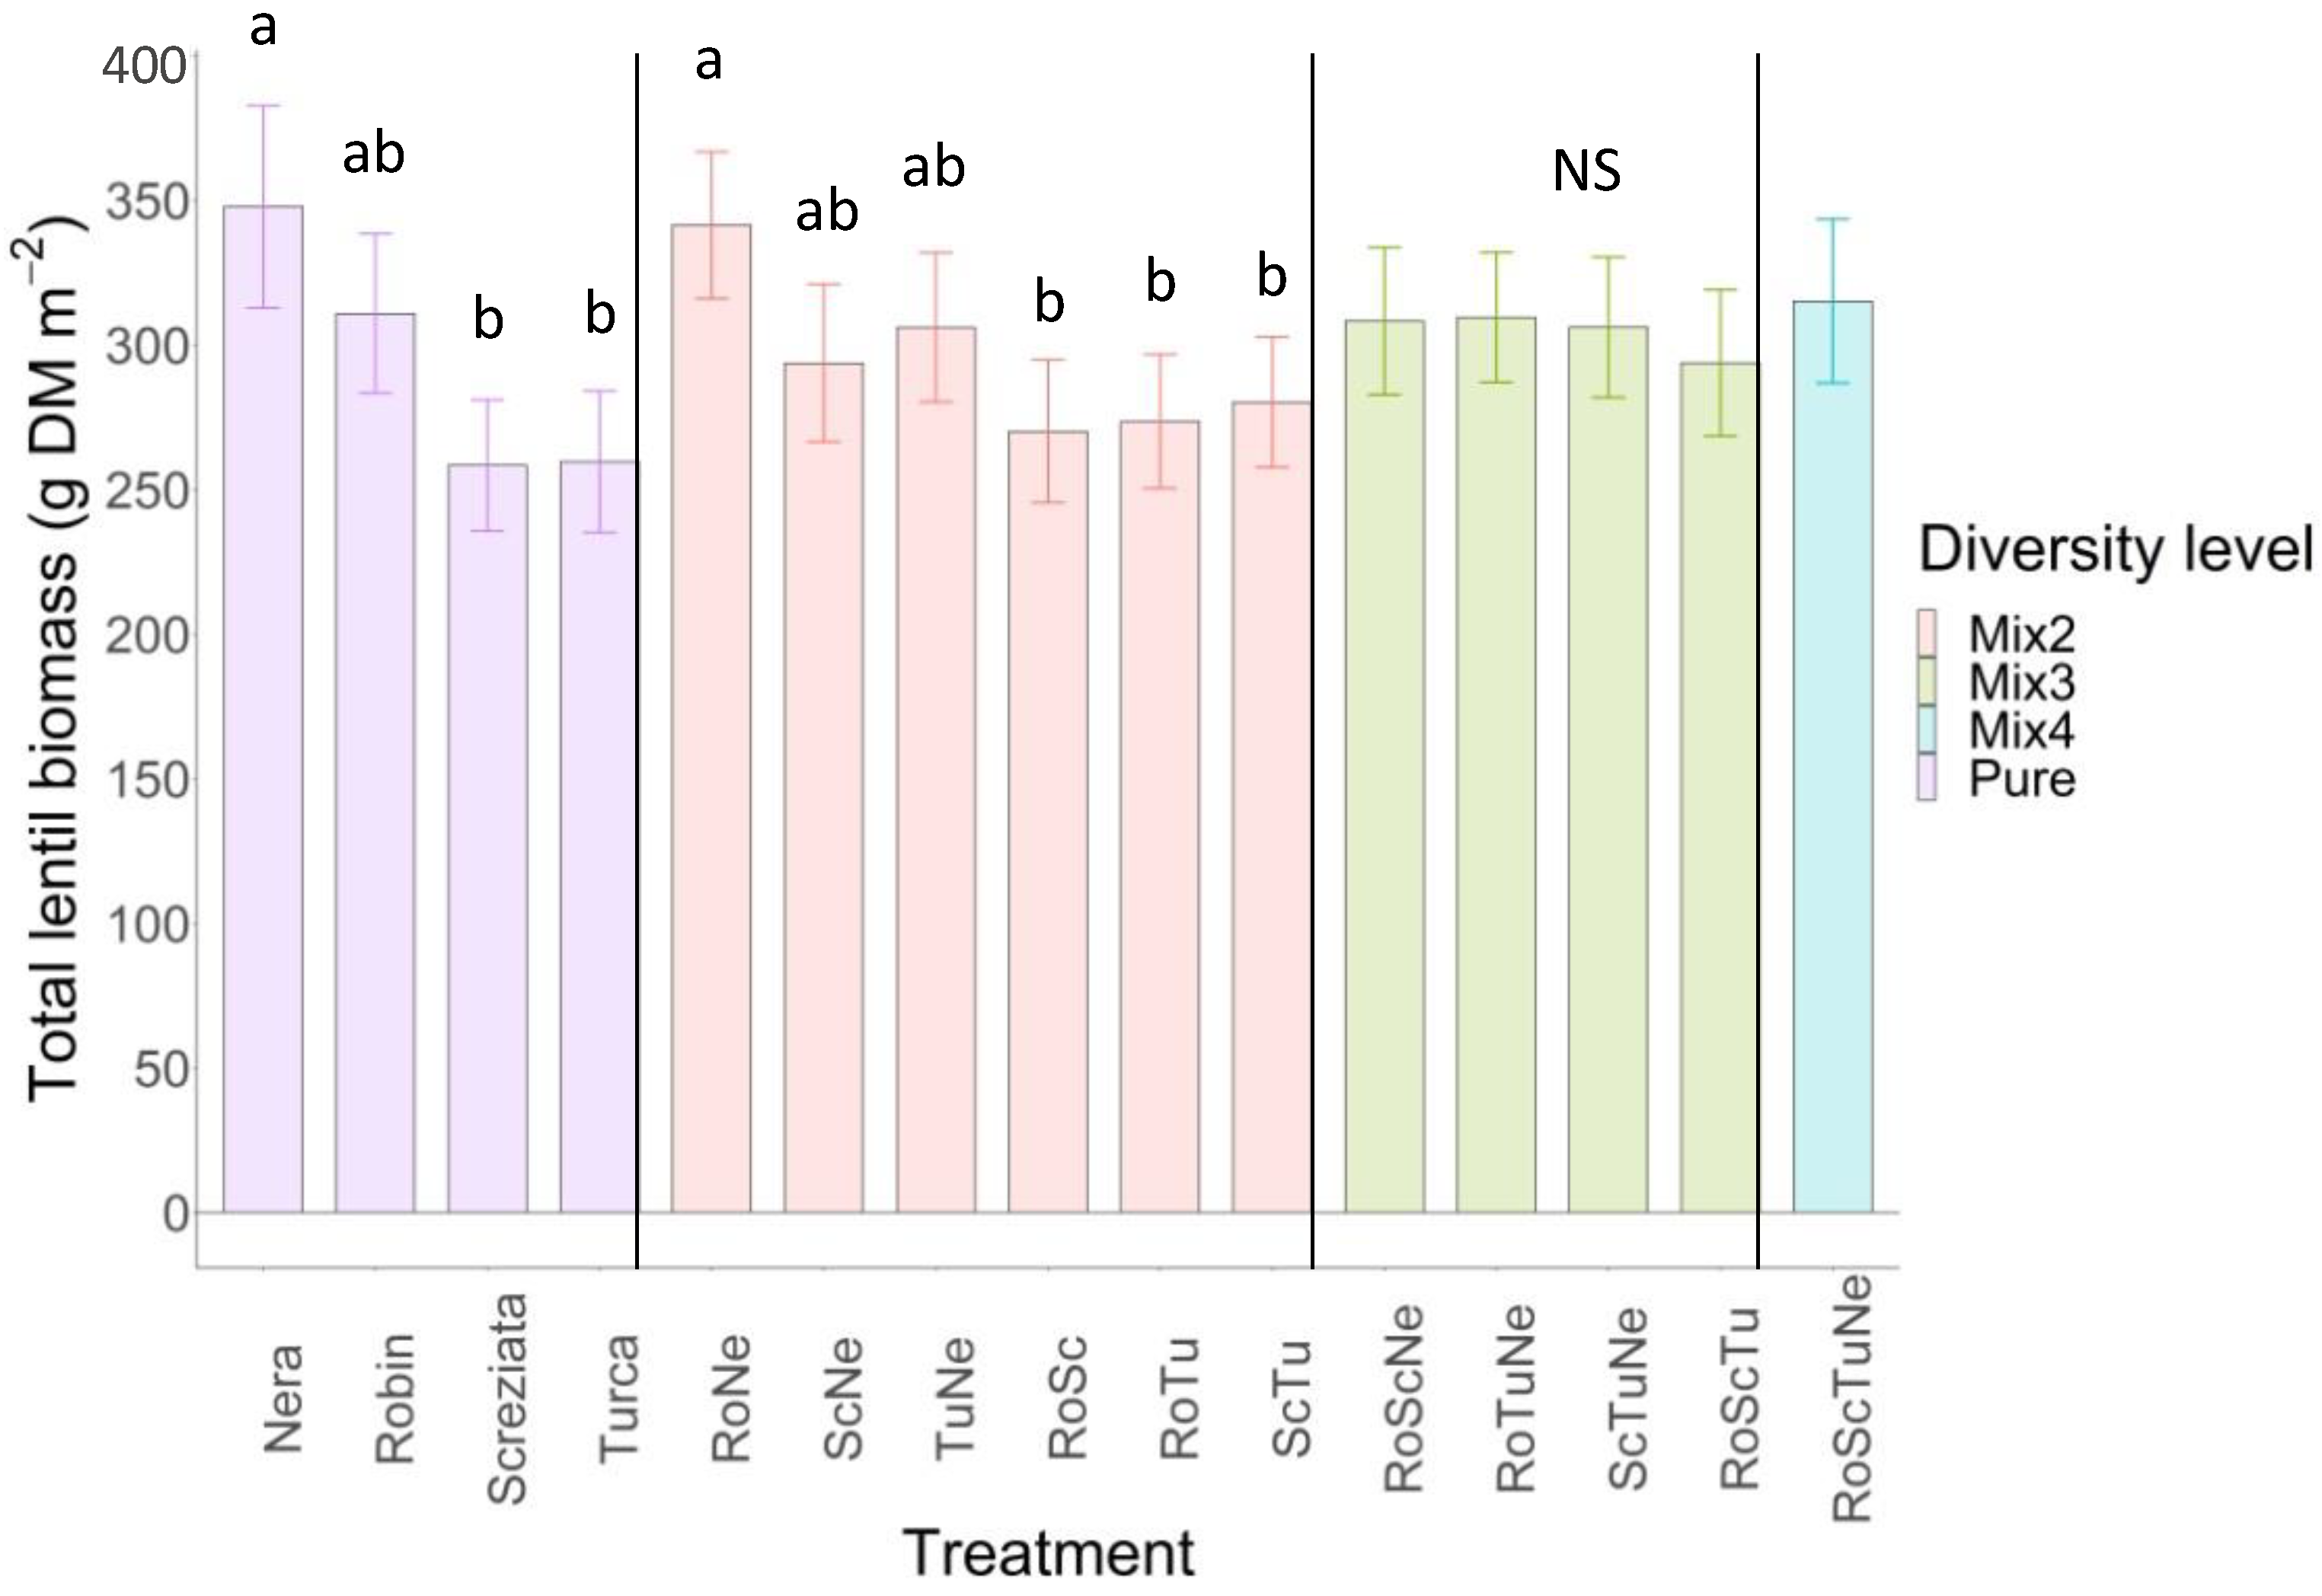
3.2. Lentil Biomass
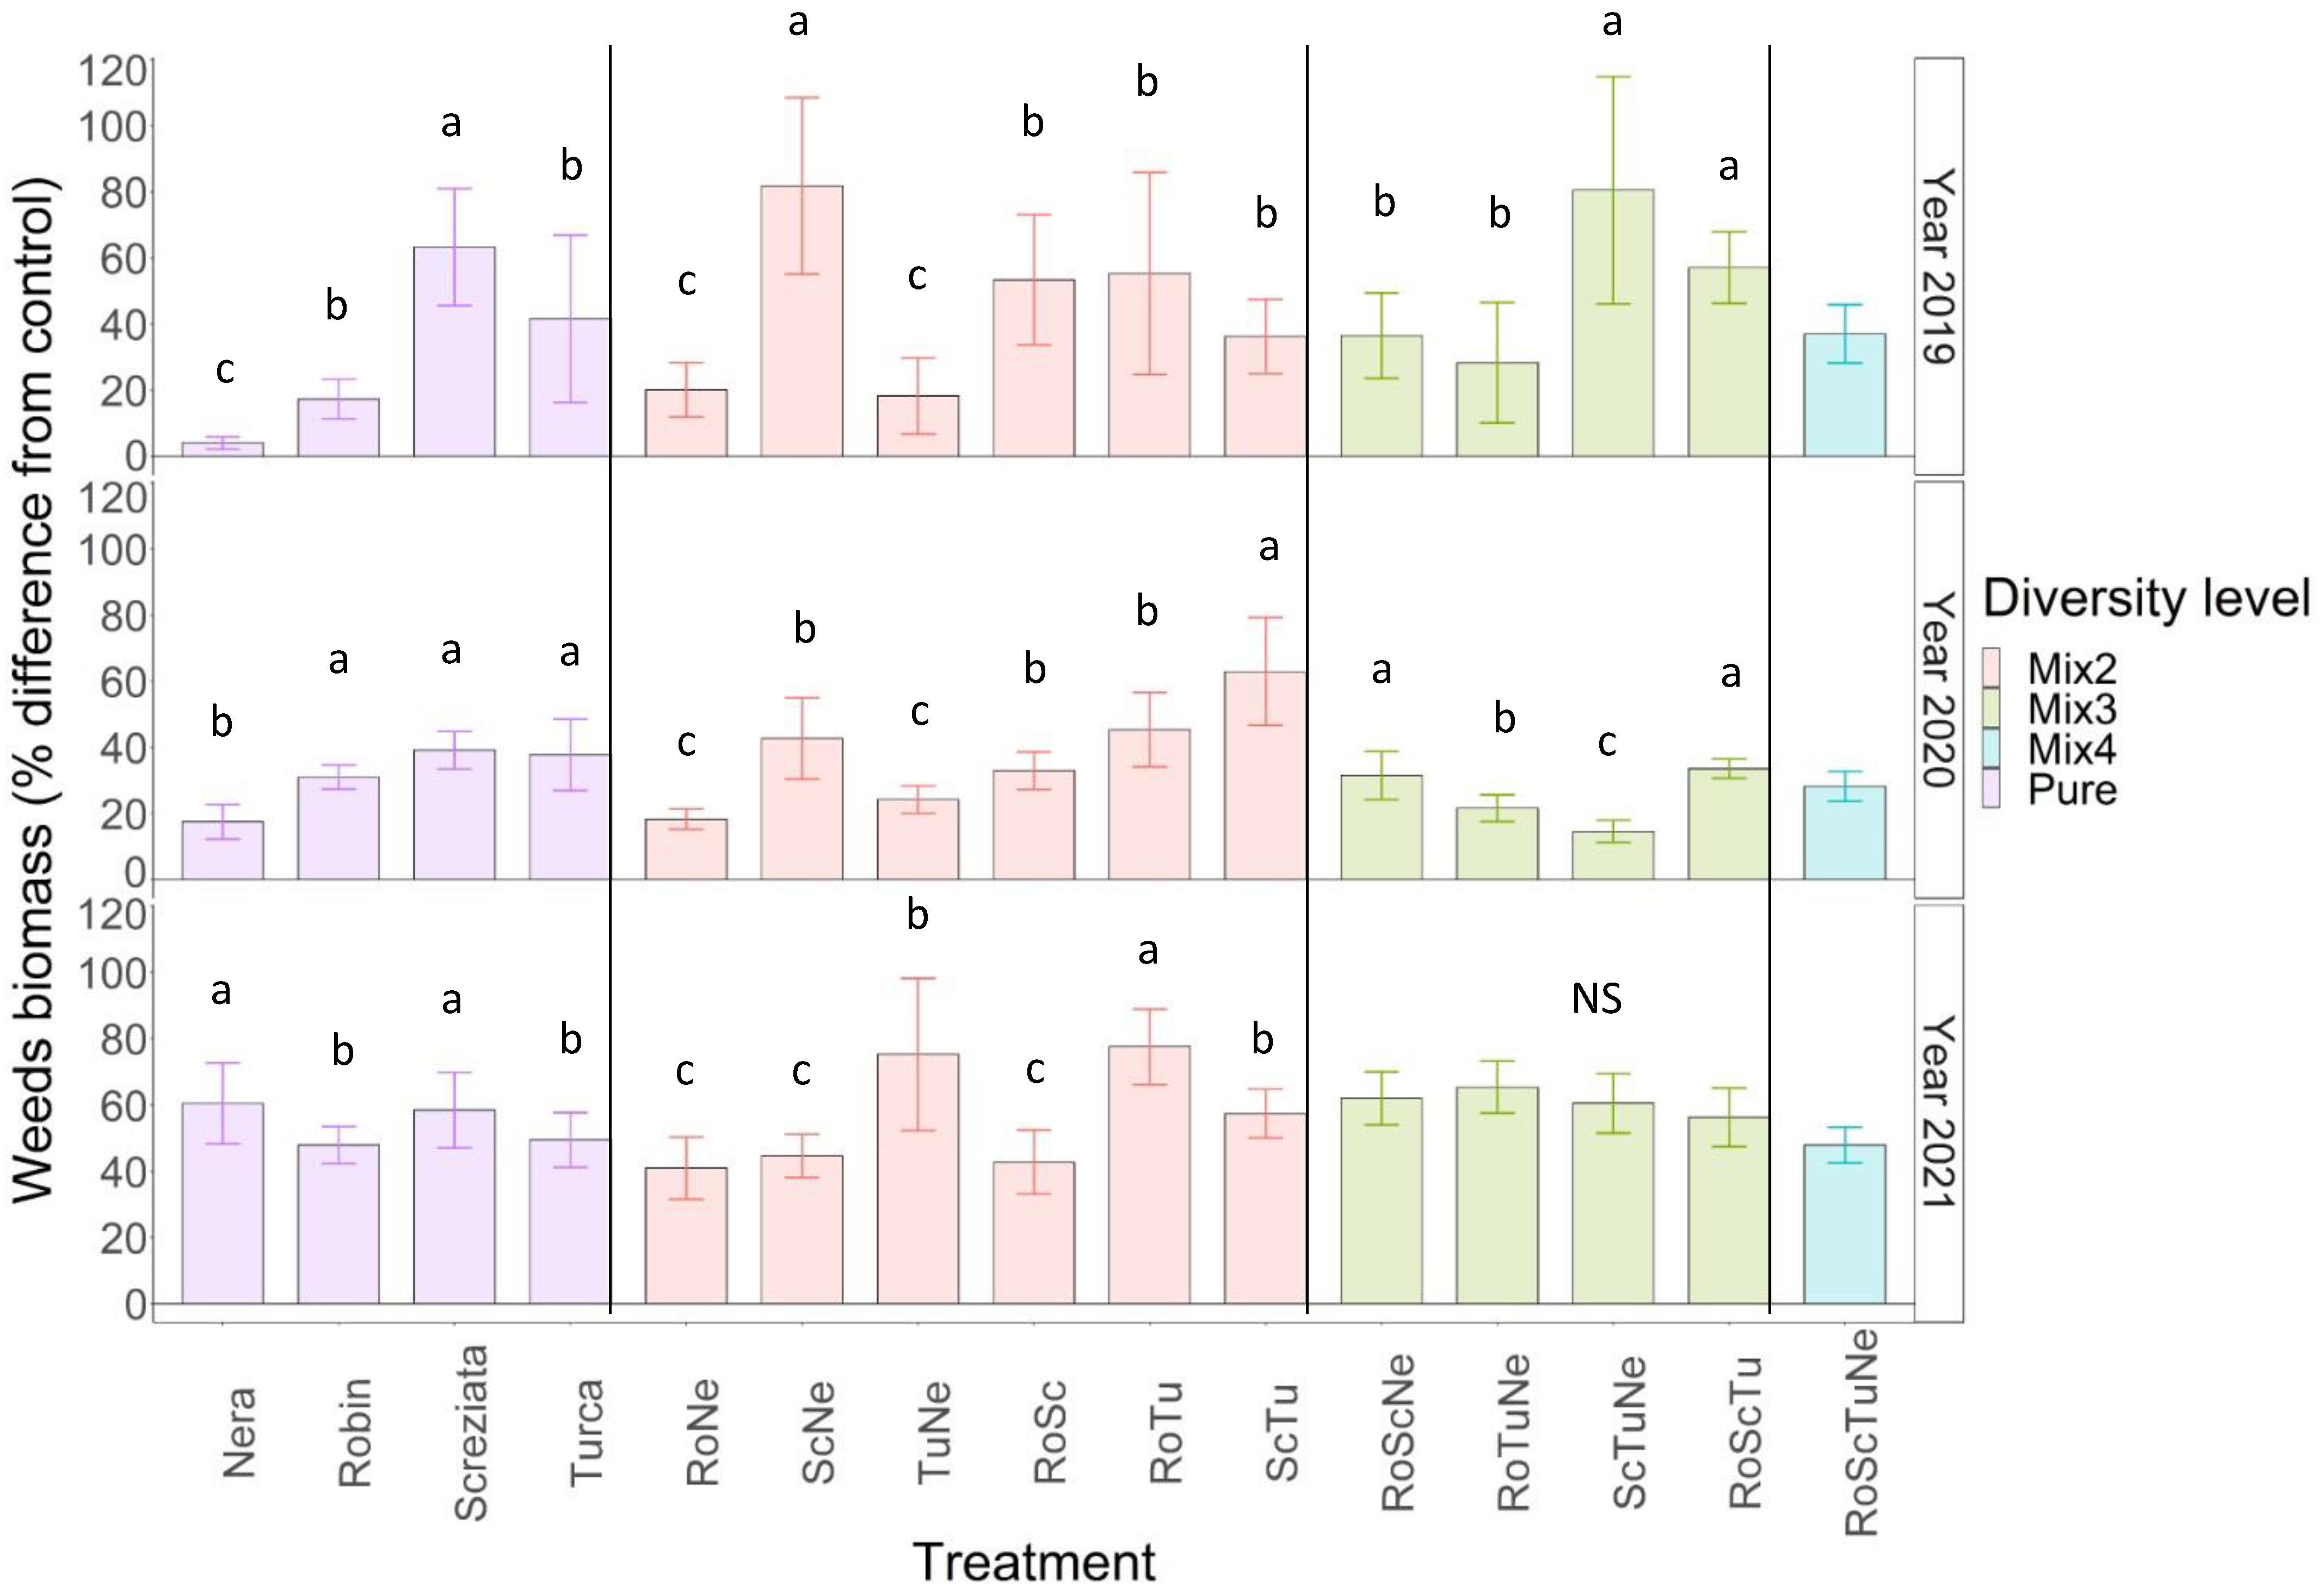
3.3. Weed Biomass
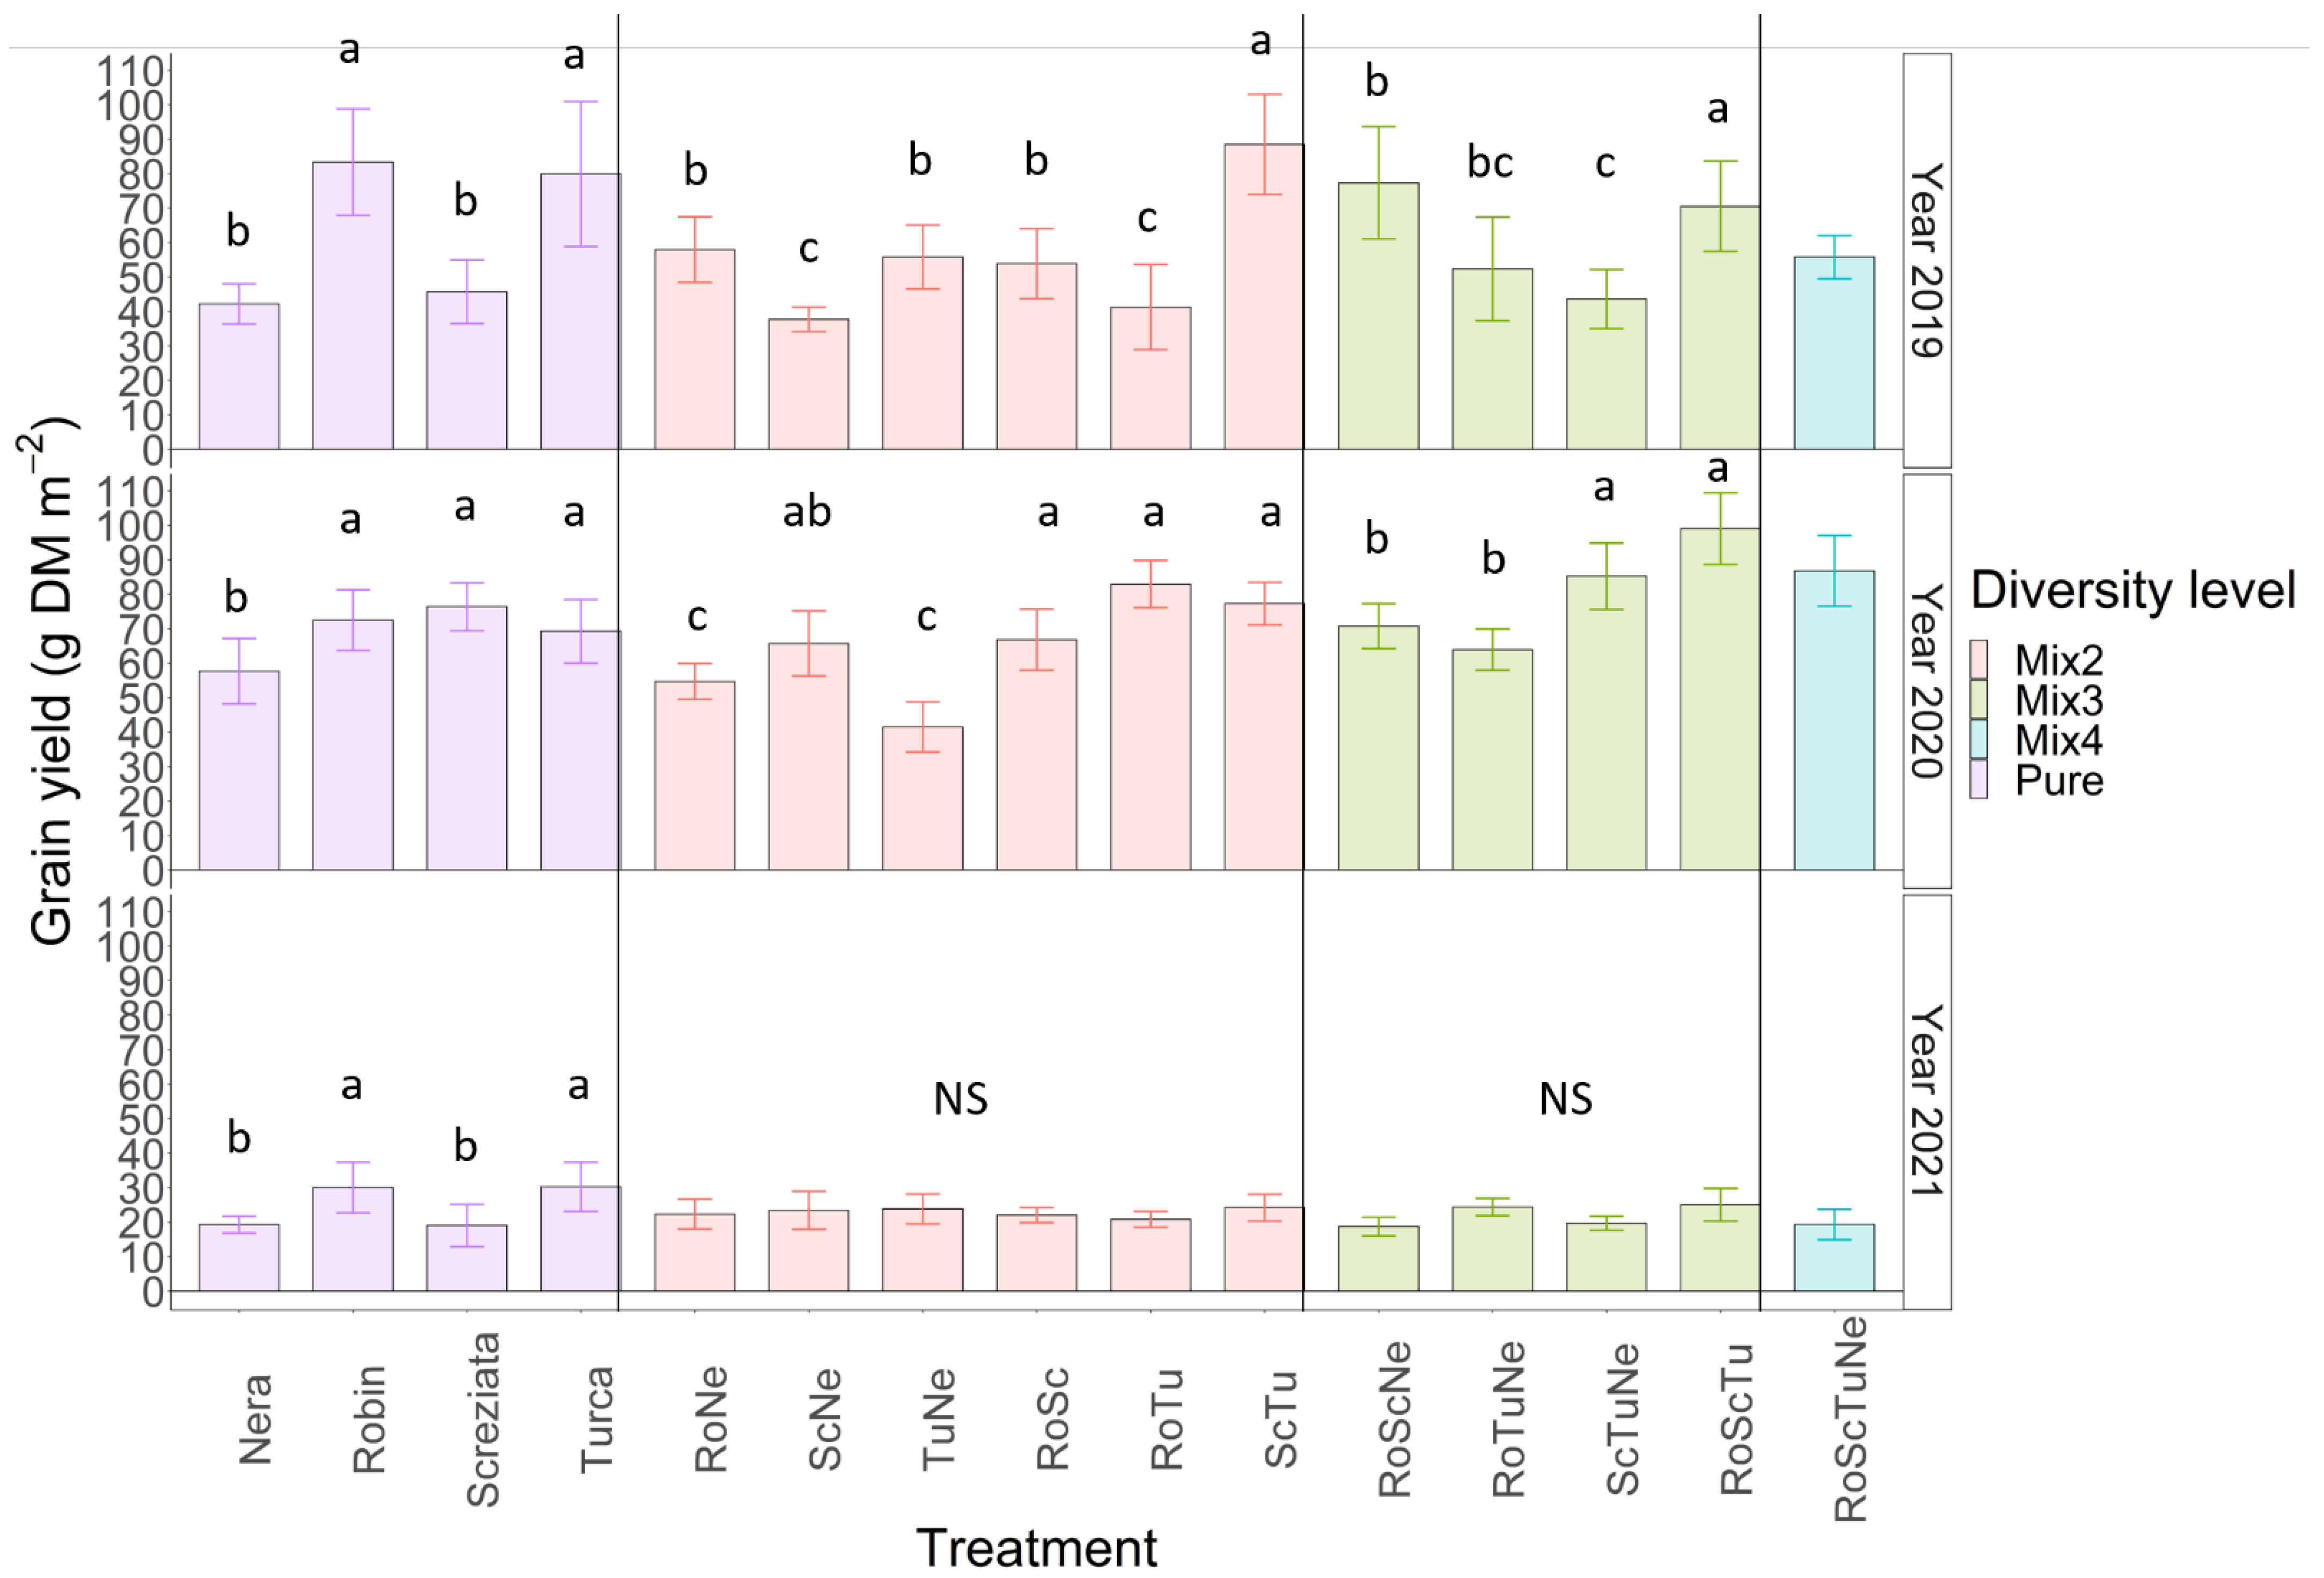
3.4. Grain Yield
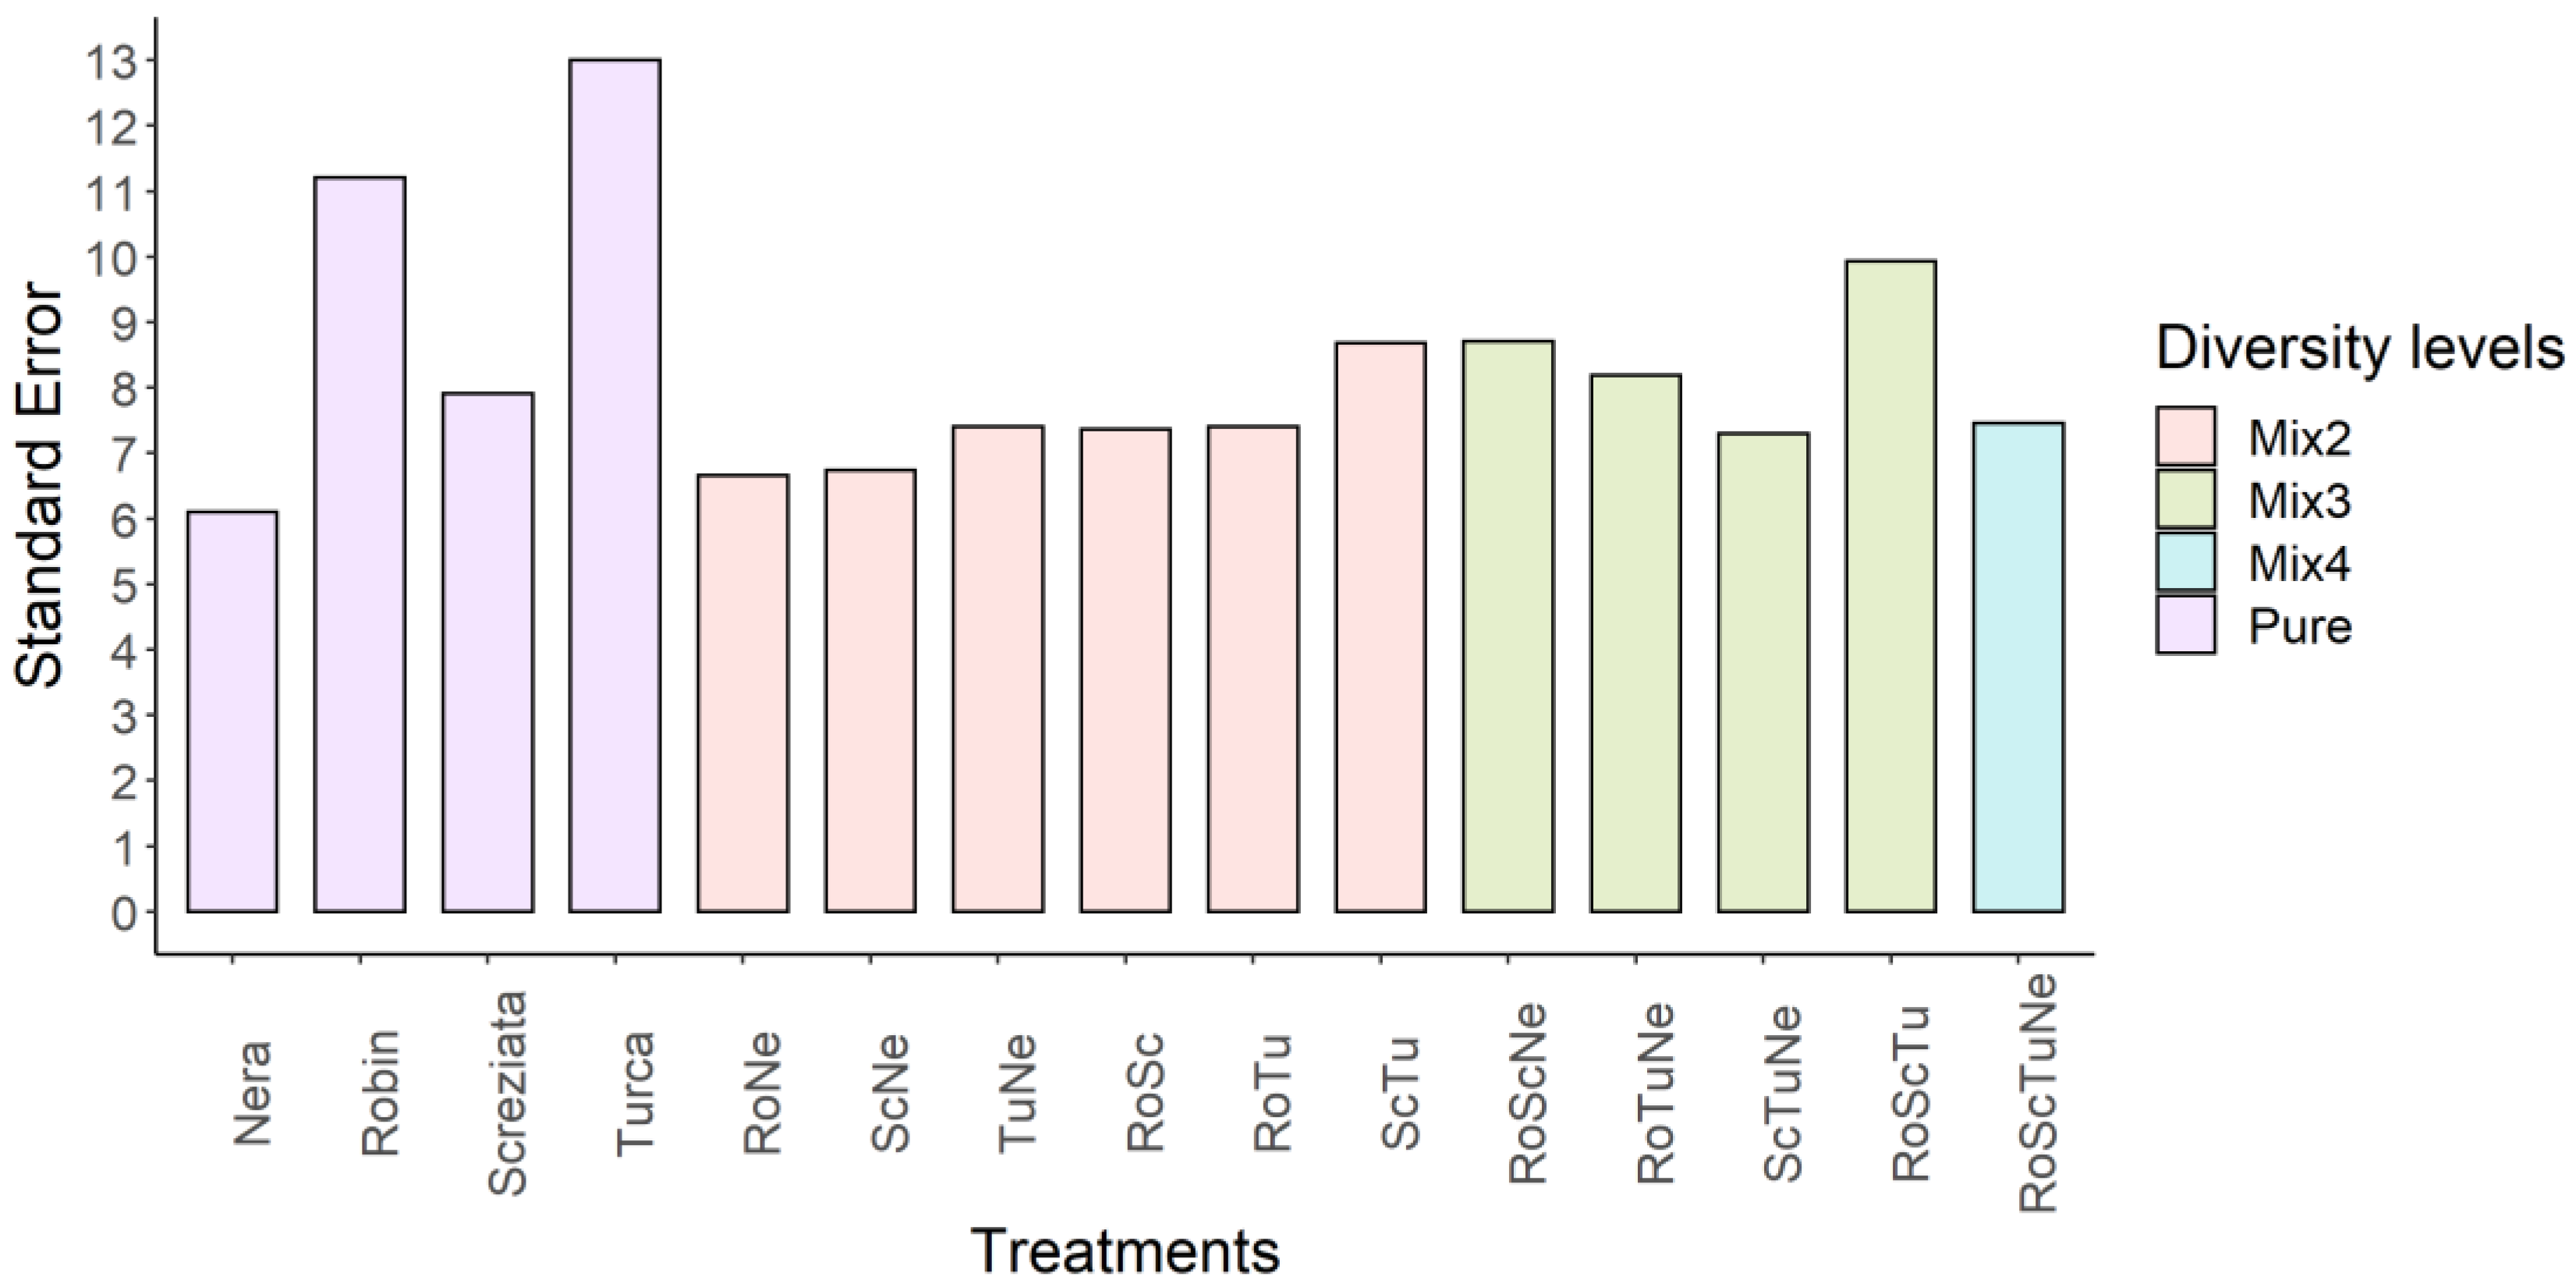
3.5. Yield Variability
4. Discussion
4.1. Nodules
4.2. Weeds and Lentil Biomass
4.3. Grain Yield and Variability
5. Conclusions
Author Contributions
Funding
Institutional Review Board Statement
Informed Consent Statement
Data Availability Statement
Acknowledgments
Conflicts of Interest
Appendix A

References
- Bommarco, R.; Kleijn, D.; Potts, S.G. Ecological intensification: Harnessing ecosystem services for food security. Trends Ecol. Evol. 2013, 28, 230–238. [Google Scholar] [CrossRef] [PubMed]
- Bàrberi, P.; Moonen, A.C. Functional biodiversity for the provision of agroecosystem services. In Reconciling Agricultural Production with Biodiversity Conservation, 1st ed.; Bàrberi, P., Moonen, A.C., Eds.; Burleigh Dodds Science Publishing: London, UK, 2020; pp. 101–146. [Google Scholar]
- Altieri, M.A. Agroecology: The Science of Sustainable Agriculture, 2nd ed.; CRC Press: Boca Raton, FL, USA, 2018; ISBN 0-429-96401-3. [Google Scholar]
- Gliessman, S.R. Agroecology: Researching the Ecological Basis for Sustainable Agriculture. In Agroecology. Ecological Studies; Gliessman, S.R., Ed.; Springer: New York, NY, USA, 1990; Volume 78. [Google Scholar] [CrossRef]
- Tamburini, G.; Bommarco, R.; Wanger, T.C.; Kremen, C.; van der Heijden, M.G.A.; Liebman, M.; Hallin, S. Agricultural diversification promotes multiple ecosystem services without compromising yield. Sci. Adv. 2020, 6, eaba1715. [Google Scholar] [CrossRef] [PubMed]
- Wuest, S.E.; Peter, R.; Niklaus, P.A. Ecological and evolutionary approaches to improving crop variety mixtures. Nat. Ecol. Evol. 2021, 5, 1068–1077. [Google Scholar] [CrossRef] [PubMed]
- Hoebe, P.; Hoad, S.; Creissen, H.; Scott, P.; Dawson, I.; Watson, C. Overview SRUC related research on breeding for diversity. In Proceedings of the Symposium on Breeding for Diversification, University of Kassel, Witzenhausen, Germany, 19–21 February 2018. [Google Scholar]
- Finckh, M.R.; Mundt, C.C. Stripe rust, yield, and plant competition in wheat cultivar mixtures. Phytopathology 1992, 82, 905–913. [Google Scholar] [CrossRef]
- Wolfe, M.S. The current status and prospects of multiline cultivars and cultivar mixtures for disease resistance. Annu. Rev. Phytopathol. 1985, 23, 251–273. [Google Scholar] [CrossRef]
- Kiær, L.P.; Skovgaard, I.M.; Østergård, H. Effects of inter-varietal diversity, biotic stresses and environmental productivity on grain yield of spring barley cultivar mixtures. Euphytica 2012, 185, 123–138. [Google Scholar] [CrossRef]
- Barot, S.; Allard, V.; Cantarel, A.; Enjalbert, J.; Gauffreteau, A.; Goldringer, I.; Lata, J.-C.; LE Roux, X.; Niboyet, A.; Porcher, E. Designing mixtures of varieties for multifunctional agriculture with the help of ecology. A review. Agron. Sustain. Dev. 2017, 37, 13. [Google Scholar] [CrossRef]
- Garibaldi, L.A.; Andersson, G.K.; Requier, F.; Fijen, T.P.; Hipólito, J.; Kleijn, D.; Pérez-Méndez, N.; Rollin, O. Complementarity and synergisms among ecosystem services supporting crop yield. Glob. Food Secur. 2018, 17, 38–47. [Google Scholar] [CrossRef]
- Zhang, W.; Liu, G.; Sun, J.; Fornara, D.; Zhang, L.; Zhang, F.; Li, L. Temporal dynamics of nutrient uptake by neighbouring plant species: Evidence from intercropping. Funct. Ecol. 2016, 31, 469–479. [Google Scholar] [CrossRef]
- Kristoffersen, R.; Jørgensen, L.N.; Eriksen, L.B.; Nielsen, G.C.; Kiær, L.P. Control of Septoria tritici blotch by winter wheat cultivar mixtures: Meta-analysis of 19 years of cultivar trials. Field Crop. Res. 2020, 249, 107696. [Google Scholar] [CrossRef]
- Van Der Plas, F.; Schröder-Georgi, T.; Weigelt, A.; Barry, K.; Meyer, S.; Alzate, A.; Barnard, R.L.; Buchmann, N.; De Kroon, H.; Ebeling, A.; et al. Plant traits alone are poor predictors of ecosystem properties and long-term ecosystem functioning. Nat. Ecol. Evol. 2020, 4, 1602–1611. [Google Scholar] [CrossRef] [PubMed]
- Murphy, D.J. People, Plants & Genes: The Story of Crops and Humanity; Oxford University Press on Demand: Oxford, UK, 2007. [Google Scholar]
- Laghetti, G.; Piergiovanni, A.R.; Sonnante, G.; Lioi, L.; Pignone, D. The Italian lentil genetic resources: A worthy basic tool for breeders. Eur. J. Plant. Sci. Biotechnol. 2008, 2, 48–59. [Google Scholar]
- Crepaldi, G. Il 98% Delle Lenticchie e il 95% dei Fagioli Secchi è Importato. 2018. Available online: https://ilfattoalimentare.it/legumi-secchi-importazione.html (accessed on 14 July 2022).
- Watson, C.A.; Reckling, M.; Preissel, S.; Bachinger, J.; Bergkvist, G.; Kuhlman, T.; Lindström, K.; Nemecek, T.; Topp, C.F.; Vanhatalo, A.; et al. Grain Legume Production and Use in European Agricultural Systems. Adv. Agron. 2017, 144, 235–303. [Google Scholar]
- Ballén-Taborda, C.; Samoluck, S.S.; Podio, M. Special Issue “Advances in Research for Legume Breeding and Genetics”. 2020. Available online: https://www.mdpi.com/journal/plants/special_issues/legume_breed (accessed on 14 July 2022).
- Haghshenas, A.; Emam, Y.; Sepaskhah, A.R.; Edalat, M. Can extended phenology in wheat cultivar mixtures mitigate post-anthesis water stress? Eur. J. Agron. 2021, 122, 126188. [Google Scholar] [CrossRef]
- Grettenberger, I.M.; Tooker, J.F. Cultivar mixtures of soybeans have inconsistent effects on herbivore and natural-enemy populations. Agric. Ecosyst. Environ. 2020, 292, 106835. [Google Scholar] [CrossRef]
- Dobert, R.C.; Blevins, D.G. Effect of seed size and plant growth on nodulation and nodule development in lima bean (Phaseolus lunatus L.). Plant Soil 1993, 148, 11–19. [Google Scholar] [CrossRef]
- Davis, T.M. Linkage relationships of genes for leaf morphology, flower color, and root nodulation in chickpea. Euphytica 1991, 54, 117–123. [Google Scholar] [CrossRef]
- R Core Team. R. The R Project for Statistical Computing. Available online: https://www.R-project.org/ (accessed on 14 July 2022).
- Burton, J.W.; Brim, C.A.; Rawlings, J.O. Performance of Non-Nodulating and Nodulating Soybean Isolines in Mixed Culture with Nodulating Cultivars. Crop Sci. 1983, 23, 469–473. [Google Scholar] [CrossRef]
- Payakapong, W.; Tittabutr, P.; Teaumroong, N.; Boonkerd, N. Soybean cultivars affect nodulation competition of Bradyrhizobium japonicum strains. World J. Microbiol. Biotechnol. 2004, 20, 311–315. [Google Scholar] [CrossRef]
- Hafeez, F.Y.; Asad, S.; Malik, K.A. The effect of high temperature on Vigna radiata nodulation and growth with different bradyrhizobial strains. Environ. Exp. Bot. 1991, 31, 285–294. [Google Scholar] [CrossRef]
- Abi-Ghanem, R.; Carpenter-Boggs, L.; Smith, J.L. Cultivar effects on nitrogen fixation in peas and lentils. Biol. Fertil. Soils 2010, 47, 115–120. [Google Scholar] [CrossRef]
- Hungria, M.; Bohrer, T.R.J. Variability of nodulation and dinitrogen fixation capacity among soybean cultivars. Biol. Fertil. Soils 2000, 31, 45–52. [Google Scholar] [CrossRef]
- Sharaf, H.; Rodrigues, R.R.; Moon, J.; Zhang, B.; Mills, K.; Williams, M.A. Unprecedented bacterial community richness in soybean nodules vary with cultivar and water status. Microbiome 2019, 7, 1–18. [Google Scholar] [CrossRef] [PubMed]
- Pereyra, G.; Hartmann, H.; Michalzik, B.; Ziegler, W.; Trumbore, S. Influence of Rhizobia Inoculation on Biomass Gain and Tissue Nitrogen Content of Leucaena leucocephala Seedlings under Drought. Forests 2015, 6, 3686–3703. [Google Scholar] [CrossRef]
- Hazra, K.K.; Nath, C.P.; Singh, S.S.; Swain, D.K.; Kumar, N.; Das, K.; Lamichaney, A. Categorization of Chickpea Nodules and Their Relation with Plant Growth. Natl. Acad. Sci. Lett. 2020, 44, 91–95. [Google Scholar] [CrossRef]
- Ludidi, N.N.; Pellny, T.K.; Kiddle, G.; Dutilleul, C.; Groten, K.; Van Heerden, P.D.R.; Dutt, S.; Powers, S.J.; Römer, P.; Foyer, C.H. Genetic variation in pea (Pisum sativum L.) demonstrates the importance of root but not shoot C/N ratios in the control of plant morphology and reveals a unique relationship between shoot length and nodulation intensity. Plant Cell Environ. 2007, 30, 1256–1268. [Google Scholar] [CrossRef]
- Singh, K.K.; Srinivasarao, C.; Ali, M. Root Growth, Nodulation, Grain Yield, and Phosphorus Use Efficiency of Lentil as Influenced by Phosphorus, Irrigation, and Inoculation. Commun. Soil Sci. Plant Anal. 2005, 36, 1919–1929. [Google Scholar] [CrossRef]
- Mwamlima, L.H.; Ouma, J.P.; Cheruiyot, E.K. Soybean (Glycine max (L) Merrill) Root Growth and Nodulation Responses to Different Soil Moisture Regimes. J. Crop Sci. Biotechnol. 2019, 22, 153–159. [Google Scholar] [CrossRef]
- Issa, S.; Wood, M. Multiplication and survival of chickpea and bean rhizobia in dry soils: The influence of strains, matric potential and soil texture. Soil Biol. Biochem. 1995, 27, 785–792. [Google Scholar] [CrossRef]
- Uaboi-Egbenni, P.; Okolie, P.; Okafor, C.; Akinyemi, O.; Bisi-Johnson, M.; Teniola, O. Effect of soil types and mixtures on nodulation of some beans and groundnut varieties. Afr. J. Food Agric. Nutr. Dev. 2010, 10, 2277. [Google Scholar] [CrossRef]
- Al-Ahmed, M.J. Competitive Interrelation and Impact of Weeds on Soil Moisture and Yield of Lentils in Dry Regions; Arab Center for the Studies of Arid Zones and Dry Lands: Damascus, Syria, 1982. [Google Scholar]
- Al Thahabi, S.A. Weed Control in Lentils. 1991. Available online: https://agris.fao.org/agris-search/search.do?recordID=JO9300053 (accessed on 14 July 2022).
- Ghosheh, H.Z.; El-Shatnawi, M.K. Broadleaf weed control in chickpeas (Cicer arietinum), faba beans (Vicia faba) and lentils (Lens culinaris). Acta Agron. Hung. 2003, 51, 437–444. [Google Scholar] [CrossRef]
- Yang, T.; Liu, K.; Poppy, L.; Mulenga, A.; Gampe, C. Minimizing Lentil Harvest Loss through Improved Agronomic Practices in Sustainable Agro-Systems. Sustainability 2021, 13, 1896. [Google Scholar] [CrossRef]
- Sehgal, A.; Sita, K.; Kumar, J.; Kumar, S.; Singh, S.; Siddique, K.H.M.; Nayyar, H. Effects of Drought, Heat and Their Interaction on the Growth, Yield and Photosynthetic Function of Lentil (Lens culinaris Medikus) Genotypes Varying in Heat and Drought Sensitivity. Front. Plant Sci. 2017, 8, 1776. [Google Scholar] [CrossRef] [PubMed]
- McDonald, B.A.; Allard, R.W.; Webster, R.K. Responses of two-, three-, and four-component barley mixtures to a variable pathogen population. Crop Sci. 1988, 28, 447–452. [Google Scholar] [CrossRef]
- Xu, X.-M.; Ridout, M.S. Stochastic simulation of the spread of race-specific and race-nonspecific aerial fungal pathogens in cultivar mixtures. Plant Pathol. 2000, 49, 207–218. [Google Scholar] [CrossRef]
- Mundt, C.C. Use of multiline cultivars and cultivar mixtures for disease management. Annu. Rev. Phytopathol. 2002, 40, 381–410. [Google Scholar] [CrossRef]
- Newton, A.; Begg, G.; Swanston, J. Deployment of diversity for enhanced crop function. Ann. Appl. Biol. 2009, 154, 309–322. [Google Scholar] [CrossRef]
- Reiss, E.R.; Drinkwater, L. Cultivar mixtures: A meta-analysis of the effect of intraspecific diversity on crop yield. Ecol. Appl. 2017, 28, 62–77. [Google Scholar] [CrossRef]
- Shrestha, R.; Turner, N.; Siddique, K.; Turner, D.W.; Speijers, J. A water deficit during pod development in lentils reduces flower and pod numbers but not seed size. Aust. J. Agric. Res. 2006, 57, 427–438. [Google Scholar] [CrossRef]
- Kaut, A.H.E.E.; Mason, H.E.; Navabi, A.; O’Donovan, J.T.; Spaner, D. Performance and stability of performance of spring wheat variety mixtures in organic and conventional management systems in western Canada. J. Agric. Sci. 2008, 147, 141–153. [Google Scholar] [CrossRef]
- Chen, H.; Nguyen, K.; Iqbal, M.; Beres, B.L.; Hucl, P.J.; Spaner, D. The performance of spring wheat cultivar mixtures under conventional and organic management in Western Canada. Agrosyst. Geosci. Environ. 2020, 3, e20003. [Google Scholar] [CrossRef] [Green Version]
- Qin, X.; Li, Y.; Shi, C.; Song, D.; Wen, X.; Liao, Y.; Siddique, K.H.M. The number of cultivars in varietal winter-wheat mixtures influence aboveground biomass and grain yield in North China. Plant Soil 2019, 439, 131–143. [Google Scholar] [CrossRef]
- Fletcher, A.; Ogden, G.; Sharma, D. Mixing it up—Wheat cultivar mixtures can increase yield and buffer the risk of flowering too early or too late. Eur. J. Agron. 2019, 103, 90–97. [Google Scholar] [CrossRef]
- Lowry, C.J.; Bosworth, S.C.; Goslee, S.C.; Kersbergen, R.J.; Pollnac, F.W.; Skinner, R.H.; Warren, N.D.; Smith, R.G. Effects of expanding functional trait diversity on productivity and stability in cultivar mixtures of perennial ryegrass. Agric. Ecosyst. Environ. 2019, 287, 106691. [Google Scholar] [CrossRef]
- Pachico, D. Towards Appraising the Impact of Legume Research: A Synthesis of Evidence. Rome, Italy, Standing Panel on Impact Assessment (SPIA), CGIAR Independent Science and Partnership Council (ISPC) 2014. Available online: https://cas.cgiar.org/sites/default/files/pdf/Legumes_Pachico-2014.pdf (accessed on 26 August 2022).


| Baseline: Pure Stand | First Level: 2 Cultivar Mixture | Second Level: 3 Cultivar Mixture | Third Level: 4 Cultivar Mixture |
|---|---|---|---|
| Robin | Robin + Screziata | Robin + Screziata + Turca | Robin + Screziata + Turca + Nera |
| Screziata | Robin + Turca | Robin + Screziata + Nera | |
| Turca | Robin + Nera | Robin + Turca + Nera | |
| Nera | Screziata + Turca | Screziata + Turca + Nera | |
| Screziata + Nera | |||
| Turca + Nera |
| Year 1 | Year 2 | Year 3 | |||||||
|---|---|---|---|---|---|---|---|---|---|
| Contrast | Sensitivity Ratio | Sensitivity Ratio | Sensitivity Ratio | ||||||
| NeRo vs. ½ Ne + Ro | 2.49 | (0.45) | *** | 0.77 | (0.11) | * | 0.76 | (0.07) | * |
| NeSc vs. ½ Ne + Sc | 4.62 | (0.67) | *** | 1.56 | (0.17) | *** | 0.75 | (0.07) | ** |
| NeTu vs. ½ Ne + Tu | 2.29 | (0.42) | *** | 0.96 | (0.12) | 1.14 | (0.09) | ||
| RoSc vs. ½ Ro + Sc | 1.50 | (0.15) | *** | 0.94 | (0.10) | 0.81 | (0.07) | * | |
| RoTu vs. ½ Ro + Tu | 2.47 | (0.28) | *** | 1.34 | (0.13) | * | 1.59 | (0.12) | *** |
| ScTu vs. ½ Sc + Tu | 1.11 | (0.12) | 1.60 | (0.14) | *** | 1.07 | (0.09) | ||
| NeRoSc vs. ⅓ Ne + Ro + Sc | 2.46 | (0.32) | *** | 1.13 | (0.12) | 1.12 | (0.08) | ||
| NeRoTu vs. ⅓ Ne + Ro + Tu | 2.76 | (0.38) | *** | 0.79 | (0.10) | * | 1.25 | (0.10) | * |
| NeScTu vs. ⅓ Ne + Sc + Tu | 3.29 | (0.39) | *** | 0.46 | (0.07) | *** | 1.08 | (0.08) | |
| RoScTu vs. ⅓ Ro + Sc + Tu | 2.16 | (0.19) | *** | 0.94 | (0.09) | 1.08 | (0.08) | ||
| RoScTuNe vs. ¼ Ro + Sc + Tu + Ne | 2.28 | (0.26) | *** | 0.89 | (0.10) | 0.90 | (0.07) | ||
| Year1 | Year2 | Year3 | |||||||
|---|---|---|---|---|---|---|---|---|---|
| Contrast | Yield Ratio | Yield Ratio | Yield Ratio | ||||||
| NeRo vs. ½ Ne + Ro | 0.98 | (0.08) | 0.83 | (0.07) | * | 0.93 | (0.12) | ||
| NeSc vs. ½ Ne + Sc | 0.86 | (0.08) | 1.00 | (0.08) | 1.24 | (0.16) | |||
| NeTu vs. ½ Ne + Tu | 1.02 | (0.08) | 0.64 | (0.06) | *** | 0.99 | (0.13) | ||
| RoSc vs. ½ Ro + Sc | 0.96 | (0.08) | 0.91 | (0.07) | 0.92 | (0.12) | |||
| RoTu vs. ½ Ro + Tu | 0.54 | (0.05) | *** | 1.14 | (0.08) | * | 0.71 | (0.09) | ** |
| ScTu vs. ½ Sc + Tu | 1.56 | (0.11) | *** | 1.09 | (0.08) | 1.01 | (0.13) | ||
| NeRoSc vs. ⅓ Ne + Ro + Sc | 1.06 | (0.08) | 1.02 | (0.07) | 0.86 | (0.11) | |||
| NeRoTu vs. ⅓ Ne + Ro + Tu | 0.83 | (0.07) | * | 0.93 | (0.07) | 0.91 | (0.11) | ||
| NeScTu vs. ⅓ Ne + Sc + Tu | 0.89 | (0.08) | 1.32 | (0.08) | *** | 0.88 | (0.11) | ||
| RoScTu vs. ⅓ Ro + Sc + Tu | 1.09 | (0.08) | 1.37 | (0.08) | *** | 0.97 | (0.11) | ||
| RoScTuNe vs. ¼ Ro + Sc + Tu + Ne | 0.96 | (0.07) | 1.28 | (0.08) | *** | 0.82 | (0.10) | ||
| Contrasts | SE Means | p-Value |
|---|---|---|
| Two-cultivar mixtures vs. pure stands | 7.37–9.55 | 0.0629 (*) |
| Three-cultivar mixtures vs. pure stands | 8.53–9.55 | 0.4137 |
| Four-cultivar mixture vs. pure stands | 7.46–9.55 | 0.2928 |
| Two- vs. three-cultivar mixtures | 7.37–8.53 | 0.3133 |
| Any mixtures vs. pure stands | 7.78–9.55 | 0.0964 (*) |
Publisher’s Note: MDPI stays neutral with regard to jurisdictional claims in published maps and institutional affiliations. |
© 2022 by the authors. Licensee MDPI, Basel, Switzerland. This article is an open access article distributed under the terms and conditions of the Creative Commons Attribution (CC BY) license (https://creativecommons.org/licenses/by/4.0/).
Share and Cite
Lorenzetti, E.; Carlesi, S.; Bàrberi, P. Mixtures of Commercial Lentil Cultivars Show Inconsistent Results on Agronomic Parameters but Positive Effects on Yield Stability. Agronomy 2022, 12, 2107. https://doi.org/10.3390/agronomy12092107
Lorenzetti E, Carlesi S, Bàrberi P. Mixtures of Commercial Lentil Cultivars Show Inconsistent Results on Agronomic Parameters but Positive Effects on Yield Stability. Agronomy. 2022; 12(9):2107. https://doi.org/10.3390/agronomy12092107
Chicago/Turabian StyleLorenzetti, Elisa, Stefano Carlesi, and Paolo Bàrberi. 2022. "Mixtures of Commercial Lentil Cultivars Show Inconsistent Results on Agronomic Parameters but Positive Effects on Yield Stability" Agronomy 12, no. 9: 2107. https://doi.org/10.3390/agronomy12092107