Article

Nitrogen Fertilizer and Sowing Density Affect Flag Leaf Photosynthetic Characteristics, Grain Yield, and Yield Components of Oat in a Semiarid Region of Northwest China

1
Key Laboratory of Superior Forage Germplasm in the Qinghai-Tibetan Plateau, Qinghai Academy of Animal Husbandry and Veterinary Sciences, Qinghai University, Xining 810016, China
2
Prataculture College, Gansu Agricultural University, Lanzhou 730070, China
*
Author to whom correspondence should be addressed.
These authors contributed equally to this work.
Agronomy 2022, 12(9), 2108; https://doi.org/10.3390/agronomy12092108
Submission received: 18 August 2022 / Revised: 30 August 2022 / Accepted: 2 September 2022 / Published: 4 September 2022
(This article belongs to the Topic Plants Nutrients)

Abstract

:
Oat has been gaining renewed interest due to its role in a healthy human diet, in animal feed, and as a source of high value compounds with industrial applications. Nitrogen fertilization and planting density are two of the most important crop management practices that affect the formation of yield components and final yield of oat. A 2 year 3 × 5 factorial field experiment was conducted to investigate the effects of nitrogen (N) fertilizer and planting density on the flag leaf photosynthetic characteristics, grain yield, and yield components under rainfed conditions. The experiment consisted of three sowing densities (60, 180, and 300 kg·ha−1) and five nitrogen fertilizer rates (0, 45, 90, 135, and 180 kg·ha−1). Results showed that the grain yield was significantly (p < 0.05) correlated with the leaf net photosynthesis rate (Pn), stomatal conductance (Gs), intercellular CO2 concentration (Ci), transpiration rate (Tr), water-use efficiency (WUE), stomatal limitation value (Ls), chlorophyll content (SPAD value), leaf area index (LAI), panicle length, number of spikelets per panicle (NSP), number of grains per panicle (NGP), weight of grains per panicle (WGP), and 1000-kernel weight. Among the yield components, grain yield was driven by number of spikelets per panicle (NSP) and number of grains per panicle (NGP) at low (or high) planting density with low N supply, whereas, at high N supply, 1000-kernel weight was also an important factor for yield. Nitrogen fertilizer and sowing density had significant (p < 0.05) effects on the flag leaf photosynthetic characteristics, grain yield, and yield components of oat. The yield components increased and then decreased with the increase in nitrogen fertilizer, while they decreased with the increase in planting density. The maximum values (p < 0.05) of grain yield were observed in the nitrogen fertilization of 90 kg·ha−1 and sowing density of 180 kg·ha−1 treatment in both growing seasons, mainly contributing to the improved leaf photosynthesis traits (Pn, Gs, Tr, Ls, SPAD, and LAI). The combination of nitrogen fertilization of 90 kg·ha−1 and sowing density of 180 kg·ha−1 is suitable for oat production on a cool semiarid plateau or other agroecozones with similar environmental conditions.

1. Introduction

Oat (Avena sativa) is distributed in more than 40 countries around the world, mainly concentrated in the northern regions of 40° N latitude including Asia, Europe, and North America, with a total output of more than 430 million tons [1]. In China, oat is extensively planted in northern and western regions. Traditionally the primary regions of cultivation include Inner Mongolia, Ganshu, Hebei, Shanxi, and Qinghai provinces, which account for 85% of the total oat production area [2]. Oat is a low-input cereal used for human food consumption, as well as for animal feed and as a source of high value compounds with industrial applications [3]. In recent decades, discussion on oat grain dietetic value and suitability for the production of functional food has increased in the public and scientific literature [4,5]. With increased attention on consuming healthy grains and a growing understanding of oat, the planting area and range of oat in China are gradually expanding, especially in Qinghai province.
Qinghai is located in the west of China with a plateau continental climate and is one of the important provinces on the Qinghai–Tibet Plateau. Oat, a gramineous herbaceous plant, is suitable for growing in cold areas with long days of sunshine, short frost-free periods, and low temperatures. There is, however, a lack of knowledge about sustainable production strategies suitable for local production conditions.
The use of nitrogen fertilizer is a major factor in the profitable production of most crops in temperate environments, because it affects dry matter production by influencing leaf area development and maintenance, as well as photosynthetic efficiency [6,7]. Amounts of fertilizer nitrogen applied to most cereals have increased in recent decades, and progress has been made in improving the prediction of optimum nitrogen requirement [6]. However, the benefits of nitrogen fertilizer for oat are less clear-cut than for other cereal species. The relatively taller stature of oat compared to other cereals makes it susceptible to lodging. The sensitivity of oat cultivars to lodging is an important factor which limits the application and effectiveness of nitrogen fertilization in maximizing grain yield [1]. Nitrogen fertilizer can affect both vegetative and reproductive development of crops, while nitrogen deficiency delays both vegetative and reproductive phonological development, as well as reduces leaf emergence rate, yield, and yield components [7]. Peltonen-Sainio and Järvinen [8] found that additional nitrogen applied before anthesis increased floret set and survival and resulted in more grains per panicle compared with lower nitrogen treatments. Moreover, a closely positive correlation was found between the photosynthetic capacity of leaves and nitrogen fertilizer; the net photosynthesis rate (Pn), stomatal conductance (Gs), transpiration rate (Tr), stomatal limitation value (Ls), chlorophyll content (SPAD value), and leaf area index (LAI) increased and then decreased with the increase in nitrogen fertilizer [7]. The flag leaf stays longest on the plant and makes a major contribution to the grain yield in cereals [9]. Under favorable conditions, approximately 70–90% of the total grain yield is derived from the photosynthates accumulated during grain filling [10].
Planting density is an important crop management that affects the grain yield by regulating growth, photosynthesis, and yield components, which are the target traits closely related to crops [11]. Increases in plant density for crop production generally have a large positive impact on the canopy LAI and, as a consequence, on biomass and dry matter accumulation [12,13]. However, excess LAI often causes leaf shading and lower leaf nutrient concentration, reducing canopy photosynthesis [14], accelerating leaf senescence, and reducing grain yield [15], which means that high planting density results in strong competition. In potato and maize, the light-saturated rate of leaf photosynthesis can be described as a logistic function of the nitrogen concentration per unit leaf area [14]. An understanding of how yield accumulation is influenced by plant density and nitrogen application is necessary to guide farmers’ practice toward achieving high grain yield of oat.
Most previous studies with nitrogen fertilizer and planting density have focused on the N uptake, grain yield, yield components, grain quality, forage yield, and quality of soil for intercropped oat and various legumes [6,9,16,17,18,19,20,21]. However, the influence of nitrogen fertilizer and planting density on the flag leaf physiological characteristics of oat has not been fully studied. We hypothesized that climate plays a decisive role in the grain yield of oat in semiarid environments, while nitrogen fertilizer and planting density have an important regulating effect on the grain yield of oat. Thus, the objectives of the present study were to assess the influence of nitrogen fertilizer and planting density on the leaf photosynthetic characteristics, grain yield, and yield components of oat.

2. Materials and Methods

2.1. Study Site

A field experiment was conducted during the 2016 and 2017 growing seasons under rainfed conditions at the experimental field station of Qinghai Academy of Animal and Veterinary Science (101°37′49″ E, 36°30′14″ N, Huangzhong County, Xining City, Qinghai, China). The station is located 30 km southwest of Qinghai Academy of Animal and Veterinary Science at an elevation of 2670 m above sea level. The region is a typical semiarid area with 540 mm annual precipitation that mainly occurs during May to September. It has a temperate, semiarid, and continental climate, with an annual mean temperature of 3.7 °C and up to 2774 °C of effective accumulated temperature. The experiment was established in a chestnut soil with pH 8.32, organic matter 18.8 g·kg−1 organic matter, 1.54 g·kg−1 total N, 136 mg·kg−1 available N, 0.73 g·kg−1 total P, 35 mg·kg−1 available P, 24.9 g·kg−1 total K, and 127 mg·kg−1 available K (0 to 30 cm depth). The previous crop was common buckwheat (Fagopyrum esculentum M.), which was harvested in mid-September of 2015. The same field was used in both years. The long-term average monthly precipitation and temperature (1986–2015) from April to September and the deviations during the two growing seasons of the experimentation are given in Table 1. Monthly precipitation was higher in July 2016 than 2017, but close to the long-term norm in May and August 2017, comparable to values in 2016. Overall, the experimental year 2016 was comparatively dry.

2.2. Experimental Design and Field Management

A 3 × 5 factorial experiment was arranged in a randomized complete block design with three replications. There were three different sowing densities: 60 kg·ha−1 (D1), 180 kg·ha−1 (D2), and 300 kg·ha−1 (D3). For each sowing density, five different nitrogen fertilizer rates application were designated as 0 kg·ha−1 (N0), 45 kg·ha−1 (N1), 90 kg·ha−1 (N2), 135 kg·ha−1 (N3), and 180 kg·ha−1(N4).
Qingyan No.1 is a new variety for grain and feed production that has been bred by the Qinghai Academy of Animal and Veterinary Science through hybrid breeding technology. The variety, with high grain yield and biomass, as well as good lodging resistance, was used in this study. Seedbed preparation included moldboard ploughing, disc harrowing, and cultivation. Phosphorus, as calcium superphosphate, was applied at 45 kg·ha−1 P2O5 during land preparation. The nitrogen fertilizer at specific rates was applied to the target plots as basal fertilizer. Three seeding rates were used, with target plant densities of 150, 450, and 750 plants··m−2. In this study, the intermediate density (450 plants·m−2) represents the normal density commonly used in farm fields. Each plot had an area of 20 m2 (4 m × 5 m), consisted of 20 rows 5 m long, with the interrow distances of 0.25 m, while border rows were not included for any sampling. The neighboring plots were separated by a 1 m buffer zone. Similarly, the blocks were separated by a 2 m buffer zone. Sowing was conducted by hand and seeds were placed in every row at a depth of 2–3 cm. Sowing was performed on 23 April 2016 and 29 April 2017.

2.3. Leaf Photosynthetic Characteristics

At the beginning of the boot stage (2 July 2016 and 6 July 2017), five plants in each plot were selected randomly, and the flag leaf was labeled with white thread to investigate the gas exchange and chlorophyll content [22]. The gas exchange was measured using an LI-6400 photosynthesis system (Li-Cor Inc., Lincoln, NE, United States of America) between 9:00 and 11:00 a.m. Light intensity, temperature, CO2 concentration, flow rate, and relative humidity were maintained at 1200 μmol·m−2·s−1, 25 °C, 400 ± 5.0 μmol·mol−1, 0.5 L·min−1, and 30% ± 1.0% respectively. The Pn, Gs, Tr, ambient CO2 concentration (Ca), and intercellular CO2 concentration (Ci) were automatically recorded. Water use efficiency (WUE) was calculated as Pn/Tr [23]. Ls was calculated as 1 − Ci/Ca [7]. At the same time, five labeled leaves in each plot were chosen to measure the chlorophyll content (with a SPAD-502 Plus chlorophyll meter, Konica Minolta, Japan), according to the method of Abdelhamidg et al. (2003). For each leaf, measurements of SPAD values were made on five points from the leaf bottom to the tip and averaged. The total leaf area of each labeled plant was measured with a YMJ-A leaf area meter (Zhejiang Top Yunnong Technology Co., Ltd., Hangzhou, China). At that time, the number of plants from a randomly selected 1 m2 area of each plot was counted for the calculation of LAI. The LAI was calculated as the total leaf area of one plant (m2·plant−1) × plant density (plants·m−2) [24].

2.4. Yield and Yield Components Measurement

Grain yield at harvest was evaluated. Whole plot plants were hand-harvested on 25 August 2016 and 5 September 2017. Twenty plants in each plot were selected randomly to investigate the plant height, panicle length, number of spikelets per panicle (NSP), number of grains per panicle (NGP), and weight of grains per panicle (WGP) at harvest [25]. The plant height refers to the distance from the stem base to the top of spikes. The 1000-kernel weight was determined by measuring the weight of 200 kernels from each plot and multiplying by 5. Grain yield was determined by harvesting plants from 1 m2 area in each plot. For grain yield and 1000-grain weight, seeds were air-dried for 2 weeks before measurement.

2.5. Data Analyses

The mean grain yield data from each treatment were plotted against leaf photosynthetic characteristics and yield components. Nitrogen fertilizer rates and planting densities were plotted against leaf photosynthetic characteristics, grain yield, and yield components. Linear (y = a + bx), quadratic (y = a + bx − cx2), hyperbolic (x2a−2 − y2b−2 = 1 or y2a−2 − x2b−2 = 1), and logarithmic (y = logax) equations were tested for their suitability to describe the relationship for grain yield response with leaf photosynthetic characteristics and yield components, as well as for nitrogen fertilizer rates and planting densities with leaf photosynthetic characteristics, grain yield, and yield components. The equation with the highest coefficient of determination (R2) value was judged to be the most appropriate. In these regression equations, grain yield, nitrogen fertilizer rates, or planting densities was the independent variable (x), leaf photosynthetic characteristics and yield components or leaf photosynthetic characteristics, grain yield, and yield components were the dependent variable (y). The R2 comparisons among the models tested showed that the quadratic regression equations (y = a + bx − cx2) had the best fit for grain yield of oat over flag leaf photosynthetic characteristics and yield components, as well as nitrogen fertilizer or planting density over flag leaf photosynthetic characteristics, grain yield, and yield components. SPSS 17.0 programs (SPSS Institute Inc., Chicago, IL, USA) were used to conduct the analyses of variance (ANOVA) and the regression analysis. Treatment mean differences were separated by the least significant difference (LSD) test at the 0.05 probability level.

3. Results

3.1. Flag Leaf Photosynthetic Characteristics

3.1.1. Flag Leaf Gas Exchange

The Pn was significantly (p < 0.01) affected by nitrogen fertilizer, planting density, and their interaction during the two growing seasons (Table 2). The Pn increased from 10.32 to 14.11 μmol·m−2·s−1 (mean of two growing seasons and three sowing densities) as the nitrogen fertilizer rate increased from 0 to 90 kg·ha−1, and then decreased to 10.77 μmol·m−2·s−1 (mean of two growing seasons and three sowing densities) with further increasing N up to 180 kg·ha−1. Increasing the sowing density from 60 to 180 kg·ha−1 resulted in an increase in Pn from 10.80 to 13.94 μmol·m−2·s−1 (mean of two growing seasons and five nitrogen fertilizer rates), but it was decreased to 10.46 μmol·m−2·s−1 (mean of two growing seasons and five nitrogen fertilizer rates) when increasing sowing density to 300 kg·ha−1. The highest Pn occurred in the combination of 90 kg·ha−1 N and 180 kg·ha−1 sowing density (N2D2) in each growing season.
Nitrogen fertilizer, planting density, and their interaction had significant effects (p < 0.01) on the Gs during the two growing seasons (Table 2). The Gs increased from 0.24 to 0.44 mol·m−2·s−1 (mean of two growing seasons and three sowing densities) as the nitrogen fertilizer rate increased from 0 to 90 kg·ha−1, and then decreased to 0.28 mol·m−2·s−1 (mean of two growing seasons and three sowing densities) with further increasing N up to 180 kg·ha−1. Increasing the sowing density from 60 to 180 kg·ha−1 resulted in an increase in Gs from 0.25 to 0.46 mol·m−2·s−1 (mean of two growing seasons and five nitrogen fertilizer rates), but it was decreased to 0.27 mol·m−2·s−1 (mean of two growing seasons and five nitrogen fertilizer rates) when increasing sowing density to 300 kg·ha−1. The highest Gs occurred in the combination of 90 kg·ha−1 N and 180 kg·ha−1 sowing density (N2D2) in each growing season.
Nitrogen fertilizer, planting density, and their interaction had significant effects (p < 0.01) on the Ci during the two growing seasons (Table 2). Increasing the nitrogen fertilizer rate from 0 to 90 kg·ha−1 resulted in a decrease in the Ci from 343.18 to 316.77 μmol·mol−1 (mean of two growing seasons and three sowing densities), and then an increase to 344.14 μmol·mol−1 (mean of two growing seasons and three sowing densities) with further increasing N up to 180 kg·ha−1. Increasing the sowing density from 60 to 180 kg·ha−1 resulted in a decrease in Ci from 340.05 to 324.66 μmol·mol−1 (mean of two growing seasons and five nitrogen fertilizer rates), but it was increased to 339.77 μmol·mol−1 (mean of two growing seasons and five nitrogen fertilizer rates) when increasing sowing density to 300 kg·ha−1. The lowest Ci occurred in the combination of 90 kg·ha−1 N and 180 kg·ha−1 sowing density (N2D2) in each growing season.
Nitrogen fertilizer, planting density, and their interaction had significant effects (p < 0.01) on the Tr during the two growing seasons (Table 2). The Tr increased from 2.87 to 4.68 mmol·m−2·s−1 (mean of two growing seasons and three sowing densities) as the nitrogen fertilizer rate increased from 0 to 90 kg·ha−1, and then decreased to 2.88 mmol·m−2·s−1 (mean of two growing seasons and three sowing densities) with further increasing N up to 180 kg·ha−1. Increasing the sowing density from 60 to 180 kg·ha−1 resulted in an increase in Tr from 2.91 to 4.52 mmol·m−2·s−1 (mean of two growing seasons and five nitrogen fertilizer rates), but it was decreased to 2.90 mmol·m−2·s−1 (mean of two growing seasons and five nitrogen fertilizer rates) when increasing sowing density to 300 kg·ha−1. The highest Tr occurred in the combination of 90 kg·ha−1 N and 180 kg·ha−1 sowing density (N2D2) in each growing season.
The WUE was significantly (p < 0.01) affected by nitrogen fertilizer, planting density, and their interaction during the two growing seasons (Table 2). Increasing the nitrogen fertilizer rate from 0 to 90 kg·ha−1 resulted in a decrease in the WUE from 0.37% to 0.31% (mean of two growing seasons and three sowing densities), and then increased to 0.39% (mean of two growing seasons and three sowing densities) with further increasing N up to 180 kg·ha−1. Increasing the sowing density from 60 to 180 kg·ha−1 resulted in a decrease in WUE from 0.39% to 0.31% (mean of two growing seasons and five nitrogen fertilizer rates), but it was increased to 0.37% (mean of two growing seasons and five nitrogen fertilizer rates) when increasing sowing density to 300 kg·ha−1. The lowest WUE occurred in the combination of 90 kg·ha−1 N and 180 kg·ha−1 sowing density (N2D2) in each growing season.
The Ls was significantly (p < 0.01) affected by nitrogen fertilizer, planting density, and their interaction during the two growing seasons (Table 2). The Ls increased from 0.33 to 0.48 (mean of two growing seasons and three sowing densities) as the nitrogen fertilizer rate increased from 0 to 90 kg·ha−1, and then decreased to 0.36 (mean of two growing seasons and three sowing densities) with further increasing N up to 180 kg·ha−1. Increasing the sowing density from 60 to 180 kg·ha−1 resulted in an increase in Ls from 0.34 to 0.49 (mean of two growing seasons and five nitrogen fertilizer rates), but it was decreased to 0.34 (mean of two growing seasons and five nitrogen fertilizer rates) when increasing sowing density to 300 kg·ha−1. The highest Ls occurred in the combination of 90 kg·ha−1 N and 180 kg·ha−1 sowing density (N2D2) in each growing season.

3.1.2. Flag Leaf Chlorophyll Content

The flag leaf chlorophyll content (SPAD value) was significantly (p < 0.01) affected by nitrogen fertilizer, planting density, and their interaction during the two growing seasons (Table 2). The SPAD increased from 42.07 to 55.83 (mean of two growing seasons and three sowing densities) as the nitrogen fertilizer rate increased from 0 to 90 kg·ha−1, and then decreased to 42.88 (mean of two growing seasons and three sowing densities) with further increasing N up to 180 kg·ha−1. Increasing the sowing density from 60 to 180 kg·ha−1 resulted in an increase in SPAD from 40.81 to 56.15 (mean of two growing seasons and five nitrogen fertilizer rates), but it was decreased to 44.37 (mean of two growing seasons and five nitrogen fertilizer rates) when increasing sowing density to 300 kg·ha−1. The highest SPAD occurred in the combination of 90 kg·ha−1 N and 180 kg·ha−1 sowing density (N2D2) in each growing season.

3.1.3. Leaf Area Index

Nitrogen fertilizer and planting density had significant effects (p < 0.01) on the leaf area index (LAI) during the two growing seasons. Interaction between nitrogen fertilizer and planting density had a significant effect (p < 0.01) on LAI in 2016, but had no significant effect (p > 0.05) in 2017 (Table 2). The LAI increased from 2.95 to 3.89 (mean of two growing seasons and three sowing densities) as the nitrogen fertilizer rate increased from 0 to 90 kg·ha−1, and then increased to 4.84 (mean of two growing seasons and three sowing densities) with further increasing N up to 180 kg·ha−1. Increasing the sowing density from 60 to 180 kg·ha−1 resulted in an increase in LAI from 2.96 to 4.33 (mean of two growing seasons and five nitrogen fertilizer rates), but it was decreased to 4.31 (mean of two growing seasons and five nitrogen fertilizer rates) when increasing sowing density to 300 kg·ha−1. The highest LAI occurred in the combination of 180 kg·ha−1 N and 300 kg·ha−1 sowing density (N4D3) in 2016, and the combination of 180 kg·ha−1 N and 180 kg·ha−1 sowing density (N4D2) in 2017.

3.2. Grain Yield and Yield Components

3.2.1. Grain Yield

The grain yield was significantly (p < 0.01) affected by nitrogen fertilizer, planting density, and their interaction during the two growing seasons (Table 3). The grain yield increased from 2726.47 to 3405.84 kg·ha−1 (mean of two growing seasons and three sowing densities) as the nitrogen fertilizer rate increased from 0 to 90 kg·ha−1, and then decreased to 3103.73 kg·ha−1 (mean of two growing seasons and three sowing densities) with further increasing N up to 180 kg·ha−1. Increasing the sowing density from 60 to 180 kg·ha−1 resulted in an increase in grain yield from 2828.22 to 3408.63 kg·ha−1 (mean of two growing seasons and five nitrogen fertilizer rates), but it was decreased to 3081.18 kg·ha−1 (mean of two growing seasons and five nitrogen fertilizer rates) when increasing sowing density to 300 kg·ha−1. The highest grain yield occurred in the combination of 90 kg·ha−1 N and 180 kg·ha−1 sowing density (N2D2) in each growing season, and grain yield in 2016 was higher than that in 2017.

3.2.2. Yield Components

Nitrogen fertilizer and planting density had significant effects (p < 0.01) on the plant height during the two growing seasons. The interaction between nitrogen fertilizer and planting density had no significant effect (p > 0.05) in both growing seasons (Table 3). Increasing the nitrogen fertilizer rate from 0 to 135 kg·ha−1 resulted in an increase in plant height from 89.98 to 113.75 cm (mean of two growing seasons and three sowing densities), and then decreased to 104.19 cm (mean of two growing seasons and three sowing densities) with further increasing N up to 180 kg·ha−1. Increasing the sowing density from 60 to 300 kg·ha−1 resulted in a decrease in plant height from 113.66 to 90.60 cm (mean of two growing seasons and five nitrogen fertilizer rates). The highest plant height occurred in the combination of 135 kg·ha−1 N and 60 kg·ha−1 sowing density (N3D1) in each growing season.
Nitrogen fertilizer, planting density, and their interaction had significant effects (p < 0.01) on the panicle length during the two growing seasons (Table 3). Increasing the nitrogen fertilizer rate from 0 to 90 kg·ha−1 resulted in an increase in panicle length from 13.46 to 21.77 cm (mean of two growing seasons and three sowing densities), and then a decrease to 16.80 cm (mean of two growing seasons and three sowing densities) with further increasing N up to 180 kg·ha−1. Increasing the sowing density from 60 to 300 kg·ha−1 resulted in a decrease in panicle length from 19.57 to 16.72 cm (mean of two growing seasons and five nitrogen fertilizer rates). The highest panicle length occurred in the combination of 90 kg·ha−1 N and 60 kg·ha−1 sowing density (N2D1) in each growing season.
The number of spikelets per panicle (NSP) was significantly (p < 0.05 or p < 0.01) affected by nitrogen fertilizer, planting density, and their interaction during the two growing seasons (Table 3). The NSP increased from 53.57 to 65.36 (mean of two growing seasons and three sowing densities) as the nitrogen fertilizer rate increased from 0 to 90 kg·ha−1, and then decreased to 40.06 (mean of two growing seasons and three sowing densities) with further increasing N up to 180 kg·ha−1. Increasing the sowing density from 60 to 300 kg·ha−1 resulted in a decrease in NSP from 67.10 to 39.48 (mean of two growing seasons and five nitrogen fertilizer rates). The highest NSP occurred in the combination of 90 kg·ha−1 N and 60 kg·ha−1 sowing density (N2D1) in each growing season.
The number of grains per panicle (NGP) was significantly (p < 0.01) affected by nitrogen fertilizer, planting density, and their interaction during the two growing seasons (Table 3). Increasing the nitrogen fertilizer rate from 0 to 90 kg·ha−1 resulted in an increase in panicle length from 110.34 to 140.74 (mean of two growing seasons and three sowing densities), and then a decrease to 57.36 (mean of two growing seasons and three sowing densities) with further increasing N up to 180 kg·ha−1. Increasing the sowing density from 60 to 300 kg·ha−1 resulted in a decrease in NGP from 143.79 to 67.60 (mean of two growing seasons and five nitrogen fertilizer rates). The highest NGP occurred in the combination of 90 kg·ha−1 N and 60 kg·ha−1 sowing density (N2D1) in each growing season.
Nitrogen fertilizer, planting density, and their interaction had significant effects (p < 0.01) on the weight of grains per panicle (WGP) during the two growing seasons (Table 3). Increasing the nitrogen fertilizer rate from 0 to 90 kg·ha−1 resulted in an increase in WGP from 3.28 to 4.59 g (mean of two growing seasons and three sowing densities), and then a decrease to 3.11 g (mean of two growing seasons and three sowing densities) with further increasing N up to 180 kg·ha−1. Increasing the sowing density from 60 to 300 kg·ha−1 resulted in a decrease in WGP from 4.66 to 2.49 g (mean of two growing seasons and five nitrogen fertilizer rates). The highest WGP occurred in the combination of 90 kg·ha−1 N and 60 kg·ha−1 sowing density (N2D1) in each growing season.
Nitrogen fertilizer, planting density, and their interaction had significant effects (p < 0.01) on the 1000-kernel weight during the two growing seasons (Table 3). The 1000-kernel weight increased from 30.75 to 36.08 g (mean of two growing seasons and three sowing densities) as the nitrogen fertilizer rate increased from 0 to 90 kg·ha−1, and then decreased to 29.95 g (mean of two growing seasons and three sowing densities) with further increasing N up to 180 kg·ha−1. Increasing the sowing density from 60 to 300 kg·ha−1 resulted in an increase in 1000-kernel weight from 34.24 to 30.95 g (mean of two growing seasons and five nitrogen fertilizer rates). The highest 1000-kernel weight occurred in the combination of 90 kg·ha−1 N and 60 kg·ha−1 sowing density (N2D1) in each growing season. However, it was not significantly (p > 0.05) higher than the nitrogen fertilization of 90 kg·ha−1 and sowing density of 180 kg·ha−1 treatment (N2D2) in 2017.

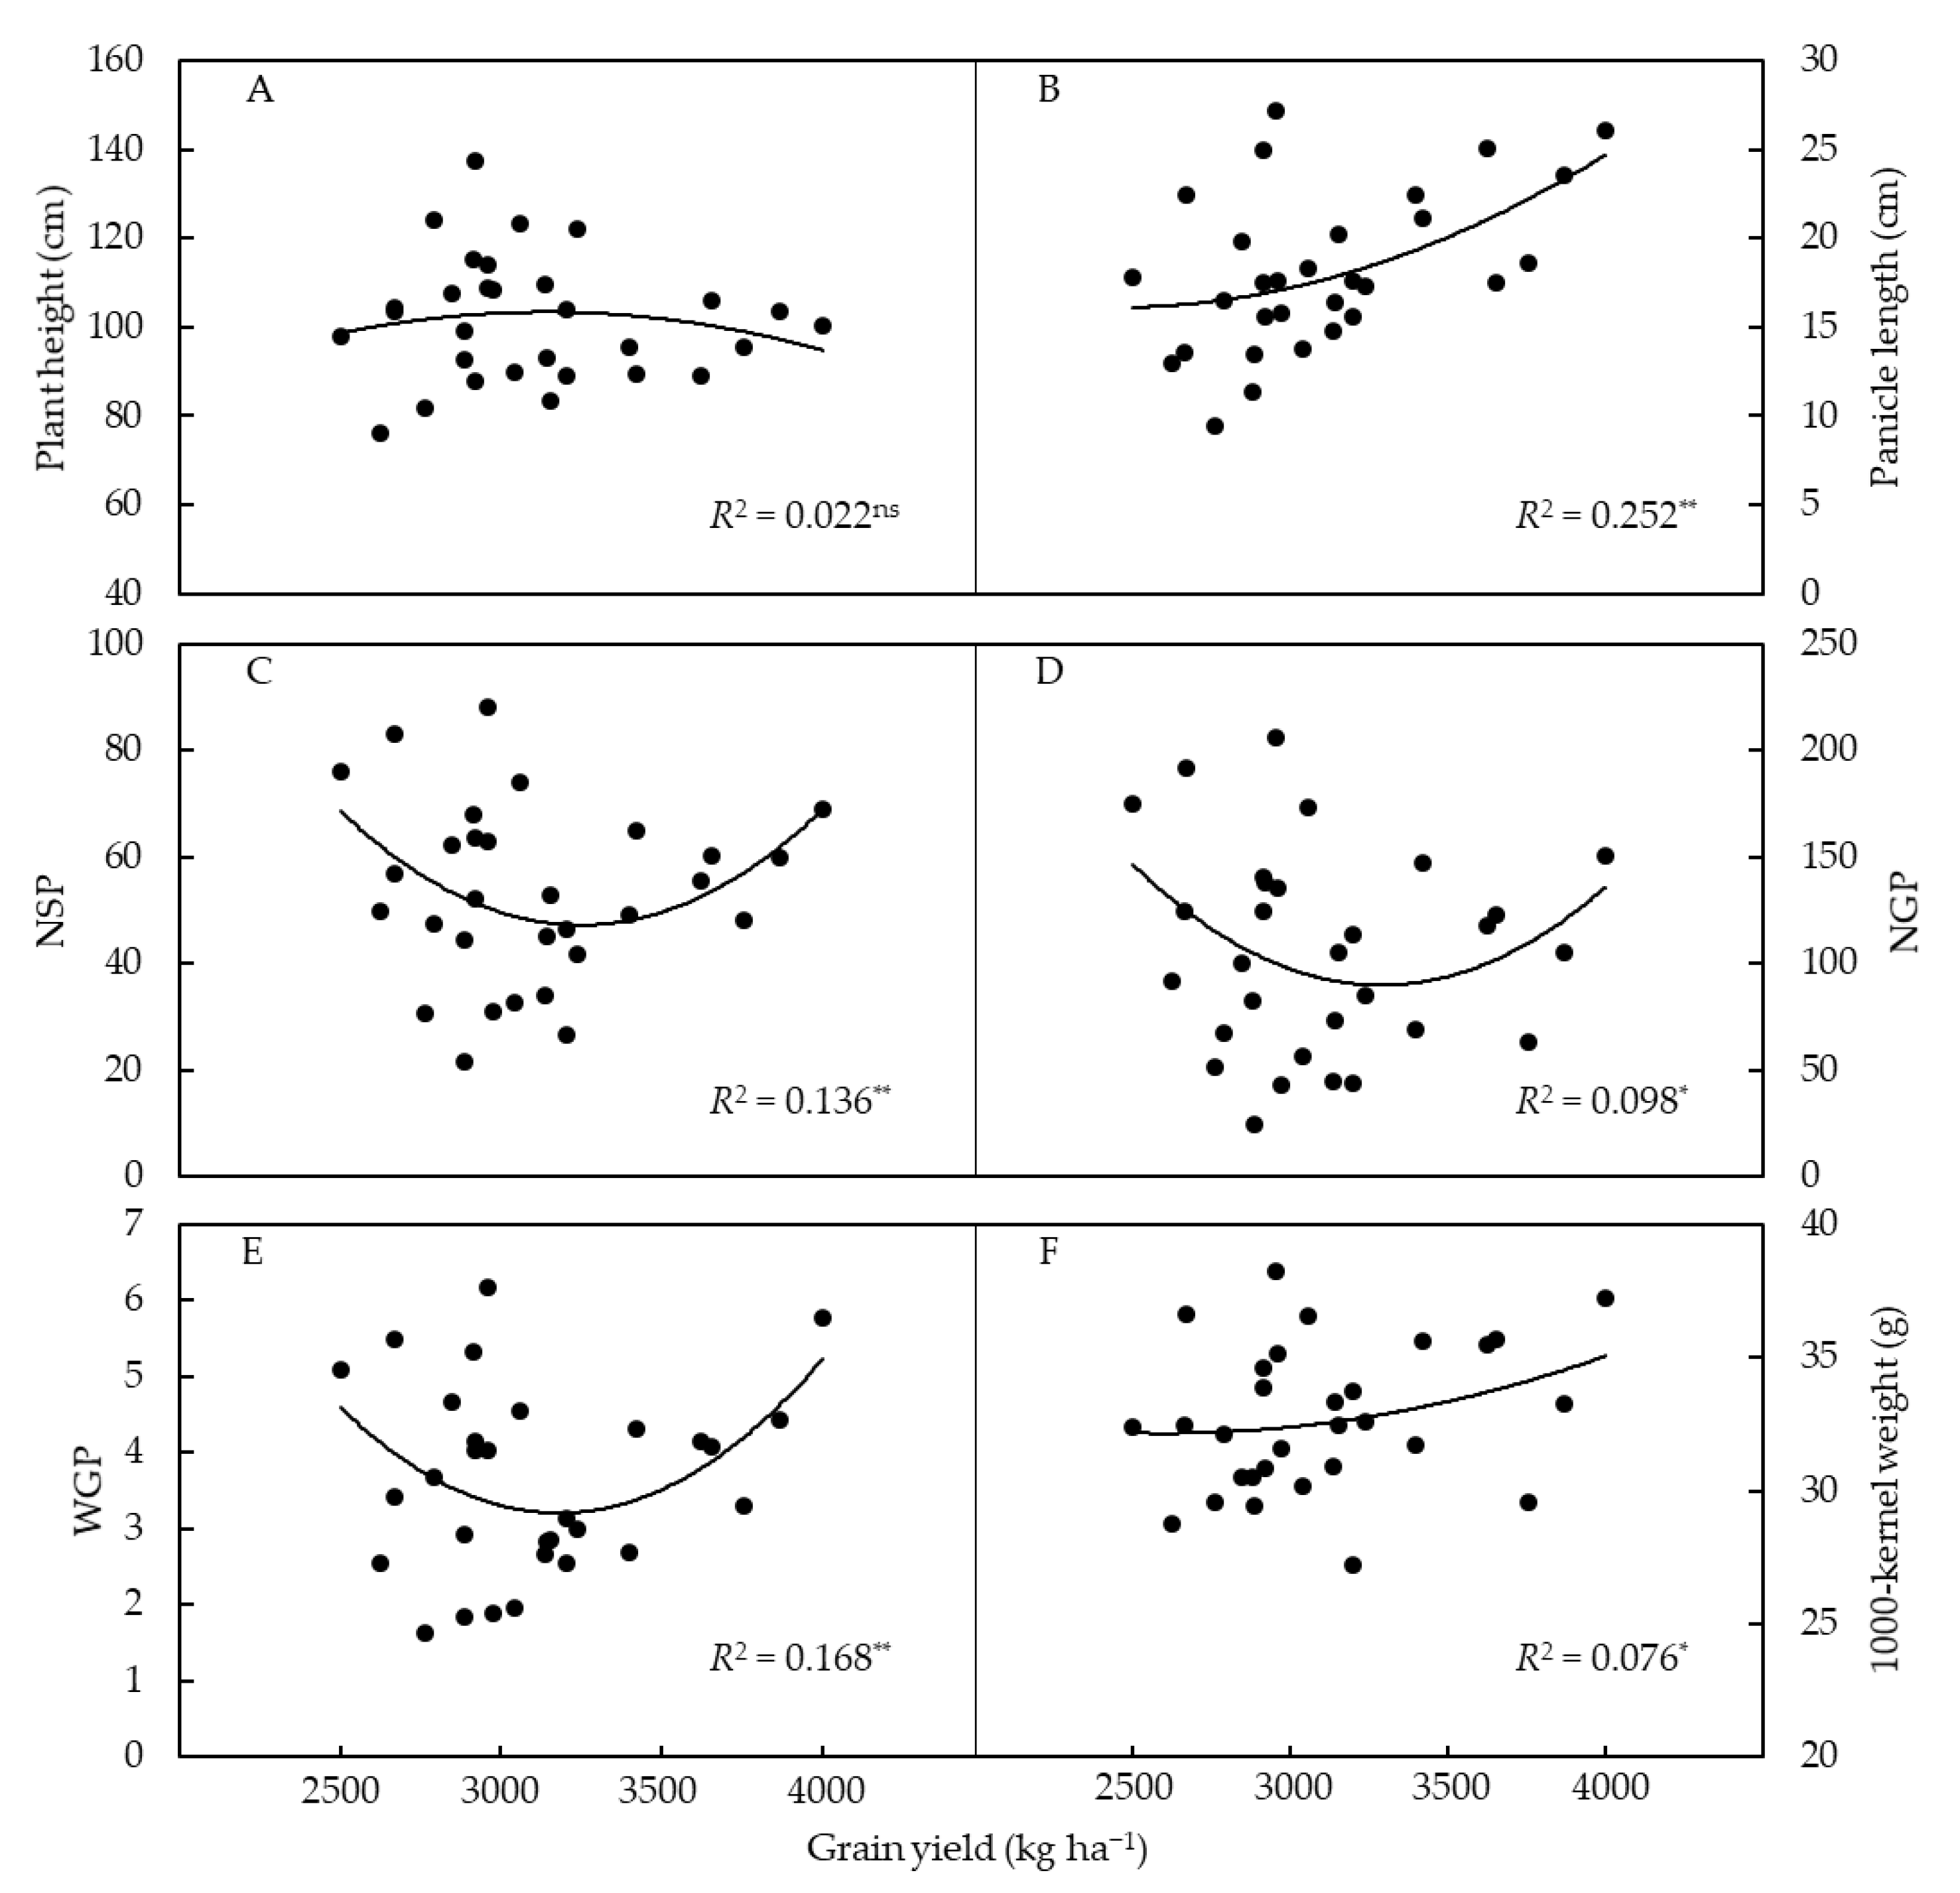
3.3. Relationship between Grain Yield and Flag Leaf Photosynthetic Characteristics, as Well as Yield Components

Regression analyses demonstrated that the grain yield was significantly (p < 0.01) correlated with Pn, Gs, Ci, Tr, WUE, Ls, SPAD, LAI, panicle length, NSP, and WGP (Figure 1A–H and Figure 2B,C,E). Remarkable (p < 0.05) correlations were found between the grain yield and NGP, as well as 1000-kernel weight (Figure 2D,F). However, grain yield was not significantly (p > 0.05) correlated with plant height (Figure 2A).

3.4. Relationship between Nitrogen Fertilizer or Planting Density and Flag Leaf Photosynthetic Characteristics, Grain Yield, and Yield Components

Regression analysis showed that the Pn, Gs, Ci, Tr, WUE, Ls, SPAD, LAI, grain yield, plant height, panicle length, number of NSP, NGP, WGP, and 1000-kernel weight were significantly (p < 0.01) correlated with nitrogen fertilizer (Table 4). The Pn, Gs, Ci, Tr, WUE, Ls, SPAD, LAI, grain yield, plant height, number of NSP, NGP, WGP, and 1000-kernel weight were significantly (p < 0.01) correlated with planting density. Moreover, the panicle length was weakly (p < 0.05) correlated with planting density (Table 4).

4. Discussion

In this study, we demonstrated significant correlations of grain yield with Pn, Gs, Ci, Tr, WUE, Ls, SPAD, plant height, panicle length, NSP, NGP, WGP, and 1000-kernel weight. Our data showed that the flag leaf photosynthetic capacity and yield components are key factors to determine oat grain yield at the boot stage. Grain yield varied between years, with higher grain yield in a drier year (2016) than in 2017. This is interesting because earlier studies revealed that the period just before anthesis is a very sensitive period in crop and the photothermal quotient (radiation/temperature), and precipitation has a major influence on grain number and, hence, yield [10,26]. The reason may be that both nitrogen fertilizer and climatic conditions affected vegetative and reproductive development of the crop. The reproductive growth stage of oat in our study was mainly in July, while total rainfall in July 2017 was lower by 57 mm and mean temperature was higher by 2.8 °C than the respective long-term averages (30 year average). In contrast, total rainfall in 2016 was similar to (only 3.5 mm higher than) the long-term average. This pattern of the weather led to a more reproductive development in 2016 and more vegetative development in 2017, as evidenced by the change trend of LAI and plant height in 2 years. Similar conclusions were drawn by Anderson and McLean [27]; in their study, the yield response of oat to applied N in Western Australia depended on soil N status, seasonal rainfall, sowing date, seed rate, and cultivar.
Crop yield is determined by the efficiency of photosynthesis, as well as assimilate transport and distribution. Nitrogen nutrition plays a key role in these processes. Nitrogen fertilization contributes to the LAI, radiation interception, radiation use efficiency, dry matter partitioning to reproductive organs, and protein content of the plant and the seed [28]. Previous studies illustrated that nitrogen deficiency resulted in reductions in leaf photosynthetic capacity and grain yield in Triticum aestivum [29], Zea mays [30], and Sorghum bicolor [31]. In our experiment, the flag leaf photosynthetic capacity, grain yield, and yield components increased with the increase of nitrogen fertilizer from 0 to 90 kg·ha−1, and then decreased with the increase of nitrogen fertilizer from 90 to 180 kg·ha−1. Both the number of spikelets per panicle and number of grains per panicle can affect the critical yield components and number of grains per unit area, thereby influencing grain yield. Increased floret fertility within spikelets in response to nitrogen fertilization, resulting in an increased number of grains, was also reported by Peltonen-Sainio and Järvinen [8]. Reduced floret abortion and free kernel at greater nitrogen availability could increase grain yield [32]. The reason for the decrease in the flag leaf photosynthetic capacity, grain yield, and yield components may be that the weak light irradiance to the leaf as a result of shading due to abundant nitrogen fertilizer promoted leaf development, and oat grew excessively tall when nitrogen fertilizer was abundant and became susceptible to lodging, as proven by the change trend of plant height, especially in 2017, a phenomenon that was also reported by Vos, Van Der Putten, and Birch [14]. Previous studies on cereals reported that yield is primarily determined by grain numbers rather than by grain weight [33,34]. In the present study, regression analysis showed that the NGP and WGP were significantly correlated with nitrogen fertilizer, with a larger coefficient of determination (R2) value of nitrogen fertilizer with NGP than with WGP, in agreement with previous reports on oat [35].
Planting density is one of the most important factors coordinating the contradiction between crop group and individual [7]. In general, increasing plant population produces a greater grain yield for most crops, but high planting density could also cause a yield decline. In this study, the leaf photosynthetic capacity and grain yield increased to their maximums at a sowing density of 180 kg·ha−1, while they subsequently decreased at sowing density of 300 kg·ha−1. The reason for the decrease in leaf photosynthetic capacity and grain yield might be the weak light irradiance to the leaf by shading and strong competition at high planting density, as noted in the previous study [36]. While the yield components per plant decreased with the increase in planting density, maximum yield components appeared at the sowing density of 60 kg·ha−1. Obviously, low competition at low planting density allowed oat a better use of available light for enhancing described yield component parameters. According to Peltonen-Sainio and Järvinen [8], in pure oat stands, an increase in tillering, grains per panicle, and harvest index with decreasing seeding rate was explained by more space per plant. More fertile spikelets per spike and grains per spike of wheat at lower crop density are attributed to less light competition [37]. Increased light availability enhances the differentiation rate of inflorescences during tillering stage, resulting in a higher number of spikelets (and florets) per inflorescence [16]. In the present study, we showed higher coefficient of determination (R2) values for the regression equation of planting density with the flag leaf photosynthetic capacity, grain yield, and yield components (except Ci, LAI, panicle length, and 1000-kernel weight) than of nitrogen fertilizer rates with these parameters. Although the nitrogen fertilizer and planting density had significant effects on the flag leaf photosynthetic capacity, grain yield, and yield components (except LAI and plant height), there was a larger effect of planting density than of nitrogen fertilizer, according to the coefficient of determination (R2) value. New paradigms and further research are needed to enable growers to achieve high grain yield and other characteristics required by millers, while recognizing that nitrogen does not have an overriding effect.
Variety, management, and environment (site and season) are the three groups of factors interacting to determine development and growth in crops and the structure of the crop and the panicles of oat [9]. Nitrogen fertilization and planting density are two of the most important crop management measures. In the present study, it is suggested that appropriate nitrogen fertilizer and planting density could effectively improve the leaf photosynthetic capacity and enhance the yield of oat. The combination which showed the greatest effect was nitrogen fertilization of 90 kg·ha−1 and sowing density of 180 kg·ha−1.

5. Conclusions

Nitrogen fertilizer and planting density had significant effects on flag leaf photosynthetic capacity, grain yield, and yield components of oat. The flag leaf photosynthetic capacity and grain yield increased and then decreased with the increase in nitrogen fertilizer and planting density. The yield components increased and then decreased with the increase in nitrogen fertilizer, while they decreased with the increase in planting density. Specifically, the combination of nitrogen fertilization of 90 kg·ha−1 and sowing density of 180 kg·ha−1 is recommended for oat production on a cool semiarid plateau or other agroecozones with similar environmental conditions.

Author Contributions

Data curation, Z.J. (Zeliang Ju) and K.L.; formal analysis, Z.J. (Zeliang Ju) and K.L.; funding acquisition, Z.J. (Zhifeng Jia); investigation, X.M.; methodology, Z.J. (Zeliang Ju) and K.L.; project administration, Z.J. (Zhifeng Jia); software, Z.J. (Zeliang Ju); writing—original draft, Z.J. (Zeliang Ju) and G.Z.; writing—review and editing, Z.J. (Zeliang Ju), G.Z., and Z.J. (Zhifeng Jia). All authors have read and agreed to the published version of the manuscript.

Funding

This research was financially supported by Qinghai Special Project on transformation of scientific and technological achievements (2022-NK-130), the Key Laboratory of Superior Forage Germplasm on the Qinghai–Tibetan Plateau (2020-ZJ-Y03), the earmarked fund for China Agriculture Research System (CARS-07), and the Kunlun Talents High-End Innovative and Entrepreneurial Talents Plan of Qinghai Province.

Institutional Review Board Statement

Not applicable.

Informed Consent Statement

Not applicable.

Data Availability Statement

All data supporting the findings of this study are included in the article.

Conflicts of Interest

The authors declare no conflict of interest.

References

  1. Gorash, A.; Armonienė, R.; Mitchell Fetch, J.; Liatukas, Ž.; Danytė, V. Aspects in oat breeding: Nutrition quality, nakedness and disease resistance, challenges and perspectives. Ann. Appl. Biol. 2017, 171, 281–302. [Google Scholar] [CrossRef]
  2. Li, X.; Li, M.; Ling, A.; Hu, X.; Ma, Z.; Liu, L.; Li, Y. Effects of genotype and environment on avenanthramides and antioxidant activity of oats grown in northwestern China. J. Cereal Sci. 2017, 73, 130–137. [Google Scholar] [CrossRef]
  3. Marshall, A.; Cowan, S.; Edwards, S.; Griffiths, I.; Howarth, C.; Langdon, T.; White, E. Crops that feed the world 9. Oats- a cereal crop for human and livestock feed with industrial applications. Food Secur. 2013, 5, 13–33. [Google Scholar] [CrossRef]
  4. Biel, W.; Bobko, K.; Maciorowski, R. Chemical composition and nutritive value of husked and naked oats grain. J. Cereal Sci. 2009, 49, 413–418. [Google Scholar] [CrossRef]
  5. Clemens, R.; van Klinken, B.J. The future of oats in the food and health continuum. Br. J. Nutr. 2014, 112 (Suppl. S2), S75–S79. [Google Scholar] [CrossRef] [PubMed]
  6. Chalmers, A.G.; Dyer, C.J.; Sylvester-Bradley, R. Effects of nitrogen fertilizer on the grain yield and quality of winter oats. J. Agric. Sci. 1998, 131, 395–407. [Google Scholar] [CrossRef]
  7. Fang, X.; Li, Y.; Nie, J.; Wang, C.; Huang, K.; Zhang, Y.; Zhang, Y.; She, H.; Liu, X.; Ruan, R.; et al. Effects of nitrogen fertilizer and planting density on the leaf photosynthetic characteristics, agronomic traits and grain yield in common buckwheat (Fagopyrum esculentum M.). Field Crops Res. 2018, 219, 160–168. [Google Scholar] [CrossRef]
  8. Peltonen-Sainio, P.; Järvinen, P. Seeding rate effects on tillering, grain yield, and yield components of oat at high latitude. Field Crops Res. 1995, 40, 49–56. [Google Scholar] [CrossRef]
  9. White, E.; Finnan, J. Crop structure in winter oats and the effect of nitrogen on quality-related characters. J. Crop Improv. 2017, 31, 758–779. [Google Scholar] [CrossRef]
  10. Inoue, T.; Inanaga, S.; Sugimoto, Y.; An, P.; Eneji, A. Effect of drought on ear and flag leaf photosynthesis of two wheat cultivars differing in drought resistance. Photosynthetica 2004, 42, 559–565. [Google Scholar] [CrossRef]
  11. Li, P.-F.; Mo, F.; Li, D.; Ma, B.; Yan, W.; Xiong, Y. Exploring agronomic strategies to improve oat productivity and control weeds: Leaf type, row spacing and planting density. Can. J. Plant Sci. 2018, 98, 1084–1093. [Google Scholar] [CrossRef]
  12. Yan, P.; Zhang, Q.; Shuai, X.F.; Pan, J.X.; Zhang, W.J.; Shi, J.F.; Wang, M.; Chen, X.P.; Cui, Z.L. Interaction between plant density and nitrogen management strategy in improving maize grain yield and nitrogen use efficiency on the North China Plain. J. Agric. Sci. 2015, 154, 978–988. [Google Scholar] [CrossRef]
  13. Andrade, F.H.; Vega, C.; Uhart, S.; Cirilo, A.; Cantarero, M.; Valentinuz, O. Kernel number determination in maize. Crops Sci. 1999, 39, 453–459. [Google Scholar] [CrossRef]
  14. Vos, J.; Van Der Putten, P.; Birch, C. Effect of nitrogen supply on leaf appearance, leaf growth, leaf nitrogen economy and photosynthetic capacity in maize (Zea mays L.). Field Crops Res. 2005, 93, 64–73. [Google Scholar] [CrossRef]
  15. Tollenaar, M.; Aguilera, A.; Nissanka, S.P. Grain yield is reduced more by weed interference in an old than in a new maize hybrid. Agron. J. 1997, 89, 239–246. [Google Scholar] [CrossRef]
  16. Neugschwandtner, R.W.; Kaul, H.-P. Sowing ratio and N fertilization affect yield and yield components of oat and pea in intercrops. Field Crops Res. 2014, 155, 159–163. [Google Scholar] [CrossRef]
  17. Lithourgidis, A.S.; Vasilakoglou, I.B.; Dhima, K.V.; Dordas, C.A.; Yiakoulaki, M.D. Forage yield and quality of common vetch mixtures with oat and triticale in two seeding ratios. Field Crops Res. 2006, 99, 106–113. [Google Scholar] [CrossRef]
  18. Neumann, A.; Schmidtke, K.; Rauber, R. Effects of crop density and tillage system on grain yield and N uptake from soil and atmosphere of sole and intercropped pea and oat. Field Crops Res. 2007, 100, 285–293. [Google Scholar] [CrossRef]
  19. Moreira, N. The effect of seed rate and nitrogen fertilizer on the yield and nutritive value of oat-vetch mixtures. J. Agric. Sci. 1989, 112, 57–66. [Google Scholar] [CrossRef]
  20. Browne, R.A.; White, E.M.; Burke, J.I. Effect of nitrogen, seed rate and plant growth regulator (chlormequat chloride) on the grain quality of oats (Avena sativa). J. Agric. Sci. 2004, 141, 249. [Google Scholar] [CrossRef]
  21. Klikocka, H.; Cybulska, M.; Barczak, B.; Narolski, B.; Szostak, B.; Kobiałka, A.; Nowak, A.; Wójcik, E. The effect of sulphur and nitrogen fertilization on grain yield and technological quality of spring wheat. Plant Soil Environ. 2016, 62, 230–236. [Google Scholar] [CrossRef]
  22. Olszewski, J.; Makowska, M.; Pszczółkowska, A.; Okorski, A.; Bieniaszewski, T. The effect of nitrogen fertilization on flag leaf and ear photosynthesis and grain yield of spring wheat. Plant Soil Environ. 2014, 60, 531–536. [Google Scholar] [CrossRef]
  23. Ou, L.; Wei, G.; Zhang, Z.; Dai, X.; Zou, X. Effects of low temperature and low irradiance on the physiological characteristics and related gene expression of different pepper species. Photosynthetica 2015, 53, 85–94. [Google Scholar] [CrossRef]
  24. Su, B.; Song, Y.; Song, C.; Cui, L.; Yong, T.; Yang, W. Growth and photosynthetic responses of soybean seedlings to maize shading in relay intercropping system in Southwest China. Photosynthetica 2014, 52, 332–340. [Google Scholar] [CrossRef]
  25. Akcura, M.; Sabandüzen, B.; Hocaoğlu, O. Using GGE biplot analysis to evaluate interrelationships between yield and yield components of oat genotypes in different growing seasons. J. Crop Sci. Biotechnol. 2018, 21, 483–490. [Google Scholar] [CrossRef]
  26. Fischer, R. Number of kernels in wheat crops and the influence of solar radiation and temperature. J. Agric. Sci. 1985, 105, 447–461. [Google Scholar] [CrossRef]
  27. Anderson, W.; McLean, R. Increased responsiveness of short oat cultivars to early sowing, nitrogen fertilizer and seed rate. Aust. J. Agric. Res. 1989, 40, 729–744. [Google Scholar] [CrossRef]
  28. Dordas, C.A.; Sioulas, C. Safflower yield, chlorophyll content, photosynthesis, and water use efficiency response to nitrogen fertilization under rainfed conditions. Ind. Crops Prod. 2008, 27, 75–85. [Google Scholar] [CrossRef]
  29. Langer, R.H.M.; Liew, F.K.Y. Effects of varying nitrogen supply at different stages of the reproductive phase on spikelet and grain production and on grain nitrogen in wheat. Aust. J. Agric. Res. 1973, 24, 647–656. [Google Scholar] [CrossRef]
  30. Ding, L.; Wang, K.; Jiang, G.; Biswas, D.; Xu, H.; Li, L.; Li, Y. Effects of nitrogen deficiency on photosynthetic traits of maize hybrids released in different years. Ann. Bot. 2005, 96, 925–930. [Google Scholar] [CrossRef] [Green Version]
  31. Zhao, D.; Reddy, K.R.; Kakani, V.G.; Reddy, V. Nitrogen deficiency effects on plant growth, leaf photosynthesis, and hyperspectral reflectance properties of sorghum. Eur. J. Agron. 2005, 22, 391–403. [Google Scholar] [CrossRef]
  32. Ferrante, A.; Savin, R.; Slafer, G.A. Floret development and grain setting differences between modern durum wheats under contrasting nitrogen availability. J. Exp. Bot. 2012, 64, 169–184. [Google Scholar] [CrossRef] [PubMed]
  33. Ferrante, A.; Savin, R.; Slafer, G.A. Floret development of durum wheat in response to nitrogen availability. J. Exp. Bot. 2010, 61, 4351–4359. [Google Scholar] [CrossRef] [PubMed]
  34. Peltonen-Sainio, P.; Kangas, A.; Salo, Y.; Jauhiainen, L. Grain number dominates grain weight in temperate cereal yield determination: Evidence based on 30 years of multi-location trials. Field Crop. Res. 2007, 100, 179–188. [Google Scholar] [CrossRef]
  35. Pecio, A.; Bichonski, A. Nitrogen fertilization and fungicide application as elements of oat production. Pol. J. Environ. Stud. 2010, 19, 1297–1305. [Google Scholar]
  36. Ma, N.; Yuan, J.; Li, M.; Li, J.; Zhang, L.; Liu, L.; Naeem, M.S.; Zhang, C. Ideotype population exploration: Growth, photosynthesis, and yield components at different planting densities in winter oilseed rape (Brassica napus L.). PLoS ONE 2014, 9, e114232. [Google Scholar] [CrossRef]
  37. Darwinkel, A. Ear development and formation of grain yield in winter wheat. Neth. J. Agric. Sci. 1980, 28, 156–163. [Google Scholar] [CrossRef]
Figure 1. Relationships of grain yield with the net photosynthetic rate (Pn), stomatal conductance (Gs), intercellular CO2 concentration (Ci), transpiration rate (Tr), water-use efficiency (WUE), stomatal limitation value (Ls), and leaf area index (LAI) of oat. Lines describe quadratic regression equations (y = a + bx − cx2); ** significant correlation at p < 0.01.
Agronomy 12 02108 g001
Figure 2. Relationships of grain yield with the plant height, panicle length, number of spikelets per panicle (NSP), number of grains per panicle (NGP), weight of grains per panicle (WGP), and 1000-kernel weight of oat. Lines describe quadratic regression equations (y = a + bx − cx2); ns, not significant; * and ** significant at p < 0.05 and p < 0.01, respectively.
Agronomy 12 02108 g002
Table 1. Long-term average monthly precipitation and temperature (1986–2015) and deviations during the 2016 and 2017 growing seasons of experimentation at Huangzhong, Qinghai Province.
MonthPrecipitation (mm)Temperature (°C)
30 Year AverageDeviations30 Year AverageDeviations
20162017 20162017
April32.1−2.55.85.51.90.2
may70.4−14.941.29.9−0.10.0
June86.7−32.5−41.113.11.40.3
July106.03.5−57.015.21.42.8
August100.2−59.238.814.23.40.4
September80.70.72.19.90.71.4
Table 2. Net photosynthetic rate (Pn), stomatal conductance (Gs), intercellular CO2 concentration (Ci), transpiration rate (Tr), water-use efficiency (WUE), stomatal limitation value (Ls), and leaf area index (LAI) of oat in different nitrogen fertilizer and planting density treatments in two cropping seasons. Data are expressed as the mean of three replications (n = 3). Data within a column in the same year, sharing the same letter, are not significantly different at p < 0.05; ns, not significant; ** significant at p < 0.01. N, D, and N × D represent nitrogen fertilizer, planting density, and the interaction between nitrogen fertilizer and planting density, respectively. N0, N1, N2, N3, and N4 represent nitrogen fertilizer rates at five levels of 0, 45, 90, 135, and 180 kg·ha−1, respectively. D1, D2, and D3 represent planting density at three sowing densities of 60, 180, and 300 kg·ha−1, respectively.
YearsTreatmentsPn (μmol·m−2·s−1)Gs (mol·m−2·s−1)Ci (μmol·mol−1)Tr (mmol·m−2·s−1)WUE (%)LSSPADLAI
2016N0D19.95 ± 0.66 fg0.23 ± 0.02 ghi343.83 ± 4.57 bc2.83 ± 0.24 fg0.35 ± 0.01 cd0.33 ± 0.01 g40.17 ± 1.94 f1.75 ± 0.11 i
N1D111.36 ± 0.56 e0.25 ± 0.03 fg336.27 ± 5.22 cde3.23 ± 0.24 def0.35 ± 0.01 cd0.36 ± 0.01 f41.20 ± 1.51 f2.01 ± 0.17 h
N2D112.97 ± 1.08 d0.31 ± 0.03 e320.83 ± 3.52 ghi4.27 ± 0.31 c0.30 ± 0.01 cde0.41 ± 0.01 e46.03 ± 1.47 e3.21 ± 0.17 fg
N3D19.55 ± 0.72 fg0.22 ± 0.02 ghi344.46 ± 2.81 bc2.29 ± 0.35 ghi0.42 ± 0.04 b0.31 ± 0.01 gh35.97 ± 1.55 g3.30 ± 0.13 f
N4D18.94 ± 0.29 g0.19 ± 0.01 hi354.71 ± 3.43 a1.84 ± 0.33 i0.50 ± 0.09 a0.25 ± 0.01 i33.10 ± 0.44 g3.54 ± 0.08 e
N0D211.41 ± 0.56 e0.34 ± 0.03 de328.52 ± 3.17 efg3.45 ± 0.24 de0.33 ± 0.02 cd0.42 ± 0.01 e45.20 ± 2.67 e3.02 ± 0.13 g
N1D214.32 ± 0.21 bc0.49 ± 0.03 b321.55 ± 7.24 ghi4.75 ± 0.09 bc0.30 ± 0.01 cde0.50 ± 0.02 c57.63 ± 0.64 c3.36 ± 0.11 ef
N2D216.76 ± 0.48 a0.63 ± 0.04 a295.99 ± 6.51 j6.61 ± 0.52 a0.25 ± 0.01 e0.62 ± 0.01 a70.90 ± 2.01 a3.57 ± 0.15 e
N3D214.65 ± 0.76 b0.51 ± 0.02 b317.88 ± 5.15 hi4.92 ± 0.56 b0.30 ± 0.02 de0.55 ± 0.02 b64.80 ± 2.36 b3.99 ± 0.16 d
N4D213.58 ± 0.22 cd0.38 ± 0.03 cd331.75 ± 6.41 def4.19 ± 0.10 c0.32 ± 0.00 cd0.51 ± 0.01 c53.50 ± 2.63 d4.77 ± 0.08 b
N0D38.84 ± 0.28 g0.18 ± 0.03 i351.39 ± 6.18 ab2.11 ± 0.19 hi0.42 ± 0.03 b0.24 ± 0.01 i40.67 ± 1.99 f3.26 ± 0.09 f
N1D39.43 ± 1.10 fg0.24 ± 0.02 gh338.65 ± 3.50 cd2.66 ± 0.48 fgh0.36 ± 0.02 c0.30 ± 0.02 h40.67 ± 0.76 f3.84 ± 0.18 d
N2D313.26 ± 0.37 cd0.41 ± 0.04 c316.29 ± 5.39 i4.34 ± 0.11 c0.31 ± 0.00 cde0.46 ± 0.01 d52.60 ± 2.01 d4.28 ± 0.15 c
N3D311.22 ± 0.33 e0.30 ± 0.03 e326.16 ± 6.91 fgh3.56 ± 0.30 d0.32 ± 0.02 cd0.40 ± 0.01 e46.63 ± 1.95 e4.77 ± 0.05 b
N4D310.09 ± 0.41 f0.29 ± 0.03 ef332.76 ± 5.36 def2.97 ± 0.22 ef0.34 ± 0.02 cd0.37 ± 0.01 f41.90 ± 1.23 f5.35 ± 0.10 a
LSD0.05 for
N ****************
D ****************
N × D ****************
2017N0D111.82 ± 0.16 e0.23 ± 0.02 fg336.71 ± 5.67 ef3.50 ± 0.14 de0.34 ± 0.01 c0.38 ± 0.03 ef42.73 ± 1.32 fgh2.27 ± 0.05 j
N1D112.08 ± 0.16 e0.27 ± 0.03 ef336.23 ± 3.76 ef3.24 ± 0.35 e0.38 ± 0.04 bc0.39 ± 0.01 de45.23 ± 2.21 ef2.80 ± 0.21i
N2D113.26 ± 0.15 d0.34 ± 0.04 d320.86 ± 2.09 g3.73 ± 0.11 cd0.36 ± 0.01 bc0.41 ± 0.01 cd51.90 ± 1.55 c3.17 ± 0.08 h
N3D19.33 ± 0.97 h0.22 ± 0.02 gh347.76 ± 1.15 c2.35 ± 0.06 g0.40 ± 0.04 b0.34 ± 0.04 g37.13 ± 1.88 ij3.60 ± 0.05 g
N4D18.71 ± 0.11 i0.18 ± 0.02 hi358.86 ± 2.25 a1.83 ± 0.16 h0.48 ± 0.05 a0.26 ± 0.01 hi34.67 ± 2.74 j3.96 ± 0.10 ef
N0D210.83 ± 0.1 f30.32 ± 0.02 d341.41 ± 1.83 de3.30 ± 0.13 e0.33 ± 0.01 c0.40 ± 0.01 de43.83 ± 1.97 fg3.92 ± 0.13 f
N1D213.90 ± 0.16 c0.43 ± 0.03 c333.71 ± 4.50 f4.03 ± 0.19 c0.35 ± 0.01 c0.44 ± 0.03 c54.13 ± 1.29 bc4.42 ± 0.13 d
N2D215.66 ± 0.24 a0.58 ± 0.03 a310.56 ± 5.71 h5.69 ± 0.07 a0.28 ± 0.01 d0.57 ± 0.02 a62.73 ± 1.19 a4.93 ± 0.08 c
N3D214.97 ± 0.19 b0.52 ± 0.02 b324.65 ± 3.65 g4.44 ± 0.36 b0.34 ± 0.02 c0.49 ± 0.01 b56.77 ± 1.17 b5.29 ± 0.26 b
N4D213.31 ± 0.21 d0.41 ± 0.01 c340.58 ± 3.78 de3.80 ± 0.11 cd0.35 ± 0.01 bc0.43 ± 0.03 cd52.17 ± 1.08 c6.00 ± 0.22 a
N0D39.05 ± 0.27 hi0.17 ± 0.01 i357.20 ± 1.62 ab2.06 ± 0.17 gh0.44 ± 0.03 a0.23 ± 0.01 i39.83 ± 1.53 hi3.48 ± 0.05 g
N1D39.34 ± 0.45 h0.18 ± 0.02 hi351.71 ± 4.52 bc1.95 ± 0.10 h0.48 ± 0.01 a0.28 ± 0.01 h40.93 ± 1.07 gh3.87 ± 0.16 f
N2D312.75 ± 0.22 d0.36 ± 0.02 d336.11 ± 2.40 ef3.45 ± 0.06 de0.37 ± 0.01 bc0.41 ± 0.01 cd50.77 ± 0.51 cd4.16 ± 0.05 e
N3D310.67 ± 0.19 f0.28 ± 0.03 e341.30 ± 1.31 de3.21 ± 0.10 e0.33 ± 0.00 c0.38 ± 0.00 ef47.63 ± 1.60 de4.65 ± 0.10 d
N4D39.95 ± 0.27 g0.25 ± 0.03 efg346.17 ± 0.72 cd2.68 ± 0.36 f0.38 ± 0.04 bc0.35 ± 0.01 fg42.03 ± 0.91 fgh5.41 ± 0.21 b
LSD0.05 for
N ****************
D ****************
N × D **************ns
Table 3. Grain yield, plant height, panicle length, number of spikelets per panicle (NSP), number of grains per panicle (NGP), weight of grains per panicle (WGP), and 1000-kernel weight of oat in different nitrogen fertilizer and planting density treatments in two cropping seasons. Data are expressed as the mean of three replications (n = 3). Data within a column in the same year, sharing the same letter, are not significantly different at p < 0.05; ns, not significant; * and ** significant at p < 0.05 and p < 0.01, respectively. N, D, and N × D represent nitrogen fertilizer, planting density, and the interaction between nitrogen fertilizer and planting density, respectively. N0, N1, N2, N3, and N4 represent nitrogen fertilizer rates at five levels of 0, 45, 90, 135, and 180 kg·ha−1, respectively. D1, D2, and D3 represent planting density at three sowing densities of 60, 180, and 300 kg·ha−1, respectively.
YearsTreatmentsGrain Yield (kg·ha−1)Plant Height (cm)Panicle Length (cm)NSPNGPWGP (g)1000-Kernel Weight (g)
2016N0D12500.93 ± 60.63 j97.94 ± 2.34 ef17.77 ± 0.49 i76.12 ± 1.54 c174.73 ± 3.93 c5.09 ± 0.11 d32.38 ± 0.07 g
N1D12668.60 ± 33.95 i104.37 ± 0.93 cd22.43 ± 0.22 e82.98 ± 1.62 b191.59 ± 2.36 b5.50 ± 0.14 c36.61 ± 0.27 c
N2D12957.30 ± 39.93 g108.88 ± 3.54 b27.22 ± 0.91 a88.14 ± 1.51 a206.39 ± 4.53 a6.18 ± 0.10 a38.21 ± 0.53 a
N3D12913.10 ± 51.42 gh115.09 ± 2.38 a24.95 ± 0.39 c68.12 ± 0.65 de140.38 ± 5.54 ef5.32 ± 0.05 cd34.59 ± 0.33 e
N4D12846.17 ± 38.42 h107.71 ± 1.77 bc19.83 ± 0.29 g62.33 ± 2.91 fg100.32 ± 7.52 h4.66 ± 0.30 e30.48 ± 0.21 i
N0D22919.00 ± 81.80 gh87.66 ± 2.68 g15.60 ± 0.42 j63.57 ± 3.84 fg138.08 ± 5.31 f4.03 ± 0.18 h30.86 ± 0.29 i
N1D23423.97 ± 45.16 e89.65 ± 0.90 g21.17 ± 0.17 f64.93 ± 0.53 ef147.39 ± 3.93 de4.32 ± 0.05 fg35.59 ± 0.17 d
N2D24002.00 ± 47.31 a100.42 ± 2.86 de26.08 ± 0.28 b69.02 ± 0.47 d150.91 ± 3.45 d5.77 ± 0.01 b37.23 ± 0.07 b
N3D23868.63 ± 35.17 b103.72 ± 2.28 cd23.53 ± 0.27 d59.94 ± 1.95 g104.94 ± 1.12 h4.42 ± 0.06 ef33.26 ± 0.08 f
N4D23757.43 ± 51.01 c95.33 ± 3.04 f18.67 ± 0.73 h48.31 ± 1.16 j63.56 ± 2.07 j3.31 ± 0.04 i29.55 ± 0.15 j
N0D32623.53 ± 79.72 i76.33 ± 2.08 i13.01 ± 0.43 k49.78 ± 4.67 ij91.49 ± 5.09 i2.55 ± 0.10 k28.74 ± 0.07 k
N1D33153.97 ± 28.82 f83.48 ± 0.98 h20.23 ± 0.22 g52.77 ± 1.57 hi105.56 ± 2.37 h2.85 ± 0.33 j32.43 ± 0.61 g
N2D33624.37 ± 51.05 d89.22 ± 1.23 g25.03 ± 0.17 c55.59 ± 1.04 h118.11 ± 1.25 g4.15 ± 0.03 gh35.49 ± 0.34 d
N3D33402.00 ± 66.55 e95.54 ± 2.52 f22.43 ± 0.35 e49.02 ± 2.61 ij69.22 ± 5.91 j2.68 ± 0.12 jk31.71 ± 0.18 h
N4D33201.77 ± 33.25 f89.22 ± 2.55 g17.57 ± 0.23 i26.50 ± 3.18 k43.56 ± 2.92 k2.54 ± 0.13 k27.21 ± 0.15 l
LSD0.05 for
N **************
D **************
N × D **ns**********
2017N0D12668.04 ± 49.88 i103.42 ± 2.62 e13.59 ± 0.12 f56.89 ± 2.41 c124.33 ± 4.26 c3.43 ± 0.08 d32.44 ± 0.92 def
N1D12959.81 ± 76.43 fg114.22 ± 1.02 c17.62 ± 0.26 b62.89 ± 2.41 b135.17 ± 5.27 b4.03 ± 0.10 b35.13 ± 2.30 b
N2D13057.08 ± 48.14 de123.31 ± 2.22 b18.33 ± 0.33 a73.94 ± 0.82 a173.19 ± 3.53 a4.54 ± 0.16 a36.53 ± 0.18 a
N3D12918.13 ± 57.13 g137.58 ± 3.74 a17.53 ± 0.25 b52.08 ± 0.68 d124.42 ± 1.23 c4.16 ± 0.10 b33.88 ± 0.39 c
N4D12793.06 ± 60.01 h124.11 ± 2.36 b16.47 ± 0.18 c47.48 ± 1.03 e67.42 ± 2.24 g3.67 ± 0.09 c32.13 ± 0.24 ef
N0D22883.35 ± 49.59 g92.67 ± 1.15 g11.33 ± 0.54 g44.42 ± 2.10 ef82.24 ± 1.76 e2.93 ± 0.09 ef30.53 ± 0.35 h
N1D23201.50 ± 16.63 bc103.94 ± 1.23 e15.64 ± 0.13 d46.44 ± 1.07 e113.56 ± 2.71 d3.12 ± 0.09 e34.74 ± 0.51 c
N2D23653.92 ± 17.27 a105.89 ± 2.34 de17.54 ± 0.35 b60.39 ± 2.68 b122.72 ± 4.75 c4.07 ± 0.09 b35.68 ± 0.24 ab
N3D23237.56 ± 41.19 b122.08 ± 1.54 b17.32 ± 0.35 b41.69 ± 1.24 f84.69 ± 2.89 e2.99 ± 0.23 ef32.62 ± 0.04 de
N4D23138.89 ± 48.02 cd109.67 ± 1.38 d14.78 ± 0.55 e34.08 ± 1.63 g44.50 ± 2.18 i2.66 ± 0.09 g30.89 ± 0.68 gh
N0D32763.95 ± 37.47 h81.86 ± 0.55 h9.43 ± 0.33 h30.67 ± 1.76 h51.19 ± 3.35 h1.63 ± 0.14 i29.54 ± 0.11 i
N1D33043.19 ± 36.35 ef89.78 ± 0.48 g13.75 ± 0.09 f32.63 ± 0.86 gh56.17 ± 2.17 h1.95 ± 0.06 h30.14 ± 3.70 hi
N2D33140.38 ± 71.85 cd92.97 ± 3.89 g16.42 ± 0.22 c45.08 ± 3.06 e73.11 ± 2.99 f2.82 ± 0.07 fg33.31 ± 0.08 cd
N3D32973.63 ± 34.65 efg108.50 ± 4.49 d15.84 ± 0.46 ed31.10 ± 1.40 gh42.82 ± 1.05 i1.88 ± 0.09 h31.59 ± 0.14 fg
N4D32885.04 ± 57.65 g99.08 ± 2.07 f13.49 ± 0.22 f21.64 ± 1.54 i24.81 ± 3.11 j1.83 ± 0.11 h29.41 ± 0.31 i
LSD0.05 for
N **************
D **************
N × D **ns*********
Table 4. Regression of net photosynthetic rate (Pn), stomatal conductance (Gs), intercellular CO2 concentration (Ci), transpiration rate (Tr), water-use efficiency (WUE), stomatal limitation value (Ls), leaf area index (LAI), grain yield, plant height, panicle length, number of spikelets per panicle (NSP), number of grains per panicle (NGP), weight of grains per panicle (WGP), and 1000-kernel weight of oat on nitrogen fertilizer or planting density; * and ** significant at p < 0.05 and p < 0.01, respectively.
Nitrogen Fertilizer (x1)Planting Density (x2)
Pn (y1)y1 = −0.0003x12 + 0.0625x1 + 10.19 (R2 = 0.263 **)y1 = −0.0002x22 + 0.0814x2 + 6.74 (R2 = 0.491 **)
Gs (y2)y2 = −0.00002x12 + 0.0032x1 + 0.23 (R2 = 0.223 **)y2 = −0.00001x22 + 0.0052x2 − 0.02 (R2 = 0.622 **)
Ci (y3)y3 = 0.0025x12 − 0.4526x1 + 345.12 (R2 = 0.350 **)y3 = 0.0011x22 − 0.3825x2 + 359.19 (R2 = 0.251 **)
Tr (y4)y4 = −0.0002x12 + 0.0297x1 + 2.75 (R2 = 0.240 **)y4 = −0.0001x22 + 0.0403x2 + 0.90 (R2 = 0.455 **)
WUE (y5)y5 = 0.000006x12 − 0.0011x1 + 0.38 (R2 = 0.143 **)y5 = 0.000005x22 − 0.0017x2 + 0.47 (R2 = 0.292 **)
LS (y6)y6 = −0.00001x12 + 0.0025x1 + 0.32 (R2 = 0.217 **)y6 = −0.00001x22 + 0.0037x2 + 0.16 (R2 = 0.538 **)
SPAD (y7)y7 = −0.0013x12 + 0.2388x1 + 41.27 (R2 = 0.237 **)y7 = −0.0009x22 + 0.3542x2 + 22.95 (R2 = 0.531 **)
LAI (y8)y8 = 0.000005x12 + 0.0094x1 + 2.95 (R2 = 0.439 **)y8 = −0.00005x22 + 0.0229x2 + 1.76 (R2 = 0.412 **)
Grain yield (y9)y9 = −0.051x12 + 11.173x1 + 2719.90 (R2 = 0.333 **)y9 = −0.0315x22 + 12.402x2 + 2197.60 (R2 = 0.409 **)
Plant height (y10)y10 = −0.0011x12 + 0.2889x1 + 88.60 (R2 = 0.278 **)y10 = 0.00007x22 − 0.1218x2 + 120.71 (R2 = 0.471 **)
Panicle length (y11)y11 = −0.0008x12 + 0.157x1 + 13.35 (R2 = 0.433 **)y11 = −0.000001x22 − 0.0114x2 + 20.26 (R2 = 0.072 *)
NSP (y12)y12 = −0.0018x12 + 0.248x1 + 52.78 (R2 = 0.225 **)y12 = 0.0000005x22 − 0.1153x2 + 74.01 (R2 = 0.478 **)
NGP (y13)y13 = −0.0058x12 + 0.7468x1 + 109.22 (R2 = 0.351 **)y13 = 0.00003x22 − 0.3285x2 + 163.39 (R2 = 0.444 **)
WGP (y14)y14 = −0.0001x12 + 0.0221x1 + 3.20 (R2 = 0.131 **)y14 = −0.00001x22 − 0.0043x2 + 4.96 (R2 = 0.546 **)
1000-kernel weight (y15)y15 = −0.0006x12 + 0.1063x1 + 30.73 (R2 = 0.623 **)y15 = −0.00003x22 − 0.0037x2 + 34.56 (R2 = 0.249 **)
Publisher’s Note: MDPI stays neutral with regard to jurisdictional claims in published maps and institutional affiliations.

