Article

Water Stress Impacts on Grapevines (Vitis vinifera L.) in Hot Environments: Physiological and Spectral Responses

1
Department of Agricultural, Food, Environmental and Animal Sciences, University of Udine, Via delle Scienze 206, 33100 Udine, Italy
2
Waite Research Institute, School of Agriculture, Food and Wine, The University of Adelaide, Glen Osmond, Adelaide, SA 5064, Australia
3
Plant and Crop Sciences, School of Biosciences, The University of Nottingham, Sutton Bonington Campus, Loughborough LE12 5RD, UK
4
Department of Land, Environmental, Agriculture and Forestry, University of Padova, 35020 Legnaro, Italy
5
Department of Agronomy, Food, Natural Resources, Animals and the Environment, University of Padova, 35020 Legnaro, Italy
*
Author to whom correspondence should be addressed.
Agronomy 2022, 12(8), 1819; https://doi.org/10.3390/agronomy12081819
Submission received: 27 June 2022 / Revised: 21 July 2022 / Accepted: 29 July 2022 / Published: 31 July 2022

Abstract

:
The projected increase in temperature and water scarcity represents a challenge for winegrowers due to changing climatic conditions. Although heat and drought often occur concurrently in nature, there is still little known about the effects of water stress (WS) on grapevines in hot environments. This study aimed to assess whether the grapevine’s physiological and spectral responses to WS in hot environments differ from those expected under lower temperatures. Therefore, we propose an integrated approach to assess the physiological, thermal, and spectral response of two grapevine varieties (Vitis vinifera L.), Grenache and Shiraz, to WS in a hot environment. In a controlled environment room (CER), we imposed high-temperature conditions (TMIN 30 °C–TMAX 40 °C) and compared the performance of well-watered (WW) and WS-ed potted own-rooted Shiraz and Grenache grapevines (SH_WW, SH_WS, GR_WW, and GR_WS, respectively). We monitored the vines’ physiological, spectral, and thermal trends from the stress imposition to the recovery after re-watering. Then, we performed a correlation analysis between the physiological parameters and the spectral and thermal vegetation indices (VIs). Finally, we looked for the best-fitting models to predict the physiological parameters based on the spectral VIs. The results showed that GR_WS was more negatively impacted than SH_WS in terms of net photosynthesis (Pn, GR-WS = 1.14 μmol·CO2 m−2·s−1; SH-WS = 3.64 μmol·CO2 m−2·s−1), leaf transpiration rate (E, GR-WS = 1.02 mmol·H2O m−2·s−1; SH-WS = 1.75 mmol·H2O m−2·s−1), and stomatal conductance (gs, GR-WS = 0.04 mol·H2O m−2·s−1; SH-WS = 0.11 mol·H2O m−2·s−1). The intrinsic water-use efficiency (WUEi = Pn/gs) of GR_WS (26.04 μmol·CO2 mol−1 H2O) was lower than SH_WS (34.23 μmol·CO2 mol−1 H2O) and comparable to that of SH_WW (26.31 μmol·CO2 mol−1 H2O). SH_WS was not unaffected by water stress except for E. After stress, Pn, gs, and E of GR_WS did not recover, as they were significantly lower than the other treatments. The correlation analysis showed that the anthocyanin Gitelson (AntGitelson) and the green normalised difference vegetation index (GNDVI) had significant negative correlations with stem water potential ( Ψ stem), Pn, gs, and E and positive correlation with WUEi. In contrast, the photochemical reflectance index (PRI), the water index (WI), and the normalised difference infrared index (NDII) showed an opposite trend. Finally, the crop water stress (CWSI) had significant negative correlations with the Ψ stem in both varieties. Our findings help unravel the behaviour of vines under WS in hot environments and suggest instrumental approaches to help the winegrowers managing abiotic stress.

Graphical Abstract

1. Introduction

The consequences of climate change on agriculture concern many winegrowers, especially those operating in areas that are more prone to extreme weather events, such as heatwaves and seasonal droughts. According to the Intergovernmental Panel on Climate Change (IPCC) future projections, most viticultural areas will experience reduced summer precipitation, while the temperatures will increase until at least the mid-century [1]. Heatwaves, defined by the Australian Bureau of Meteorology (BOM, [2]) as a consecutive period of five or more days at or above 35 °C or three or more days at or above 40 °C, are increasing in duration and frequency [3]. According to Trancoso et al. [4], heatwaves may become the norm in some areas (85% more frequent and last 57% longer) such as Australia under future global warming scenarios. Similarly, Pereira et al. [5] predicted that heatwaves would be 7 to 10 times more frequent in the Iberian Peninsula by the end of the 21st century. Usually, high temperature increases the evaporative demand and vapour pressure deficit (VPD) [6]. Thus, soil moisture deficits and consequent crop water stress (WS) often coincide with higher temperatures. Therefore, investigating how grapevines respond to WS under increased temperature is crucial to support climate adaptation and mitigation.
The physiological responses of grapevine under drought conditions have raised great interest among scientists, as water resources are increasingly vulnerable in most wine-growing regions [7]. Specifically, research focused on the response adopted by different grapevine varieties to cope with WS. Some varieties exhibit near-isohydric behaviour, maintaining a constant leaf water potential (Ψleaf) through strict regulation of stomatal conductance (gs). Other varieties show a near-anisohydric behaviour, decreasing their Ψleaf and maintaining sustained gs with lower water availability [8]. Due to their behaviour, near-isohydric varieties are also described as “pessimists”, as they tend to preserve their water status [9]. In contrast, near-anisohydric varieties were defined as “optimists” for their higher use of available water. These strategies might change within the same variety under changing environmental conditions [10]. However, for most cultivars, the trend is to show either an isohydric or an anisohydric nature more frequently.
It is generally accepted to consider Grenache as a near-isohydric variety. Schultz [8] tested the response of Grenache to induced WS in France and Germany: the Ψleaf did not decrease significantly compared to watered plants. Moreover, the gs decreased rapidly with fast-developing WS (within a few days), thus exhibiting an isohydric behaviour [11]. Similar results were achieved in experiments carried out in Australia [12] and Spain [13]. Conversely, a near-anisohydric behaviour of Shiraz was observed in different circumstances. For example, Ψleaf drastically decreased under severe water-deficit stress, thus showing ineffective stomatal control of drought [8,14].
A recent review examined the effects of high temperatures on the grapevine’s physiology [14]. According to the references cited by the review, the first process directly affected by increased temperature is net photosynthesis (Pn). On the one hand, the lower Pn may be related to a lower gs, as high temperatures usually promote WS. On the other hand, high temperatures cause severe damage to Photosystem II (PSII) due to a decline in chlorophyll content and injury to the thylakoid membranes. In addition, leaf transpiration rate (E) showed a linear increase with increasing temperature up to 40 °C in most studies cited by the review. However, no additional effect on E was detected when the environmental temperature increased above 40 °C. Finally, gs does not appear sensitive to high temperature, and changes in gs when WS is combined with high temperature are attributed only to WS. Soar et al. [15] suggested that the anisohydric behaviour of some varieties may serve as an adaptive strategy to cope with increasing temperatures. They showed that Shiraz promoted a sustained gs and an unaltered berry growth under field conditions with manipulated high temperatures. Recently, Faralli et al. [16] reported that the lower stomatal sensitivity of Shiraz might support leaf heat dissipation under fluctuating environmental conditions. However, Lehr et al. observed that WS under high temperatures dramatically reduced gs regardless of isohydric or anisohydric behaviour [17].
Research should focus on WS under high temperatures, as grapevine response to WS may be different than under lower temperatures [18]. For example, Rizhsky et al. [19] proved that the physiological response of plants to WS under extreme temperatures led to the inhibition of Pn but the enhancement of respiration.
In recent years, new sensing technologies have been explored to assess the physiological response to environmental conditions. For example, hyperspectral-based technology has increasingly been used for non-destructive, in-depth analysis of grapevine status, such as water status and physiological behaviour under stress. Poblete et al. [20] used the reflectance retrieved from multispectral images to develop artificial neural network models to predict WS spatial variability in Carménère. Previously, Diago et al. [21] developed neural network models based on hyperspectral images to assess grapevine (cvs. Cabernet Sauvignon, Grenache, Tempranillo) leaf water content. Moreover, the hyperspectral signatures of Cabernet Sauvignon leaves under WS were correlated to Ψleaf under controlled conditions [22]. Similarly, the thermal response of grapevine to WS was used for large-scale monitoring [23]. Within the vegetation indices (VIs) retrievable from thermal imaging, the crop water stress index (CWSI) was considered a reliable predictor of stem water potential (Ψstem) and gs [24]. Thus, developing studies to understand grapevine hyperspectral and thermal responses to abiotic stresses may help implement alternative sensing technologies for detecting early changes in plant physiology in response to dynamic environmental conditions, particularly under climate change. Finally, despite the critical need for developing new vineyard management adaptation strategies to climate change, there is a lack of studies characterising the behaviour of near-isohydric and near-anisohydric varieties under rising temperatures.
In this study, we wanted to test the hypothesis that the response of grapevine to WS under high temperatures may differ from that under lower temperatures. The objectives were to: (i) evaluate the physiological responses of Vitis vinifera L. cv. Grenache and Shiraz to WS under temperatures of varying intensity and, (ii) based on leaf spectral reflectance, identify hyperspectral and thermal VIs that could be reliable indicators of WS under high temperatures. The methodological approach and the results of this study may assist vineyard management choices under future climate change scenarios.

2. Materials and Methods
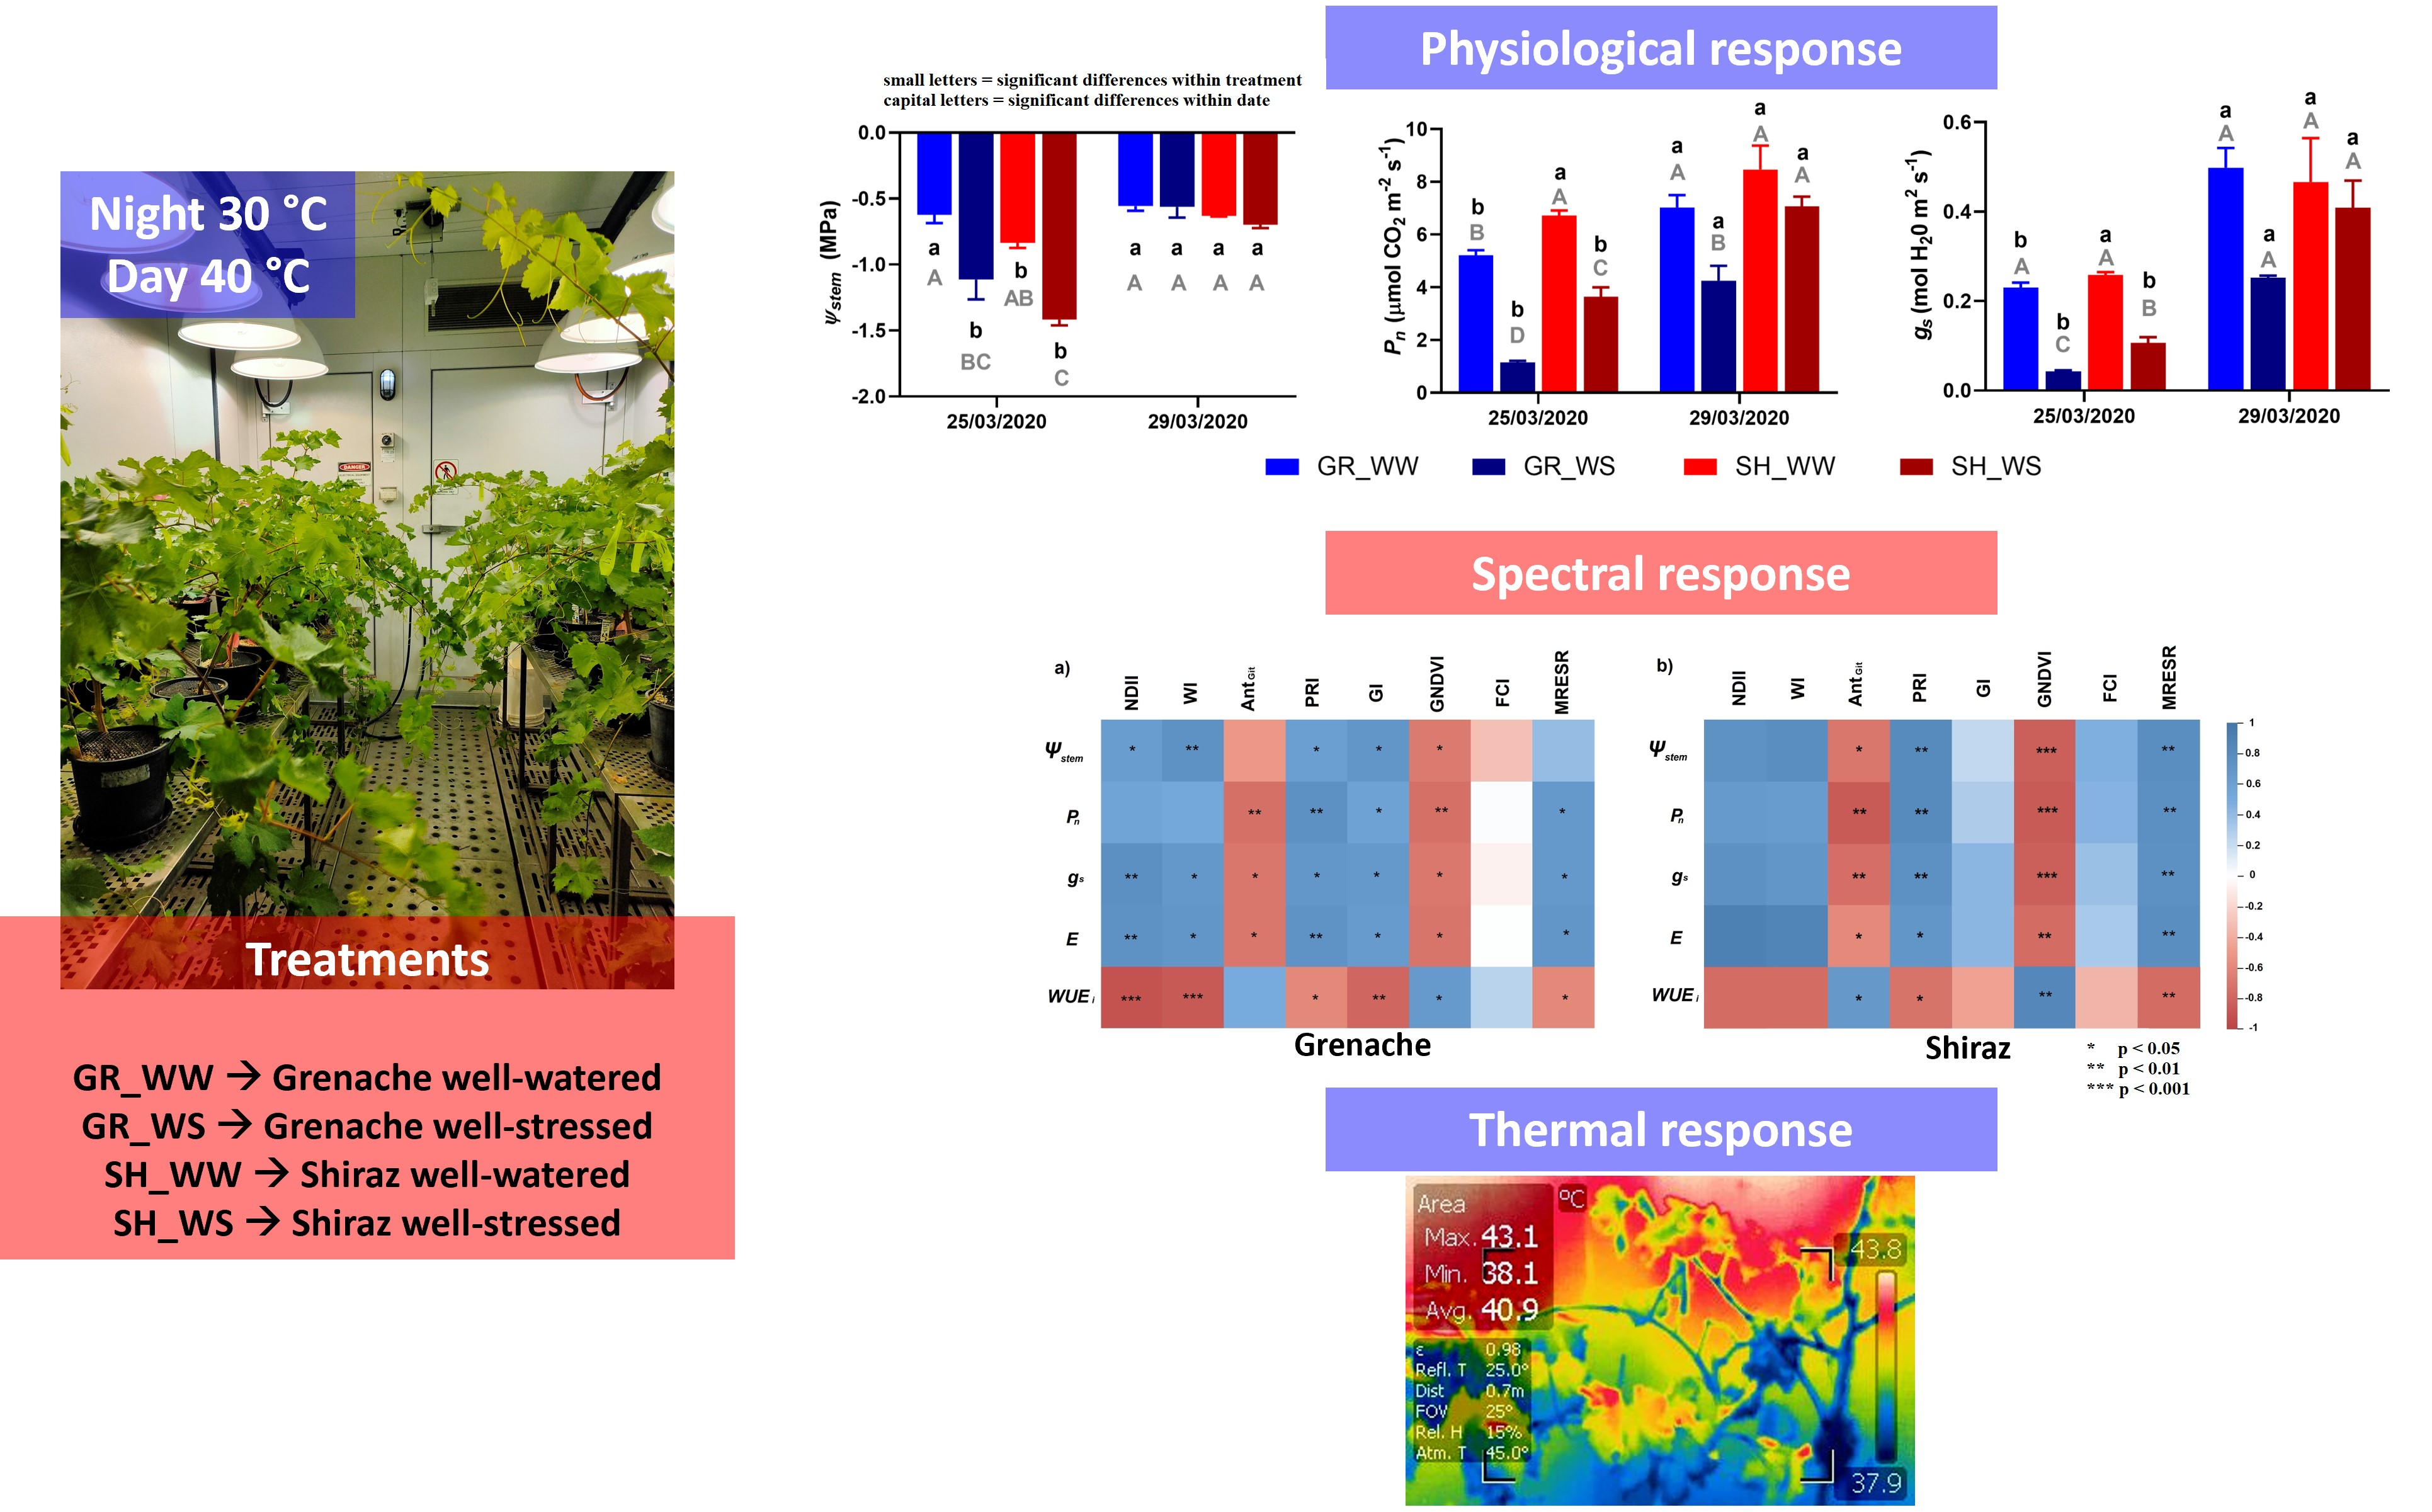
The experiment was carried out in 2020 on the Waite Campus of The University of Adelaide, located in Urrbrae (Adelaide), South Australia (34°58′17′′ S, 138°38′23′′ E). Six 2-year-old grapevines each of the varieties Grenache and Shiraz were grown in 4.5 L pots in a substrate composed of a mixture of 50% of UC (University of California, Davis, CA, USA) soil mix (61.5 L sand, 38.5 L peat moss, 50 g calcium hydroxide, 90 g calcium carbonate) and 50% vermiculite and perlite. The vines used in the experiment were comparable in vigour and did not present any visual signs of damage or deficiency. The vines were spur pruned to two spurs with two nodes per spur, treated against pathogens, well-fertilised, and grown in a glasshouse providing daily irrigation to 110% of field capacity. The liquid soil fertiliser Megamix (13:10:15 N:P:K plus trace elements; Rutec, Tamworth, NSW, Australia) at a concentration of 1.6 mL L−1 was applied weekly after the development of the first adult leaf. When the vines had 12–14 leaves per shoot (two shoots retained per vine), the inflorescences were removed to maintain the plants in a vegetative state and the vines moved to a controlled environment room (CER; Phoenix-E, Camarillo, CA, USA).

2.1. Treatments

In this experiment, we aimed at simulating a current extreme event that may become more frequent or even the norm in the future in several viticultural areas where heatwaves frequency and duration are projected to increase. As the combination of high temperature and WS may limit photosynthesis rates and photo-oxidative damage [25], irrigation was assumed to be the norm in our experiment during high-temperature days. Therefore, well-watered (WW) vines under high temperatures were defined as the “control” group. This choice is because only one controlled environmental room (CER) was available for this experiment.
The physiological, spectral, and thermal response to WS of two varieties exhibiting different behaviour under stress was examined.
The experiment was arranged as a completely randomised design with three replicates per treatment. On 13 March 2020, the vines were moved from the glasshouse to the CER to allow them to acclimate. During acclimation (13–17 March), the average temperature, relative humidity (RH), and VPD were 25.5 °C, 48.8%, and 1.7 kPa, respectively. Initially, the vines were irrigated to field capacity based on the pot weight: the pots were weighed every morning to bring them back to their original weight by irrigation. The soil moisture was determined with a soil moisture sensor (Teros-12, METER, Pullman, WA, USA). On 17 March, WS was imposed on half of the vines (three vines of Grenache and three of Shiraz). WS was obtained by completely withholding irrigation. The remainder of the vines were maintained under well-watered conditions, i.e., at field capacity. To irrigate at field capacity, the pots were daily weighed, and water was added to bring them back to their original weight, i.e., the weight of the first day of the experiment. In this study, the WW and WS treatments were defined by the average volumetric water content, as reported in Table 1. On the night of 20 March, when soil moisture of the WS vines was lower than 3%, the temperature in the CER was increased, setting the day and night temperatures at 40 °C and 30 °C, respectively, with a 12-hour day (700–1900 h) and 12-hour night (1900–700 h). These higher temperatures were imposed for five days until 25 March. Following this, the vines were moved back to the glasshouse for recovery at ambient conditions. The average temperature, RH and VPD were 25.9 °C, 50.4% and 1.7 kPa (26–29 March), respectively, and all vines were irrigated to field capacity. Air temperature and RH were constantly monitored throughout the experiment using a data logger (Tinytag Plus 2 TGP-4500 dual-channel; Gemini data loggers, Chichester, UK) placed at a mid-canopy height.
In this study, the WW and WS treatments were defined by the average volumetric water content, as reported in Table 1.

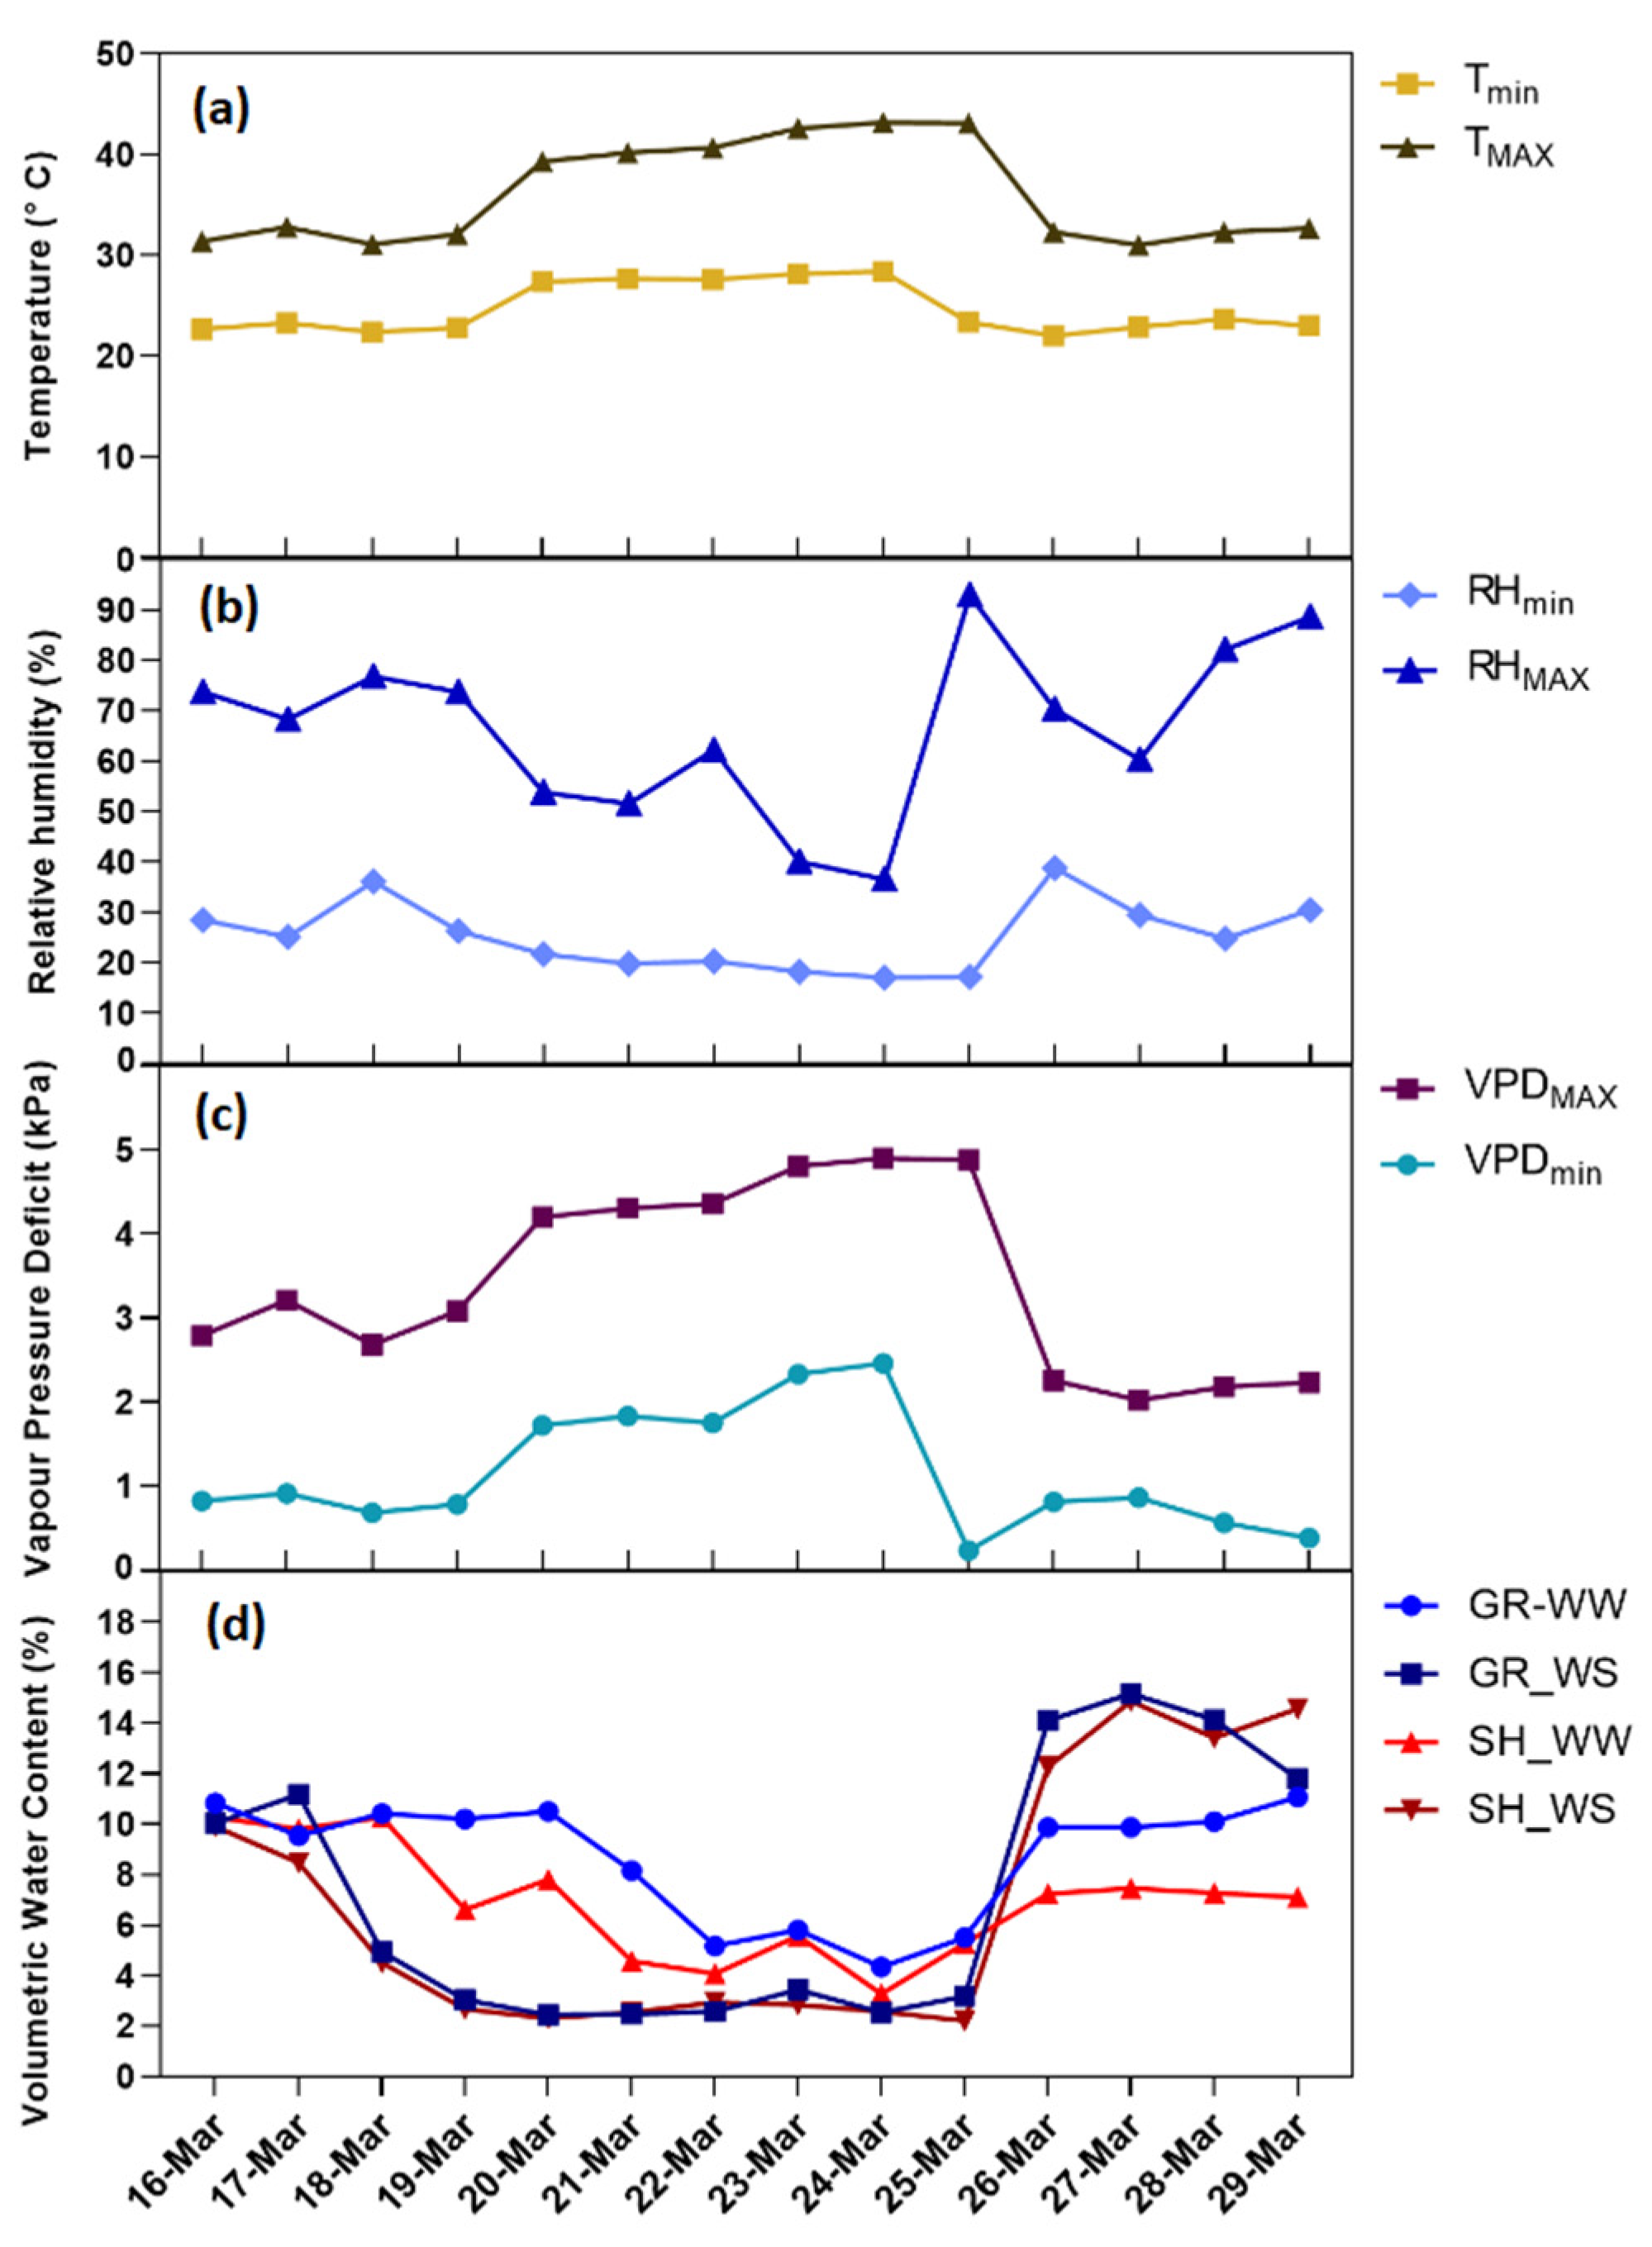
2.2. Environmental Conditions

During acclimation of the potted grapevines in the glasshouse, the daily maximum temperature did not exceed 33 °C, and the daily minimum temperature was not lower than 22.5 °C. The average RH (night + day) was about 48%, thus leading to maximum VPD values lower than 3 kPa. On 20 March, the CER was programmed to a 12 h day temperature of 40 °C (700 h–1900 h) and 12 h night temperature of 30 °C (1900 h–700 h). Figure 1a shows the temperature trend during the experiment. Concurrently with temperatures increasing, RH decreased, reaching minimum values of approximately 10% (Figure 1b). VPD values (Figure 1c) increased up to 4.9 kPa. When the vines were moved to the glasshouse for recovery, the environmental conditions were similar to the ones observed during acclimation (average daily maximum and minimum temperatures 32.1 and 22.9 °C, respectively, average RH 50%, average VPD 1.7 kPa).

2.3. Soil Moisture

The variation of the soil moisture for the four treatments during the experiment is shown in Figure 1d. The VWC values dropped to around 2% after WS imposition. The soil moisture values were slightly higher in Grenache than in Shiraz, both under WW and WS conditions.

2.4. Physiological Measurements

Physiological measurements were carried out on two dates: 25 March, corresponding to WS under high temperatures, and 29 March, corresponding to four days after stress. The values of stem water potential ( Ψ stem) were measured on one expanded and mature leaf per vine using a Scholander-type pressure chamber (M 1505D-EXP; PMS Instruments, Albany, OR, USA). Leaves were covered with an aluminium foil-coated plastic bag for 60 min before measurement to allow Ψ stem to equilibrate. After the leaves were removed from the vines, the readings were taken within 30 s from leaf excision.
The values of gs, Pn, E, and intrinsic water-use efficiency (WUEi) were detected using a portable infrared gas analyser (IRGA; LI-6400XT; LI-COR, Lincoln, NE, USA). The IRGA leaf cuvette (area: 6 cm2) was set as follows: photosynthetically active radiation (PAR) 1500 µmol m−2 s−1, reference (CO2) 400 ppm, flow rate 500 µmol s−1, and sample RH range between 30–40%. The measurements were performed between 1000–1500 h for each reference date on the first fully expanded mature leaf from the middle third of the shoot.

2.5. Hyperspectral Measurements

A portable high-resolution spectroradiometer (ASD FieldSpec® 3; Analytical Spectral Devices, Boulder, CO, USA) was used to acquire the diffuse reflectance spectra of the vines. Three vines per treatment were measured three times for single leaf radiances and averaged per treatment. Reflectance was taken on the same leaves selected for IRGA measurements. Thus, 36 spectral measurements in total and nine spectral measurements for each treatment were performed. The spectroradiometer was configured to average 20 readings automatically per sampling. The instrument was provided with the default contact probe for active sensing, allowing the recording of the solar spectral irradiance (350–2500 nm) with different resolutions for the visible-near infrared (VNIR, 350–1000 nm; 3 nm resolution) and the short-wave infrared (SWIR, 1000–2500 nm; 8 nm resolution). A white Lambertian reference panel (Spectralon® disc; Analytical Spectral Devices, Boulder, CO, USA) served as the reference standard for calibration. The dark reference acquisition was obtained using a closed cuvette without light.
The raw spectral data were extracted using the RS3TM dedicated software provided with the instrument.
The VIs reported in Table 2 were derived from the raw spectral data imported into R statistical software (Version 3.5.2, RStudio Version 1.2.1335). The hyperspectral measurements were carried out simultaneously with the physiological measurements on the same leaves.

2.6. Thermal Measurements

A thermal infrared camera (FLIR® T-series, Model B360; FLIR Systems, Portland, OR, USA) was used to acquire images on the reference dates. The camera has a resolution of 320 × 240 pixels, and its uncooled bolometer measures temperature between −20 and +120 ± 2 °C. The images were acquired at a constant distance of 2.5 m from the vines. One leaf sprayed with water and one coated with petroleum jelly (on the abaxial side) per vine were used as wet (Twet) and dry (Tdry) references, respectively. Twet and Tdry correspond to a fully transpiring leaf (stomata open) and non-transpiring leaf (stomata closed), respectively. Twet and Tdry were measured 30 min after applying petroleum jelly and 20 s after spraying. The canopy temperatures detected by the camera (Tcanopy) were elaborated with FLIR TOOLS software, version 5.13 (FLIR Systems © 2022) and used to compute the Crop Water Stress Index (CWSI) [34] of the whole canopy as well as the top and bottom halves of the canopy separately. The measurements were carried out on the same dates as the physiological monitoring.

2.7. Statistical Analyses

Data collected were subjected to outlier removal following the method developed by Hansen et al. [35]. Moreover, the normality of data was assessed using the Kolmogorov–Smirnov nonparametric test. The physiological and spectral behaviour of the four treatments on the two reference dates was compared with one-way ANOVA separating means with Tukey’s least significant differences (LSD) test at 5% significance. Moreover, the time effect within each treatment was assessed to analyse the effects of WS and the capability of the vines to recover within four days. The analysis was carried out using unpaired two-tailed t-tests separating means with Tukey’s LSD test. To better understand the trend of the stressed vines relative to the unstressed ones, we calculated the relative CWSI (referred to henceforth as CWSIr) as the ratio of the CWSI of the stressed treatments and that of well-watered vines.
Pearson’s product–moment correlations were evaluated between the different categories of spectral VIs, CWSIr, and the physiological parameters. The analyses were conducted using GraphPad Prism 8.0.0 (GraphPad Software, Inc.; La Jolla, CA, USA) software.
Regression analysis was used to study the relationships between the dependent variables (physiological parameters: Pn, gs, Ψ stem, E, WUEi) and the independent variables (hyperspectral VIs and CWSI) of the two grapevine varieties. Regression analysis was performed with the statistical software Statgraphics 16 (StatPoint Technologies Inc., Warrenton, VA, USA). We used Statgraphics “comparison of alternative models” tool for the best model selection, which compares twenty-seven different-fitting models and retains only the best-performing model. The performance of the best-fitting model was evaluated using standard evaluation metrics, namely coefficient of determination (R2), root mean square error (RMSE), mean absolute error (MAE), and significance (p) value.
The dataset used for the statistical analysis was comprehensive of both the 25 and 29 March measurements.

3. Results

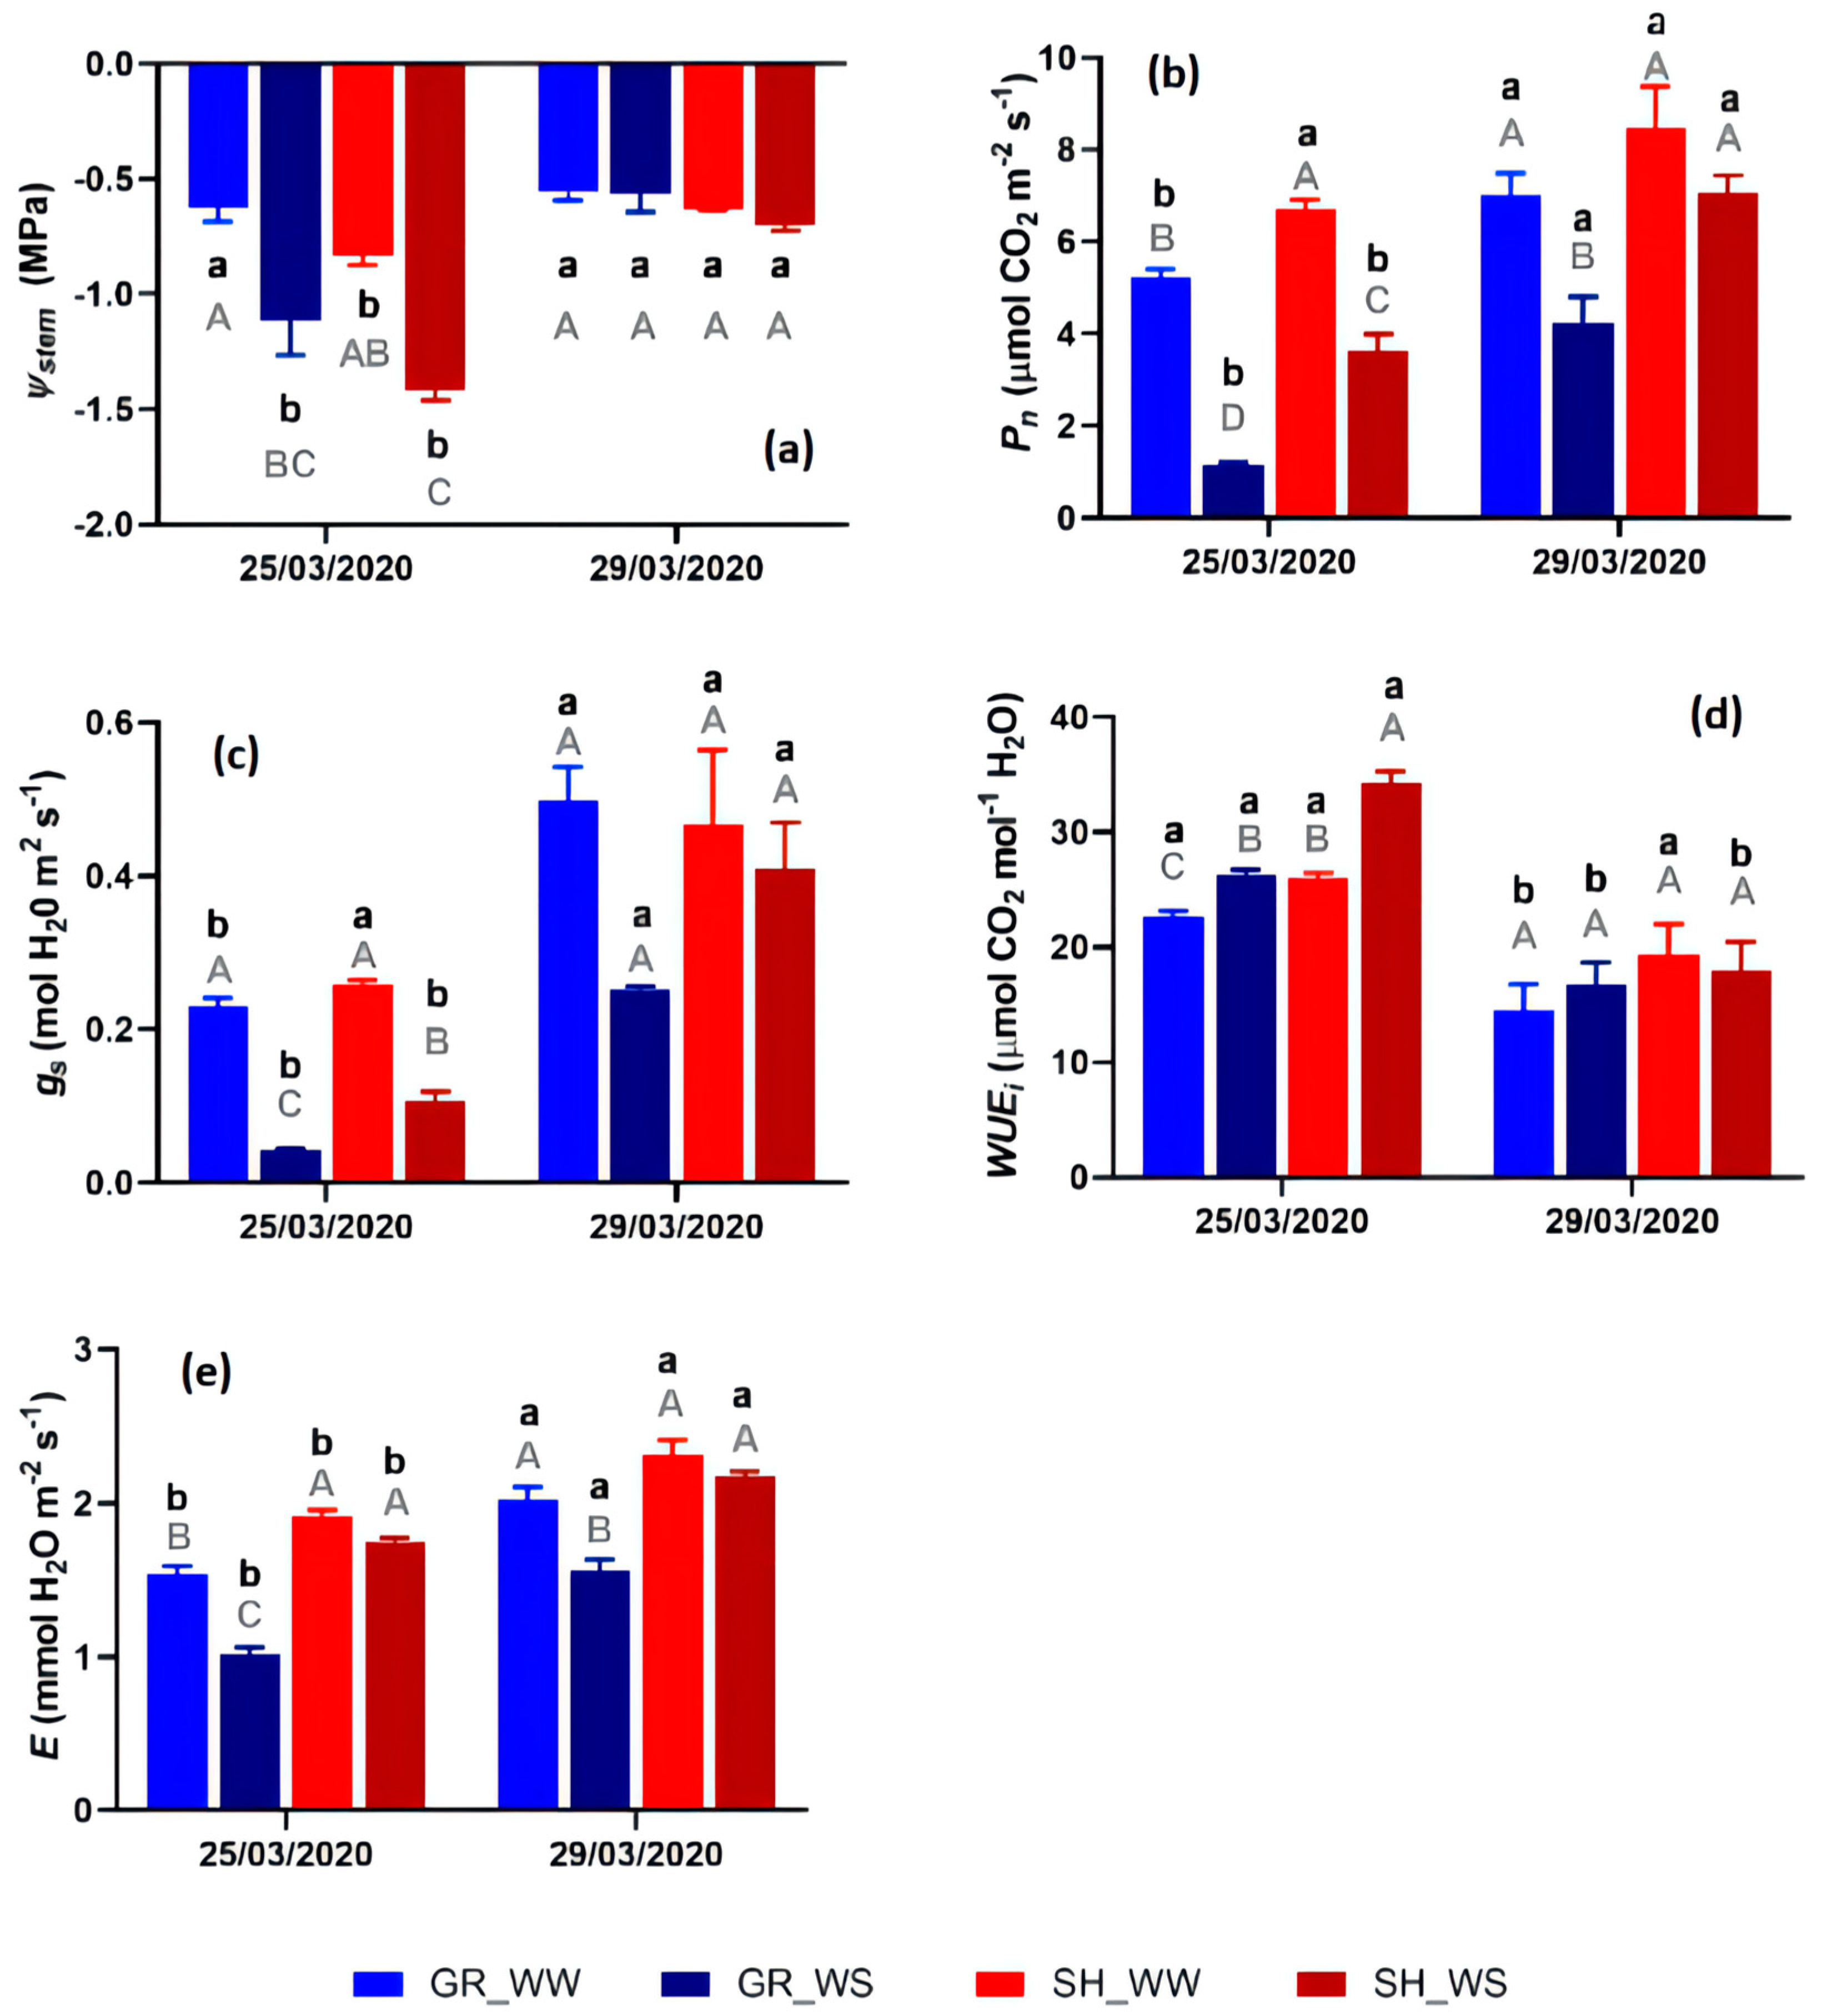
3.1. Grapevine Physiological Responses

The temporal trend of the physiological parameters within each treatment (Figure 2, small black letters) showed that both GR_WS and SH_WS reduced their physiological performance under water deficit. Regarding the WW-ed treatments, the high-temperature conditions influenced the GR_WW behaviour. Besides Ψ stem (Figure 2a), the physiological indicators were significantly different on the first date compared to the recovery on 29 March. On the other hand, SH_WW showed a decline in Ψ stem and E under high temperature (Figure 3a,e) although irrigation allowed maintenance of relatively constant Pn, gs, and WUEi (Figure 3b–d). Comparing the treatments within the same date (Figure 2, capital grey letters) we assessed the influence of the variety and the irrigation conditions on the physiological behaviour. Figure 2a shows that the two varieties did not exhibit significantly different Ψ stem when irrigated during hot days, whereas both GR_WS and SH_WS showed lower Ψ stem. Both varieties experienced significantly lower Pn under WS (Figure 2b). Overall, SH_WW showed the highest Pn, followed by GR_WW. The treatment exhibiting the lowest Pn was GR_WS. Under high temperatures, GR_WW and SH_WW showed similar gs. In both varieties, the WS treatments resulted in lower gs. The treatment experiencing the lowest gs was GR_WS (Figure 2c). Regarding WUEi, WS induced a significant increase in both varieties (Figure 2d). Finally, under high temperature, E did not change in Shiraz, while it decreased in Grenache (Figure 2e). On 29 March, after recovery, most of the differences between treatments were resolved except for Pn and E, which were not recovered in Grenache (Figure 3b,e).

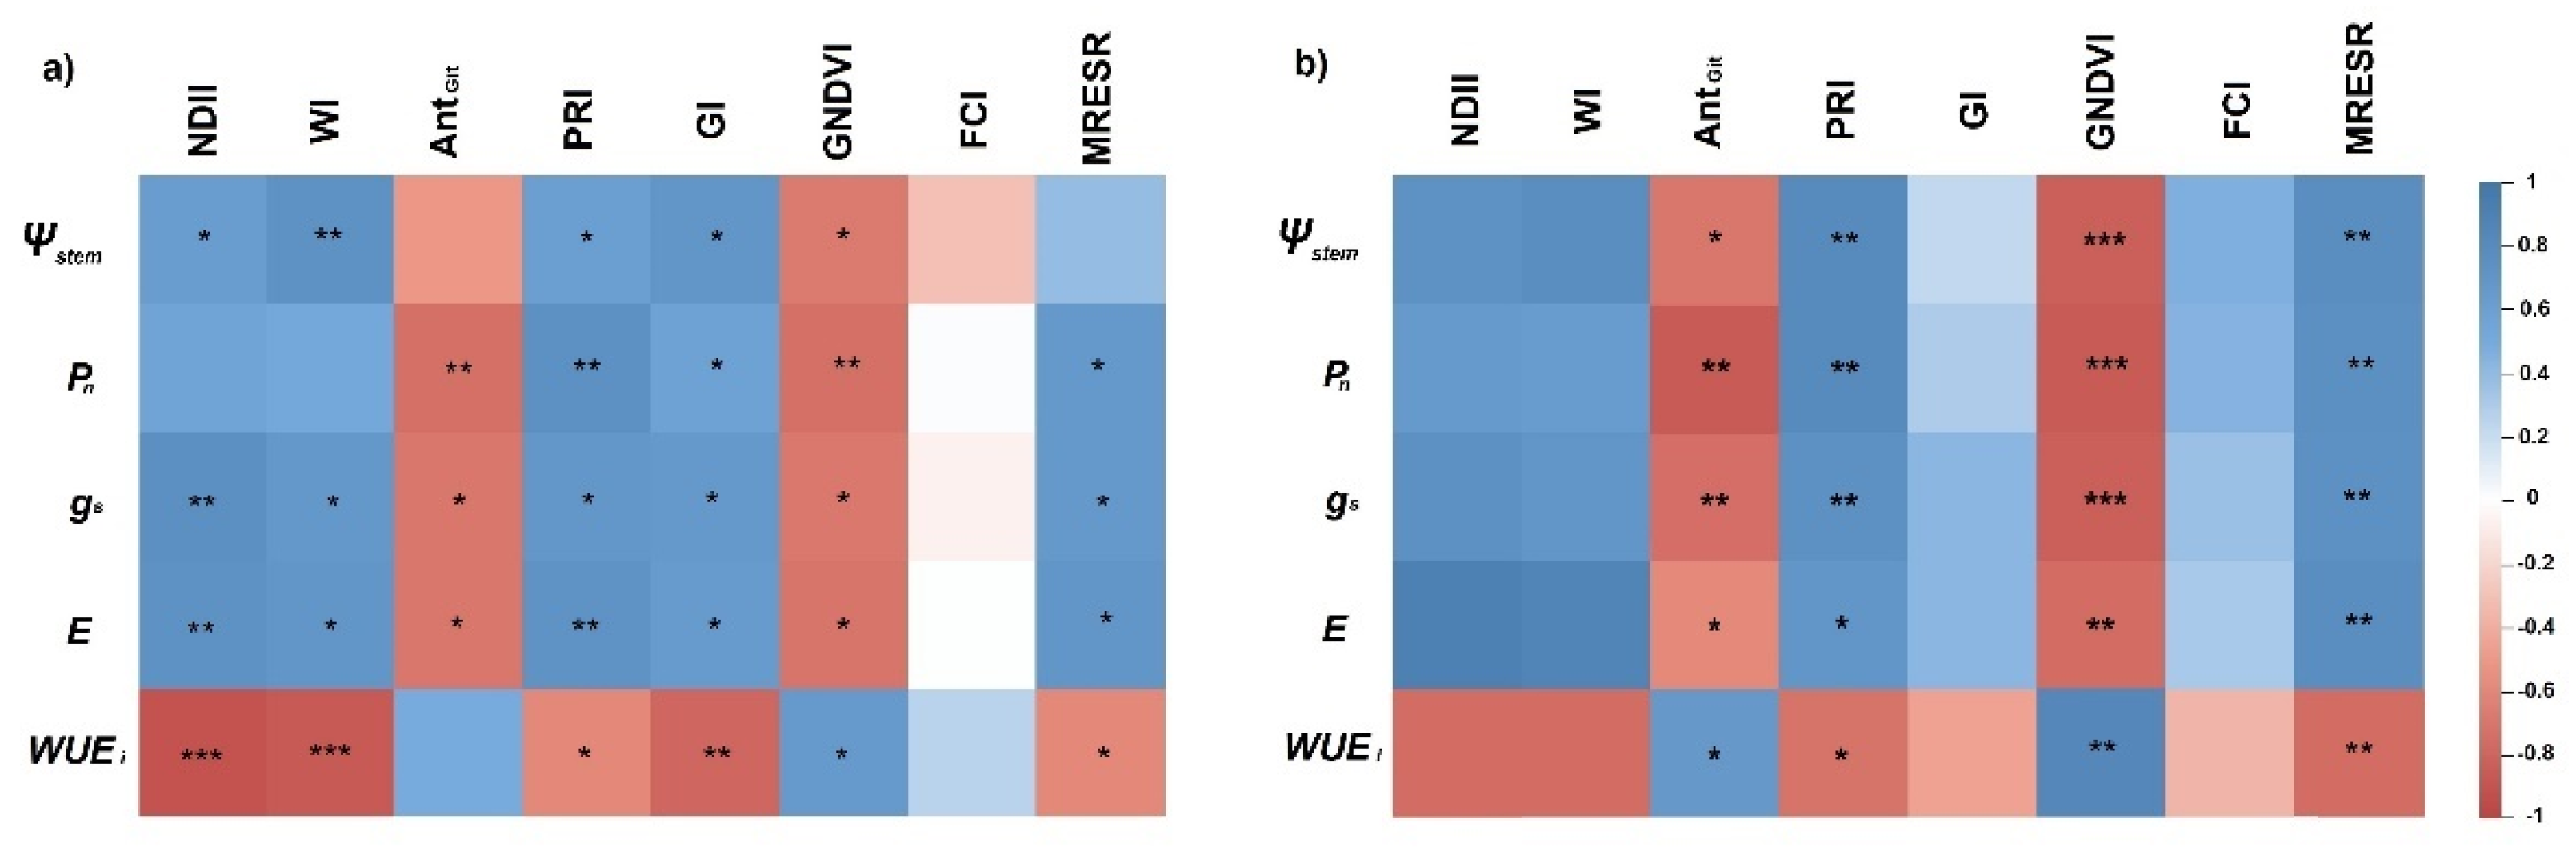
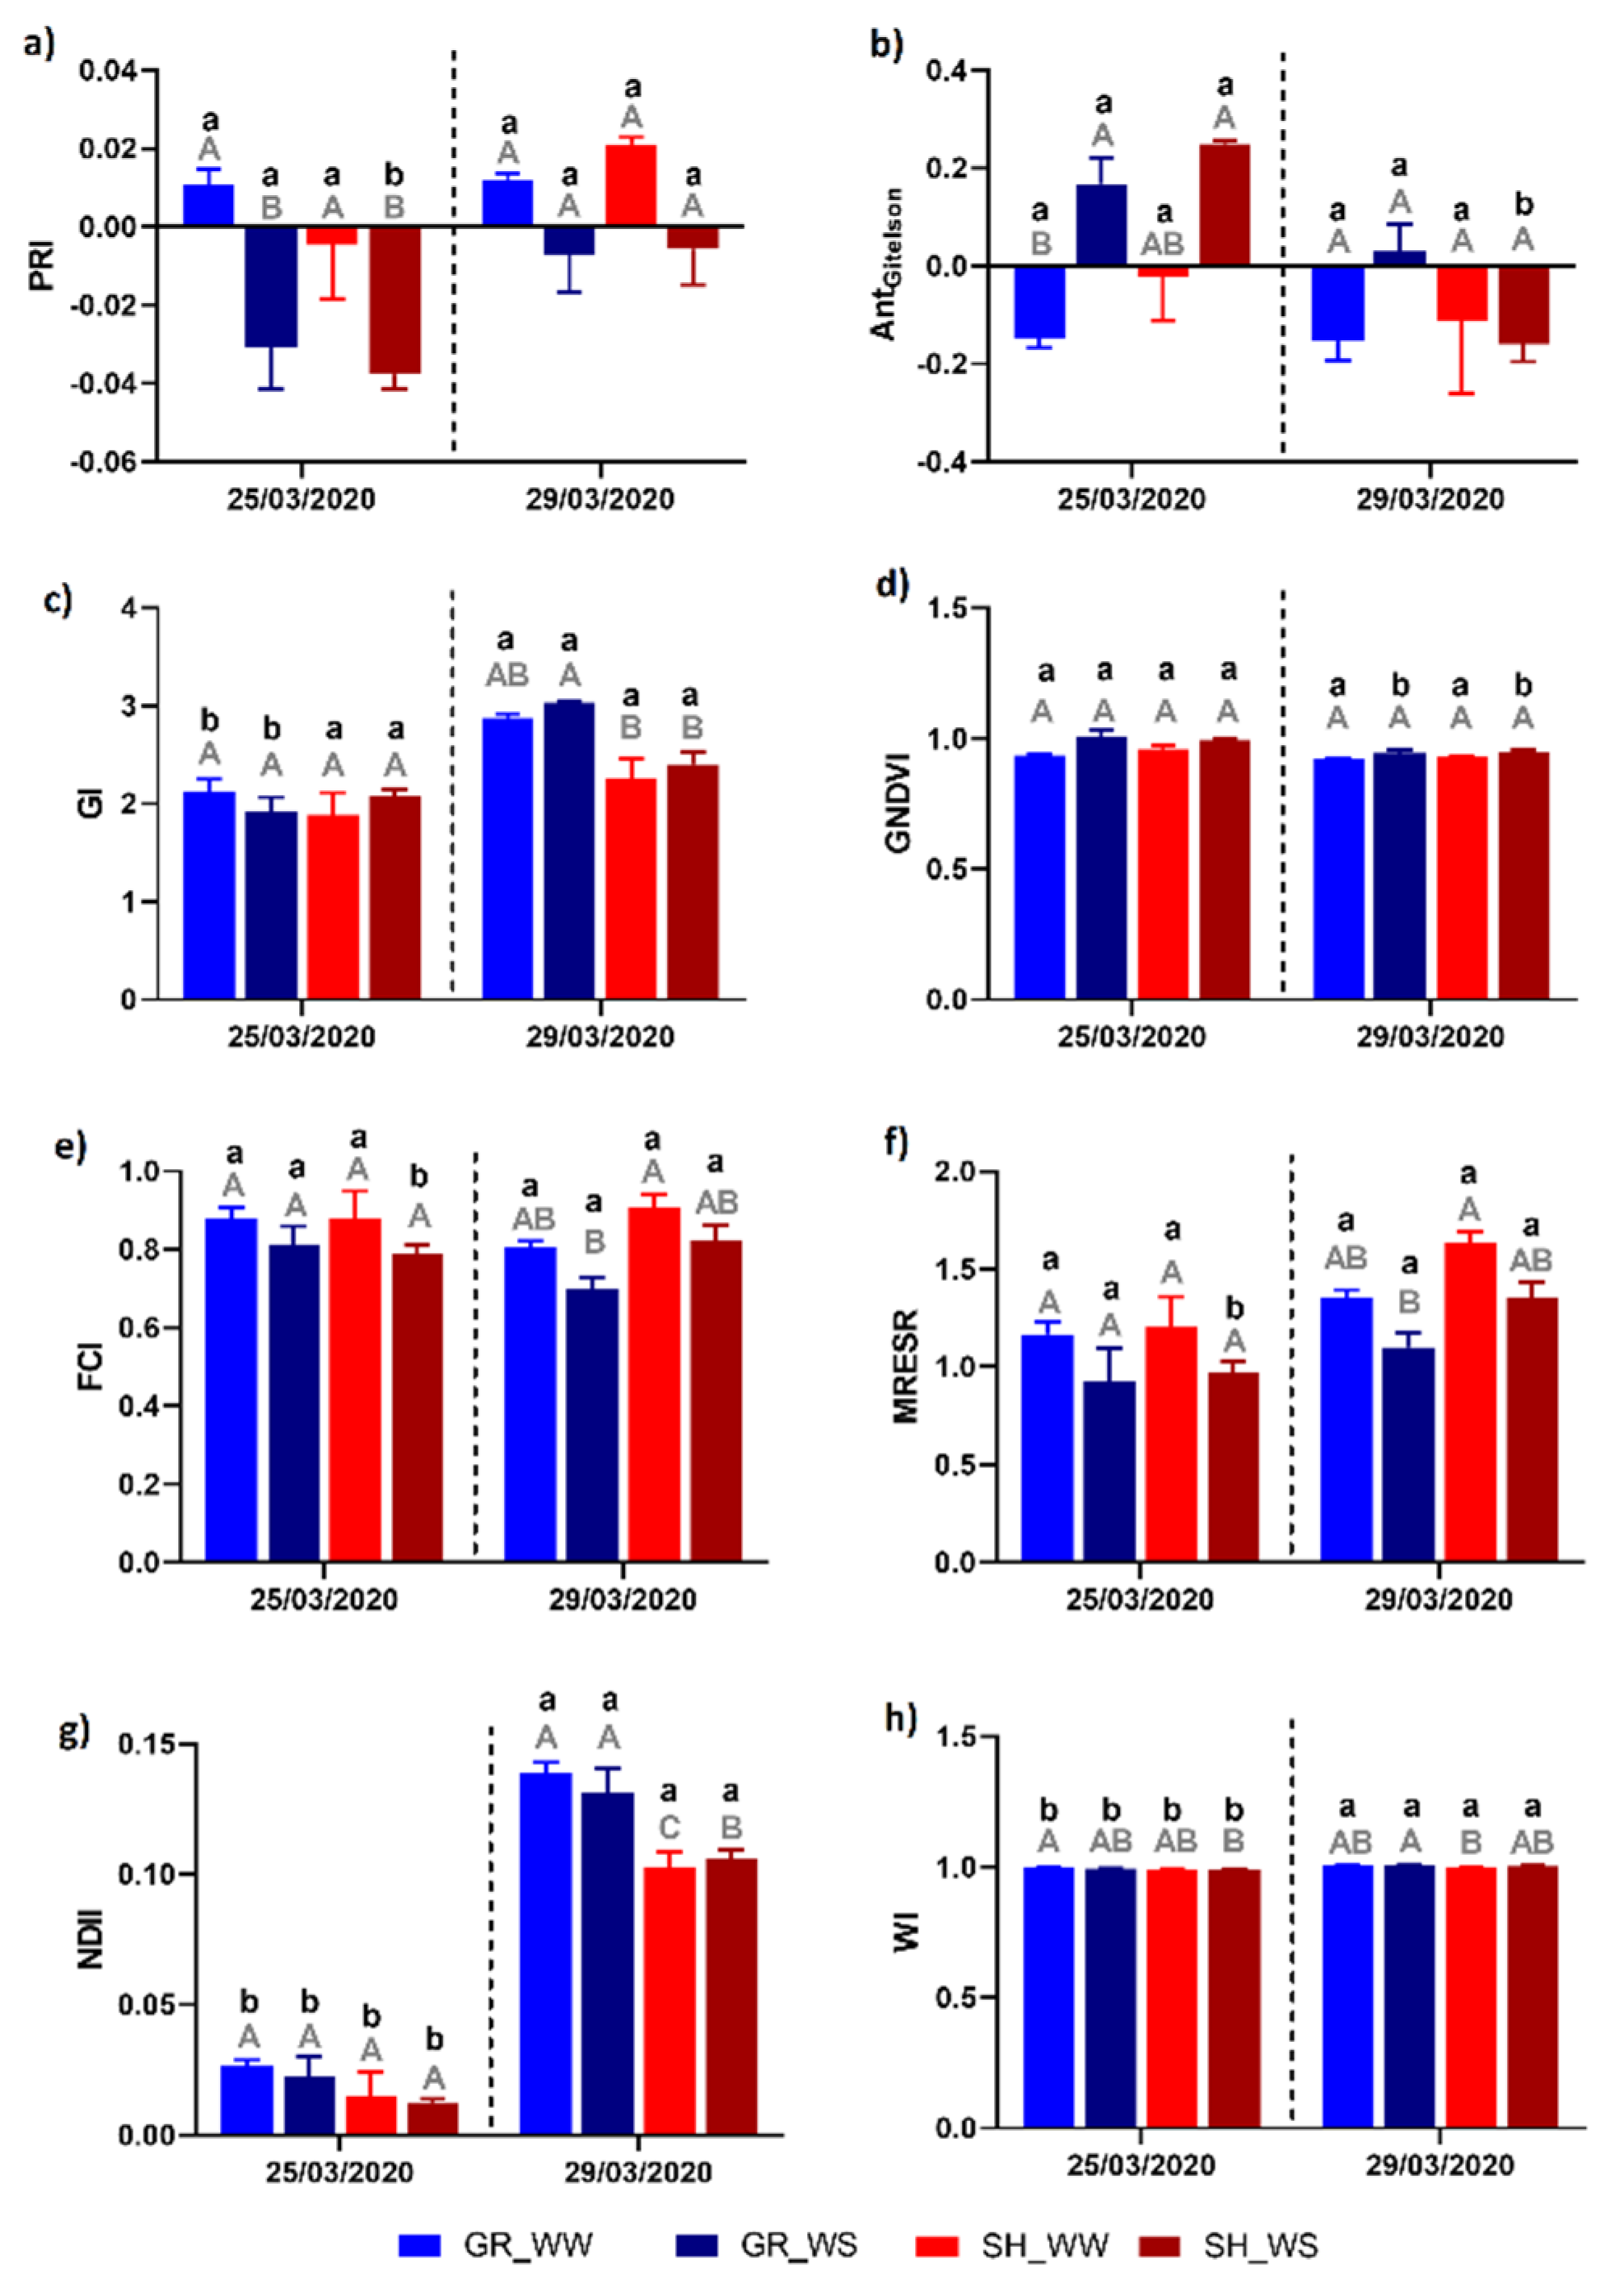
3.2. Hyperspectral Response

The correlation analysis between the VIs and the physiological parameters is reported in Figure 3. The pigment VIs exhibited good correlations with most physiological indicators. Specifically, AntGitelson showed negative correlations with Pn, gs, and E and negative correlation with WUEi, while PRI exhibited an opposite trend. Within the structure VIs, GI was only capable of tracking the physiological behaviour of Grenache, while GNDVI provided significant negative correlations with the physiological parameters (positive with WUEi). Within the physiology VIs, FCI was not a good indicator of the physiological status, while MRESR was a good predictor of most physiological parameters in both varieties. Finally, the water VIs (NDII and WI) showed significant positive correlations with Ψ stem, gs, and E in both varieties and negative correlation with WUEi.
The analysis of the temporal trend of the VIs is reported in Figure 4. Both pigment VIs exhibited significant differences over time only for SH_WS (Figure 4a,b). Regarding the structural VIs (Figure 4c,d), GI was significantly lower during the hot days in both GR_WW and GR_WS. GNDVI was sensitive to WS in both varieties. The physiological VIs (Figure 4e,f) showed that only SH_WS differed between the two dates. However, the water VIs (Figure 4g,h) showed significantly lower values during hot days for all treatments.

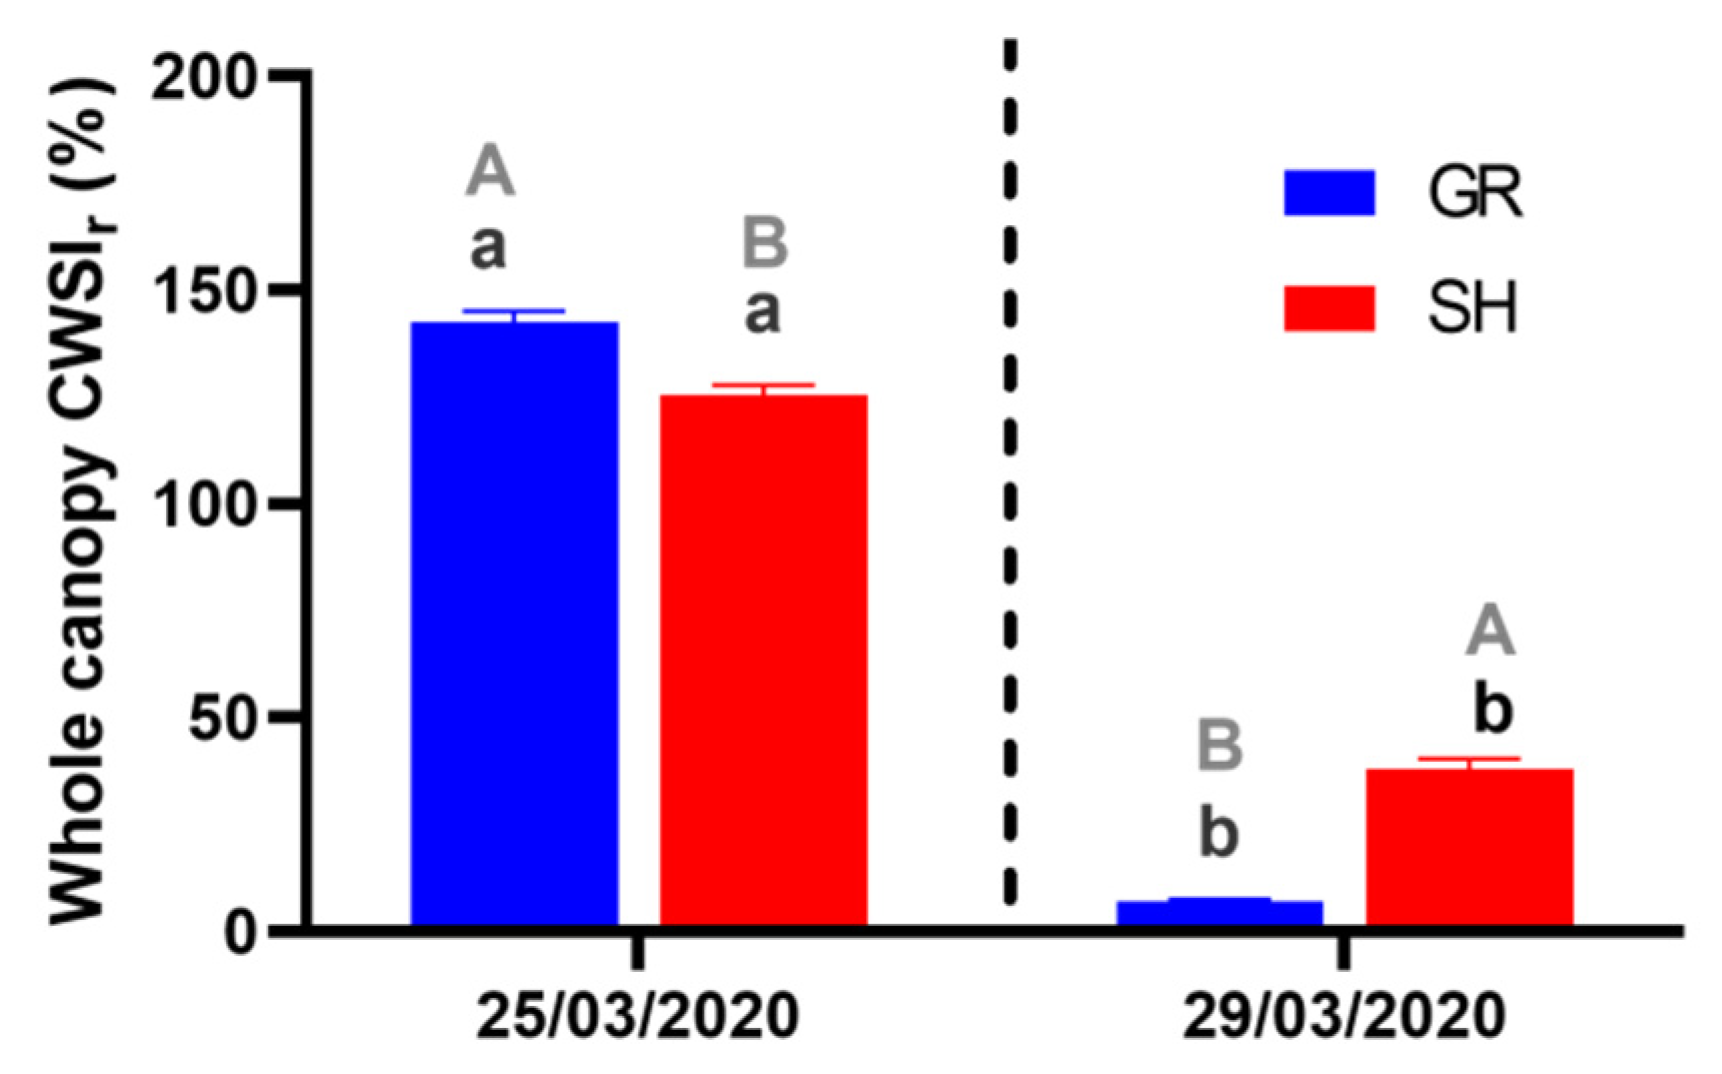
3.3. Canopy Temperature

The correlations between the CWSI and the physiological parameters (Table 3) were very similar for the whole, bottom, and top canopy. In Grenache, the thermal response correlated significantly only with Ψ stem (negative correlation) and WUEi (positive correlation). However, in Shiraz, the correlations were highly significant. Specifically, the correlations were negative with Ψ stem, Pn, gs, and E and positive with WUEi.
Figure 5 reports the thermal response of the four treatments in terms of CWSIr. For the sake of simplicity, only the ratios measured for the whole canopy are reported. However, the results for the top and bottom canopy were very similar (data not shown). During WS, the CWSIr were significantly higher than after recovery. The comparison within the same date showed that during WS, the ratio between water-stressed and well-watered vines was significantly higher in Grenache than in Shiraz. However, after recovery, the ratio was significantly higher in Shiraz.

3.4. Relationship between VIs and Physiological Parameters of Grenache and Shiraz

We used linear and nonlinear regression analysis to investigate the relationship between physiological parameters and VIs of Grenache and Shiraz subjected to different treatments. The performance of the estimation models for physiological parameters assessment with VIs is reported in Table 4. The performance was assessed using the evaluation metrics R2, RMSE, and MAE of the different regression relationships.

3.4.1. Physiological Parameters Estimation with VIs in Grenache

WI exhibited the best relationship with Ψ stem of Grenache with the highest R2 value and lowest RMSE.
For the estimation of Pn and gs, PRI had the highest R2 and lowest RMSE. WI exhibited the best accuracy for estimating E and WUEi.

3.4.2. Physiological Parameters Estimation with VIs in Shiraz

In Shiraz, WI exhibited the best relationship with Ψ stem.
The R2 of the relationships between PRI and AntGitelson with Pn were very close. However, compared to AntGitelson, PRI performed best, as it exhibited higher estimation.
PRI also performed best in estimating gs, while WI and NDII had similar performance in estimating E. Finally, WI exhibited the best relationship with WUEi with a high R2 and low RMSE and MAE.
For both Grenache and Shiraz, the WI was the best index to estimate the water status indicators such as Ψ stem, E, and WUEi, while PRI best estimated Pn and gs. It is noticeable that the R2 between the physiological parameters and the VIs assessed in this study were much higher for Shiraz compared to Grenache.

4. Discussion

4.1. Physiological Monitoring of Grenache and Shiraz under High Temperature

Grapevine’s strategy to cope with water shortage differs according to an isohydric or anisohydric behaviour despite the concept of isohydry being actively debated in the viticulture research community [10,36]. The physiological response of near-isohydric and near-anisohydric varieties is determined by the different stomatal regulations when a water deficit occurs. In this study, we tested the influence of different stomatal regulations on the response of Shiraz and Grenache to WS under a high-temperature environment. Prolonged periods with temperatures above the average have become common in several viticultural areas and are forecasted to increase in the future. Usually, during hot days, the vines undergo simultaneous WS. In most viticultural regions, the winegrowers compensate for the water loss with irrigation, which entails evaporative cooling and maintains the hydraulic status. However, the winegrowers aim at knowing to what extent deficit irrigation may be applied without causing vines damage and yield loss. Therefore, our study investigated the physiological, spectral, and thermal response of one near-isohydric and one near-anisohydric Vitis vinifera variety under WS in a warm, controlled environment.
When fully irrigated under high temperatures, the behaviour of the two varieties was slightly different. Although the two varieties did not exhibit significantly different Ψ stem and gs, GR_WW showed lower Pn, E, and WUEi, thus suggesting partial stomatal closure (Figure 2).
The behaviour of the two varieties under high temperature with non-limiting water availability may be explained by the higher stomatal sensitivity of Grenache than Shiraz, leading to stomatal closure at a less negative Ψ stem. Palliotti et al. [37] speculated that higher stomatal sensitivity prevents luxury water loss, allowing concurrent maintenance of acceptable photosynthetic rates under high temperatures. Homeostasis of Ψ stem, despite increased evaporative demand (Figure 1b) and consequent depletion of soil moisture (Figure 2), confirmed the conservative and relatively isohydric behaviour of Grenache. Our observations show that near-isohydric varieties such as Grenache are better adapted to high temperatures than near-anisohydric varieties under conditions of non-limiting soil moisture. However, under cooler temperatures, the physiological parameters of both varieties did not exhibit significant differences.
The imposition of WS had a negative impact on the physiological response of both varieties. However, the results reported in Figure 2 show that Shiraz displayed a slightly better reaction to WS. In particular, the average gs of GR_WS was 0.04 mol H2O m−2 s−1, whereas SH_WS reached 0.11 mol H2O m−2 s−1. According to Flexas et al. [38], the threshold of 0.05 mol H2O m−2 s−1 identifies the point at which metabolic limitations of photosynthesis occur.
Although Shiraz exhibited significantly higher E than Grenache, the decline in Pn was lower. Concurrently, WUEi was higher in Shiraz. The vascular (xylem) structure of near-isohydric varieties, consisting of fewer vessels with higher diameters [37], makes them more vulnerable to conduit damage and embolisms. Therefore, these varieties commonly adopt conservative behaviour via early stomatal closure under decreasing soil moisture. The drop of gs in Grenache under WS was related to its near-isohydric behaviour. In SH_WS, the decline was lower due to the maintenance of the stomatal aperture.
On the other hand, Pn decline is expected when the temperature is high, as Photosystem II (PSII) is the most heat-sensitive system in the grapevine, especially when the temperature exceeds 40 °C [14]. A radical drop of Pn under high temperatures was observed in both near-isohydric and near-anisohydric varieties [39,40]. It was previously shown that near-isohydric varieties respond to individual WS with higher Pn and WUEi, as their better electron transport capabilities serve as photo-protectants [41]. The results of the present study suggest that, under higher ambient temperatures, the physiological changes induced by temperature predominate on the expected response of varieties to WS.
Nevertheless, our results lead us to believe that Shiraz and Grenache exhibit different hydraulic behaviour under WS in a warm environment, based on different stomatal closures. In such conditions, the anisohydric behaviour may contribute to heat dissipation via transpiration-based cooling [14]. The relatively anisohydric behaviour of Shiraz led to only partial stomatal closure, thus limiting the decrease in Pn and thereby allowing for a faster recovery of the physiological function within four days from the end of WS. The inability of Grenache WS vines to rapidly recover Pn and E within four days was likely ascribable to the limited photosynthetic capacity after the damage induced by WS to the leaf’s photochemical apparatus.

4.2. Potential of the Thermal and Spectral Vegetation Indices to Detect Drought Stress in Grapevine

Observing Figure 5, the CWSI was a good indicator of the magnitude of WS in the two varieties; however, CWSI was unable to detect Grenache’s recovery failure after WS. On the other hand, CWSI showed to be a good predictor of the Ψ stem and WUEi in Grenache and all the physiological parameters in Shiraz (Table 3). Previously, other authors concluded that CWSI was a reliable predictor of Ψ stem of grapevines [42]. In this study, the reason why the correlations with Pn, gs, and E in Grenache were not significant was probably due to the limited leaf area available for imaging due to potential damage caused by WS. However, the trends reported in Table 3 may confirm the in-field usability of thermal imaging for detecting WS under high temperatures.
Numerous spectral VIs have been developed to capture the vegetation response to environmental conditions. Based on the spectral bands included in their equation, different VIs are sensitive to specific aspects of the vegetation. There are several classifications of the VIs, and a unique distinction does not exist. The VIs used in this study can be divided into four classes: pigment, structure, physiology, and water [43]; these classes explored the global response of the vines to WS. AntGitelson and PRI are considered indicators of pigments, e.g., leaf chlorophyll, changes and proved to be effective in tracking the dynamics of water-limited physiology and photosynthetic capacity [44,45]. GI and GNDVI are classified as structural VIs, capable of estimating the density and vigour of vegetation. Compared to other structural VIs, e.g., NDVI, these indices proved to be more sensitive in detecting WS, as they include the reflectance on the green band in their equations, thus evaluating leaf chlorophyll content [46]. MRESR and FCI are considered physiology VIs correlated with grapevine gs under WS [47,48]. Finally, NDII and WI are water VIs highly sensitive to leaf water content [49]. The simultaneous use of VIs of the former categories may allow understanding of the complete response of the vines to the imposed stress. Therefore, we used two VIs for each type and analysed their correlations with the physiological parameters and trends during the experiment.
Overall, the correlations between the VIs and the physiological parameters assessed in this study were promising (Figure 3). The pigment VIs (AntGitelson and PRI) showed significant correlations with the physiological parameters, especially for Shiraz. PRI was designed to detect the spectral signature of xanthophyll pigments implicated in the dissipation of excess light through non-photochemical quenching [50]. Moreover, it was selected to determine vegetation’s efficiency in using absorbed photosynthetic active radiation for photosynthesis [27]. Therefore, PRI proved to be sensitive to stress conditions [51] when, following our findings, Pn decreased significantly (Figure 4a).
Moreover, PRI detects the decrease of the chlorophyll-to-carotenoid ratio after the increase of carotenoids to protect plants from high temperatures [52]. In our study, the regression results revealed that PRI was the best index to estimate photosynthetic components such as Pn and gs. These findings support the hypothesis that PRI could be a reliable indicator of high-temperature tolerance and could serve as a spectral marker for future selection of grapevine cultivars, clones, and breeding lines (Table 4).
Under severe drought stress, the performance of PRI to track the photosynthetic activity is reduced due to leaf wilting, interconversion of xanthophyll pigments, interspecific differences in light-use efficiency, and changes in carotenoids/chlorophyll ratio [53]. However, our study observed good relationships between PRI and gs for Shiraz and Grenache subjected to different treatments. Therefore, it is plausible that in glasshouse experiments, where WS levels are mild and/or imposed for short periods, the effects of variation of canopy structure and pigment concentration on PRI are minimal. However, in vineyards, the spatial heterogeneity of canopy pigment concentration is considerable, and canopy size and structure usually decrease the sensitivity of PRI. To minimise this issue, usually, PRI is normalised using RDVI and the R700/R670 index [54].
As WS affects the leaf’s phenolic concentration and composition [55], we tested AntGitelson as a predictor of the pigmentation changes occurring in stressed vines. WS usually increases the anthocyanin content, whereas high temperatures restrain their biosynthesis. Therefore, WS may at least partially negate the effect of high temperature on (lowering) anthocyanin concentrations [14]. Our results show that WS during hot days AntGitelson increased (Figure 4b). For this reason, we assume that the high correlations between AntGitelson and the physiological parameters assessed in this study were mainly driven by WS. According to the regression analysis, it was not the best estimator within the VIs used in this study (Table 4). Therefore, AntGitelson should be used with other VIs for assessing the vines status under high temperatures, as leaf pigments may not be affected by the high temperatures.
Under high temperatures, the behaviour of structural VIs, GI, and GNDVI has not been adequately explored. However, with global warming threatening several viticultural areas, it is crucial to understand if WS in hot environments leads to canopy structural changes. This study assessed that GNDVI showed good correlations with the physiological behaviour in both varieties (Figure 3). However, Figure 4c,d show that the structural VIs did not exhibit significant changes during the experiment besides lower values in the Shiraz treatments after recovery. Structural changes are challenging to observe as well as tonality and hue. The hyperspectral technology tested in this experiment may represent a promising tool for detecting structural changes that are barely visible to the human eye.
Within the physiology VIs, FCI is a VI that proved to be sensitive to tracking relevant physiological parameters, such as the ratio between variable fluorescence and maximum (Fv/Fm) [30]. The value of this ratio corresponds to the maximum potential quantum efficiency of PSII when the (PSII) reaction centre is entirely open. Therefore, FCI may represent a sensitive predictor of the photosynthetic performance of the vines. However, in this study, FCI provided lower correlations with the physiological indicators than other VIs. Moreover, the temporal trend of FCI over the experiment did not follow the same trend as Pn (Figure 4e). However, it could discriminate the failure to recover Pn in GR_WS. In previous studies, MRESR proved to be a good predictor of Pn and gs [56]. Observing Figure 4f, we may assume that MRESR was sensitive to the former parameters, as it displayed a similar temporal trend over the experiment. The only significant difference highlighted with the statistical tests was between GR_WS and the other treatments after recovery. Moreover, according to Table 4, FCI and MRESR did not prove to be the best predictors for the physiological parameters during the experiment. Therefore, these physiological VIs need further experimentation before being considered reference VIs for assessing WS in hot environments.
Finally, the temporal trend of water indices, namely NDII and WI, showed their potential to discriminate WS in hot environments. These results were corroborated by the significant correlations between the VIs and the physiological parameters reported in Figure 3. The statistics reported in Figure 4g,h confirm that high temperatures increase evaporative demand, and vines in hot climates require additional irrigation water. However, NDII appeared more sensitive to the water changes after the recovery. The correlation and regression analyses showed that WI was particularly effective in tracking variations in E and WUEi. These results agree with those of Serrano et al. [57] on Vitis vinifera cv. Chardonnay potted plants subjected to varying soil water availability. Similarly, Peddinti et al. [58] found a good correlation between VIs derived from visible, near-infrared, and shortwave-infrared bands with WUEi, thus corroborating our results.
The results of the spectral analysis of the present study revealed that a combination of different VIs is crucial to evaluate the response of grapevine to WS under high temperatures. This study identified critical spectral bands, which we suggest be included in new VIs for early detection of WS. As recently suggested, it seems reasonable that the combination of VIs containing green, NIR, and red-edge bands is the most appropriate to capture the whole physiological response of the vines [59]. However, our analysis indicated that some of the VIs considered in this study were very not sensitive in detecting the effects of the two stresses or provided inconsistent results. Therefore, more research is needed to assess the best approach to adopting hyperspectral sensors for WS under a changing climate. Finally, we reported the results of some simple models for predicting the physiological responses of two grapevine varieties under drought stress (Table 4). Simple but accurate models arouse great interest for winemakers, land management, and policy making [60]. Therefore, the results of this study may be used to support stress management on a local to global scale.

5. Conclusions

We tested the physiological response of two varieties with near-isohydric and near-anisohydric behaviour under WS in a hot environment. Moreover, we used thermal and hyperspectral sensing technologies to track the physiological response. Our key results indicated that near-isohydric varieties could withstand high temperatures when irrigated, whereas anisohydric varieties can adapt to hot conditions even with limited water availability. We identified the pigment VIs (AntGitelson and PRI), GNDVI, and water VIs (WI and NDII) as the best indicators of the physiological behaviour of the vines under WS. CWSI was a strong predictor of Ψ stem.
The results of this study may address winegrowers’ decisions on irrigation and canopy management to mitigate against heat and WS. Moreover, our work introduced an integrated instrumental approach to analyse WS in hot climates that should undergo further field experimentation. Future field experiments should comprise other varieties and environmental conditions. Moreover, the findings of the sensing technologies may address the implementation of farmer-friendly instrumentation for stress detection and management.

Author Contributions

Conceptualization, A.C. and V.P.; methodology, A.C. and V.P.; software, A.C., V.P. and S.Y.Y.J.; validation, F.M. (Francesco Marinello), F.M. (Franco Meggio) and P.S.; formal analysis, A.C., S.Y.Y.J. and L.W.; investigation, A.C., S.Y.Y.J. and L.W.; data curation, A.C. and L.W.; writing—original draft preparation, A.C. and S.Y.Y.J.; writing—review and editing, A.C., S.Y.Y.J., V.P., F.M. (Francesco Marinello), F.M. (Franco Meggio), M.S. and P.S.; supervision, V.P. All authors have read and agreed to the published version of the manuscript.

Funding

This research received no external funding.

Institutional Review Board Statement

Not applicable.

Informed Consent Statement

Not applicable.

Data Availability Statement

The data presented in this study are available upon request from the lead author.

Conflicts of Interest

The authors declare no conflict of interest.

References

  1. IPCC. Climate Change—The Physical Science Basis. Contribution of Working Group I to the Sixth Assessment Report of the Intergovernmental Panel on Climate Change; IPCC: Paris, France, 2021. [Google Scholar] [CrossRef]
  2. Bureau of Meteorology. Available online: http://www.bom.gov.au (accessed on 9 December 2018).
  3. Perkins-Kirkpatrick, S.E.; Lewis, S.C. Increasing trends in regional heatwaves. Nat. Commun. 2020, 11, 3357. [Google Scholar] [CrossRef] [PubMed]
  4. Trancoso, R.; Syktus, J.; Toombs, N.; Ahrens, D.; Wong, K.K.H.; Pozza, R.D. Heatwaves intensification in Australia: A consistent trajectory across past, present and future. Sci. Total Environ. 2020, 742, 140521. [Google Scholar] [CrossRef] [PubMed]
  5. Pereira, S.C.; Carvalho, D.; Rocha, A. Temperature and precipitation extremes over the iberian peninsula under climate change scenarios: A review. Climate 2021, 9, 139. [Google Scholar] [CrossRef]
  6. Ruosteenoja, K.; Markkanen, T.; Venäläinen, A.; Räisänen, P.; Peltola, H. Seasonal soil moisture and drought occurrence in Europe in CMIP5 projections for the 21st century. Clim. Dyn. 2018, 50, 1177–1192. [Google Scholar] [CrossRef] [Green Version]
  7. Calderan, A.; Sivilotti, P.; Braidotti, R.; Mihelčič, A.; Lisjak, K.; Vanzo, A. Managing moderate water deficit increased anthocyanin concentration and proanthocyanidin galloylation in “Refošk” grapes in Northeast Italy. Agric. Water Manag. 2021, 246, 106684. [Google Scholar] [CrossRef]
  8. Schultz, H.R. Differences in hydraulic architecture account for near-isohydric and anisohydric behaviour of two field-grown Vitis vinifera L. cultivars during drought. Plant Cell Environ. 2003, 1393–1405. [Google Scholar] [CrossRef]
  9. Jones, H.G. Interaction and integration of adaptive responses to water stress: The implications of an unpredictable environment. In Adaptation of Plants to Water and High Temperature Stress; Turner, N.C., Kramer, P.J., Eds.; Wiley: New York, NY, USA, 1980; pp. 353–365. [Google Scholar]
  10. Hochberg, U.; Rockwell, F.E.; Holbrook, N.M.; Cochard, H. Iso/Anisohydry: A Plant–Environment Interaction Rather Than a Simple Hydraulic Trait. Trends Plant Sci. 2018, 23, 112–120. [Google Scholar] [CrossRef] [PubMed]
  11. Morabito, C.; Orozco, J.; Tonel, G.; Cavalletto, S.; Meloni, G.R.; Schubert, A.; Gullino, M.L.; Zwieniecki, M.A.; Secchi, F. Do the ends justify the means? Impact of drought progression rate on stress response and recovery in Vitis vinifera. Physiol. Plant. 2022, 174, e13590. [Google Scholar] [CrossRef] [PubMed]
  12. Soar, C.J.; Speirs, J.; Maffei, S.M.; Penrose, A.B.; McCarthy, M.G.; Loveys, B.R. Grape vine varieties Shiraz and Grenache differ in their stomatal response to VPD: Apparent links with ABA physiology and gene expression in leaf tissue. Aust. J. Grape Wine Res. 2006, 12, 2–12. [Google Scholar] [CrossRef]
  13. Venios, X.; Korkas, E.; Nisiotou, A.; Banilas, G. Grapevine responses to heat stress and global warming. Plants 2020, 9, 1754. [Google Scholar] [CrossRef] [PubMed]
  14. Dayer, S.; Scharwies, J.D.; Ramesh, S.A.; Sullivan, W.; Doerflinger, F.C.; Pagay, V.; Tyerman, S.D. Comparing Hydraulics between Two Grapevine Cultivars Reveals Differences in Stomatal Regulation under Water Stress and Exogenous ABA Applications. Front. Plant Sci. 2020, 11, 705. [Google Scholar] [CrossRef] [PubMed]
  15. Soar, C.J.; Collins, M.J.; Sadras, V.O. Irrigated Shiraz vines (Vitis vinifera) upregulate gas exchange and maintain berry growth in response to short spells of high maximum temperature in the field. Funct. Plant Biol. 2009, 36, 801–814. [Google Scholar] [CrossRef] [PubMed]
  16. Faralli, M.; Bontempo, L.; Bianchedi, P.L.; Moser, C.; Bertamini, M.; Lawson, T.; Camin, F.; Stefanini, M.; Varotto, C. Natural variation in stomatal dynamics drives divergence in heat stress tolerance and contributes to seasonal intrinsic water-use efficiency in Vitis vinifera (subsp. sativa and sylvestris). J. Exp. Bot. 2022, 73, 3238–3250. [Google Scholar] [CrossRef] [PubMed]
  17. Lehr, P.P.; Hernández-Montes, E.; Ludwig-Müller, J.; Keller, M.; Zörb, C. Abscisic acid and proline are not equivalent markers for heat, drought and combined stress in grapevines. Aust. J. Grape Wine Res. 2022, 28, 119–130. [Google Scholar] [CrossRef]
  18. Mittler, R. Abiotic stress, the field environment and stress combination. Trends Plant Sci. 2006, 11, 15–19. [Google Scholar] [CrossRef]
  19. Rizhsky, L.; Liang, H.; Mittler, R. The combined effect of drought stress and heat shock on gene expression in tobacco. Plant Physiol. 2002, 130, 1143–1151. [Google Scholar] [CrossRef] [PubMed] [Green Version]
  20. Poblete, T.; Ortega-Farías, S.; Moreno, M.A.; Bardeen, M. Artificial neural network to predict vine water status spatial variability using multispectral information obtained from an unmanned aerial vehicle (UAV). Sensors 2017, 17, 2488. [Google Scholar] [CrossRef] [Green Version]
  21. Diago, M.P.; Pou, A.; Millan, B.; Tardaguila, J.; Fernandes, A.M.; Melo-Pinto, P. Assessment of grapevine water status from hyperspectral imaging of leaves. Acta Hortic. 2014, 1038, 89–96. [Google Scholar] [CrossRef]
  22. Rapaport, T.; Hochberg, U.; Shoshany, M.; Karnieli, A.; Rachmilevitch, S. Combining leaf physiology, hyperspectral imaging and partial least squares-regression (PLS-R) for grapevine water status assessment. ISPRS J. Photogramm. Remote Sens. 2015, 109, 88–97. [Google Scholar] [CrossRef]
  23. Pagay, V.; Kidman, C.M. Evaluating Remotely-Sensed Grapevine (Vitis vinifera L.) Water Stress Responses across a Viticultural Region. Agronomy 2019, 9, 682. [Google Scholar] [CrossRef] [Green Version]
  24. Cogato, A.; Pagay, V.; Marinello, F.; Meggio, F.; Grace, P.; Migliorati, M.D.A. Assessing the feasibility of using sentinel-2 imagery to quantify the impact of heatwaves on irrigated vineyards. Remote Sens. 2019, 11, 2869. [Google Scholar] [CrossRef] [Green Version]
  25. Silva, E.N.; Ferreira-Silva, S.L.; de Fontenele, A.V.; Ribeiro, R.V.; Viégas, R.A.; Silveira, J.A.G. Photosynthetic changes and protective mechanisms against oxidative damage subjected to isolated and combined drought and heat stresses in Jatropha curcas plants. J. Plant Physiol. 2010, 167, 1157–1164. [Google Scholar] [CrossRef]
  26. Gitelson, A.A.; Gritz, Y.; Merzlyak, M.N. Relationships between leaf chlorophyll content and spectral reflectance and algorithms for non-destructive chlorophyll assessment in higher plant leaves. J. Plant Physiol. 2003, 160, 271–282. [Google Scholar] [CrossRef] [PubMed]
  27. Gamon, J.A.; Penuelas, J.; Field, B. A Narrow-Waveband Spectral Index That Tracks Diurnal Changes in Photosynthetic Efficiency. Remote Sens. Environ. 1992, 41, 35–44. [Google Scholar] [CrossRef]
  28. Courel, M.-F.; Chamard, P.; Guenegou, M.J.; Lerhun, J.; Levasseur, M.; Togola, M. Utilisation des bandes spectrales du vert et du rouge pour une meilleure évaluation des formations végétales actives. In Proceedings of the Congrès AUPELF-UREF, Sherbrooke, QC, Canada; 1991; pp. 203–210. [Google Scholar]
  29. Gitelson, A.A.; Merzlyak, M.N. Remote estimation of chlorophyll content in higher plant leaves. Int. J. Remote Sens. 1997, 18, 2691–2697. [Google Scholar] [CrossRef]
  30. Zarco-Tejada, P.J.; Miller, J.R.; Mohammed, G.H.; Noland, T.L. Chlorophyll fluorescence effects on vegetation apparent reflectance: I. Leaf-level measurements and model simulation. Remote Sens. Environ. 2000, 74, 582–595. [Google Scholar] [CrossRef]
  31. Sims, D.A.; Gamon, J.A. Relationships between leaf pigment content and spectral reflectance across a wide range of species, leaf structures and developmental stages. Remote Sens. Environ. 2002, 81, 337–354. [Google Scholar] [CrossRef]
  32. Hunt, E.R.; Rock, B.N. Detection of changes in leaf water content using Near- and Middle-Infrared reflectances. Remote Sens. Environ. 1989, 30, 43–54. [Google Scholar]
  33. Penuelas, J.; Filella, I.; Biel, C.; Serrano, L.; Save, R. The reflectance at the 950–970 nm region as an indicator of plant water status. Int. J. Remote Sens. 1993, 14, 1887–1905. [Google Scholar] [CrossRef]
  34. Idso, S.B. Non-water-stressed baselines: A key to measuring and interpreting plant water stress. Agric. Meteorol. 1982, 27, 59–70. [Google Scholar] [CrossRef]
  35. Hansen, P.M.; Jørgensen, J.R.; Thomsen, A. Predicting grain yield and protein content in winter wheat and spring barley using repeated canopy reflectance measurements and partial least squares regression. J. Agric. Sci. 2002, 139, 307–318. [Google Scholar] [CrossRef]
  36. Álvarez-Maldini, C.; Acevedo, M.; Pinto, M. Hydroscapes: A useful metric for distinguishing iso-/anisohydric behavior in almond cultivars. Plants 2021, 10, 1249. [Google Scholar] [CrossRef] [PubMed]
  37. Palliotti, A.; Poni, S.; Silvestroni, O.; Tombesi, S.; Bernizzoni, F. Morpho-structural and physiological performance of Sangiovese and Montepulciano cvv. (Vitis vinifera) under non-limiting water supply conditions. Funct. Plant Biol. 2011, 38, 888–898. [Google Scholar] [CrossRef]
  38. Flexas, J.; Bota, J.; Cifre, J.; Escalona, J.M.; Galmés, J.; Gulías, J.; Lefi, E.K.; Martínez-Cañellas, S.F.; Moreno, M.T.; Ribas-Carbó, M.; et al. Understanding down-regulation of photosynthesis under water stress: Future prospects and searching for physiological tools for irrigation management. Ann. Appl. Biol. 2004, 144, 273–283. [Google Scholar] [CrossRef]
  39. Edwards, E.J.; Smithson, L.; Graham, D.C.; Clingeleffer, P.R. Grapevine canopy response to a high-temperature event during deficit irrigation. Aust. J. Grape Wine Res. 2011, 17, 153–161. [Google Scholar] [CrossRef]
  40. Greer, D.H.; Weston, C. Heat stress affects flowering, berry growth, sugar accumulation and photosynthesis of Vitis vinifera cv. Semillon grapevines grown in a controlled environment. Funct. Plant Biol. 2010, 37, 206–214. [Google Scholar] [CrossRef]
  41. Prieto, J.A.; Lebon, É.; Ojeda, H. Stomatal behavior of different grapevine cultivars in response to soil water status and air water vapor pressure deficit. J. Int. Sci. Vigne du Vin 2010, 44, 9–20. [Google Scholar] [CrossRef]
  42. Carrasco-Benavides, M.; Antunez-Quilobrán, J.; Baffico-Hernández, A.; Ávila-Sánchez, C.; Ortega-Farías, S.; Espinoza, S.; Gajardo, J.; Mora, M.; Fuentes, S. Performance assessment of thermal infrared cameras of different resolutions to estimate tree water status from two cherry cultivars: An alternative to midday stem water potential and stomatal conductance. Sensors 2020, 20, 3596. [Google Scholar] [CrossRef] [PubMed]
  43. Maimaitiyiming, M.; Sagan, V.; Sidike, P.; Kwasniewski, M.T. Dual activation function-based Extreme Learning Machine (ELM) for estimating grapevine berry yield and quality. Remote Sens. 2019, 11, 740. [Google Scholar] [CrossRef] [Green Version]
  44. Gitelson, A.A.; Keydan, G.P.; Merzlyak, M.N. Three-band model for noninvasive estimation of chlorophyll, carotenoids, and anthocyanin contents in higher plant leaves. Geophys. Res. Lett. 2006, 33, 2–6. [Google Scholar] [CrossRef] [Green Version]
  45. Suárez, L.; Zarco-Tejada, P.J.; Sepulcre-Cantó, G.; Pérez-Priego, O.; Miller, J.R.; Jiménez-Muñoz, J.C.; Sobrino, J. Assessing canopy PRI for water stress detection with diurnal airborne imagery. Remote Sens. Environ. 2008, 112, 560–575. [Google Scholar] [CrossRef]
  46. Bhagat, V.; Kada, A.; Kumar, S. Analysis of Remote Sensing based Vegetation Indices (VIs) for Unmanned Aerial System (UAS): A Review. Remote Sens. Land 2020, 3, 58–73. [Google Scholar] [CrossRef]
  47. Nguyen, C.; Sagan, V.; Maimaitiyiming, M.; Maimaitijiang, M.; Bhadra, S.; Kwasniewski, M.T. Early detection of plant viral disease using hyperspectral imaging and deep learning. Sensors 2021, 21, 742. [Google Scholar] [CrossRef] [PubMed]
  48. Dobrowski, S.Z.; Pushnik, J.C.; Zarco-Tejada, P.J.; Ustin, S.L. Simple reflectance indices track heat and water stress-induced changes in steady-state chlorophyll fluorescence at the canopy scale. Remote Sens. Environ. 2005, 97, 403–414. [Google Scholar] [CrossRef]
  49. Pôças, I.; Gonçalves, J.; Costa, P.M.; Gonçalves, I.; Pereira, L.S.; Cunha, M. Hyperspectral-based predictive modelling of grapevine water status in the Portuguese Douro wine region. Int. J. Appl. Earth Obs. Geoinf. 2017, 58, 177–190. [Google Scholar] [CrossRef]
  50. Kováč, D.; Veselovská, P.; Klem, K.; Večeřová, K.; Ač, A.; Peñuelas, J.; Urban, O. Potential of photochemical reflectance index for indicating photochemistry and light use efficiency in leaves of European beech and Norway spruce trees. Remote Sens. 2018, 10, 1202. [Google Scholar] [CrossRef] [Green Version]
  51. Cao, Z.; Yao, X.; Liu, H.; Liu, B.; Cheng, T.; Tian, Y.; Cao, W.; Zhu, Y. Comparison of the abilities of vegetation indices and photosynthetic parameters to detect heat stress in wheat. Agric. For. Meteorol. 2019, 265, 121–136. [Google Scholar] [CrossRef]
  52. Ryu, J.H.; Jeong, H.; Cho, J. Performances of vegetation indices on paddy rice at elevated air temperature, heat stress, and herbicide damage. Remote Sens. 2020, 12, 2654. [Google Scholar] [CrossRef]
  53. Ripullone, F.; Rivelli, A.R.; Baraldi, R.; Guarini, R.; Guerrieri, R.; Magnani, F.; Peñuelas, J.; Raddi, S.; Borghetti, M. Effectiveness of the photochemical reflectance index to track photosynthetic activity over a range of forest tree species and plant water statuses. Funct. Plant Biol. 2011, 38, 177–186. [Google Scholar] [CrossRef] [PubMed] [Green Version]
  54. Zarco-Tejada, P.J.; González-Dugo, V.; Williams, L.E.; Suárez, L.; Berni, J.A.J.; Goldhamer, D.; Fereres, E. A PRI-based water stress index combining structural and chlorophyll effects: Assessment using diurnal narrow-band airborne imagery and the CWSI thermal index. Remote Sens. Environ. 2013, 138, 38–50. [Google Scholar] [CrossRef]
  55. Król, A.; Amarowicz, R.; Weidner, S. Changes in the composition of phenolic compounds and antioxidant properties of grapevine roots and leaves (Vitis vinifera L.) under continuous of long-term drought stress. Acta Physiol. Plant. 2014, 36, 1491–1499. [Google Scholar] [CrossRef] [Green Version]
  56. Manley, P.V.; Sagan, V.; Fritschi, F.B.; Burken, J.G. Remote sensing of explosives-induced stress in plants: Hyperspectral imaging analysis for remote detection of unexploded threats. Remote Sens. 2019, 11, 1827. [Google Scholar] [CrossRef] [Green Version]
  57. Serrano, L.; González-Flor, C.; Gorchs, G. Assessing vineyard water status using the reflectance based Water Index. Agric. Ecosyst. Environ. 2010, 139, 490–499. [Google Scholar] [CrossRef]
  58. Peddinti, S.R.; Kambhammettu, B.V.N.P.; Rodda, S.R.; Thumaty, K.C.; Suradhaniwar, S. Dynamics of Ecosystem Water Use Efficiency in Citrus Orchards of Central India Using Eddy Covariance and Landsat Measurements. Ecosystems 2020, 23, 511–528. [Google Scholar] [CrossRef]
  59. Cogato, A.; Wu, L.; Jewan, S.Y.Y.; Meggio, F.; Marinello, F.; Sozzi, M.; Pagay, V. Evaluating the spectral and physiological responses of grapevines (Vitis vinifera L.) to heat and water stresses under different vineyard cooling and irrigation strategies. Agronomy 2021, 11, 1940. [Google Scholar] [CrossRef]
  60. Schillaci, C.; Perego, A.; Valkama, E.; Märker, M.; Saia, S.; Veronesi, F.; Lipani, A.; Lombardo, L.; Tadiello, T.; Gamper, H.A.; et al. New pedotransfer approaches to predict soil bulk density using WoSIS soil data and environmental covariates in Mediterranean agro-ecosystems. Sci. Total Environ. 2021, 780, 146609. [Google Scholar] [CrossRef]
Figure 1. Environmental conditions during the experiment; (a) maximum and minimum daily ambient temperature; (b) maximum and minimum daily relative humidity; (c) maximum and minimum daily vapour pressure deficit; (d) volumetric water content.
Agronomy 12 01819 g001
Figure 2. Variation in (a) stem water potential ( Ψ stem), (b) photosynthesis (Pn), (c) stomatal conductance (gs), (d) water-use efficiency (WUEi), and (e) leaf transpiration rate (E) for well-watered (WW) and water-stressed (WS) Grenache (GR) and Shiraz (SH) under high temperature. Each data point is the mean + standard error of the mean of three replicates. Different small black letters indicate statistically significant difference at p ≤ 0.05 over time within the same treatment. Means were separated by unpaired two-tailed t-test using Tukey’s least significant difference (LSD) test. Different capital grey letters indicate significant difference between treatments within the same date. Means were separated by one-way ANOVA using Tukey’s LSD test.
Agronomy 12 01819 g002
Figure 3. Correlogram between the hyperspectral VIs and the physiological parameters for (a) Grenache and (b) Shiraz. Positive correlations are displayed in blue and negative correlations in red. Colour intensity is proportional to R (the darker the colour, the higher the coefficient). Single asterisk indicates a significant correlation, p < 0.05; double asterisk indicates a significant correlation, p < 0.01; triple asterisk indicates a significant correlation, p < 0.001.
Agronomy 12 01819 g003
Figure 4. Variation in the VIs for well-watered (WW) and water-stressed (WS) Grenache (GR) and Shiraz (SH) under high temperature: (a) PRI, (b) AntGitelson, (c) GI, (d) GNDVI, (e) FCI, (f) MRESR, (g) NDII, and (h) WI. Each data point is the mean + standard error of the mean of three replicates. Different small black letters indicate statistically significant difference at p ≤ 0.05 over time within the same treatment. Means were separated by unpaired two-tailed t-test using Tukey’s least significant difference (LSD) test. Different capital grey letters indicate significant difference between treatments within the same date. Means were separated by one-way ANOVA using Tukey’s LSD test.
Agronomy 12 01819 g004
Figure 5. Ratios between the whole canopy CWSI of water-stressed and well-watered Grenache and Shiraz (CWSIr) during WS (25/03/2020) and after recovery (29/03/2020). Each data point is the mean + standard error of the mean of three replicates. Different small black letters indicate statistically significant difference at p ≤ 0.05 over time within the same variety. Different capital grey letters indicate significant difference between varieties within the same date. Means were separated by unpaired two-tailed t-test using Tukey’s least significant difference (LSD) test.
Agronomy 12 01819 g005
Table 1. Summary table of the treatments applied in this experiment. Day and night temperatures were set at 40 °C and 30 °C, respectively.
TreatmentVarietyAverage Volumetric Water Content (%)No. of Vines (n)
GR_WW (control for Grenache)GrenachePlants well-watered (VWC = 10.5%)3
SH_WW (control for Shiraz)ShirazPlants well-watered (VWC = 7.8%)3
GR_WSGrenachePlants subjected to WS (VWC = 2.4%)3
SH_WSShirazPlants subjected to WS (VWC = 2.3%)3
Table 2. Summary table of the treatments applied in this experiment. Day and night temperatures were set at 40 °C and 30 °C, respectively.
VIAcronymEquationClassReference
Anthocyanin (Gitelson)AntGitelsonAntGitelson = (1/R550 − 1/R700) × R780Pigment[26]
Photochemical Reflectance IndexPRIPRI = (R531 − R570)/(R531 + R570)Pigment[27]
Greenness IndexGIGI = R554/R677Structure[28]
Green Normalised Difference Vegetation IndexGNDVIGNDVI = (R750 − R540 + R570)/(R750 + R540 − R570)Structure[29]
Fluorescence Curvature IndexFCIFCI = R683/(R675 × R691)Physiology[30]
Modified Red-Edge Simple Ratio IndexMRESRMRESR = (R750 − R445)/(R705 + R445)Physiology[31]
Normalised Difference Infrared IndexNDIINDII = (R820 – R1650)/(R820 + R1650)Water content[32]
Water IndexWIWI = R900/R970Water content[33]
Table 3. Pearson correlation analysis between the CWSI and the physiological parameters. Each cell contains the value of the coefficient of determination. Single asterisk indicates a significant correlation, p < 0.05; double asterisk indicates a significant correlation, p < 0.01; triple asterisk indicates a significant correlation, p < 0.001; ns indicates a not-significant correlation (p > 0.05).
Grenache Shiraz
Ψ stemPngsEWUEi Ψ stemPngsEWUEi
Whole canopy CWSI−0.61 *−0.32 ns−0.31 ns−0.38 ns0.60 *−0.82 ***−0.70 **−0.78 **−0.83 ***0.88 ***
Bottom canopy CWSI−0.60 *−0.32 ns−0.33 ns−0.39 ns0.62 *−0.81 ***−0.69 **−0.78 **−0.83 ***0.88 ***
Top canopy CWSI−0.61 *−0.31 ns−0.28 ns−0.35 ns0.56 ns−0.80 **−0.68 **−0.77 **−0.81 ***0.87 ***
Table 4. Relationship between physiological parameters and acquired hyperspectral indices for Grenache and Shiraz grapevines. For each physiological parameter, the best regression model in terms of R2 is shown in bold. Single asterisk indicates a significant correlation, p < 0.05; double asterisk indicates a significant correlation, p < 0.01, ns indicates a not-significant correlation (p > 0.05).
Physiological Parameter (Y)Spectral Index (X)GrenacheShiraz
Ψ stem (MPa) Model No.Model typeEquationsR2RMSEMAESignificanceModel typeEquationsR2RMSEMAESignificance
AntGitelson1LinearY = −6.95 − 11.49 * X0.362.211.49*LinearY = −8.42 − 12.18 * X0.612.011.39**
PRI2LinearY = −6.35 + 89.85 * X0.452.041.46**LinearY = −7.91 + 116.6 * X0.691.701.23**
GI3Reciprocal-XY = 2.91 − 21.66/X0.442.061.52** ns ns
GNDVI4 ns nsSquare root-XY = −30.97 + 34.50 * sqrt(X)0.332.772.10**
FCI5 ns nsReciprocal-XY = 11.32 − 16.29/X0.282.882.17*
MRESR6Reciprocal-XY = 0.46 − 7.42/X0.272.431.53*Reciprocal-XY = 4.20 − 15.22/X0.552.281.63**
NDII7Reciprocal-XY = −4.33 − 0.078/X0.561.940.46**LinearY = −11.63 + 56.19 * X0.592.161.73**
WI8Reciprocal-XY = 278.2 − 285.3/X0.631.880.43**Reciprocal-XY = 376.1 − 383.3/X0.732.051.61**
Pn (μmol CO2 m−2 s−1)AntGitelson1ExponentialY = exp(1.29 − 3.78 * X)0.560.480.34**LinearY = 6.69 − 7.71 * X0.671.150.97**
PRI2ExponentialY = exp(1.49 + 27.74 * X)0.620.440.32**ExponentialY = exp(1.90 + 11.31 * X)0.680.190.15**
GI3Double reciprocalY = 1/(−0.61 + 2.15/X)0.400.520.36** ns ns
GNDVI4S-curveY = exp(2.83 − 0.47/X)0.240.630.42*Reciprocal-Y square root-XY = 1/(0.59 − 0.64 * sqrt(X))0.320.050.04**
FCI5 ns nsDouble reciprocalY = 1/(−0.19 + 0.30/X)0.250.060.04*
MRESR6S-curveY = exp(3.62 − 2.35/X)0.390.570.37**Double reciprocalY = 1/(−0.063 + 0.28/X)0.560.040.03**
NDII7Double reciprocalY = 1/(0.12 + 0.007/X)0.530.460.34**ExponentialY = exp(1.56 + 5.11 * X)0.440.260.22**
WI8Double reciprocalY = 1/(−26.40 + 26.78/WI)0.460.510.36**Double reciprocalY = 1/(−6.07 + 6.22/X)0.460.050.04**
gs (mol H2O m−2 s−1)AntGitelson1ExponentialY = exp(−1.68 − 4.81 * X)0.560.610.47**LinearY = 0.35 − 0.72 * X0.700.360.28**
PRI2ExponentialY = exp(−1.43 + 36.13 * X)0.650.540.39**ExponentialY = exp(−1.13 + 22.00 * X)0.720.340.27**
GI3Double reciprocalY = 1/(−20.27 + 63.38/X)0.446.044.62** ns ns
GNDVI4S-curveY = exp(0.39 − 0.63/X)0.270.790.54*Reciprocal Y Logarithmic XY = 1/(−4.51 − 10.36 * ln(X))0.362.401.83**
FCI5 ns nsS-curveY = exp(2.54 − 3.11/X)0.270.560.48*
MRESR6S-curveY = exp(1.41 − 3.14/X)0.450.700.44**Double reciprocalY = 1/(−7.04 + 13.78/X)0.611.871.32**
NDII7MultiplicativeY = exp(0.81 + 0.80 * ln(X))0.600.590.47**ExponentialY = exp(−1.89 + 11.31 * X)0.600.410.33**
WI8ExponentialY = exp(−95.97 + 94.26 * X)0.580.780.64**LinearY = −21.15 + 21.57 * WI0.610.120.09**
E (mmol H2O m−2 s−1)AntGitelson1ExponentialY = exp(0.43 − 1.60 * X)0.540.210.17**Reciprocal-YY = 1/(0.48 + 0.22 * X)0.540.040.03**
PRI2Reciprocal YY = 1/(0.63− 7.91 * X)0.600.130.11**Reciprocal-YY = 1/(0.47 − 2.06 * X)0.590.040.03**
GI3Double reciprocalY = 1/(0.081 + 1.26/X)0.270.180.13* ns ns
GNDVI4Square root-Y reciprocal-XY = (1.69 − 0.13/X)^20.260.170.12*Double reciprocalY = 1/(0.29 + 0.079/X)0.260.060.05*
FCI5 ns ns ns ns
MRESR6Double square rootY = (−0.042 + 1.27 * sqrt(X))^20.400.150.11*Double reciprocalY = 1/(0.25 + 0.28/X)0.520.050.04**
NDII7Reciprocal-Y Logarithmic-XY = 1/(0.13 − 0.18 * ln(X))0.580.140.11**Reciprocal-YY = 1/(0.56 − 1.32 * X)0.770.030.03**
WI8Double reciprocalY = 1/(−20.97 + 21.66/X)0.620.130.09**Double reciprocalY = 1/(−7.96 + 8.41/X)0.770.030.02**
WUEi (μmol CO2 mol−1 H2O−1)AntGitelson1Squared-YY= sqrt(428.6 + 825.8 * X)0.37155.21118.76*Squared-YY = sqrt(590.1 + 1265.5 * X)0.59236.12164.53**
PRI2Squared-YY = sqrt(386.1 – 6757 * X)0.51136.74107.51**Squared-YY = sqrt(536.7 – 12,151 * X)0.69206.70164.42ns
GI3Squared-Y reciprocal-XY = sqrt(−264.3 + 1519.1/X)0.44146.56116.88** ns ns
GNDVI4Squared-Y reciprocal-XY = sqrt(18.81 + 128.2/X)0.25168.97136.89*Squared-Y reciprocal-XY = sqrt(−663.9 + 524.8/X)0.38290.11242.07*
FCI5 ns nsSquared-Y reciprocal-XY = sqrt(−1509 + 1733/X)0.26316.56270.36*
MRESR6Squared-Y reciprocal-XY = sqrt(−184.5 + 634.5/X)0.42149.39121.55*Squared-Y reciprocal-XY = sqrt(−819.0 + 1708/X)0.63224.28182.19**
NDII7Squared-Y square root-XY = sqrt(856.0 − 1722.9 * sqrt(X))0.7696.0880.05**LinearY = 31.32 − 140.2 * X0.674.453.42**
WI8Squared-Y reciprocal-XY = sqrt(−22,275 + 22,733/X)0.7990.7170.96**Reciprocal-XY = −893.3 + 913.6/X0.704.213.23**
Publisher’s Note: MDPI stays neutral with regard to jurisdictional claims in published maps and institutional affiliations.

