Article

Development of Enumerative and Binomial Sequential Sampling Plans for Monitoring Lymantria dispar (L.) (Lepidoptera Erebidae) in Mediterranean Oak Forests

Sezione di Patologia Vegetale ed Entomologia, Dipartimento di Agraria, Università degli Studi di Sassari, Viale Italia 39, 07100 Sassari, Italy
*
Author to whom correspondence should be addressed.
Agronomy 2022, 12(7), 1501; https://doi.org/10.3390/agronomy12071501
Submission received: 2 May 2022 / Revised: 13 June 2022 / Accepted: 22 June 2022 / Published: 23 June 2022

Abstract

:
Lymantria dispar is the main threat to Mediterranean forests. Sampling methods used for monitoring the pest population density are generally very time-consuming for practical purposes, such as the delimitation of infested areas for control programs. Enumerative and binomial sequential sampling plans were developed using data collected in cork oak forests in Sardinia (Italy). The Taylor’s power law (TPL) was used to evaluate the degree of aggregation of L. dispar egg masses among trees and to develop enumerative sampling plans at precision levels of 0.10 and 0.25 using the Green’s method. Furthermore, binomial plans were computed by Wald’s sequential probability ratio test. Lymantria dispar egg masses on trees were significantly aggregated and the degree of aggregation was similar in all population development phases. Overall, only 31 cork oak trees are to be monitored at the economic damage threshold of 2.5 egg masses/tree with a precision level of 0.25. Binomial sequential sampling plans also required lower sampling sizes (26.9–31.4 trees) than conventional sampling plans. Enumerative and binomial sampling plans could represent suitable methods for sampling L. dispar egg masses in Mediterranean forests, with the practical advantage of lower cost and time consumption than standard sampling plans.

1. Introduction

The spongy moth, Lymantria dispar (L.) (Lepidoptera Erebidae), is one of the most harmful forest pests worldwide [1,2]. The pest completes one generation per year feeding on more than 300 tree species, including species belonging to genera Betula, Eucalyptus, Larix, Populus, and Quercus [1,3,4]. Quercus species are recognized as the most suitable hosts for L. dispar, particularly the cork oak (Q. suber L.), downy oak (Q. pubescens Willd.), and holm oak (Q. ilex L.) in the Mediterranean area [2,5,6], and the white oak (Q. alba L.) and northern red oak (Q. rubra L.) in North America [7].
Lymantria dispar population dynamics is described by a typical fluctuation pattern with a starting period of low-density population (latency), after which the pest density increases (progradation), reaches a peak (culmination), and then decreases until returning to low levels (retrogradation) [1,8]. Periodic density fluctuations cause severe outbreaks at regular intervals, which occur from 6 to 13 years, depending on the geographical area and anthropogenic pressure [6,9,10,11]. During outbreaks, L. dispar is able to defoliate thousands of hectares of forests [6], causing the general weakening of trees and plant growth reduction [12]. In the Mediterranean area, where the pest mainly infests cork oak [2,6], a decrease in cork production has been observed in the years of complete or partial defoliations [13]. In order to control L. dispar infestations in native areas [14] and in newly introduced areas [15,16], a number of control programs have been developed [17,18,19,20,21].
To support the decision-making process in pest management programs, estimation of the population density at different spatial scales through a well-defined sampling protocol is fundamental. Egg mass counts are the most suitable method for estimating the population density in outbreak suppression programs [22,23,24]. In fact, egg masses are easy to identify by color, present in the field throughout autumn and winter, and their density is strongly related to defoliation in the following year [25,26]. Different sampling protocols have been used to estimate L. dispar egg mass densities [1], including the fixed-radius plot and the fixed- and variable-radius plots [22], timed walks [23], and direct counts on trees [24,27]. The “fixed-radius plot” is one of the most used methods to estimate egg masses due to its simplicity [28]. The method considers the count of all egg masses within repeated circular plots of a given radius to estimate the average density of egg masses in the stand [22,28]. The “fixed- and variable-radius plots” method, which is particularly time-consuming [28,29], takes into consideration the count of all the egg masses on the forest floor and trees within the plots [22]. The “timed walk” protocol consists of counting all the egg masses that are readily visible in a fixed length of time (e.g., five minutes) by an observer walking randomly in a stand [23]. Although this procedure could reduce the monitoring time, it is not recommended, as density estimates are not adequately accurate and vary considerably according to observers [30]. The direct count of egg masses on trees is mainly used in Mediterranean forests [6], in which the population density of L. dispar is estimated by counting all the egg masses present on ten consecutive trees along the four cardinal directions, starting from a common central reference point (i.e., 40 trees/site) [27]. Some studies conducted in Mediterranean cork oak forests showed the strength of this method to estimate properly the egg mass density and predict risk of defoliation [24,26]. In particular, the economic damage threshold of 100 egg masses on 40 trees (i.e., 2.5 egg masses/tree on average) has been adopted in Sardinia (Italy) for control decision-making, as significant defoliations were observed where the average population density was higher than the specified threshold [24,31]. Nevertheless, this sampling method was particularly time-consuming, especially when both high and low infestations occurred [32], and could be too expensive for IPM purposes. In fact, in this case, the exceeding of an economic damage threshold would suffice to take the decision whether to control the pest or not. In order to reduce the sampling effort, the sequential sampling plans implemented up to now for L. dispar management in North-East America considered exclusively the sampling of egg masses through either area-based sampling procedures [32,33] or timed walks [29].
Considering that sequential sampling should noticeably save sampling time and cost, we developed sequential sampling plans based on the direct count of egg masses on trees in order to support decision-making for insecticide applications against L. dispar in the Mediterranean area. The specific aim of our work was to implement sequential egg mass sampling plans based on both enumerative and binomial samplings.

2. Materials and Methods

2.1. Study Area and Data Collection

The study was carried out in Sardinia (Italy), which includes one of the most important cork oak forested areas in the Mediterranean basin [34]. In Sardinia, Q. suber occupies more than 128,000 hectares in pure or mixed forests, mainly associated with Q. ilex and Q. pubescens. The climate conditions where Q. suber grows are Mediterranean, with a typical pattern of long dry season during summer and rainfall mostly distributed in winter. The average annual temperature and precipitation are 13.4 °C and 785 mm, respectively. For this study, data collected from 1999 to 2011 in a permanent monitoring network covering the main Sardinian cork oak forests were used [9]. This network was established in 1980 and currently includes more than 680 sites, where L. dispar egg masses are estimated using the procedure developed by Fraval and collaborators [27]. At each site and year, the sampling takes into consideration the counts of all egg masses occurring in the trunk and branches on 40 trees selected on the main cardinal directions from a common starting point (i.e., 10 trees for each cardinal direction). This sampling technique allows one to properly estimate the egg mass density in the surrounding 5 ha [27].

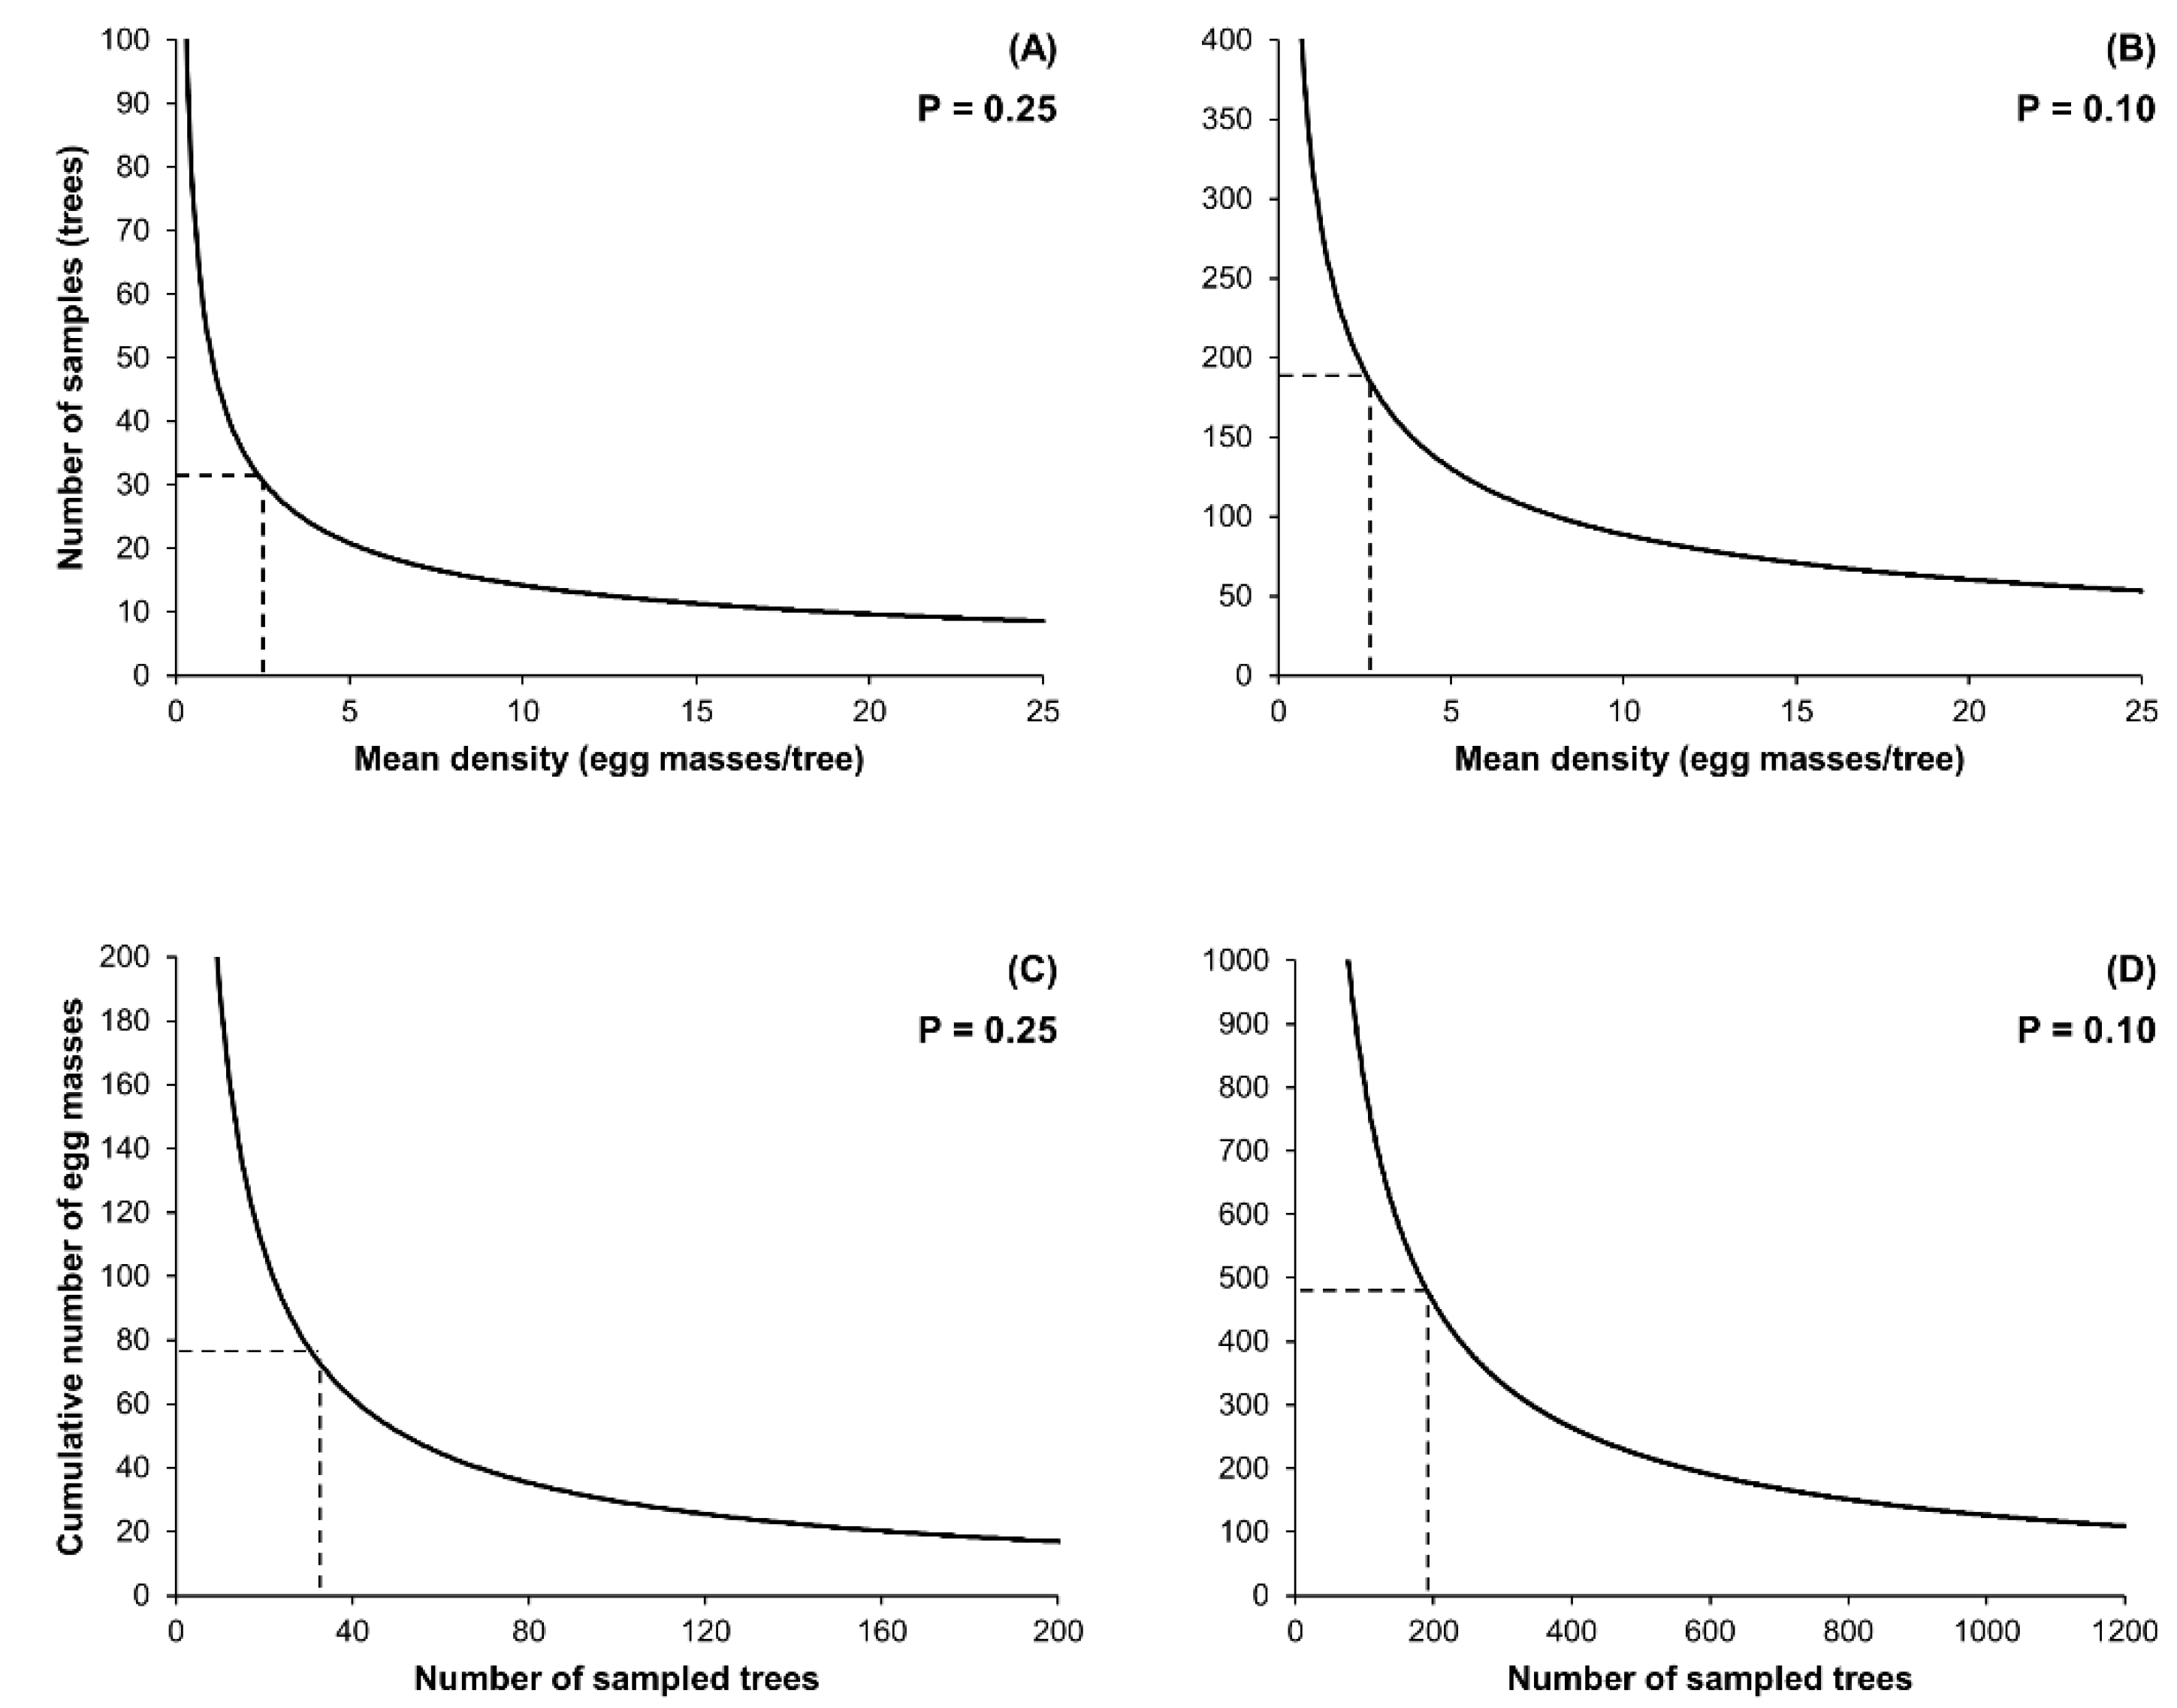
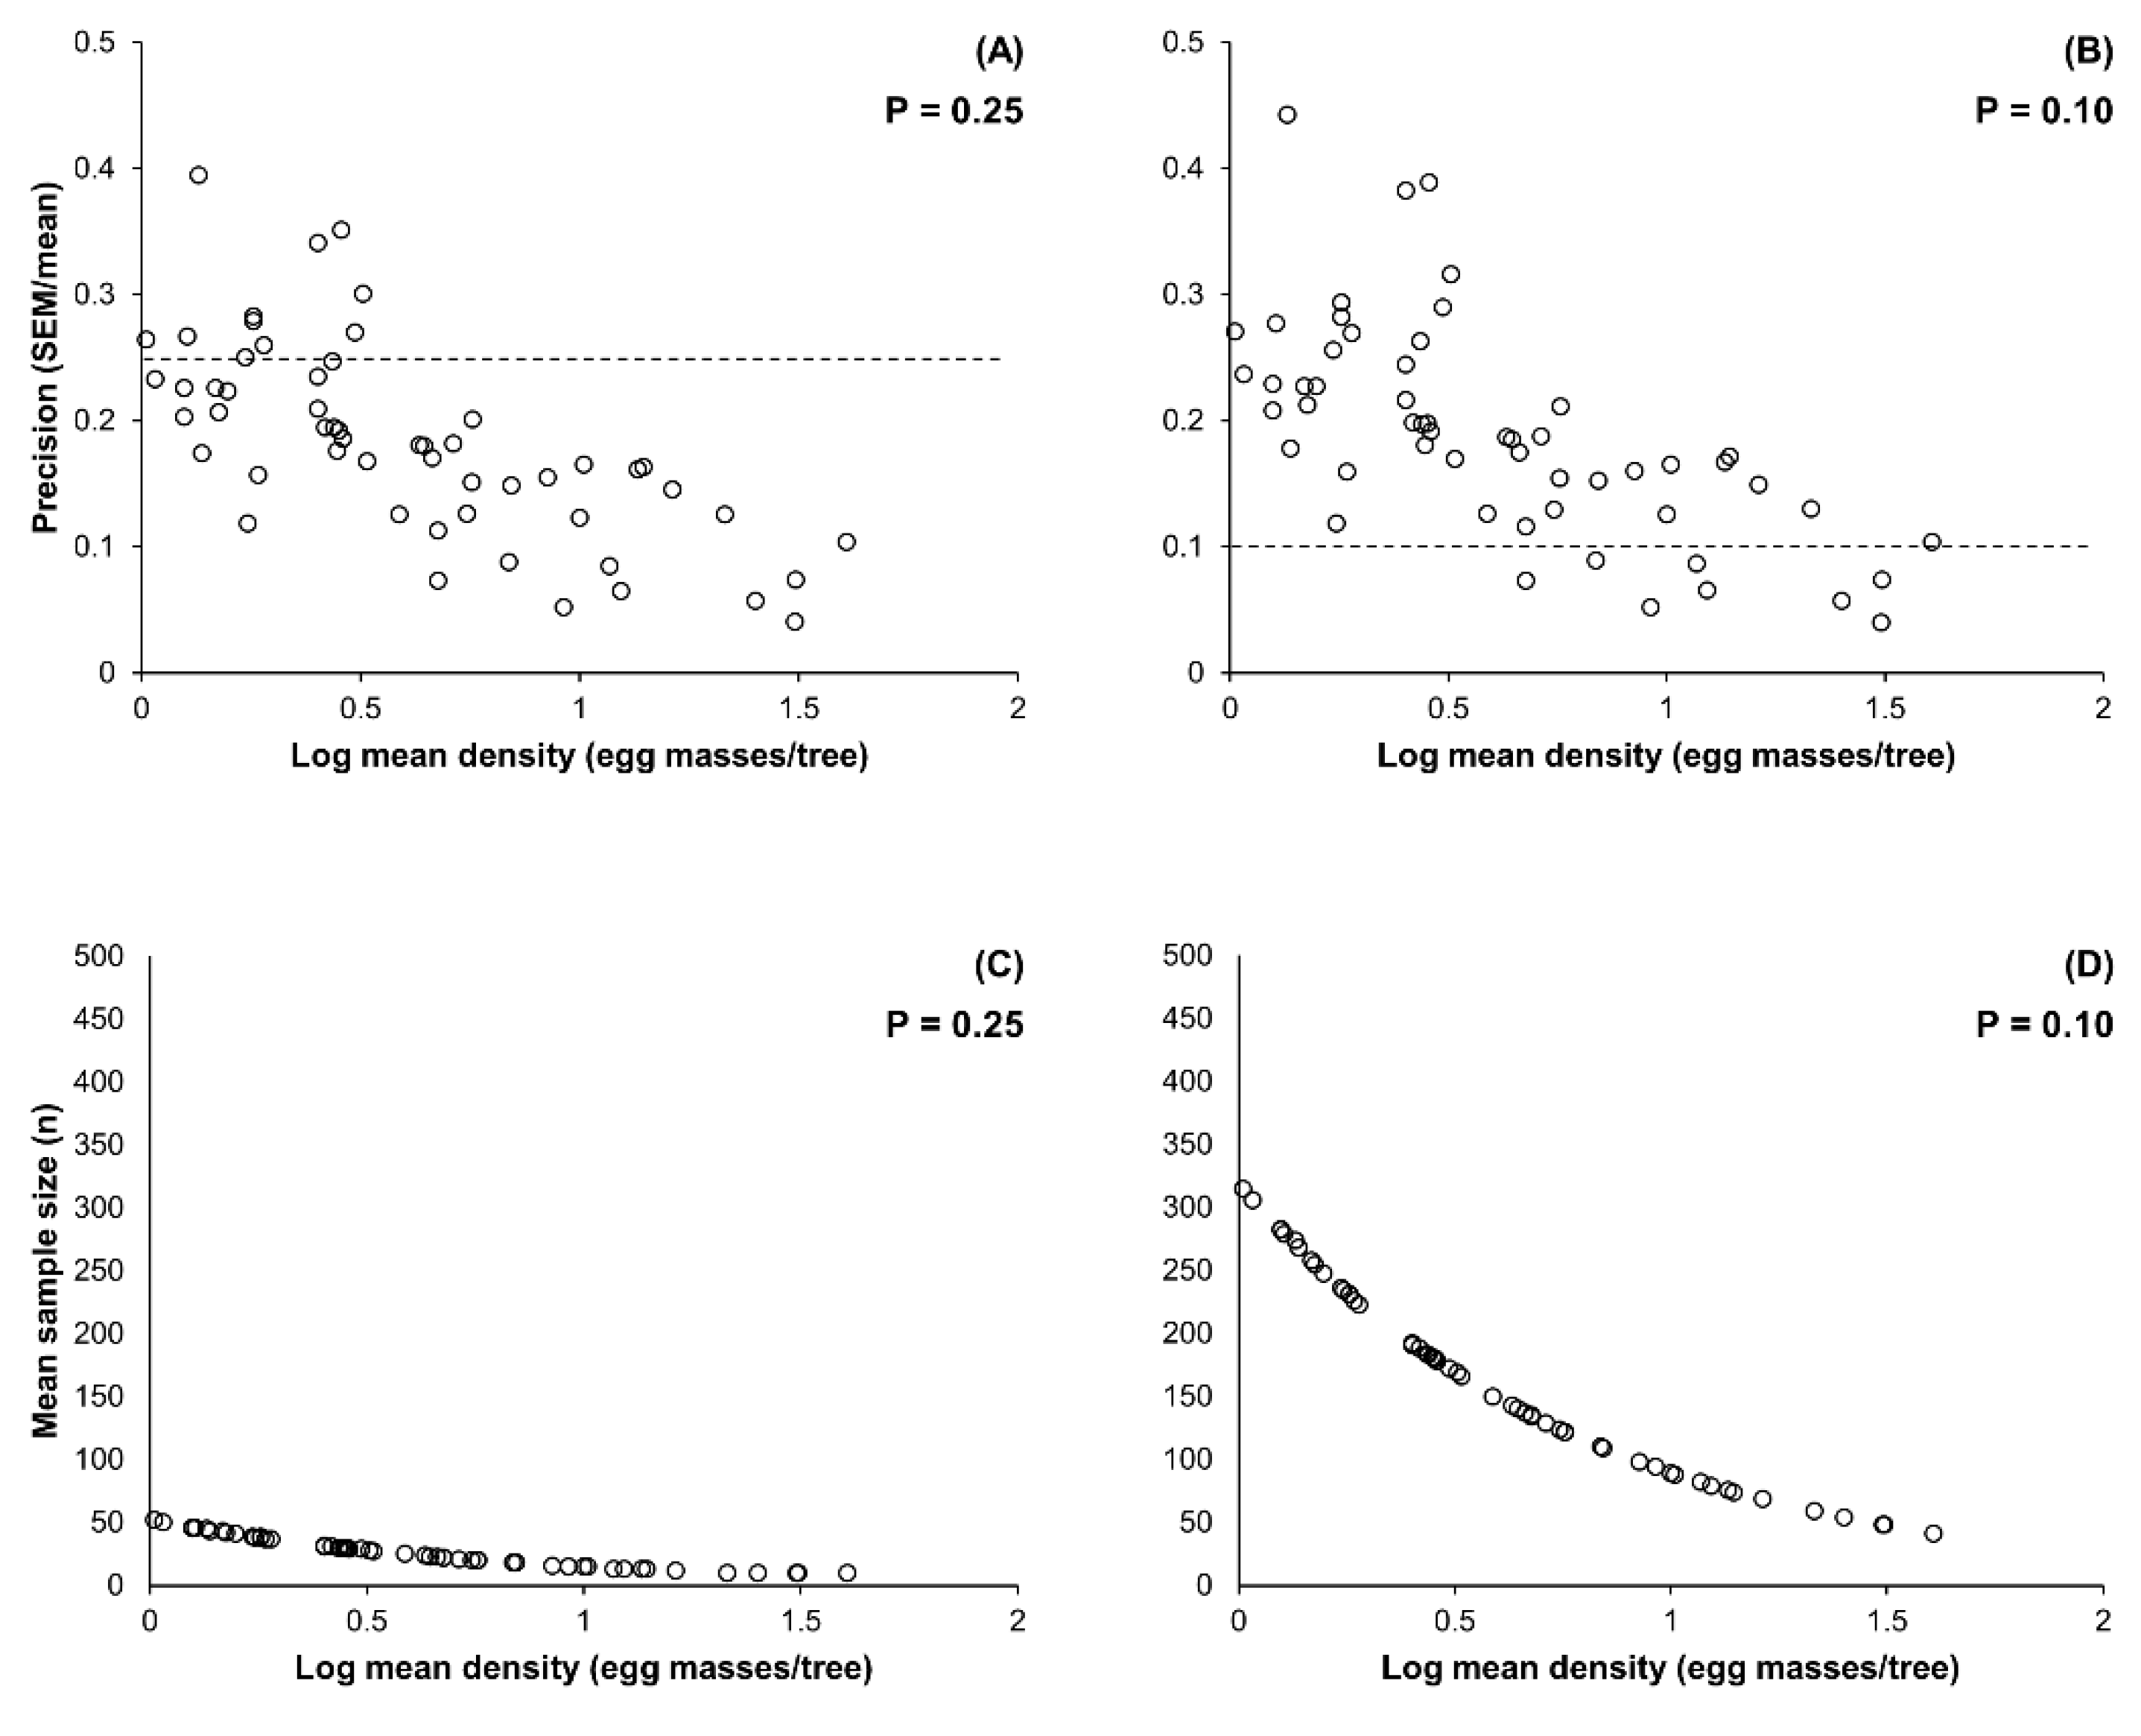
2.2. Enumerative Sampling Plan

The fixed-precision sequential sampling plan was developed with a total of 547 datasets collected from 1999 to 2010 in 161 monitoring sites, and the Green’s method [35] was used, as it takes into account parameters describing the spatial pattern of the pest. Optimum sample size (N) for Green’s plan was calculated at the levels of precision (P = SEM mean−1) of 0.10 and 0.25 using the following equation proposed by Karandinos [36]:
N = 1 / P 2 a m ( b 2 )
where N is the number of samples (i.e., oak trees) that are necessary to estimate a density of egg masses equal to m, P is the desired precision level, and a and b are Taylor’s Power Law (TPL) coefficients. The TPL [37] is commonly used for estimating spatial distribution pattern of organisms in different environments [38,39,40], and describes the specific relationship between mean (m) and variance (s2) by a power function as the following equation:
s 2 = a m b
where a and b are parameters, both contributing to describe spatial aggregation [41]. In particular, the term b, which is also defined as Taylor’s aggregation index, is conventionally used to indicate a uniform (b < 1), random (b = 1), or aggregated (b > 1) distribution [42]. Although spatial pattern of an organism could be assessed using different methods [37,43,44,45], statistical methods, such as the TPL, are recommended for point pattern processes [46]. Parameters a and b were estimated after the natural logarithm transformation (ln) of m and s2 by the linear regression, which is as follows:
ln ( s 2 ) = ln ( a ) + b ln ( m )
Mean and variance in egg mass abundance per tree were calculated for each sampling site from 1999 to 2010 (n = 547) and linear regressions were fitted separately for the data collected during each phase of population dynamics and overall data. ANOVAs were performed separately for each regression line to test whether the slopes statistically differed from 1, which indicates either a uniform (b < 1) or clumped (b > 1) spatial distribution pattern. In order to evaluate different spatial distribution patterns among different phases of population dynamics, a factorial analysis of covariance (ANCOVA) was applied considering the gradation phase as a covariate. Differences in the slopes among linear regressions were tested by evaluating the significance of the interaction term in the ANCOVA model (p < 0.05).
Stop lines, indicating the number of trees required to estimate egg mass density at a defined precision level, were calculated as follows:
T n ( a n 1 b / P 2 ) 1 / ( 2 b )
where Tn is the cumulative number of egg masses sampled and n is the total number of sampled trees. Stop lines were then generated by plotting the values of Tn against the correspondent values of n.
A total of 55 independent datasets collected in 2011 were used for the validation process and validation was carried out on datasets with at least an average density of 1 egg mass/tree. Validation of Green’s sampling plan was carried out using the resampling for validation of sample plan (RSVP) software [47], which allows one to resample each validation dataset until the sequential stop lines are crossed. The minimum sample size for both precision levels (0.10 and 0.25) was set at ten trees. The mean precision and mean sample size were estimated using 500 iteration runs and were used to calculate the overall mean precision and overall mean sample size.

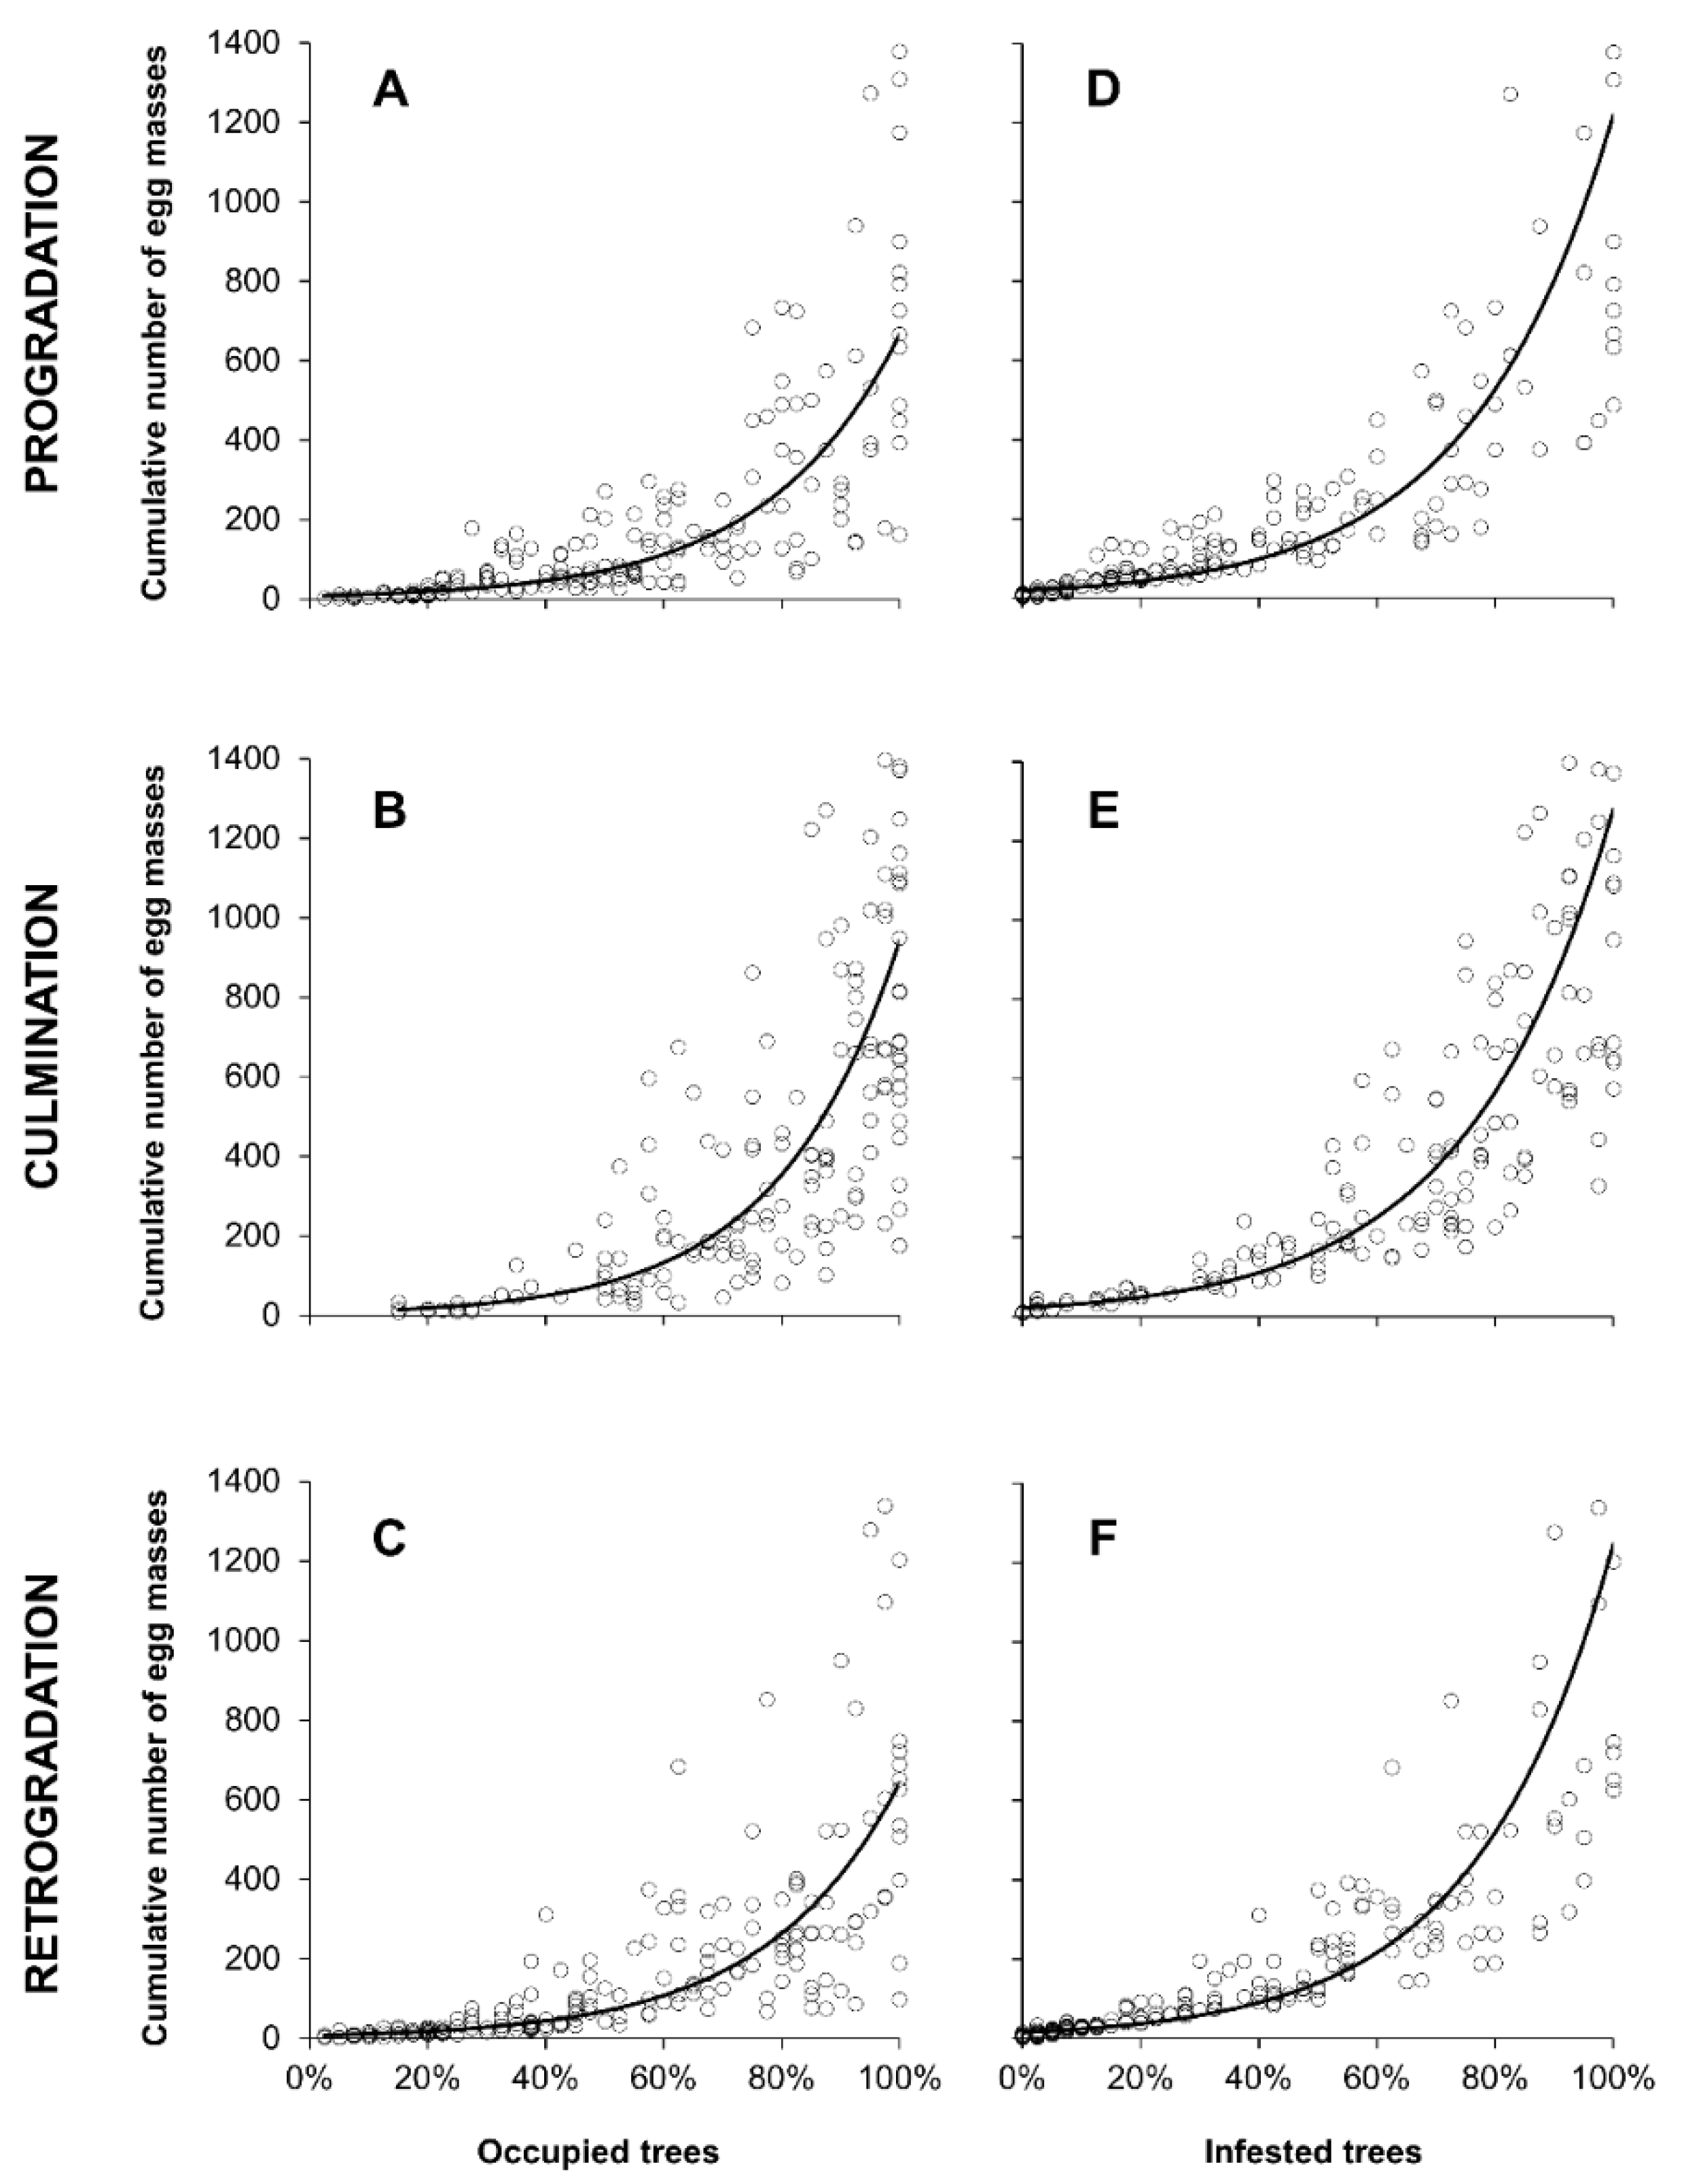
2.3. Relationship between Egg Masses Density and Occupied or Infested Trees

A positive relationship between the population density and occupancy sensu stricto is a consequence of the spatial distribution of individuals of each species [48]. In order to evaluate the congruence of this pattern for L. dispar infested cork oak trees, the relationship between the density of egg masses and percentage of both occupied and infested trees was assessed [49]. A cork oak tree was classified as “occupied” when 1 or more egg masses were observed, whereas it was considered as “infested” when 3 or more egg masses were counted. The latter corresponds to the integer value closest to 2.5 egg masses/tree (i.e., economic damage threshold of 100 egg masses/site). Before the analyses, the data were separated depending on the phase of population development (i.e., progradation, culmination, retrogradation), and explored for data distribution. Given the nature of the relationship following an exponential model, linearization was carried out by log(x + 1) transformation. Relationships between the occurrence of either occupied or infested trees and population density were tested using linear regression models, followed by analysis of variance (ANOVA) (p < 0.05). Regressions were performed separately for each type of development phase using the cumulative number of egg masses as the dependent variable and the percentage of either occupied (i.e., percentage of trees with 1 or more egg masses) or infested trees (i.e., percentage of trees with 3 or more egg masses) as predictors. The action thresholds (ATs), indicating the population density at which the control action should be carried out to prevent the increase in pest population and damages matches the economic damage threshold for L. dispar in the Mediterranean area [5,8,14]. The ATs were calculated from the regression models as the percentage of either occupied or infested trees that correspond to the economic damage threshold (i.e., 2.5 egg masses/tree).

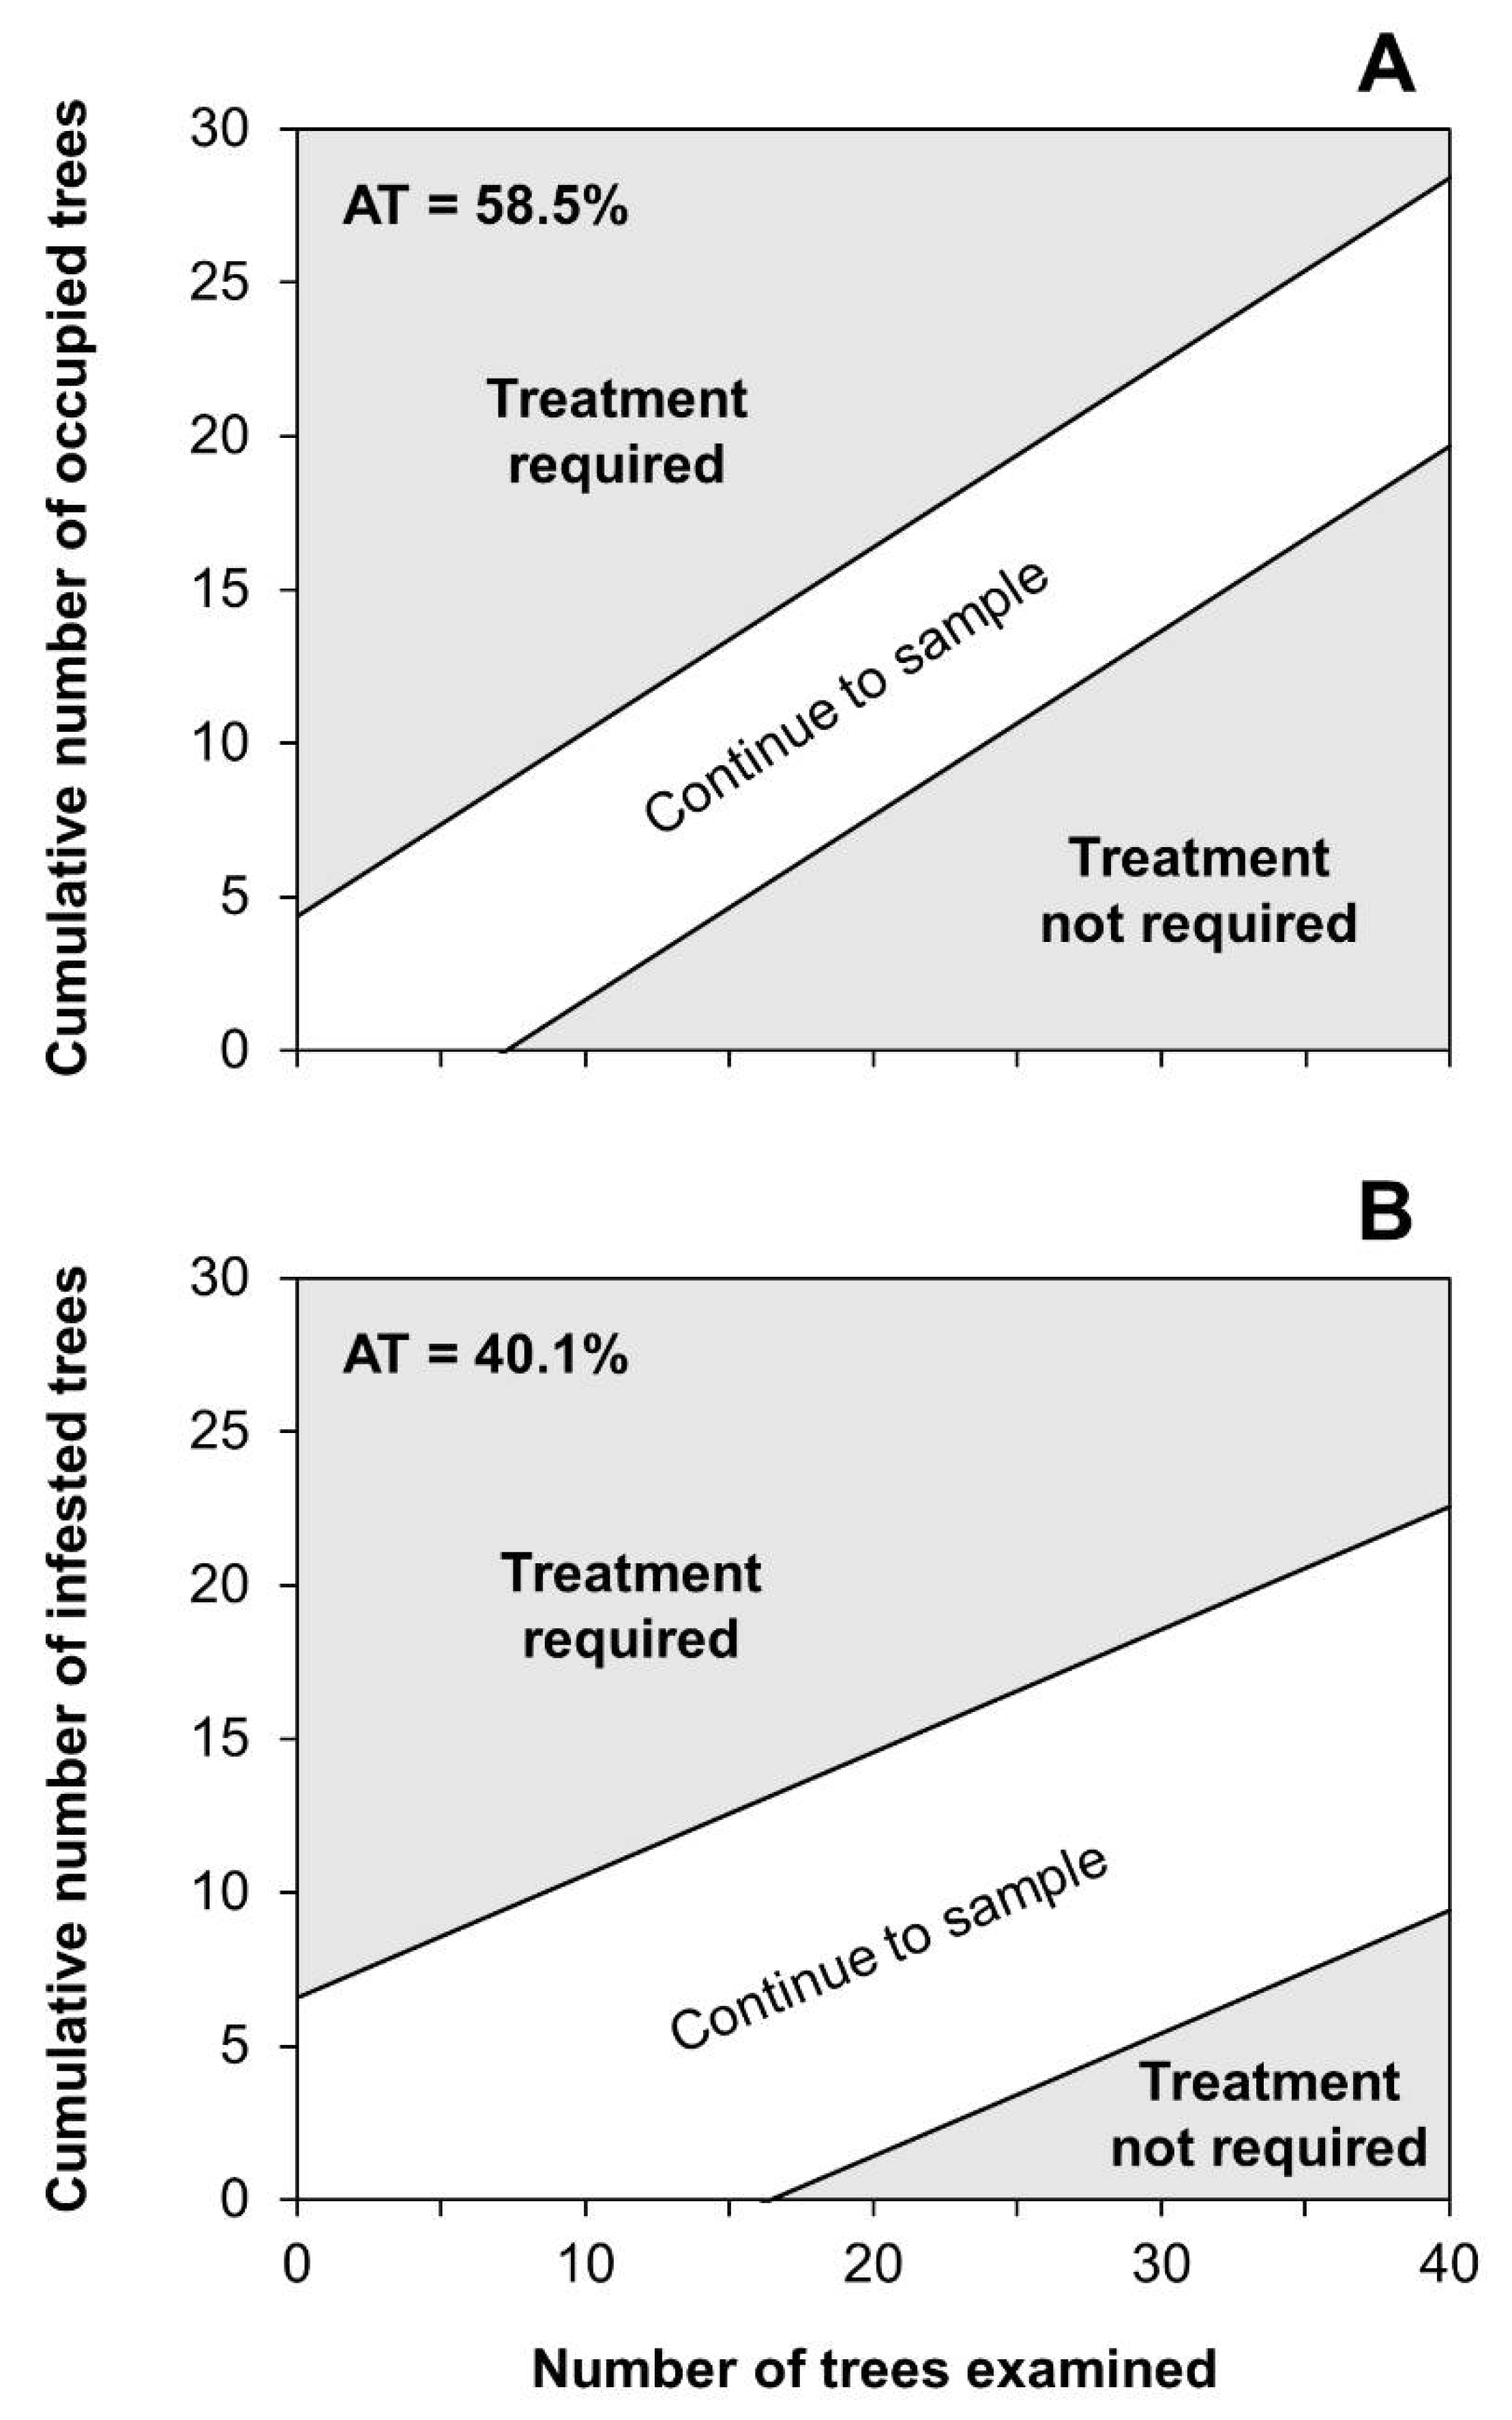
2.4. Development of Binomial Sampling Plans

A binomial sampling plan was generated using the datasets used for developing Green’s enumerative sampling plan. Two different binomial plans were developed, relying on the relationship between the percentage of occupied (i.e., percentage of trees with 1 or more egg masses) and infested trees (i.e., percentage of trees with 3 or more egg masses), and pest density. Two different binomial sampling plans were generated using the tally thresholds of 1 and 3. The tally threshold is the minimum number of egg masses required to classify a tree either as occupied (2) or infested (1) by L. dispar. Validation was carried out separately for each population development phase (i.e., progradation, culmination, retrogradation). Wald’s sequential probability ratio test (SPRT) [50] was used, and stop lines were generated using the RSVP software [43]. Stop lines were generated considering the upper (θ1) and lower (θ2) boundaries for the decision AT and α (type I) and β (type II) errors, which indicate either the probability of treating when pest density is below the defined AT or the probability of not treating when pest density exceeds the AT, respectively. The θ1 and θ2 were set at 10% above and below the AT, respectively, whereas a value of 0.10 was used for both α and β errors. The validation process was carried out using 500 resampling iterations with replacement, and the minimum sample size was arranged considering the x-axis intercept of the lower stop line.

2.5. Validation of Binomial Sampling Plans

For both sampling plans, operating characteristic (OC) functions and average sample number (ASN) were calculated separately for each phase of L. dispar population development and were used to validate the binomial sampling plans. The OC function estimates the probability of not taking action when the pest population reaches a particular density [51], and allows one to determine the accuracy of a binomial sampling plan, whereas the ASN is used to outline the efficiency of a binomial sampling plan, as it indicates the sample size necessary to make a decision [38,52]. The OC functions were determined by regressing the values obtained from RSVP against the proportion of either occupied or infested trees and fitting a four-parameters log-logistic model corresponding to the function.
f ( x , ( c , d , e , g ) ) = c + e d 1 + exp ( c ( log ( x ) log ( g ) ) )
where x is the proportion of infested trees, and c, d, e, and g the parameters of the function [53]. Model fitting was performed using the drc package [54] in R software [55]. Moreover, the actual α and β errors were calculated from the OC curve. The 1 − OC value at θ2 gives the actual α, whereas the OC value at θ1 gives the actual β [56].
Finally, a decision probability matrix was built to evaluate the precision of binomial sequential sampling plans [57]. The probabilities of taking (i.e., “to treat”) or not taking (i.e., “not to treat”) the correct decision were assessed by comparing the observed proportion of either occupied (trees with 1 or more egg masses) or infested trees (trees with 3 or more egg masses) with the estimated proportion obtained from the simulations. Probability matrices were calculated for all the different phases of population development. A probability matrix is composed by four cells indicating the correct decision to treat (A) or not to treat (B), and the incorrect decision to treat (C) or not to treat (D). The decision to treat or not to treat is correct when the observed and estimated pest densities are above and below the AT, respectively [57]. Since the decision can be exclusively right or wrong, either A + B or C + D will be equal to 1 in the matrix [57]. For this reason, the probability A will equal to 1 − OC and B will be OC when the pest population density exceeds the AT. Contrarily, when population density is too low to justify a treatment, the probability C and D will be equal to 1 − OC and OC, respectively [57]. The probability of making a correct decision with a given tally threshold is as follows:
  p i ( A i + D i )
where pi is the proportion of n datasets represented by dataset i, Ai is the probability of making the correct decision to treat, and Di is the probability of making the correct decision to not treat.

3. Results

3.1. Spatial Distribution

The mean population density of L. dispar was extremely variable among the monitoring sites and years, ranging from 0.05 to 59.4 egg masses/tree (Table 1). The highest and lowest mean values were observed in culmination (59.4 egg masses/tree) and retrogradation (0.01 egg masses/tree) phases, respectively. A strong correlation between the mean and variance was observed by TPL in all population development phases (Table 1). Lymantria dispar populations had an aggregate distribution on the trees, as the slopes b of TPL were significantly greater than 1 when the data were analyzed all together and separately for each phase (overall: t = 29.66; df = 1545; p < 0.01; progradation: t = 18.01; df = 1179; p < 0.01; culmination: t = 9.05; df = 1172; p < 0.01; retrogradation: t = 22.84; df = 1190; p < 0.01). Since ANCOVA showed that the slopes of the regression lines were not significantly different depending on the phases of population dynamics (F = 1.13, p = 0.32), the parameters a and b estimated using overall data were used for implementing the enumerative sequential sampling plan.

3.2. Enumerative Sampling Plan

The optimum sample size (N) and sequential stop lines calculated with Green’s method at different precision levels (0.10 and 0.25) are illustrated in Figure 1. The number of sampled trees decreased slightly as the population density increased at both precision levels (Figure 1A,B). The number of trees required to be sampled at a population density of 2.5 egg masses/tree (i.e., economic damage threshold) was 31 at the precision level of 0.25 (Figure 1A), whereas 191 trees were needed at the precision level of 0.10 (Figure 1B). At the same egg mass density, stop lines calculated at P = 0.25 and 0.10 indicated that sampling should be stopped at 76 (Figure 1C) and 479 cumulative egg masses (Figure 1D), respectively.
The results of the validation of Green’s sequential sampling plan are reported in Table 2. The mean precision of the sequential sampling plan at P = 0.25 (0.183) was better than the desired precision, although it was slightly worse than that at P = 0.10 (0.190). The precision of the sequential sampling plans was poorer than the desired levels in correspondence to the lowest values of population density both at the precision level of 0.25 (Figure 2A) and 0.10 (Figure 2B). Mean sample size was 27.3 trees at p = 0.25 (Table 2) and it increased meaningfully to 164.7 trees at the precision level of 0.10 (Table 3). Mean sample size decreased with the increase in population density at both precision levels (Figure 2C,D).

3.3. Relationship between Egg Masses Density and Percentage of Infested Trees

The linear regressions indicate a significant relationship between the density of egg masses and percentage of both occupied and infested trees in all the different population development phases (Table 3), and the egg mass density increased as the percentage of occupied and infested trees increased, following an exponential curve (Figure 3). The threshold of 100 egg masses per site was reached when the percentage of trees occupied by at least 1 egg mass reached 58.5 ± 1.3%, on average. This value was lower during progradation (57.3%) and higher during culmination (59.8%). The percentage of infested trees (with 3 or more egg masses) corresponding to a threshold of 100 egg masses per site was 40.1 ± 2.4% on average, with the lowest and highest values in culmination (37.6%) and in retrogradation (42.3%) phases, respectively.

3.4. Binomial Sampling Plan

Different ATs and tally thresholds were used to generate stop lines for the binomial sequential sampling plans, according to the monitoring of either occupied or infested trees. In particular, an AT = 58.5% (i.e., average percentage of trees occupied by at least 1 egg mass corresponding to a threshold of 100 egg masses per site) and a tally threshold of 1 were considered when occupied trees were sampled (Figure 4A). On the other hand, an AT = 40.1% (i.e., average percentage of trees infested by at least 3 egg masses corresponding to a threshold of 100 egg masses per site) and a tally threshold of 3 were used to develop stop lines for infested trees (Figure 4B). The intercept of the lowest stop line on the x-axis (i.e., the minimum sample size necessary to be examined to make a decision) was 7.3 and 16.5 for plans based on occupied and infested trees, respectively. Consequently, the minimum samples used for validating the binomial sampling plans were set at 8 for occupied trees and 17 for infested trees.
The OC and ASN values, which were determined separately for each binomial sequential plan and L. dispar population development phases, are reported in Table 4. For the binomial plan based on the sampling of occupied trees, the OCs were 0.496, 0.503, and 0.505 in progradation, culmination, and retrogradation phases, respectively. This indicates that the binomial sampling plans were marginally more conservative during progradation than the other population growth phases, as the decision to treat occurred more often than the decision not to treat. The actual α and β values were lower than 0.10 in all different development phases (Table 4). Moreover, mean ASNs ranged from 26.9 trees in culmination to 31.4 trees in progradation. Validation of the binomial plan based on the sampling of infested trees indicated that the binomial plan was slightly conservative during both the progradation (OC = 0.488) and retrogradation phases (OC = 0.486), whereas it was marginally tolerant when tested in the culmination phase (OC = 0.509). The actual α and β values were lower than 0.10, as already observed for the binomial sampling plan of occupied trees, whereas mean ASNs were 42.1, 35.3, and 42.4 in the progradation, culmination, and retrogradation phases, respectively.
The probability (A + D) indicating the correct decisions to treat or not to treat differed among the plans and population development phases (Table 4). For the plan based on the percentage of occupied trees, A + D showed the lowest values (0.779) when the plan was applied during progradation, whereas it reached the highest values of 0.885 in culmination (Table 4). The probability of the correct decision (A + D) was greater for the plan based on the percentage of infested trees and reached values higher than 90% during all different population development stages, with the highest value of 0.966 in culmination (Table 4).

4. Discussion

Sampling methods based on egg mass observation are largely used to estimate L. dispar population density in order to study its dynamics and planning control strategies aimed at reducing the damage caused by its infestations. Since counting all egg masses on trees can be as time consuming as the other sampling methods, time-saving sequential sampling plans that are useful for identifying promptly the infested forests are proposed in the present study. Sequential sampling plans were previously proposed for management-oriented programs in North America [29,32,33]. However, their implementation was conducted considering either area-based or timed walk samplings, whereas a sequential sampling plan based on egg mass counts on trees has not yet been proposed. The main technical limitation in using those sequential sampling plans was the high number of samples required to estimate L. dispar density at low population levels (i.e., <250 egg masses/hectare) [32]. Considering that sampling plans for decision-making in management programs based on insecticide applications indicate when to make the decision to spray or not to spray, the sampling method employed must be appropriate to the information required [52]. Therefore, developing a sampling method that accurately estimates the occurrence of harmful pest densities rather than determining population densities is more appropriate to manage infestations. Although the sampling method we adopted does not provide information on population density per unit area, measuring egg masses per tree can be considered as one of the most suitable variables to predict defoliation at a regional scale, especially for decision-making purposes in outbreak suppression programs [25]. As suggested by Liebhold and collaborators [25], egg mass counts from a grid of permanent sampling sites distributed throughout the susceptible forests can be interpolated using different geostatistical techniques (i.e., kriging) to identify the areas where the economic damage threshold is more likely to be exceeded [58,59].
The selection of a well-defined population threshold (i.e., the density level to be monitored) is fundamental for employing a sequential plan, given that the control measures should be applied only if pest density reaches this targeted level [42]. The economic damage threshold of 2.5 egg masses/tree applied for cork oak forests in Sardinia was similar to that of 1.79 egg masses/tree under burlap bands in oak forests in North America [25], mainly considering that L. dispar populations in North America did not co-evolve with their hosts and are not completely regulated by native predators and parasitoids [60,61]. Moreover, L. dispar can have different development performance depending on the host species [62,63], so the economic damage threshold can change from one to another host. For all these reasons, effectiveness of a sequential sampling plan should be tested before its general application, and calibration of the model parameters is highly recommended when significant differences in environmental conditions occur, compared to those in which it was developed.
The spatial distribution of L. dispar egg masses in cork oak forests was aggregated and the pattern was not influenced by the different gradation phases, thus indicating that the parameters are generally applicable even when the population development phase is unknown. However, the parameters should be reassessed when different environmental conditions (e.g., main host species) occur because spatial distribution could be consequently affected [29,33]. Although egg mass spatial distribution was not influenced by gradation phases, sampling should be performed paying attention to further potential biological indicators, such as the average height of oviposition on trees above soil surface, which varies depending on the gradation phase in Mediterranean forests [24], and length of egg masses. The latter represents an effective estimator of L. dispar fecundity [64], and was more precise than egg mass density in predicting oak defoliation in North America [65]. These indicators should be taken into account, especially when the estimated population density is close to the economic damage threshold. Similar egg mass densities can have different consequences in term of defoliation depending on the gradation phase. In Sardinia, an average density of approximately 2.5 egg masses/tree causes severe defoliation in progradation, whereas the same population density could lead to partial defoliation in the retrogradation phase (authors’ personal observation). This discrepancy is mainly due to both the effect on L. dispar mortality by the natural enemy complex, which acts mainly after the culmination phase [61,66], and fecundity (i.e., average number of eggs per egg mass) being generally lower in retrogradation than in other population development phases [24,64].
Following the enumerative sequential sampling plan, a sample size of 31 trees is required for estimating an average density of 2.5 egg masses/tree (i.e., economic damage threshold) with a precision level of 0.25. This value is lower than that of 40 cork oaks sampled with the conventional sampling protocol proposed by Fraval and collaborators [27]. Contrarily, when the level of precision of 0.10 was set, the number of trees needed to be sampled was considerably higher (191) than the standard sampling method. Since a level of precision of 0.25 is adequate for extensive monitoring protocols [42], an enumerative sampling plan at P = 0.25 can be suitably applied to minimize the effort in sampling egg masses in Mediterranean cork oak forests. Although a higher number of samples should be necessary to estimate the moth density at low population level, the proposed method can be quite adequate to support control programs against L. dispar because it provides information about whether or not the pest reaches an economic damage threshold.
For decision-making purposes, binomial sequential sampling plans are more suitable and less labor intensive than enumerative plans [46]. Validation procedures showed that both binomial sampling plans required an ASN higher than that of enumerative plans. In fact, ASNs in binomial plans ranged from 8 to 98 and from 17 to 212 when occupied (tally threshold = 1 egg mass) and infested (tally threshold = 3 egg masses) trees were considered, respectively (Table 4). Moreover, the binomial sequential plan based on infested trees in the culmination phase showed an accuracy higher than 95% in making the correct decision to treat or not to treat (Table 4), whereas the probability of making an incorrect decision of not treating was lower than 5%. This result is of particular interest and shed light on the suitability of binomial sampling plans for decision-making purposes, mainly when the pest population density exceeds the economic damage threshold in the culmination phase. In fact, Bacillus thuringiensis serovar kurstaki applications in the culmination phase significantly decreased the damage on trees, enhancing the long-term effectiveness of treatment as well [8]. In line with this, the binomial sequential plan developed on occupied trees was not as accurate as that developed on infested trees, as the probability of making an incorrect decision in the culmination phase reached values of about 10%. Since the sample size is fundamental for selecting sampling procedures [67], our results suggest that binomial sampling plans at both ATs can be considered as effective as the enumerative plan for decision-making purposes in Mediterranean environmental conditions. However, the availability of each sequential plan should be evaluated in field conditions by calculating the sampling time, as the amount of time required for either counting all the egg masses on trees or evaluating only the occurrence of occupied and infested trees varies largely.

5. Conclusions

The application of a well-defined sequential sampling plan for monitoring L. dispar could notably improve IPM programs in Mediterranean area. With some differences in accuracy, all the sampling plans proved to be similarly effective, regardless of the pest population development phase, so much so that they could be applied effectively even when the gradation phase is unknown. Both enumerative and binomial sampling plans could represent a better option for monitoring L. dispar egg masses in Mediterranean cork oak forests, compared to the conventional sampling method currently adopted, to support decision-making for insecticide applications, mainly because of lower costs and time consumption. Future research will evaluate accurately the sampling effort associated with each sequential plan in order to determine the most suitable method and time saving.

Author Contributions

A.L. and R.M. conceived and designed the research. R.M. analyzed the data. R.M., M.O., A.C. and A.L. wrote the manuscript. All authors have read and agreed to the published version of the manuscript.

Funding

This research received no external funding.

Institutional Review Board Statement

Not applicable.

Informed Consent Statement

Not applicable.

Data Availability Statement

The data that support the findings of the present study are available upon reasonable request from the corresponding author.

Acknowledgments

R.M., M.O., A.C. and A.L. gratefully acknowledge the financial support of the University of Sassari (Fondo di Ateneo per la Ricerca 2020). AC gratefully acknowledges the RESTART-UNINUORO Project “Azioni per la valorizzazione delle risorse agroforestali della Sardegna centrale/Actions for the valorisation of agroforestry resources in central Sardinia” (Regione Autonoma della Sardegna, D.G.R. N. 29/1 of 7 June 2018—fondi FSC 2014–2020) for financial support. RM is funded by MUR (Italian Ministry of University and Research) in the framework of the European Social Funding REACT-EU, National Program for Research and Innovation 2014–2020.

Conflicts of Interest

The authors declare no conflict of interest.

References

  1. Elkinton, J.S.; Liebhold, A.M. Population dynamics of gypsy moth in North America. Annu. Rev. Entomol. 1990, 35, 571–596. [Google Scholar] [CrossRef]
  2. Tiberi, R.; Branco, M.; Bracalini, M.; Croci, F.; Panzavolta, T. Cork oak pests: A review of insect damage and management. Ann. For. Sci. 2016, 73, 219–232. [Google Scholar] [CrossRef] [Green Version]
  3. Liebhold, A.M.; Elkinton, J.S.; Zhou, C.; Hohn, M.E.; Rossi, R.E.; Boettner, G.H.; Boettner, C.W.; Burnham, C.; McManus, M.L. Regional correlation of gypsy moth (Lepidoptera: Lymantriidae) defoliation with counts of egg masses, pupae, and male moths. Environ. Entomol. 1995, 24, 193–203. [Google Scholar] [CrossRef]
  4. Floris, I.; Cocco, A.; Buffa, F.; Mannu, R.; Satta, A. Insect pests of Eucalyptus plantations in Sardinia (Italy). Redia 2018, 101, 61–71. [Google Scholar] [CrossRef]
  5. Luciano, P.; Prota, R. Insect pests in Sardinian cork-oak forests. IOBC WPRS Bull. 1995, 18, 1–7. [Google Scholar]
  6. Lentini, A.; Mannu, R.; Cocco, A.; Ruiu, P.A.; Cerboneschi, A.; Luciano, P. Long-term monitoring and microbiological control programs against lepidopteran defoliators in the cork oak forests of Sardinia (Italy). Ann. Silvic. Res. 2020, 45, 21–30. [Google Scholar] [CrossRef]
  7. Liebhold, A.M.; Gottschalk, K.W.; Mason, D.A.; Bush, R.R. Forest susceptibility to the gypsy moth. J. For. 1997, 95, 20–24. [Google Scholar]
  8. Mannu, R.; Cocco, A.; Luciano, P.; Lentini, A. Influence of Bacillus thuringiensis application timing on population dynamics of gypsy moth in Mediterranean cork oak forests. Pest Manag. Sci. 2020, 76, 1103–1111. [Google Scholar] [CrossRef]
  9. Cocco, A.; Cossu, A.Q.; Erre, P.; Nieddu, G.; Luciano, P. Spatial analysis of gypsy moth populations in Sardinia using geostatistical and climate models. Agric. For. Entomol. 2010, 12, 417–426. [Google Scholar] [CrossRef]
  10. Hlásny, T.; Trombik, J.; Holuša, J.; Lukášová, K.; Grendár, M.; Turčáni, M.; Zúbrik, M.; Tabaković-Tošić, M.; Hirka, A.; Buksha, I.; et al. Multi-decade patterns of gypsy moth fluctuations in the Carpathian Mountains and options for outbreak forecasting. J. Pest Sci. 2016, 89, 413–425. [Google Scholar] [CrossRef]
  11. Inoue, M.N.; Suzuki-Ohno, Y.; Haga, Y.; Arai, H.; Sano, T.; Martemyanov, V.V.; Kunimi, Y. Population dynamics and geographical distribution of the gypsy moth, Lymantria dispar, in Japan. For. Ecol. Manag. 2019, 434, 154–164. [Google Scholar] [CrossRef]
  12. Muzika, R.M.; Liebhold, A.M. Changes in radial increment of host and nonhost tree species with gypsy moth defoliation. Can. J. For. Res. 1999, 29, 1365–1373. [Google Scholar] [CrossRef]
  13. Cambini, A. Valutazione dei danni causati dagli insetti defogliatori alla quercia da sughero. In Proceedings of the Atti del 1 Convegno Regionale del Sughero, Tempio Pausania, Italy, 14–16 October 1971; pp. 327–339. [Google Scholar]
  14. Luciano, P.; Lentini, A. Ten years of microbiological control program against lepidopterous defoliators in Sardinian cork oak forests. IOBC WPRS Bull. 2012, 76, 175–178. [Google Scholar]
  15. Liebhold, A.M.; Halverson, J.A.; Elmes, G.A. Gypsy moth invasion in North America: A quantitative analysis. J. Biogeogr. 1992, 19, 513–520. [Google Scholar] [CrossRef]
  16. Tobin, P.C.; Liebhold, A.M.; Roberts, E.A.; Blackburn, L.M. Estimating spread rates of non-native species: The gypsy moth as a case study. In Pest Risk Modelling and Mapping for Invasive Alien Species; Venette, R.C., Ed.; CABI: Wallingford, UK, 2015; pp. 131–144. [Google Scholar]
  17. Tobin, P.C.; Blackburn, L.M. Slow the Spread: A National Program to Manage the Gypsy Moth; General Technical Report NRS-6.; USDA, Forest Service: Radnor, PA, USA, 2007. [Google Scholar]
  18. Ruiu, L.; Mannu, R.; Falchi, G.; Braggio, A.; Luciano, P. Evaluation of different Bacillus thuringiensis sv kurstaki formulations against Lymantria dispar and Malacosoma neustria larvae infesting Quercus suber trees. Redia 2013, 96, 27–31. [Google Scholar]
  19. Ruiu, L.; Mannu, R.; Olivieri, M.; Lentini, A. Gypsy moth management with LdMNPV Baculovirus in cork oak forest. Forests 2021, 12, 495. [Google Scholar] [CrossRef]
  20. Olivieri, M.; Mannu, R.; Ruiu, L.; Ruiu, P.A.; Lentini, A. Comparative efficacy trials with two different Bacillus thuringiensis serovar kurstaki strains against gypsy moth in Mediterranean cork oak forests. Forests 2021, 12, 602. [Google Scholar] [CrossRef]
  21. Sharov, A.A.; Liebhold, A.M.; Roberts, A.E. Methods for monitoring the spread of gypsy moth (Lepidoptera: Lymantriidae) populations in the Appalachian Mountains. J. Econ. Entomol. 1997, 90, 1259–1266. [Google Scholar] [CrossRef]
  22. Wilson, R.W., Jr.; Fontaine, G.A. Gypsy moth Handbook: Gypsy Moth Egg Mass Sampling with Fixed- and Variable-Radius Plot; Agricultural Handbook No. 523; USDA: Radnor, PA, USA, 1978. [Google Scholar]
  23. Wilson, R.W., Jr.; Ivanowsky, W.M.; Talerico, R.L. Direct Evaluation. The Gypsy Moth: Research Toward Integrated Pest Management; Technical Bulletin No. 1584; Doane, C.C., McManus, M.L., Eds.; USDA, Forest Service: Washington, MD, USA, 1981; pp. 34–38. [Google Scholar]
  24. Luciano, P.; Prota, R. La dinamica di popolazione di Lymantria dispar L. in Sardegna. Indicatori della gradazione ricavati dalle ovideposizioni. Studi Sassar. III 1981, 27, 137–160. [Google Scholar]
  25. Liebhold, A.M.; Gottschalk, K.W.; Muzika, R.M.; Montgomery, M.E.; Young, R.; O’Day, K.; Kelley, B. Suitability of North American Tree Species to the Gypsy Moth: A Summary of Field and Laboratory Tests; General Technical Report No. NE-211; USDA, Forest Service: Radnor, PA, USA, 1995. [Google Scholar]
  26. Mannu, R.; Gilioli, G.; Luciano, P. Occupancy of the territory by Lymantria dispar (L.) (Lepidoptera Erebidae) egg masses as a predictive index of damage. Redia 2017, 100, 157–165. [Google Scholar] [CrossRef]
  27. Fraval, A.; Herard, F.; Jarry, M. Methodes d’echantillonage des populations de pontes de L. dispar (Lep.: Lymantriidae) en Mamora (Maroc). Ann. Zool. Ecol. Anim. 1978, 10, 267–279. [Google Scholar]
  28. Liebhold, A.M.; Thorpe, K.; Ghent, J.; Lyons, D.B. Gypsy Moth Egg Mass Sampling for Decision Making: A Users’ Guide; Forest Health Protection No. NA-TP-04-94; USDA, Forest Service: Broomall, PA, USA, 1994. [Google Scholar]
  29. Fleischer, S.J.; Ravlin, F.W.; Reardon, R.C. Implementation of sequential sampling plans for gypsy moth (Lepidoptera: Lymantriidae) egg masses in eastern hardwood forests. J. Econ. Entomol. 1991, 84, 1100–1107. [Google Scholar] [CrossRef]
  30. Liebhold, A.; Twardus, D.; Buonaccorsi, J. Evaluation of the timed-walk method of estimating gypsy moth (Lepidoptera: Lymantriidae) egg mass densities. J. Econ. Entomol. 1991, 84, 1774–1781. [Google Scholar] [CrossRef]
  31. Luciano, P.; Prota, R. Osservazioni sulla densità di popolazione di Lymantria dispar L. nelle principali aree subericole della Sardegna. Studi Sassar. III 1982, 28, 168–179. [Google Scholar]
  32. Kolodny-Hirsch, D.M. Evaluation of methods for sampling gypsy moth (Lepidoptera: Lymantriidae) egg mass populations and development of sequential sampling plans. Environ. Entomol. 1986, 15, 122–127. [Google Scholar] [CrossRef]
  33. Carter, J.N.; Ravlin, F.W.; Fleischer, S.J. Sequential egg mass sampling plans for gypsy moth (Lepidoptera: Lymantriidae) management in urban and suburban habitats. J. Econ. Entomol. 1994, 87, 999–1003. [Google Scholar] [CrossRef]
  34. Aronson, J.; Pereira, J.S.; Pausas, J.G. Cork Oak Woodlands on the Edge: Ecology, Adaptive Management, and Restoration; Island Press: Washington, DC, USA, 2009. [Google Scholar]
  35. Green, R.H. On fixed precision level sequential sampling. Res. Popul. Ecol. 1970, 12, 249–251. [Google Scholar] [CrossRef]
  36. Karandinos, M.G. Optimum sample size and comments on some published formulae. Bull. Entomol. Soc. Am. 1976, 22, 417–421. [Google Scholar] [CrossRef]
  37. Taylor, L.R. Aggregation, variance and the mean. Nature 1961, 189, 732–735. [Google Scholar] [CrossRef]
  38. Cocco, A.; Serra, G.; Lentini, A.; Deliperi, S.; Delrio, G. Spatial distribution and sequential sampling plans for Tuta absoluta (Lepidoptera: Gelechiidae) in greenhouse tomato crops. Pest Manag. Sci. 2015, 71, 1311–1323. [Google Scholar] [CrossRef]
  39. Cobain, M.R.D.; Brede, M.; Trueman, C.N. Taylor’s power law captures the effects of environmental variability on community structure: An example from fishes in the North Sea. J. Anim. Ecol. 2021, 88, 290–301. [Google Scholar] [CrossRef] [PubMed] [Green Version]
  40. Penca, C.; Hodges, A.C.; Leppla, N.C.; Cottrell, T.E. Analysis of the spatial distribution and development of sequential sampling plans for Heteropteran-associated fruit injury in Florida peaches. J. Econ. Entomol. 2021, 114, 1823–1833. [Google Scholar] [CrossRef] [PubMed]
  41. Wilson, L.T. Estimating the abundance and impact of arthropod natural enemies in IPM systems. In Biological Control in Agricultural IPM Systems; Hoy, M.A., Herzog, D.C., Eds.; Academic Press: Orlando, FL, USA, 1985; pp. 303–321. [Google Scholar]
  42. Southwood, T.R.E.; Henderson, P.A. Ecological Methods; Blackwell Science: Oxford, UK, 2000. [Google Scholar]
  43. Iwao, S. A new regression method for analyzing the aggregation pattern of animal population. Res. Popul. Ecol. 1968, 10, 1–20. [Google Scholar] [CrossRef]
  44. Kuno, E. Sampling and analysis of insect populations. Annu. Rev. Entomol. 1991, 36, 285–304. [Google Scholar] [CrossRef]
  45. Morisita, M. Composition of the Is-index. Res. Popul. Ecol. 1971, 13, 1–27. [Google Scholar] [CrossRef]
  46. Vinatier, F.; Tixier, P.; Duyck, P.F.; Lescourret, F. Factors and mechanisms explaining spatial heterogeneity: A review of methods for insect populations. Methods Ecol. Evol. 2011, 2, 11–22. [Google Scholar] [CrossRef]
  47. Naranjo, S.E.; Hutchinson, W.D. Validation of arthropod sampling plans using a resampling approach: Software and analysis. Am. Entomol. 1997, 43, 48–57. [Google Scholar] [CrossRef]
  48. Holt, A.R.; Gaston, K.J.; He, F. Occupancy-abundance relationships and spatial distribution: A review. Basic Appl. Ecol. 2002, 3, 1–13. [Google Scholar] [CrossRef]
  49. Gaston, K.J.; Blackburn, T.M.; Lawton, J.H. Interspecific abundance-range size relationships: An appraisal of mechanisms. J. Anim. Ecol. 1997, 66, 579–601. [Google Scholar] [CrossRef] [Green Version]
  50. Wald, A. Sequential Analysis; Wiley: New York, NY, USA, 1947. [Google Scholar]
  51. Onsager, J.A. The rationale of sequential sampling, with emphasis on its use in pest management. USDA Tech. Bull. 1976, 1526, 1–19. [Google Scholar]
  52. Binns, M.R.; Nyrop, J.P. Sampling insect populations for the purpose of IPM decision making. Annu. Rev. Entomol. 1992, 37, 427–453. [Google Scholar] [CrossRef]
  53. Van der Vliet, L.; Ritz, C. Statistics for Analyzing Ecotoxicity Test Data. In Encyclopedia of Aquatic Ecotoxicology; Férard, J., Blaise, C., Eds.; Springer: New York, NY, USA, 2015; pp. 1081–1096. [Google Scholar]
  54. Ritz, C.; Baty, F.; Streibig, J.C.; Gerhard, D. Dose-response analysis using R. PLoS ONE 2015, 10, e0146021. [Google Scholar] [CrossRef] [PubMed] [Green Version]
  55. R Development Core Team. R: A Language and Environment for Statistical Computing; R Foundation for Statistical Computing: Vienna, Austria, 2020. [Google Scholar]
  56. Subramanyam, B.H.; Hagstrum, D.W.; Meagher, R.L.; Burkness, E.C.; Hutchinson, W.D.; Naranjo, S.E. Development and evaluation of sequential sampling plans for Cryptolestes ferrugineus (Stephens) (Coleoptera: Cucujidae) infesting farmstored wheat. J. Stored Prod. Res. 1997, 33, 321–329. [Google Scholar] [CrossRef]
  57. Burkness, E.C.; Venette, R.C.; O’Rourke, P.K.; Hutchinson, W.D. Binomial sequential sampling for management of aster leafhopper (Homoptera: Cicadellidae) and aster yellows phytoplasma in carrot: Impact of tally threshold on the accuracy of treatment decisions. Environ. Entomol. 1999, 28, 851–857. [Google Scholar] [CrossRef]
  58. Liebhold, A.; Luzader, E.; Reardon, R.; Bullard, A.; Roberts, A.; Ravlin, W.; Delost, S.; Spears, B. Use of a geographic information system to evaluate regional treatment effects in a gypsy moth (Lepidoptera: Lymantriidae) management program. J. Econ. Entomol. 1996, 89, 1192–1203. [Google Scholar] [CrossRef]
  59. Zhou, G.; Liebhold, A.M. Forecasting gypsy moth defoliation with a geographical information system. Insect Sci. 1995, 2, 83–94. [Google Scholar] [CrossRef]
  60. McManus, M.; Csóka, G.Y. History and impact of gypsy moth in North America and comparison to the recent outbreaks in Europe. Acta Silv. Et Lignaria Hung. 2007, 3, 47–64. [Google Scholar]
  61. Alalouni, U.; Schädler, M.; Brandl, R. Natural enemies and environmental factors affecting the population dynamics of the gypsy moth. J. Appl. Entomol. 2013, 137, 721–738. [Google Scholar] [CrossRef]
  62. Barbosa, P.; Waldvogel, M.; Martinat, P.; Douglass, L.W. Developmental and reproductive performance of the gypsy moth, Lymantria dispar (L.) (Lepidoptera: Lymantriidae), on selected hosts common to mid-Atlantic and southern forests. Environ. Entomol. 1983, 12, 1858–1862. [Google Scholar] [CrossRef]
  63. Milanović, S.; Lazarević, J.; Popović, Z.; Miletić, Z.; Kostić, M.; Radulović, Z.; Karadžić, D.; Vuleta, A. Preference and performance of the larvae of Lymantria dispar (Lepidoptera: Lymantriidae) on three species of European oaks. Eur. J. Entomol. 2014, 111, 371–378. [Google Scholar] [CrossRef] [Green Version]
  64. Jones, C.G.; Steininger, M.K.; Luciano, P.; Moore, K.E. Estimating gypsy moth (Lepidoptera: Lymantriidae) fecundity in the field: Comparison of data from North America and Sardinia, Italy. Environ. Entomol. 1990, 19, 108–110. [Google Scholar] [CrossRef]
  65. Liebhold, A.M.; Simons, E.E.; Sior, A.; Unger, J.D. Forecasting defoliation caused by gypsy moth from field measurements. Environ. Entomol. 1993, 22, 26–32. [Google Scholar] [CrossRef]
  66. Contarini, M.; Luciano, P.; Pilarska, D.; Pilarski, P.; Solter, L.; Huang, W.F.; Georgiev, G. Survey of pathogens and parasitoids in late instar Lymantria dispar larval populations in Sardinia, Italy. Bull. Insectol. 2013, 66, 51–58. [Google Scholar]
  67. Soto, A.; Ohlenschläeger, F.; García-Marí, F. Distribution and sampling of the whiteflies Aleurothrixus floccosus, Dialeurodes citri, and Parabemisia myricae (Homoptera: Aleyrodidae) in citrus in Spain. J. Econ. Entomol. 2002, 95, 167–173. [Google Scholar] [CrossRef]
Figure 1. Sample sizes (A,B) and sequential stop lines (C,D) for the assessment of Lymantria dispar egg mass density on cork oak trees using Green’s method at D = 0.25 (A,C) and D = 0.10 (B,D).
Agronomy 12 01501 g001
Figure 2. Validation of enumerative sampling plans to assess the infestation of Lymantria dispar on cork oak trees, based on Green’s plan showing actual precision levels (A,B) and sample sizes (C,D) calculated at a fixed level of 0.25 (A,C) and 0.10 (B,D). Dotted lines indicate the desired precision levels of 0.10 (A) and 0.20 (B).
Agronomy 12 01501 g002
Figure 3. Relationship between the cumulative number of Lymantria dispar egg masses and the percentage of occupied (with one or more egg masses) and infested (with three or more egg masses) trees. Linear regressions were fitted separately for each phase of gypsy moth population development: progradation (A,D), culmination (B,E), retrogradation (C,F).
Agronomy 12 01501 g003
Figure 4. Decision stop lines for binomial sequential sampling plans of trees occupied (A) or infested (B) by Lymantria dispar in Mediterranean cork oak forests. Binomial plans were obtained from resampling validation analysis based on action thresholds of 58.5% (A) and 40.1% (B) of infested sample units, α and β = 0.1 and a tally threshold of 1 egg mass per tree (A) or 3 egg masses per tree (B).
Agronomy 12 01501 g004
Table 1. Dispersion indices for Lymantria dispar egg masses on cork oak trees in Sardinia (Italy) in 1999–2010.
StageDataset (n)Pest Density Range
(Egg Masses/Tree)
Taylor’s Power Law
ln(a) ± SEMab ± SEMR2
Overall5470.05–59.41.16 ± 0.043.181.45 ± 0.020.90
Progradation1810.07–38.21.15 ± 0.063.151.45 ± 0.040.88
Culmination1740.20–59.40.95 ± 0.112.611.51 ± 0.040.88
Retrogradation1920.01–45.11.22 ± 0.053.421.42 ± 0.030.91
Table 2. Validation of Green’s sequential sampling plan based on resampling approach at fixed-precision levels of 0.25 and 0.10.
Pest Density Range
(Egg Masses/Tree)
Dataset (n)Fixed-Precision Level = 0.25Fixed-Precision Level = 0.10
Mean Precision
(Range)
Mean Sample Size
(Range)
Mean Precision
(Range)
Mean Sample Size
(Range)
1.02–40.55550.183 (0.040–0.395)27.3 (10–52)0.190 (0.040–0.433)164.7 (41–315)
Table 3. Results of linear regression analyses aimed at exploring the relationship between the number of Lymantria dispar egg masses (y) and the percentage of occupied (i.e., trees with 1 or more egg masses) or infested (i.e., trees with 3 or more egg masses) trees (x). Linear regressions were fitted separately for each phase of gypsy moth population development.
ModelStagenEquationR2Fp
Egg mass density~% of occupied treesProgradation181ln(y) = 1.9284x − 0.89520.77602.5<0.001
Culmination174ln(y) = 2.1276x − 0.84660.74490.8<0.001
Retrogradation192ln(y) = 1.9350x − 0.87330.81789.9<0.001
Egg mass density~% of infested treesProgradation181ln(y) = 4.1957x − 2.91130.82842.7<0.001
Culmination174ln(y) = 4.0853x − 3.07040.881310.6<0.001
Retrogradation192ln(y) = 4.3744x − 2.75410.861134.3<0.001
Table 4. Comparison of operation characteristics (OC value) and probabilities of correct (A and D) and incorrect (B and C) control decisions for sequential binomial sampling plans for cork oak trees occupied (AT = 58.5%) or infested (AT = 40.1%) by Lymantria dispar in progradation, culmination, and retrogradation phases.
AT 1TT 2StageDataset (n)OC 3Actual α 4Actual β 5ASN (range) 6A 7D 8A + D 9B 10C 11B + C 12
58.91Progradation1810.4960.0930.09131.4 (8–93)0.4250.3540.7790.1880.0330.221
Culmination1740.5030.0890.08926.9 (11–98)0.7870.0980.8850.0060.1090.115
Retrogradation1920.5050.0920.09627.4 (8–95)0.4150.4090.8240.0160.1600.176
40.13Progradation1810.4880.0980.09042.1 (17–199)0.3870.5190.9060.0720.0220.094
Culmination1740.5090.0910.09935.3 (17–212)0.7700.1960.9660.0230.0110.034
Retrogradation1920.4860.1010.09242.4 (17–193)0.4090.5080.9170.0210.0620.083
1 Action thresholds (%). 2 Tally threshold: minimum number of egg masses necessary to classify a tree either as occupied (1) or infested (3) by L. dispar. 3 Probability of not treating when the pest population density reaches the AT. 4 Probability of treating when the pest density is below the AT (type I error). 5 Probability of not treating when the pest density is above the AT (type II error). 6 Number of samples required to make a pest control decision (i.e., to treat or not to treat). 7 Correct decision to treat. 8 Correct decision not to treat. 9 Overall probability of making a correct pest control decision (i.e., to treat or not to treat). 10 Incorrect decision to treat. 11 Incorrect decision not to treat. 12 Overall probability of making an incorrect pest control decision (i.e., to treat or not to treat).
Publisher’s Note: MDPI stays neutral with regard to jurisdictional claims in published maps and institutional affiliations.

