Article

Soil Management, Irrigation and Fertilisation Strategies for N2O Emissions Mitigation in Mediterranean Agricultural Systems

by
Rosa M. Carbonell-Bojollo
1,
Óscar Veroz-González
2,
Emilio J. González-Sánchez
2,3,4,
Rafaela Ordóñez-Fernández
1,
Manuel Moreno-García
1 and
Miguel A. Repullo-Ruibérriz de Torres
1,4,*
1
Agriculture and Environment Area, IFAPA Alameda del Obispo, Apdo. 3092, 14080 Córdoba, Spain
2
Asociación Española de Agricultura de Conservación. Suelos Vivos (AEAC.SV), 14080 Córdoba, Spain
3
Escuela Técnica Superior de Ingeniería Agronómica y de Montes, Universidad de Córdoba, 14014 Córdoba, Spain
4
European Conservation Agriculture Federation (ECAF), Rond Point Schuman, 6, Box 5, 1040 Brussels, Belgium
*
Author to whom correspondence should be addressed.
Agronomy 2022, 12(6), 1349; https://doi.org/10.3390/agronomy12061349
Submission received: 9 May 2022 / Revised: 26 May 2022 / Accepted: 30 May 2022 / Published: 1 June 2022

Abstract

:
Feeding a growing population, which will reach 10 billion in 2050, is a major challenge. Another major challenge is to increase crops’ productivity in a sustainable way, as the increase in agricultural inputs may lead to greenhouse gas emissions, including N2O fertiliser. Several factors can influence N2O emissions such as irrigation, the soil management system, or the type of fertiliser used. The aim of this research is to study the impact of each above-mentioned factor on N2O emissions during three growing seasons in a maize field, considering three nitrogen fertilisers: urea (U), ammonium nitrate (AN), and a fertiliser with the nitrification inhibitor 3,4-dimethylpyrazole phosphate (DMPP); two irrigation strategies: on demand (100%) and deficit irrigation (75% of demand); and a comparison of two soil management systems: conventional tillage (T) systems and no-tillage (NT) system. The interactions among the three factors and their effects on emissions were analysed through a principal component analysis. Higher emissions were recorded in plots that received the highest irrigation dose. The most favourable management to reduce N2O emissions derived from agricultural activity for maize crops under a Mediterranean climate was the NT soil management, using a fertiliser with nitrification inhibitor and an irrigation dose of 75% of conventional irrigation.

1. Introduction

Because of the exponential population growth in different parts of the world, the population will reach 10 billion this century. Currently, the world population is 7.3 billion inhabitants, but it will reach 8.5 billion in 2030 and 9.7 billion in 2050, according to a recent UN report [1]. To meet this increasingly growing demand for food throughout the world, it is necessary to use higher inputs in agriculture, i.e., water and fertiliser, leading to a potential increase in nitrous oxide (N2O) emissions. In fact, the use of nitrogen fertilisers over the last 60 years has multiplied seven times [2,3].
In the mid-twentieth century, N2O emissions to the atmosphere, caused directly or indirectly by the use of nitrogen fertilisers, did not reach 50%. However, the trend has changed, and fertiliser use accounts for more than 66% of the total emissions [4].
Soils naturally emit N2O due to two microbiological processes that are part of the N cycle, such as denitrification and nitrification, with the denitrification process (anaerobic) presenting greater N2O production than the nitrification process (aerobic) [5,6]. However, the application of fertilisers (organic and synthetic) is considered to be the most important anthropogenic source of N2O emissions (c. 70% of the total worldwide), mainly produced as a by-product or intermediate product of microbial processes (nitrification and denitrification) [7,8]. Over-fertilising crops leads to an exponential increase in N2O emissions in the atmosphere [9]. Over the last 150 years, the levels of N2O emissions have increased from 11 to 18 Tg N year−1 [10].
In terms of climate change, the importance of this gas is given by its global warming potential: one kg of N2O is equivalent to 298 kg of CO2, lasting in effect for 114 years [11]. Another environmental concern worth mentioning is that nitrous oxide also contributes to the destruction of stratospheric ozone [12]. Thus, the factors that most intervene in its production should be studied, as should the agricultural practices that can reduce its emissions. The main factors involved in nitrification and denitrification processes are soil moisture [13], texture, nutrient content, and vegetation [14], which are all influenced by environmental conditions and soil management.
Regarding fertiliser, several aspects influence the emissions of N2O, such as the fertiliser application method [15], the dose and formulation of the fertiliser, and the timing of its application during the crop cycle [16]. Studies on the optimal dose and number of top dressings of fertiliser to apply in order to reduce greenhouse gases (GHG) indicate that average N2O reduction percentages can be nearly 40% [17,18]. However, the success of these measures is highly influenced by the climatic conditions of the study area, which, in most cases, have a greater impact on the efficiency of the fertiliser than the form of application. Other studies have focused on comparing the effect of traditional fertilisers on N2O emissions with other fertilisers that include inhibitors of biochemical processes in their formulas, such as nitrification and urease inhibitors. In Mediterranean environments, nitrification inhibitors have been effective in reducing gas flow [19,20,21,22]. Nevertheless, the success of this measure is affected by soil factors and climatic conditions. Regarding urease inhibitors, although their purpose was to reduce NH3 emissions, recent studies have reported their effectiveness in reducing N2O in extensive crops [23,24].
Soil management systems have a high impact on GHG emissions [25,26]. Therefore, a great effort has been made at the research level to find agricultural practices that favour emission reductions. Not all agricultural systems are considered large GHG producers; conservation agriculture includes a series of soil management practices, including no-tillage practices, which help minimize CO2 emissions and increase soil carbon sequestration [27,28]. However, regarding N2O emissions, there is no clear consensus in the scientific community related to the influence of soil management practices on these emissions. The controversy is due to the large number of parameters (physical, chemical, and biological) that may have an influence.
The soil organic carbon is the most important factor, affecting a wide range of denitrifying microorganisms [29]. In soils with high carbon content and good humidity, which are the characteristics of systems based on no-tillage practices, the nitrification and denitrification processes are expected to be altered, influencing the N2O emissions to the atmosphere [30].
On the other hand, when the soil is tilled, organic C and N forms are released from the aggregates that provide a substrate for the mineralization of soil organic matter as well as for nitrification and denitrification [31], which affect the nitrogen gas generation potential. In addition, according to several authors [32,33] long-term tillage reduces the soil’s ability to retain N, stimulates the production of nitrate (NO3) through nitrification, and decreases the ability to immobilize N due to the decrease in the C availability.
While some studies have concluded that N2O emissions are higher in conservation tillage systems [34,35], others show that they are higher in conventional tillage systems [36,37], and others conclude that the tillage system does not influence emissions [38,39,40].
Regarding irrigation, the amount of water in the soil is a key factor that affects the biological processes in the soil, generating conditions that can favour the emission of gases and condition the success of other implemented gas reduction practices. Sanz-Cobena et al. [23] observed that an excess in irrigation water application, in a maize crop, decreased the capacity of the inhibitor to reduce nitrogen losses in the form of N2O and NO. Similar results were seen in Carbonell et al. [41].
Some of the reviewed studies refer to deficit irrigation strategies, associating the lower use of water with a reduction in energy consumption, up to 30% in some studies, and consequently, a decrease in CO2-eq. rates [42,43]. Other studies refer to the introduction of technologies, such as drip irrigation, that imply a more efficient use of irrigation water and that, through more frequent irrigations, generate “dry” and “wet” areas in the soil, decreasing general soil moisture and favouring nitrification over denitrification, which ends up reducing N2O emissions [44,45,46].
Most current studies focus on one or two factors, such as fertilisation or tillage systems, but there is a lack of multivariable studies that consider fertiliser, soil management systems, and deficit irrigation at the same time. This research tests the hypothesis that a multivariable analysis allows for a clearer understanding on the dynamic of N2O emissions in Mediterranean environments. Thus, the impact of different management strategies based on those factors was studied for a maize field in the Mediterranean-climate, aiming to establish which system has a greater influence on reducing N2O emissions.

2. Materials and Methods

2.1. Experimental Site

A field experiment was conducted to study the dynamics of N2O emissions from the soil as influenced by different variables: soil management, type of fertiliser, and irrigation doses.
The study plots are located in a Mediterranean area with a xeric regime. The climatic conditions of the study area follow the pattern of the Mediterranean climate, which is characterized by a temperate climate with a rainy season in autumn and winter that concentrates 80% of the total annual precipitation, and very dry and hot summers.
The selected farm is located in Córdoba (Southern Spain: 37°51′48″ N; 4°47′29″ W), and the studies were carried out over three agricultural seasons: 2016, 2017, and 2018. Maize (Zea mays L.) under irrigation was the crop implanted during the whole study.

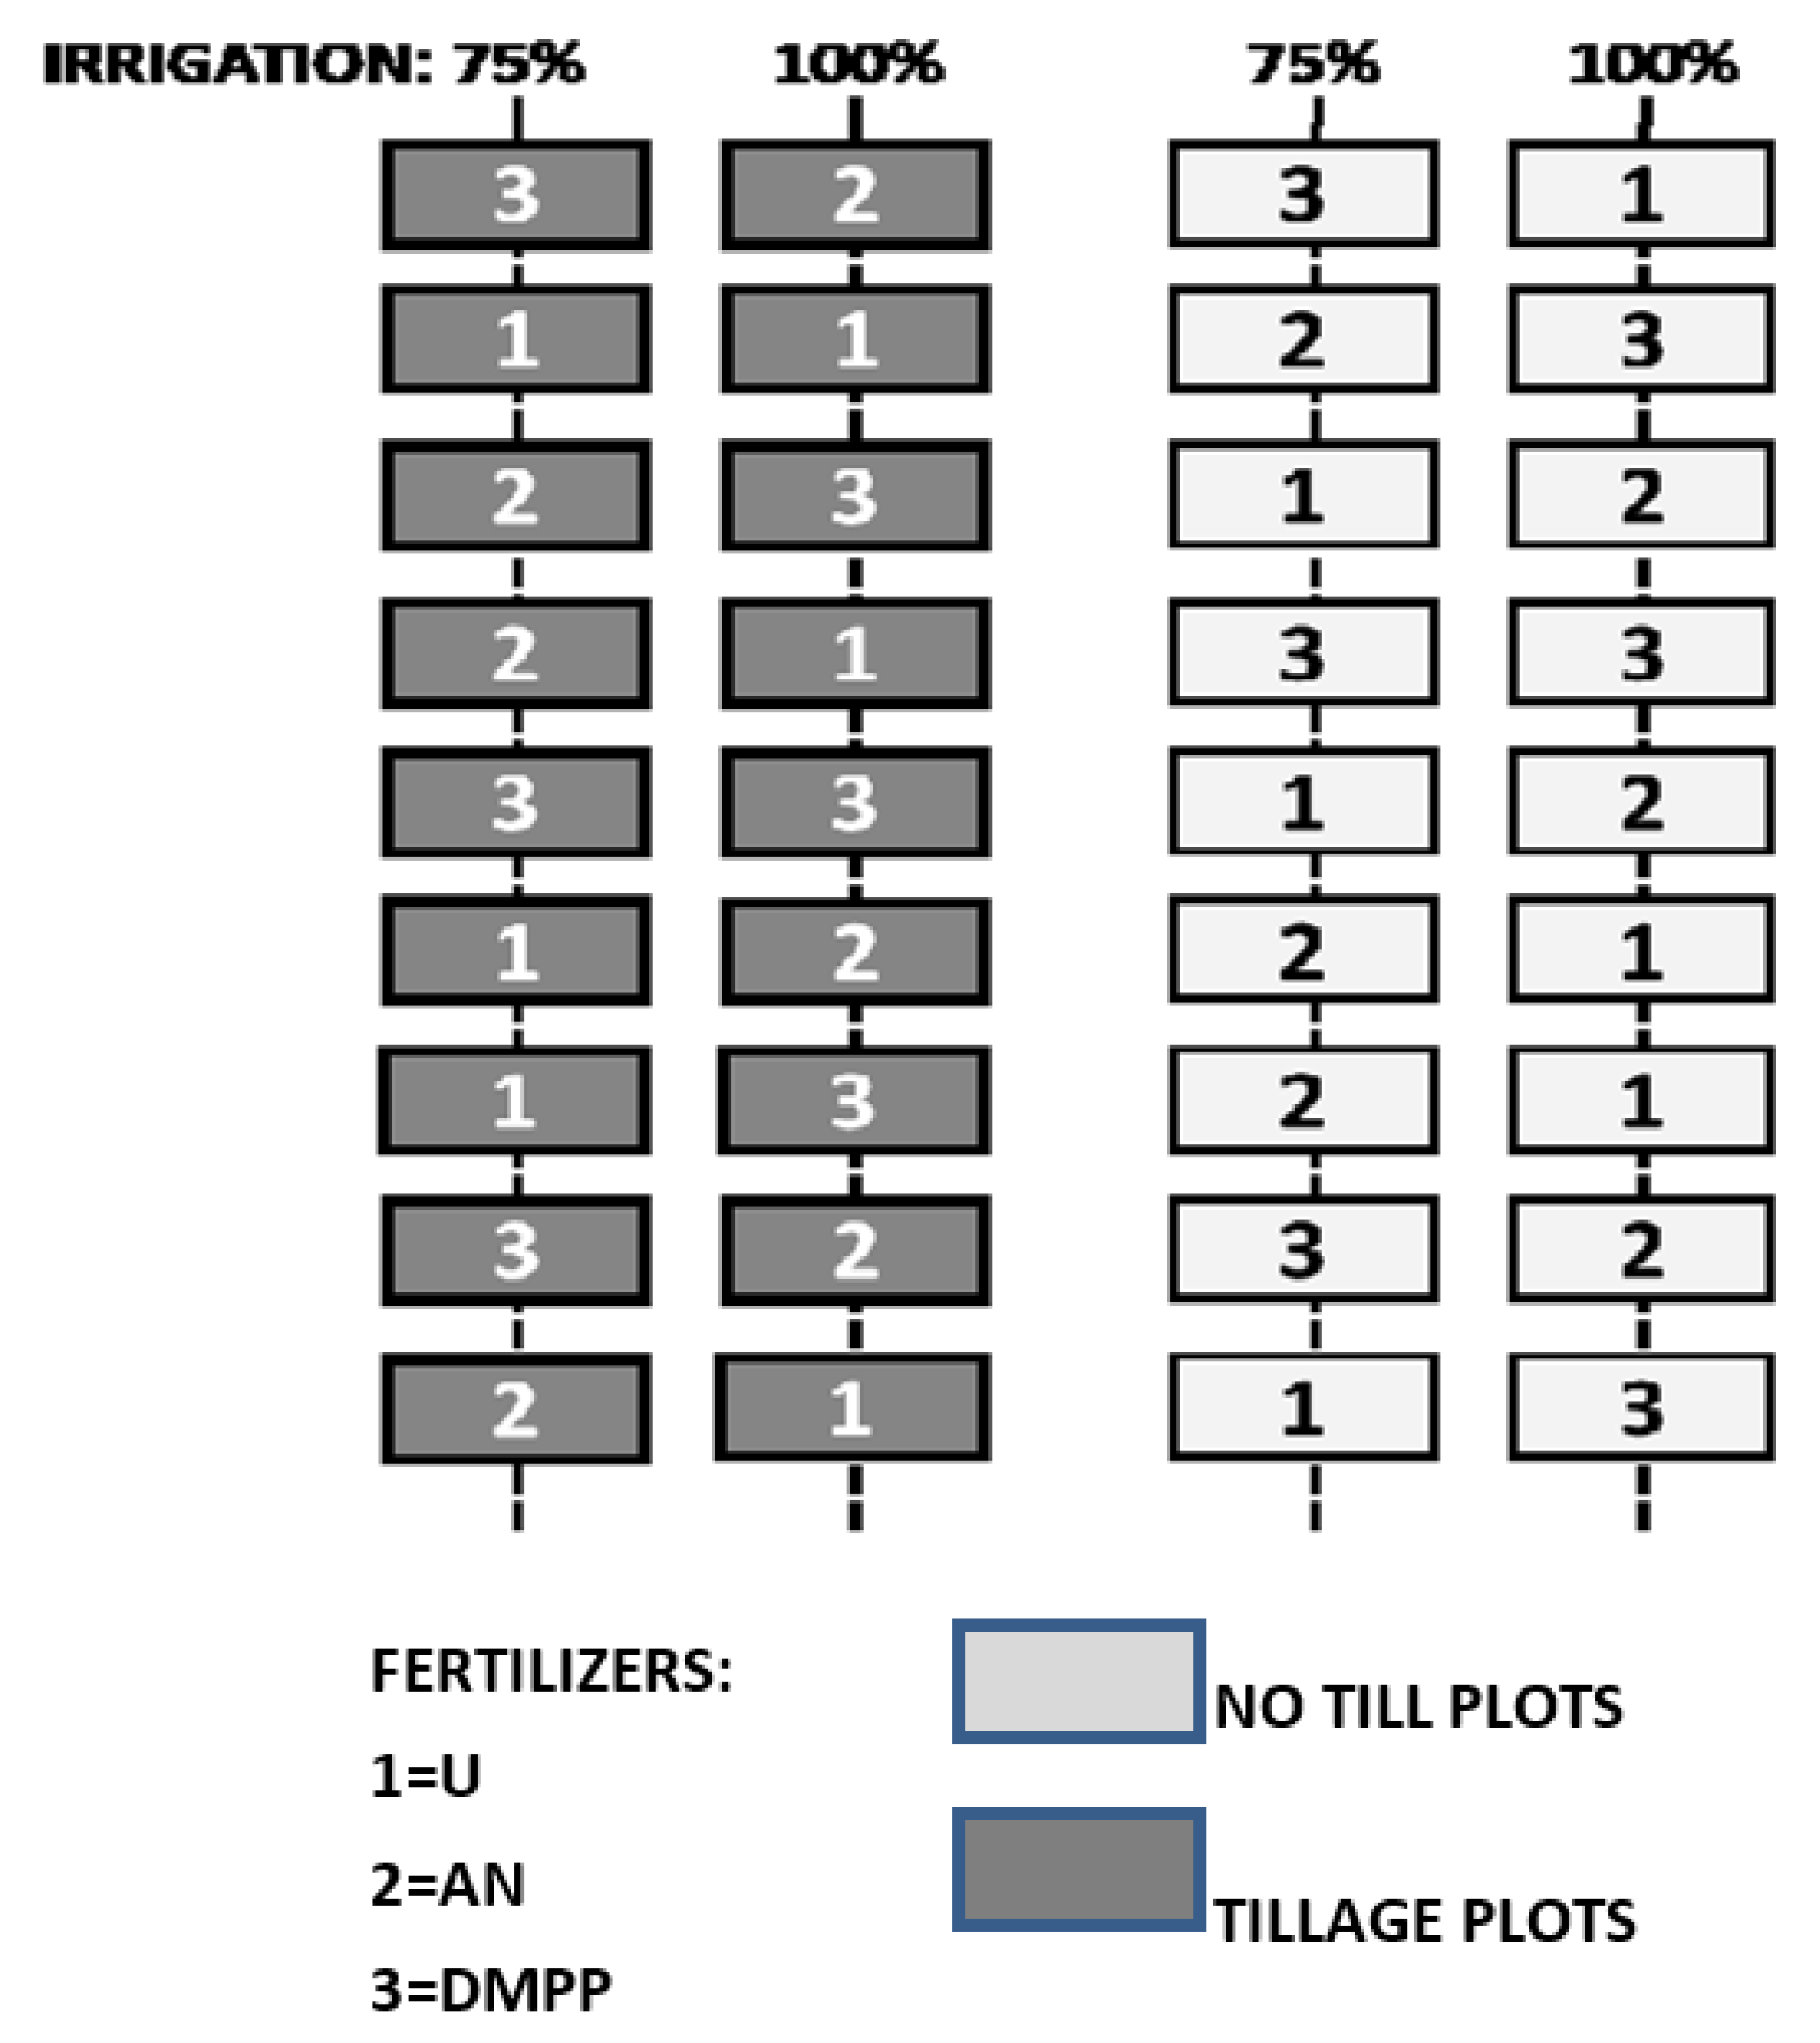
2.2. Experimental Design

As an experimental design, a split-split plot was chosen with three replicates. The factors considered in the study were the following:
1. Soil management system
Two different systems were implemented:
1.1—No-tillage (NT);
1.2—Conventional tillage (T).
The list of tasks performed in both management systems is shown in Table 1.
Residues after harvest were not removed from the field in either soil management. The soil management conducted before the experiment consisted of conventional tillage, alternating between cereal and sunflower as crop rotation. The no-tillage area was not ploughed in the season prior to the experiment.
2. Irrigation dose
After sowing the maize and fertilizing the plots, the irrigation calendar began. Then, the experimental field was irrigated three days per week. Irrigation was carried out using drippers in alternate rows. Two doses were used:
2.1—Full dose on crop demand: 100%;
2.2—Deficient dose, up to 75%.
Preliminary tests had been carried out to establish that the deficit irrigation of 75% did not compromise the final production. A total of 100% of the crop water demand was determined through evapotranspiration, according to FAO-56 [47]. Reference evaporation data were taken from a meteorological station located 1200 m from the experimental field, belonging to the network of agricultural weather stations (RIA, “Red de Información Agroclimática”) of the Andalusia Regional Ministry of Agriculture, Livestock, Fisheries and Sustainable Development (Spain). An efficiency of 90% was used for drip irrigation.
3. Type of the used nitrogen fertiliser
All plots received 400 kg ha−1 of basic fertiliser 8-15-15 (N-P2O5-K2O). Although different types of fertiliser were used, the total N was the same for all the experimental plots. The amount of fertiliser was adjusted according to the N-richness of each type of used fertiliser. In order to calculate the dose of fertiliser to be applied, 300 kg N ha−1 was used, which is the dose normally used for irrigated maize crops in the area. The equivalent amount of each formulation was calculated, and the amount of N that had been applied with the initial fertilisation (32 kg N ha−1) was subtracted. The three fertilisers used in the study were urea (U), calcium ammonium nitrate (AN), and a fertiliser with a nitrification inhibitor that consists of ammonium sulphate nitrate (18.5% NH4+-N; 7.5% NO3-N) with 0.8% (regarding ammoniacal N) of the nitrification inhibitor 3,4-dimethylpyrazole phosphate (DMPP). The doses and the application dates are shown in Table 2.
Given the experimental unit size, fertilisation tasks were carried out manually, spreading the fertiliser homogenously.
In the experimental design, the main factor was the soil management system (NT, T), which included irrigation (100, 75%) as the subplot factor and the fertilisation strategy (U, AN, DMPP) as the sub subplot factor. Each experimental unit (sub-subplot) had a dimension of 5 × 10 m2, and nine sub-subplots were established per irrigation dose and soil management system (Figure 1).

2.3. Soil and Irrigation Water Analysis and Maize Production

Soil samples were taken at two depths (0–20 and 20–40 cm) with an Edelman auger during the study period in order to analyse the nitrate content through the method described by Griess–Ilosvay [48]. The nitrate in the irrigation water was also measured periodically in order to assess all sources that affect the soil nitrate. Nitrate concentration in water was also analysed by the method described by Griess–Ilosvay after reduction in a copperised cadmium column. At the beginning of the study, a soil sampling was taken at several depths (up to 60 cm) in order to define the physical and chemical characteristics of the study site (Table 3).
Maize production was measured by the manual harvest of two crop rows in each experimental unit.

2.4. Emission Measurements

In order to measure gases, the closed-chamber approach described by Ryden and Rolston [49] was used. Cylindrical chambers (30 cm height and 31.5 cm diameter) were installed in the middle of every plot at the beginning of each gas sampling period, taking special care that they were perfectly embedded in the soil (approximately 3 cm) to avoid gas exchange with the environment. Sampling was always performed between 10:00 and 14:00 to avoid the effect of diurnal variability. The chambers were placed in the inter-rows with a drip line to test the effect of the different irrigation doses.
The chambers were closed for about 60 min, allowing us to determine the concentration of N2O. The procedure for collecting gas is as follows: from each chamber, a 20 mL gaseous sample was extracted with a syringe and collected in vials with a septum, in which the gas was deposited under pressure. In addition to the samples taken from different chambers, environmental samples were also taken at the beginning and at the end of the sampling period. The linearity of flux was checked through measurement at 0, 20, 40, 60, and 80 min in one chamber per block, soil management, and irrigation dose. The extracted gas samples were analysed with a gas chromatograph (PerkinElmer Clarus gas chromatograph fitted with a Turbomatrix 110 automated head-space sampler and an electron capture detector for N2O analysis). The sampling frequency is shown in Table 4.

2.5. Data Analysis

For the soil and production data, the Statistix v.8.0 program was used. The comparison of means was made using the least significant difference (LSD) test with p < 0.05.
For the gas emission data, a principal component (PC) study was made [50], as was an analysis with hierarchical conglomerates, using the Statistix v.8.0 and SPSS v.11 programs. The purpose of these analyses was to study the importance of different factors for the gas emission to the atmosphere. The analysis began with an initial number of variables, and finally obtained a lower number of variables, which was a linear combination of the initial variables. The number of components was obtained following the rule of choosing those ones whose values were higher than the unit value.
The first principal component (PC1) explains most of the variance of the data series, and each successive PC adds smaller amounts of the remaining variance.

3. Results

3.1. Soil Nitrate, Irrigation Doses, and Maize Production

The soil assessment carried out during the study period shows a descending trend along the crop development, considering the fertilisations applied in the first stages of the growing season. In the first season, the values ranged between 80 mg NO3 kg−1 (first stages) and 5 mg NO3 kg−1 (end of irrigation) at 0–20 cm, and 50–5 mg NO3 kg−1 at 20–40 cm depth. In the second year, the highest values were lower than the previous season, and the lowest values were higher: 70–12 mg NO3 kg−1 at 0–20 cm and 30–10 mg NO3 kg−1 below 20 cm. The third season showed a different pattern: a peak of soil nitrate was measured 20 days after the second top dressing fertilisation and 10 days after the start of irrigation. The peak value was 75 mg NO3 kg−1 for T and 72 for NT at 0–20 cm. At 20–40 cm, the highest value was 51 mg NO3 kg−1 under T and 34 mg NO3 kg−1 in NT. The soil nitrate at a depth of 20–40 cm was higher in T than in NT in this season, without statistically significant differences.
The nitrate content in the irrigation water was between 3–7 mg NO3 L−1, depending on the volume of the source, but significant differences in soil nitrate content between the plots with differentiated irrigations were not found during the study period.
The total volume of irrigation for each dose (100% and 75%) was 8000 and 6000 m3 ha−1 in the first season, and 7400 and 5550 m3 ha−1 for both the second and third seasons. The maize yields in the different seasons are shown in Table 5, according to the irrigation dose. Statistically significant differences in maize production for the three studied factors (irrigation dose, soil management system, and type of fertiliser) were not found in the three seasons.

3.2. Influence of the Soil Management System on N2O Emissions

Figure 2 shows the values obtained in different gas extractions in the maize field during three study seasons and for the two management systems, considering all the emission values for every fertilisation and irrigation thesis in each management system.
In the case of the first season (2016), significant differences were not observed in the emissions related to the soil management system, but the peaks or highest values in the daily data were generally higher in the conventional tillage. The emissions in T became 3% higher than the maximum value in NT.
In the following season (2017), a clear emission peak can be observed that corresponds to the application of the fertiliser. The peak in NT was delayed regarding the T system. An emission of 8 g N2O-N ha−1 day−1 was reached in T system. In NT, the highest daily emission was slightly lower.
Finally, in the last study season (2018), lower peak values were reached than in the others, which could have been caused by the temperature factor since the summer was milder with lower average temperatures during this season. The emissions in T became 4% higher than the maximum value in NT.

3.3. N2O Emissions and Type of the Used Nitrogen Fertiliser

The following figure shows the values obtained in different gas extractions in the maize crop during three study seasons for the three nitrogen fertilisers applied in the study (Figure 3).
In the first season, it can be observed that the emission pattern was similar in all treatments. The emissions had no differences between U and AN at the beginning, as only the basic fertiliser had been applied at this stage. The fertiliser with the nitrification inhibitor was applied at a dose of 35% of its top-dressing N needs at the sowing. However, the emissions with DMPP were lower than the others. During the whole season, the treatments reached peaks between 5 and 8 g N ha−1 day−1, although without significant differences between treatments.
In the second season, the usual pattern of N2O emissions began with very low levels since the plant was still small and the soil had received only basic fertiliser. Increasing emissions were observed after the first application of U and AN. DMPP started emitting earlier, but the increase was smoother. Moreover, the peak obtained with U and AN was 25% higher than that for DMPP. The treatment with the nitrification inhibitor had two peaks of about 7 g N ha−1 day−1; the other fertilisers reached maximum values of 10 g N ha−1 day−1 after starting irrigation and the second fertiliser application. Although there was a progressive decrease in N2O emissions in all treatments, the values remained relatively high until about 140 days after the first fertiliser doses were applied, at which point emissions were below 3 g N ha−1 day−1.
Finally, the emission pattern in the third season was similar to that of the other seasons, but with smaller values on average. The maximum recorded value was 7.6 g N ha−1 day−1 in AN, being 25% higher than the maximum value found in DMPP. The highest peaks were observed at the beginning of irrigation, but the daily pattern of the emission data presented a series of maximums and minimums attributable to the availability of nitric nitrogen in the soil and its humidity conditions. Low emissions were recorded 120 days after the application of the first doses of fertiliser, although it remained after the end of the irrigation. There were no significant differences regarding the type of fertiliser used, reaching some peaks in the different treatments during the season.

3.4. N2O Emissions and Applied Irrigation Dose

As in previous cases, the following figure represents the values obtained in different gas extractions in the maize crop during three study seasons for the two irrigation doses considered in the study (Figure 4).
In general, similar emissions in both systems were observed. In the first season (2016), the highest dose had slightly more emissions than 75% of demand at the first stage. Later, there were hardly any differences. In the following two seasons, corresponding to 2017 and 2018, there were some differences in some samplings. Generally, there were higher emissions in the plots that received the highest irrigation dose. At the end of the second season, it is observed that irrigation at 75% had higher N2O emissions, and most of the emissions in the highest irrigation dose took place previously.
Table 6 summarizes the total emissions accumulated in each season for all the variables in the study. As can be seen, emissions were reduced in the plots managed under conservation agriculture, with respect to those traditionally managed, except for the second season. That reduction, although not very high (3% in total), does not coincide with the studies in which conservation agriculture is considered to be a system that favours the emission of this gas. In the first season, the plots under NT reduced emissions by 9%, with respect to those in conventional tillage.
Regarding the fertiliser variable, the fertiliser with AN caused the greatest emissions throughout the experiment, and the plots treated with DMPP emitted the lowest amount of gas.
Finally, the 100% irrigation dose caused more emissions in all seasons.

3.5. Correlation between the Studied Variables and Analysis of Main Components

Numerous studies indicate that there are a great variety of factors, such as the crop rotation, the soil management system, the type of used nitrogen fertiliser, the time of application, etc., which interact with and significantly influence the emission of N2O from the soil [51,52,53].
In order to identify the variables responsible for most of the emissions, and with the difficulty posed by the total variability in them, an analysis of the main components was carried out, which also allowed us to study the correlations between the analysed parameters [50]. The data used as the basis for the analysis were N2O emissions, the irrigation dose (on demand 100% or 75% deficit), the nitrogen fertiliser (U, AN, DMPP), the soil management system (conventional tillage and no-tillage), the days since the last irrigation, and the nitrate content in the soil at the moment of gas emissions measuring. The final variables PC1, PC2, and PC3 were determined by a linear combination of the initial variables. Table 7 shows the correlation matrix of the variables, together with the final PCs.
In order to study whether there was a trend or behaviour pattern for emissions that can be explained by some variable, each variable has been represented independently (Figure 5).
The first graph corresponds to the fertiliser variable, and only one group, which includes the emission data collected in all the studied cases, is observed. Therefore, a priori, the fertilisation variable does not explain the behaviour of the N2O emission pattern. Regarding the irrigation variable, two perfectly differentiated groups are observed—one of them because of the emission values measured in the plots irrigated with the full dose (100%), and the other one because of emission values recorded in the plots irrigated in deficit (75%). The irrigation variable has an important influence on N2O emissions, regardless of the management system, since in both groups of values there are measurements made on conservation agriculture plots and in the traditionally managed plots.
The representation of the main component values of the soil management variable shows that the emission values corresponding to the plots managed by the no-tillage system belong to the same group, while in the case of the traditional tillage system, two different groups were formed. They were formed because of the interaction with another variable, so the next step was to represent the emissions recorded using the value of their main components, considering, in this case, more than one main variable (Figure 6).
The interaction between the management system and irrigation dose variables represents the first group formed by the emissions generated in the plots under conservation agriculture and the lower irrigation dose (75%). The second group is formed by the emissions in the traditionally tilled plots, which are also 75% irrigated, while the third group is made up of all the emissions generated in the plots irrigated at 100%, regardless of the management system. One conclusion that can be obtained observing the graph is that when a high irrigation dose is used, it favours gas emissions, and the management system will not influence the dynamics of these emissions.
The interaction between the fertiliser and irrigation variables reflects two large groups, the first formed by all the emissions registered on plots irrigated at 100%, regardless of the used fertiliser, and the second group formed by the emissions from the plots irrigated at 75% and fertilized with any of the three fertilisers used in the study. As can be seen, with respect to nitrous oxide emissions, the irrigation variable is still the one that most influences the rest of the variables.
Finally, if the considered variables are the management system and type of fertiliser, depending on the value of their main components, it can be observed that there is no notable difference between the emission values in all the studied cases.
To conclude, the joint interaction of the three variables considered in the study was evaluated and the nitrous oxide emission values were represented considering the value of their main components (Figure 7).
As can be seen, the interaction between all the variables has been decisive in the dynamics of N2O emissions. Subgroups were formed for each combination of the three studied variables, but at the same time, two large groups that included the previous ones were also formed. One of these two groups is made up of all the emissions that have been generated with the 75% irrigation variable, and includes data from the plots in both management systems and with any of the three fertilisation formulations. The other large group is formed, as in the previous case, by data generated in any of the combinations of the soil management and fertiliser variables, but in this case, it only includes the variables generated with the 100% irrigation variable.

4. Discussion

4.1. Soil Management and N2O Emissions

The effects of soil management systems on N2O emissions are the result of changes in soil structure, microorganism activity, the decomposition of residues, soil aeration, and the rate of N mineralization, along with soil temperature and moisture [54].
The application of conservation agriculture principles is widely known as a practice that helps reduce atmospheric CO2 emissions, thanks to the increase in soil organic carbon content due to lower soil disturbance and permanent vegetal soil cover. However, there are many authors who, even in agreeing with the previous statement, do not recognize its importance in mitigating climate change, and they emphasize that this practice also favours an increase in N2O [55]. Soils under NT favour an increase in soil water content and soluble forms of carbon, favouring nitrification processes that promote atmospheric N2O [56,57,58]. Nevertheless, other studies, such as that of Six et al. [59], state that this increase in emissions can be reduced when NT practices are maintained over time.
Our results, as can be seen in Figure 2 and Table 6, coincide with the results of those studies that indicate higher emissions of nitrous oxide in tilled soils compared to those under no-tillage systems. That is the case of Omonode et al. [60], who estimated a 40% reduction in the emission values in NT with respect to T in a study on a maize crop. Van Kessel et al. [61], in a meta-analysis compiling 239 studies on the effect of soil management on N2O emissions, observed an increase in N2O emissions under NT in the first year of implementing this system, and a 27% reduction in the gas emitted in NT compared to T 10 years later. In our case, the greatest percentage of reduction regarding T was seen in the first season. In the second one, NT emitted slightly more nitrous oxide without significant differences.
In a study carried out in a tropical oxisol soil in Brazil, Escobar et al. [62] indicate that the N2O emissions produced after harvest were three times higher in no-till systems compared to conventional ones. This may be due to the characteristics of these tropical systems with greater humidity, higher temperatures, and a greater population of denitrifying microorganisms in no-tillage systems [63].
Corrochano-Monsalve et al. [64] showed lower N2O emissions in NT than in T when applying a fertiliser with nitrification inhibitor, due to the greater water-filled pore space of NT, which favours the inhibition of the nitrification process too. Our results agree with these authors; emissions were reduced by 9% and 3% with NT in the first and third seasons, respectively. Furthermore, DMPP emitted significantly lower amounts of N2O in the first and second seasons in both soil management systems. Emissions in the AN plots were significantly higher than in DMPP in the tillage system at the end of the third season. Even without significant differences, when considering the management system factor, the highest emission peaks are either similar in both management systems, or they are higher in the T-plots, generally after irrigation. This is due to the higher soil moisture in NT, which can saturate the pores with water and delay nitrification processes.
In Mediterranean environments, as is our case, Plaza-Bonilla et al. [65] observed a reduction in the amount of N2O emitted per kg of production in NT with respect to T, although in this case, the crop was grown in dry land. An earlier article written by Plaza-Bonilla et al. [66] also indicated lower or similar emission values in NT compared to T, although the greatest differences can be seen after making changes in the management system and using different management techniques for several years.
Therefore, not all studies agree on higher emissions of N2O in conservation systems. Metay et al. [67] and Jantalia et al. [68] did not observe differences in N2O emissions between the NT and T systems in the Brazilian savannah and in southern Brazil. Liu et al. [69] reached the same conclusion for an irrigated maize field in north-eastern Colorado. Despite the fact that several studies consider that conservation agriculture systems increase nitrous oxide emissions [61,70], the presented results do not show a clear increase; only the cumulated emissions in the second season were higher in NT, as seen in Table 6. Moreover, the importance of the NT system as a variable among all those on which the study of principle components is based does not determine the behaviour of the emission patterns.

4.2. Effect of the Type of Nitrogen Fertiliser on N2O Emissions

The relationship between N2O emissions and the amount of N fertiliser is not completely clear. Even though there are authors, such as Zhang and Han [71], who state that the existing relationship is linear, there are other studies, such as those of Ma et al. [72], that speak about an exponential relationship. Regarding nitrogen fertilisation, most of the studies have focused on comparing traditional fertilisers with other fertilisers that include inhibitors of microbiological processes, such as nitrification and urease inhibitors [23,73,74,75,76].
Our results indicate a higher total volume of emissions on the plots in which the AN was applied (Table 6). This result coincides with those obtained by Signor et al. [53], which show how in a sugarcane crop, emissions increased when the fertiliser contained N in ammonia form. Ammonia fertilisers increase N2O emissions more slowly than nitric fertilisers because the latter kind start denitrification processes immediately, while ammonia sources have to go through the nitrification process first. Two independent studies, both conducted in Brazil, by Zanatta et al. [77] and Signor et al. [53], concluded that nitric fertilisers induced higher N2O emissions than amide fertilisers (CH4NO), data which coincide with the results obtained in our study. Compared to the total amount of measured emissions, bigger amounts were observed in the plots fertilized with the AN than in those that received U as fertiliser.
Regarding the moment in which there were the most emissions, Figure 3 shows that emissions increase after applying the fertiliser, on some occasions after the first application and others after the second one. During the period between the first and second top-dressing fertilisation in the first season, the soil had enough moisture to allow nitrification, since it was raining in that period. These conditions caused all the treatments to emit nitrous oxide to a greater or lesser extent, and the highest values were reached in AN and DMPP treatments. After the rains, the second top-dressing was applied in the treatments with U and AN, but until there were no suitable moisture conditions in the soil, there was no peak of N2O from the soil. From the beginning of irrigation, there was enough humidity, both with irrigation on demand and at 75% of the needs, to allow for nitrification. However, lower N2O emission peaks were observed than after the first top-dressing since the crop was more developed, absorbing more nutrients from soil. These results coincide with those obtained by Schils et al. [78], who concluded that the emissions should be measured during the first two weeks after fertilisation.
According to Shaviv [79], the use of N inhibitor fertilisers is an important strategy to reduce N2O emissions induced by N fertilisers, since they are involved in the nutrients’ release. Figure 3 shows that, on some dates, the plots fertilized with a nitrification inhibitor fertiliser (DMPP) emitted less gas. In the first season, considering that DMPP was applied at sowing, the emissions at the beginning were lower than the others due to the inhibitor that delayed the nitrification. Taking into account the total amount of gas accumulated by the three studied fertilisers, this type of fertiliser emitted the lowest amount of gas during the three studied seasons. DMPP provided N2O emission reductions regarding U and AN over 19%, 14%, and 3% for 2016, 2017, and 2018, respectively. Therefore, there was a clear behaviour of the nitrification inhibitor, with respect to reducing emissions, compared to the rest of traditional fertilisers. The differences with respect to U and AN were significant the first and second seasons in the accumulated emissions.
Some studies, such as the one conducted by Meijide et al. [19], indicate a high N2O mitigation efficiency in rain-fed farms and lower efficiencies in irrigated areas, in which the influence of irrigation is the predominant factor. This finding coincides with that indicated by Recio et al. [8] in a study about the impact of the nitrification inhibitor on the N2O and NH3 emissions in a maize crop in a Mediterranean climate.
Another factor that can improve the mitigating effectiveness of the nitrification inhibitor is the soil organic C content, which is higher in soils with less C and lower in soils with high C content [20,80]. Other authors, such as Gilsanz et al. [21], highlight the impact of temperature on the effectiveness of the inhibitor, indicating an inverse relationship between the increase in temperature and the impact of the inhibitor on the nitrification process, focusing attention on the importance of choosing the most appropriate time of applying N2O to mitigate effects. In our case, and being a spring–summer crop, the temperatures were generally high.

4.3. N2O Emissions and Irrigation Doses

The plots that received the total irrigation dose (100%) showed higher N2O emissions than those that were irrigated with the lower dose. These results coincide with those obtained in a large number of studies, according to which soil moisture content is a fundamental factor that stimulates N2O emissions [81,82,83,84]. At the end of the second season, irrigation at 75% had higher N2O emissions, probably due to that most of the emissions in the highest irrigation dose took place previously, and that the concentration of mineral nitrogen in the soil with a lower irrigation dose was higher.
The amount of water in the soil is a key factor that affects the biological processes in the soil, generating conditions that can favour gas emissions and influence the success of other implemented gas-reduction practices. An example can be seen in Sanz-Cobena et al. [23], who showed that excessive irrigation of maize crop decreases the capacity of an inhibitor to reduce nitrogen losses in the form of N2O and NO. Similar results are seen in Carbonell et al. [41].
Our results are similar to those of Jamali et al. [85] who, in a study that evaluated the influence of the water amount on the N2O emissions in a sorghum crop, presented results which showed that when reducing irrigation from 60–120 mm to 30 mm or below, while irrigating the plots more frequently, emissions were reduced by 41–50%.
Scheer et al. [82] carried out a study in Australia on wheat with three irrigation doses, a high dose, a medium dose, and a low dose. The mean daily emissions of N2O were 5.5 g N2O ha−1 day−1, 3.2 g N2O ha−1 day−1, and 3.3 g N2O ha−1 day−1. In our study, emissions also decreased at the lowest dose in comparison with the highest dose, which showed a 1.2% emissions increase on average.

4.4. Correlation between the Studied Variables

There are several studies that show the correlation between humidity and fertiliser. Lower N2O emissions are generated when the application of the fertiliser is carried out in a dry period (without irrigation) than when it is carried out in humid conditions [71,78]. Our results coincide with these conclusions because the irrigation strongly affects gas emissions, as the results reached in the study about main components show. Similarly, Passianoto et al. [86] concluded that the coincidence of fertilisation with rainy periods causes emission increases.
Kostyanovsky et al. [87] found, in a study carried out in four different locations in the US, that the highest emission peaks occurred in the treatments in which N fertiliser was applied together with irrigation, compared to those registered in the treatment with fertilisation only.
Studies by Robertson et al. [88,89,90] showed that emissions after a rainy period or applied irrigation are probably more controlled by the availability of nitrogen in the soil, together with the organic matter mineralization rate, than by irrigation only. They could also be affected by the soil treatment. In other words, the interaction between all the variables should be studied.
Jamali et al. [91] carried out a study to evaluate the influence of the amount of irrigation applied, of the optimal and reduced dose, and of fertilisation with a nitrification inhibitor of a wheat crop. Their results show that, considering the treatment of reduced irrigation and the inhibitor individually, both treatments reduce N2O emissions; however, the lowest emission values were seen in the combination of both variables. These data coincide with those obtained in our study, in which the lowest N2O values were observed in the plots fertilized with the nitrification inhibitor and with deficit irrigation. This is in agreement with the results by Scheer et al. [92], Liu et al. [93], and Cui et al. [94], who observed maximum emissions when fertilisation and irrigation variables interacted.

5. Conclusions

The reduction in N2O emissions as a climate change -mitigation process is influenced by many aspects, including environmental factors, factors related to soil characteristics, and agronomic factors. It is recommended to consider the joint evaluation of three agricultural factors, such as soil, water, and fertiliser management.
Considering each of the factors individually, fertilisation has a significant impact on the increase in emissions, higher usually after the second top-dressing, which is applied during a period of higher temperature and the in a greater amount (65%). The type of fertiliser also affected the emissions; the highest values were measured in the plots fertilized with AN, being reduced with the fertiliser with a nitrification inhibitor. Irrigation also had an important impact on the amount of emitted gas. The highest emissions were observed normally after irrigating the plots, regardless of the amount of applied water, or after precipitations.
Under the conditions of our study, the joint consideration of the three factors determined that the most favourable management method for reducing N2O emissions derived from agricultural activity in a maize crop in a Mediterranean area was managing the soil with the no-tillage system, using a fertiliser with a nitrification inhibitor, and adjusting the water application to 75% of the conventional irrigation dose.
The role of agriculture as a mitigating action within the climate change scenario is demonstrated by the obtained results, which show that the adoption of certain practices, such as conservation agriculture, the choice of fertiliser, and the volume of irrigation, decreases the amount of N2O emissions. Furthermore, the adoption of conservation agriculture principles, which result in fewer inputs by reducing the number of field tasks, and using less irrigation are recommended as adaptation practices for future scenarios.

Author Contributions

Conceptualization, R.M.C.-B. and R.O.-F.; methodology, R.M.C.-B., Ó.V.-G., M.M.-G., and M.A.R.-R.d.T.; software, E.J.G.-S. and M.M.-G.; validation, Ó.V.-G. and R.O.-F.; formal analysis, R.M.C.-B. and Ó.V.-G.; investigation, R.M.C.-B., R.O.-F., and M.A.R.-R.d.T.; resources, R.M.C.-B. and E.J.G.-S.; data curation, R.O.-F. and M.A.R.-R.d.T.; writing—original draft preparation, R.M.C.-B.; writing—review and editing, R.M.C.-B., Ó.V.-G., R.O.-F., E.J.G.-S., and M.A.R.-R.d.T.; visualization, R.M.C.-B., Ó.V.-G., and M.M.-G.; supervision, R.O.-F.; project administration, Ó.V.-G. and R.O.-F.; funding acquisition, R.O.-F. and E.J.G.-S.. All authors have read and agreed to the published version of the manuscript.

Funding

This research was funded by the LIFE AGROMITIGA project (LIFE17 CCM/ES/000140), financed by the financial instrument LIFE of the European Union, and by the Research and Technological Innovation project PP.AVA.AVA2019.007, financed at 80% by the Andalusian Operational Program 2014–2020 of the European Regional Development Fund (ERDF).

Institutional Review Board Statement

Not applicable.

Informed Consent Statement

Not applicable.

Data Availability Statement

Not applicable.

Acknowledgments

The authors give thanks to the field and laboratory staff of the soil physics and chemistry team of the IFAPA Alameda del Obispo Centre for their collaboration in this study.

Conflicts of Interest

The authors declare no conflict of interest.

References

  1. United Nations (UN). World Population Prospects; The 2015 Revision. Key Findings and Advance Tables; United Nations: New York, NY, USA, 2015; Available online: https://www.un.org/en/development/desa/publications/world-population-prospects-2015-revision.html (accessed on 20 February 2021).
  2. Tilman, D.; Cassman, K.G.; Matson, P.A.; Naylor, R.; Polasky, S. Agricultural sustainability and intensive production practices. Nature 2002, 418, 671–677. [Google Scholar] [CrossRef] [PubMed]
  3. Autret, B.; Beaudoin, N.; Rakotovololona, L.; Bertrand, M.; Grandeau, G.; Gréhan, E.; Ferchaud, F.; Mary, B. Can alternative cropping systems mitigate nitrogen losses and improve GHG balance? Results from a 19-year experiment in Northern France. Geoderma 2019, 342, 20–33. [Google Scholar] [CrossRef]
  4. Mosier, A.R. Exchange of gaseous nitrogen compounds between agricultural systems and the atmosphere. Plant Soil 2001, 228, 17–27. [Google Scholar] [CrossRef]
  5. Bateman, E.J.; Baggs, E.M. Contributions of nitrification and denitrification to N2O emissions from soils at different water-filled pore space. Biol. Fertil. Soils 2005, 41, 379–388. [Google Scholar] [CrossRef]
  6. Hu, H.W.; Chen, D.; He, J.Z. Microbial regulation of gerrestrial nitrous oxide formation: Understanding the biological pathways for prediction of emission rates. FEMS Microbiol. Rev. 2015, 39, 729–749. [Google Scholar] [CrossRef] [PubMed]
  7. Ussiri, D.; Lal, R. Soil Emission of Nitrous Oxide and its Mitigation; Springer: Dordrecht, The Netherlands, 2013. [Google Scholar] [CrossRef]
  8. Recio, J.; Vallejo, A.; LeNoe, J.; Garnier, J.; García-Marcos, S.; Álvarez, J.M.; Sanz-Cobena, A. The effect of nitrification inhibitors on NH3 and N2O emissions in highly N fertilized irrigated Mediterranean cropping systems. Sci. Tot. Environ. 2018, 636, 427–436. [Google Scholar] [CrossRef]
  9. Scherback, I.; Millar, N.; Robertson, G.P. Global metaanalysis of the nonlinear response of soil nitrous oxide (N2O) emissions to fertiliser nitrogen. Proc. Natl. Acad. Sci. USA 2014, 111, 9199–9204. [Google Scholar] [CrossRef] [Green Version]
  10. Kroeze, C.; Mosier, A.; Bouwman, L. Closing the global N2O budget: A retrospective analysis 1500–1994. Glob. Biogeochem. Cycles. 1999, 13, 1–8. [Google Scholar] [CrossRef]
  11. Forster, P.; Ramaswamy, V.; Artaxo, P.; Berntsen, T.; Betts, R.; Fahey, D.W.; Haywood, J.; Lean, J.; Lowe, D.C.; Myhre, G.; et al. Changes in Atmospheric Constituents and in Radiative Forcing. In Climate Change 2007: The Physical Science Basis. Contribution of Working Group I to the Fourth Assessment Report of the Intergovernmental Panel on Climate Change; Solomon, S., Qin, D., Manning, M., Chen, Z., Marquis, M., Averyt, K.B., Tignor, M., Miller, H.L., Eds.; Cambridge University Press: Cambridge, UK; New York, NY, USA, 2007. [Google Scholar]
  12. van Der Weerden, T.J.; Luo, J.; Di, H.J.; Podolyan, A.; Phillips, R.L.; Saggar, S.; de Klein, C.A.M.; Cox, N.; Ettema, P.; Rys, G. Nitrous oxide emissions from urea fertiliser and effluent with and without inhibitors applied to pasture. Agri. Ecosyst. Environ. 2016, 219, 58–70. [Google Scholar] [CrossRef]
  13. Wu, D.; Cárdenas, L.M.; Calvet, S.; Brüggemann, N.; Loick, N.; Liu, S.; Bol, R. The effect of nitrification inhibitor on N2O, NO and N2 emissions under different soil moisture levels in a permanent grassland spol. Soil Biol. Biochem. 2017, 113, 153–160. [Google Scholar] [CrossRef]
  14. Abalos, D.; van Groenigen, J.W.; De Deyn, G.B. What plant functional traits can reduce nitrous oxide emissions from intensively grasslands? Glob. Chang. Biol. 2017, 24, 248–258. [Google Scholar] [CrossRef] [PubMed]
  15. Cárdenas, L.M.; Bhogal, A.; Chadwick, D.R.; McGeough, K.; Misselbrook, T.; Rees, R.M.; Thorman, R.E.; Watson, C.J.; Williams, J.R.; Smith, K.A.; et al. Nitrogen use efficiency and nitrous oxide emissions from five UK fertilised grasslands. Sci. Total Environ. 2019, 661, 696–710. [Google Scholar] [CrossRef]
  16. LaHue, G.T.; van Kessel, C.; Linquist, B.A.; Adviento-Borbe, M.A.; Fonte, S.J. Residual effects of fertilization history increase nitrous oxide emissions from zero-N control; implications for estimating fertiliser induced emission factors. J. Environ. Qual. 2016, 45, 1501–1508. [Google Scholar] [CrossRef] [PubMed] [Green Version]
  17. Abalos, D.; Jeffery, S.; Drury, C.F.; Wagner-Riddle, C. Improving fertiliser management in the US and Canada for N2O mitigation: Understanding potential positive and negative side-effects on maize yields. Agric. Ecosyst. Environ. 2016, 221, 214–221. [Google Scholar] [CrossRef]
  18. Maris, S.C.; Lloveras, J.; Vallejo, A.; Teira-Esmatge, M.R. Effect of Stover Management and Nitrogen Fertilization on N2O and CO2 Emissions from Irrigated Maize in a High Nitrate Mediterranean Soil. Water Air Soil Pollut. 2018, 229, 11. [Google Scholar] [CrossRef]
  19. Meijide, A.; Cárdenas, L.M.; Sánchez-Martín, L.; Vallejo, A. Carbon dioxide and methane fluxes from a barley field amended with organic fertilisers under Mediterranean climatic conditions. Plant Soil. 2010, 28, 353–367. [Google Scholar] [CrossRef]
  20. Marsden, K.A.; Scowen, M.; Hill, P.W.; Jones, D.L.; Chadwick, D.R. Plant acquisition and metabolism of the synthetic nitrification inhibitor dicyandiamide and naturally-occurring guanidine from agricultural soils. Plant Soil 2015, 395, 201–214. [Google Scholar] [CrossRef] [Green Version]
  21. Gilsanz, C.; Báez, D.; Miselbrook, T.H.; Dhanoa, M.S.; Cárdenas, L.M. Development of emission factors and efficiency of two nitrification inhibitors, DCO and DMPP. Agric. Ecosyst. Environ. 2016, 216, 1–18. [Google Scholar] [CrossRef]
  22. Cayuela, M.L.; Aguilera, E.; Sanz-Cobena, A.; Adams, D.C.; Abalos, D.; Barton, L.; Ryals, R.; Silver, W.L.; Alfaro, M.A.; Pappa, V.A.; et al. Direct nitrous oxide emissions in Mediterranean climate cropping systems: Emission factors based on a meta-analysis of available measurement data. Agric. Ecosyst. Environ. 2017, 238, 25–35. [Google Scholar] [CrossRef] [Green Version]
  23. Sanz-Cobena, A.; Sánchez-Martín, L.; García-Torres, L.; Vallejo, A. Gaseous emissions of N2O and NO and NO3 leaching from urea applied with urease and nitrification inhibitors to a maize (Zea mays) crop. Agric. Ecosyst. Environ. 2012, 149, 64–73. [Google Scholar] [CrossRef]
  24. Abalos, D.; Sanz-Cobena, A.; Misselbrook, T.; Vallejo, A. Effectiveness of urease inhibition on the abatement of ammonia, nitrous oxide and nitric oxide emissions in a non-irrigated Mediterranean barley field. Chemosphere 2012, 89, 310–318. [Google Scholar] [CrossRef] [PubMed]
  25. Merino, A.; Pérez-Batallón, P.; Macías, F. Responses of soil organic matter and greenhouse gas fluxes to soil management and land use changes in a humid temperate region of southern Europe. Soil Biol. Biochem. 2004, 36, 917–925. [Google Scholar] [CrossRef]
  26. Galbally, I.E.; Kirstine, W.V.; Meyer, C.P.M.; Wang, Y.P. Soil-atmosphere trace gas exchange in semiarid ans arid zones. J. Environ. Qual. 2008, 37, 599–607. [Google Scholar] [CrossRef] [PubMed]
  27. Carbonell-Bojollo, R.; Veroz-Gonzalez, O.; Ordóñez-Fernández, R.; Moreno-García, M.; Basch, G.; Kassam, A.; Repullo-Ruibérriz de Torres, M.A.; González-Sánchez, E.J. The Effect of Conservation Agriculture and Environmental Factors on CO2 Emissions in a Rainfed Crop Rotation. Sustainability 2019, 11, 3955. [Google Scholar] [CrossRef] [Green Version]
  28. Moreno-García, M.; Repullo-Ruibérriz de Torres, M.A.; González-Sánchez, E.J.; Ordóñez-Fernández, R.; Veroz-González, O.; Carbonell-Bojollo, R.M. Methodology for estimating the impact of no tillage on the 4perMille initiative: The case of annual crops in Spain. Geoderma 2020, 371, 114–138. [Google Scholar] [CrossRef]
  29. Wang, C.; Amon, B.; Schulz, K.; Mehdi, B. Factors That Influence Nitrous Oxide Emissions from Agricultural Soils as Well as Their Representation in Simulation Models: A Review. Agronomy 2021, 11, 770. [Google Scholar] [CrossRef]
  30. Guenet, B.; Gabrielle, B.; Chenu, C.; Arrouays, D.; Balesdent, J.; Bernoux, M.; Bruni, E.; Caliman, J.-P.; Cardinael, R.; Chen, S.; et al. Can N2O emissions offset the benefits from soil organic carbon storage? Glob. Change Biol. 2021, 27, 237–256. [Google Scholar] [CrossRef]
  31. Pinto, M.; Merino, P.; del Prado, A.; Estavillo, J.M.; Yamulki, S.; Gebauer, G.; Piertzak, S.; Lauf, J.; Oenema, O. Increased emissions of nitric oxide and nitrous oxide following tillage of a perennial pasture. Nutr. Cycl. Agroecosyst. 2004, 70, 13–22. [Google Scholar] [CrossRef]
  32. Follett, R.F.; Schimel, D.S. Effect of tillage practices on microbial biomass dynamics. Soil Sci. Soc. Am. J. 1989, 53, 1091–1096. [Google Scholar] [CrossRef]
  33. Woods, L.E.; Cole, C.V.; Elliott, E.T.; Anderson, R.V.; Coleman, D.C. Nitrogen transformation in soil as affected by bacterial-microfaunal interactions. Soil Biol. Biochem. 1982, 14, 93–98. [Google Scholar] [CrossRef]
  34. Baggs, E.M.; Stevenson, M.; Pihlatie, M.; Regar, A.; Cook, H.; Cadisch, G. Nitrous Oxide Emissions Following Application of Residues and Fertiliser Under Zero and Conventional Tillage. Plant Soil 2003, 254, 361–370. [Google Scholar] [CrossRef]
  35. Kong, A.Y.; Fonte, S.J.; van Kessel, C.; Six, J. Transitioning from Styard to Minimum Tillage: Trade-Offs between Soil Organic Matter Stabilization, Nitrous Oxide Emissions, and N Availability in Irrigated Cropping Systems. Soil Tillage Res. 2009, 104, 256–262. [Google Scholar] [CrossRef]
  36. Smith, K.; Watts, D.; Way, T.; Torbert, H.; Prior, S. Impact of Tillage y Fertiliser Application Method on Gas Emissions in a Maize Cropping System. Pedosphere 2012, 22, 604–615. [Google Scholar] [CrossRef]
  37. Pandey, D.; Agrawal, M.; Bohra, J.S. Greenhouse gas emissions from rice crop with different tillage permutations in rice-wheat system. Agric. Ecosyst. Environ. 2012, 159, 133–144. [Google Scholar] [CrossRef]
  38. Choudhary, M.A.; Akramkhanov, A.; Saggar, S. Nitrous Oxide Emissions from a New Zealy Cropped Soil: Tillage Effects, Spatial y Seasonal Variability. Agric. Ecosyst. Environ. 2012, 93, 33–43. [Google Scholar] [CrossRef]
  39. Pelster, D.E.; Larouche, F.; Rochette, P.; Chantigny, H.; Allaire, S.; Angers, D.A. Nitrogen Fertilization but Not Soil Tillage Affects Nitrous Oxide Emissions from a Clay Loam Soil Under a maize-soybean Rotation. Soil Tillage Res. 2011, 115–116, 16–26. [Google Scholar] [CrossRef]
  40. Glenn, A.; Tenuta, M.; Wagner-Riddle, C. Nitrous oxide emissions from an annual crop rotation on poorly drained soil on the Canadian Prairies. Agric. Forest. Meteorol. 2012, 166, 41–49. [Google Scholar] [CrossRef]
  41. Carbonell-Bojollo, R.; Ordóñez-Fernández, R.; Moreno-García, M.; Repullo-Ruibérriz de Torres, M.A. El papel de la fertilización nitrogenada como práctica mitigadora del cambio climático en sistemas agrarios mediterráneos. Agric. Conserv. 2017, 37, 8–17. [Google Scholar]
  42. Corominas, J. Agua y Energía en el Riego, en la época de la sostenibilidad. Ing. Del Agua 2010, 17, 219–233. [Google Scholar] [CrossRef] [Green Version]
  43. Franco-Luesma, S.; Cavero, J.; Plaza-Bonilla, D.; Cantero-Martínez, C.; Tortosa, G.; Bedmar, E.; Álvaro-Fuentes, J. Irrigation system and tillage effects on soil nitrous oxide emissions in a maize monoculture. Agron. J. 2020, 112, 56–71. [Google Scholar] [CrossRef]
  44. Sánchez-Martín, L.; Meijide, A.; Garcia-Torres, L.; Vallejo, A. Combination of drip irrigation and organic fertiliser for mitigating emissions of nitrogen oxides in semiarid climate. Agric. Ecosyst. Environ. 2010, 137, 99–107. [Google Scholar] [CrossRef]
  45. Alarcon, A.; Garrido, L.J. Modernization of irrigation systems in Spain: Review and analysis for decision making. Int. J. Water Resour. Develop. 2016, 32, 442–458. [Google Scholar] [CrossRef]
  46. Ottaiano, L.; Di Mola, I.; Di Tommasi, P.; Mori, M.; Magliulo, V.; Vitale, L. Effects of Irrigation on N2O Emissions in a Maize Crop Grown on Different Soil Types in Two Contrasting Seasons. Agriculture 2020, 10, 623. [Google Scholar] [CrossRef]
  47. Allen, R.G.; Pereira, L.S.; Raes, D.; Smith, M. Crop Evapotranspiration-guidelines for Computing Crop Water Requirements-FAO Irrigation and Drainage Paper 56; FAO: Rome, Italy, 1998; Volume 300, p. D05109. [Google Scholar]
  48. Bremner, J.; Keeney, D. Steam distillation methods for determination of ammonium, nitrate and nitrite. Anal. Chem. Acta 1965, 32, 485–495. [Google Scholar] [CrossRef]
  49. Ryden, J.C.; Rolston, D.E. The measurement of denitrification. In Gaseous Loss of Nitrogen from Plant Soil Systems; Freney, J.R., Simpson, J.R., Eds.; Developments in Plant and Soil Sciences; Springer: Dordrecht, The Netherlands, 1983; Volume 9. [Google Scholar] [CrossRef]
  50. Davis, J.C. Statistic and Data Analysis in Geology; Wiley: New York, NY, USA, 1993. [Google Scholar]
  51. Liu, X.J.; Mosier, A.R.; Halvorson, A.D.; Zhang, F.S. The impact of nitrogen placement and tillage on NO, N2O, CH4 and CO2 fluxes from a clay loam soil. Plant Soil 2006, 280, 177–188. [Google Scholar] [CrossRef]
  52. Tan, I.Y.S.; van Es, H.M.; Duxburry, J.M.; Melkonian, J.J. Single-event nitrous oxide losses under maize production as affected by soil type, tillage, rotation, and fertilization. Soil Tillage Res. 2009, 102, 19–26. [Google Scholar] [CrossRef]
  53. Signor, D.; Cerri, E.P.; Conant, R. N2O emissions due to nitrogen fertiliser applications in two regions of sugarcane cultivation in Brazil. Environ. Res. Lett. 2013, 8, 015013. [Google Scholar] [CrossRef]
  54. Butterbach-Bahl, K.; Baggs, E.M.; Dannenmann, M.; Kiese, R.; Zechmeister-Boltenstern, S. Nitrous oxide emissions from soils: How well do we understand the processes and their controls? Philos. Trans. R. Soc. 2013, 368, 20130122. [Google Scholar] [CrossRef]
  55. Regina, K.; Alakukku, L. Greenhouse gas fluxes in varying soils types under conventional and no-tillage practices. Soil. Tillage Res. 2010, 109, 144–152. [Google Scholar] [CrossRef]
  56. Smith, P.; Goulding, K.W.; Smith, K.A.; Powlson, D.S.; Smith, J.U.; Falloon, P.; Coleman, K. Enhancing the carbon sink in European agricultural soils: Including trace gas fluxes in estimates of carbon mitigation potential. Nut. Cycl. Agroecosyst. 2001, 60, 237–252. [Google Scholar] [CrossRef]
  57. Skiba, U.; van Dijk, S.; Ball, B.C. The influence of tillage on NO and N2O fluxes under spring and winter barley. Soil Use Manag. 2002, 18, 340–345. [Google Scholar] [CrossRef]
  58. Carvalho, J.L.N.; Peregrino, C.E. Conversion of Cerrado into agricultural land in the southwestern Amazon: Carbon stocks and soil fertility. Sci. Agric. 2009, 66, 233–241. [Google Scholar] [CrossRef]
  59. Six, J.; Ogle, S.M.; Breidt, F.J.; Conant, R.T.; Mosier, A.R.; Paustian, K. The potential to mitigate global warming with no-tillage management is only realized when practised in the long term. Glob. Chang. Biol. 2004, 10, 155–160. [Google Scholar] [CrossRef] [Green Version]
  60. Omonode, R.A.; Smith, D.R.; Gal, A.; Vyn, T.J. Soil nitrous oxide emissions in maize following three decades of tillage and rotation treatments. Soil Sci. Soc. Am. J. 2011, 75, 152–163. [Google Scholar] [CrossRef] [Green Version]
  61. Van Kessel, C.; Venterea, R.; Six, J.; Adviento-Borbe, M.A.; Linquist, B.; Van Groenigen, K.J. Climate, duration, and N placement determine N2O emissions in reduced tillage systems: A meta-analysis. Glob. Change Biol. 2012, 19, 33–44. [Google Scholar] [CrossRef]
  62. Escobar, L.F.; Amado, T.J.C.; Bayer, C. Postharvest nitrous oxide emissions from a subtropical oxisol as influenced by summer crop residues and their management. Rev. Bras. Ciênc. Solo. 2010, 34, 507–516. [Google Scholar] [CrossRef] [Green Version]
  63. Baggs, E.M.; Chebil, J.; Ndufa, J.K. A short-term investigation of trace gas emissions following tillage and no-tillage of agroforestry residues in western Kenya. Soil Tillage Res. 2006, 90, 69–76. [Google Scholar] [CrossRef]
  64. Corrochano-Monsalve, M.; Bozal-Leorri, A.; Sánchez, C.; González-Murua, C.; Estavilo, J.M. Joint application of urease and nitrification inhibitors to diminish gaseous nitrogen losses under different tillage systems. J. Clean Prod. 2021, 289, 125701. [Google Scholar] [CrossRef]
  65. Plaza-Bonilla, D.; Alvaro-Fuentes, J.; Bareche, J.; Pareja-Sanchez, E.; Justes, E.; Cantero-Martinez, C. No-tillage reduces long-term yield-scaled soil nitrous oxide emissions in rainfed Mediterranean agroecosystems: A field and modelling approach. Agric. Ecosyst. Environ. 2018, 262, 36–47. [Google Scholar] [CrossRef]
  66. Plaza-Bonilla, D.; Alvaro-Fuentes, J.; Arrue, J.L.; Cantero-Martinez, C. Tillage and nitrogen fertilization effects on nitrous oxide yield-scaled emissions in a rainfed Mediterranean area. Agric. Ecosyst. Environ. 2014, 189, 43–52. [Google Scholar] [CrossRef] [Green Version]
  67. Metay, A.; Oliver, R.; Scopel, E.; Douzet, J.M.; Moreira, J.A.A. N2O and CH4 emissions from soils under conventional and no-till management practices in Goiânia (Cerrados, Brazil). Geoderma 2007, 141, 78–88. [Google Scholar] [CrossRef]
  68. Jantalia, C.P.; dos Santos, H.P.; Urquiaga, S. Fluxes of nitrous oxide from soil under different crop rotations and tillage systems in the south of Brazil. Nutr. Cycl. Agroecosyst. 2008, 82, 161–173. [Google Scholar] [CrossRef]
  69. Liu, X.J.; Mosier, A.R.; Halvorson, A.D.; Zhang, F.S. Tillage and nitrogen application effects on nitrous and nitric oxide emissions from irrigated maize fields. Plant Soil 2005, 276, 235–249. [Google Scholar] [CrossRef]
  70. Venterea, R.T.; Maharjan, B.; Dolan, M.S. Fertiliser source and tillage effects on yield-scaled nitrous oxide emissions in a maize cropping system. J. Environ. Qual. 2011, 40, 1521–1531. [Google Scholar] [CrossRef] [PubMed] [Green Version]
  71. Zhang, J.; Han, X. N2O emission from the semi-arid ecosystem under mineral fertiliser (Urea and superphosphate) and increased precipitation in northern China. Atmos. Environ. 2008, 42, 291–302. [Google Scholar] [CrossRef]
  72. Ma, B.L.; Wu, T.Y.; Tremblay, N.; Deen, W.; McLaughlin, N.B.; Morrison, M.J.; Stewart, G. On-Farm Assessment of the Amount and Timing of Nitrogen Fertiliser on Ammonia Volatilization. Agron. J. 2010, 102, 134–144. [Google Scholar] [CrossRef]
  73. Meijide, A.; Díez, J.A.; Sánchez-Martín, L.; López-Fernández, S.; Vallejo, A. Nitrogen oxide emissions from an irrigated maize crop amended with treated pig slurries and composts in a Mediterranean climate. Agric. Ecosyst. Environ. 2007, 121, 383–394. [Google Scholar] [CrossRef] [Green Version]
  74. Meijide, A.; García-Torres, L.; Arce, A.; Vallejo, A. Nitrogen oxide emissions affected by organic fertilization in a non-irrigated Mediterranean barley field. Agric. Ecosyst. Environ. 2009, 132, 106–115. [Google Scholar] [CrossRef]
  75. Pardo, G.; Moral, R.; Aguilera, E.; del Prado, A. Gaseous emissions from management of solid waste: A systematic review. Glob. Chang. Biol. 2015, 21, 1313–1327. [Google Scholar] [CrossRef] [Green Version]
  76. Sanz-Cobena, A.; Lassaletta, L.; Aguilera, E.; del Prado, A.; Garnier, J.; Billen, G.; Iglesias, A.; Sánchez, B.; Guardia, G.; Abalos, D.; et al. Strategies for greenhouse gas emissions mitigation in Mediterranean agriculture: A review. Agric. Ecosyst. Environ. 2017, 238, 5–24. [Google Scholar] [CrossRef] [Green Version]
  77. Zanatta, J.A.; Bayer, C.; Vieira, F.C.; Gomes, J.; Tomazi, M. Nitrous oxide and methane fluxes in South Brazilian Gleysol as affected by nitrogen fertilisers. Rev. Bras. Ciência Solo 2010, 34, 1653–1665. [Google Scholar] [CrossRef] [Green Version]
  78. Schils, R.L.M.; Van Groenigen, J.W.; Velthof, G.L. Nitrous oxide emissions from multiple combined applications of fertiliser and cattle slurry to grassland. Plant Soil 2008, 310, 89–101. [Google Scholar] [CrossRef] [Green Version]
  79. Shaviv, A. Advances in controlled-release fertilisers. Adv. Agron. 2001, 71, 1–49. [Google Scholar] [CrossRef]
  80. Robinson, A.; Di, H.J.; Cameron, K.C.; Podolyan, A.; He, J. The effect of soil pH and dicyandiamide (DCD) on N2O emissions and ammonia oxidiser abundance in a stimulated grazed pasture soil. J. Soils Sediments 2014, 14, 1434–1444. [Google Scholar] [CrossRef]
  81. Liu, C.Y.; Wang, K.; Meng, S.X.; Zheng, X.H.; Zhou, Z.X.; Han, S.H.; Chen, D.L.; Yang, Z.P. Effects of irrigation, fertilization and crop straw management on nitrous oxide and nitric oxide emissions from a wheat-maize rotation field in northern China. Agric. Ecosyst. Environ. 2011, 140, 226–233. [Google Scholar] [CrossRef]
  82. Scheer, C.; Grace, P.R.; Rowlings, D.W.; Payero, J. Nitrous oxide emissions from irrigated wheat in Australia: Impact of irrigation management. Plant Soil 2012, 359, 351–362. [Google Scholar] [CrossRef] [Green Version]
  83. Millar, N.; Urrea, A.; Kahmark, K.; Shcherbak, I.; Robertson, G.P.; Ortiz-Monasterio, I. Nitrous oxide flux response exponentially to nitrogen fertiliser in irrigated wheat in the Yaqui Valley, Mexico. Agric. Ecosyst. Environ. 2018, 261, 125–132. [Google Scholar] [CrossRef]
  84. Munford, M.T.; Rowlings, D.W.; Scheer, C.; De Rosa, D.; Grace, P.R. Effect of irrigation scheduling on nitrous oxide emissions in intensively managed pastures. Agric. Ecosyst. Environ. 2019, 272, 126–134. [Google Scholar] [CrossRef]
  85. Jamali, H.; Quayle, W.C.; Baldock, J. Reducing nitrous oxide emissions and nitrogen leaching losses from irrigated arable cropping in Australia through optimized irrigation scheduling. Agric. Forest. Meteorol. 2015, 108, 32–39. [Google Scholar] [CrossRef]
  86. Passianoto, C.C.; Ahrens, T.; Feigl, B.J.; Steudle, P.A.; do Carmo, J.B.; Melillo, J.M. Emissions of CO2, N2O, and NO in conventional and no-till management practices in Rondônia, Brazil. Biol. Fertil. Soils 2003, 38, 200–208. [Google Scholar] [CrossRef]
  87. Kostyanovsky, K.I.; Huggins, D.R.; Stockle, C.O.; Morrow, J.G.; Madsen, I.J. Emissions of N2O and CO2 Followinf Short-Term Water and N-fertilization Events in Wheat-Based Cropping Systems. Front. Ecol. Evol. 2019, 7, 63. [Google Scholar] [CrossRef] [Green Version]
  88. Robertson, G.P.; Paul, E.A.; Harwood, R.R. Greenhouse gases in intensive agriculture: Contributions of individual gases to the radiative forcing of the atmosphere. Science 2000, 289, 1922–1925. [Google Scholar] [CrossRef] [Green Version]
  89. Li, C.S.; Frolking, S.; Butterbach-Bahl, K. Carbon sequestration in arable soils is likely to increase nitrous oxide emissions, offsetting reductions in climate radiative forcing. Clim. Chang. 2005, 72, 321–338. [Google Scholar] [CrossRef]
  90. Gelfand, I.; Cui, M.; Tang, J.; Robertson, G.P. Short-term drought response of N2O and CO2 emissions from mesic agricultural soils in the US Midwest. Agric. Ecosyst. Environ. 2015, 212, 127–133. [Google Scholar] [CrossRef] [Green Version]
  91. Jamali, H.; Quayle, W.; Sheer, C.; Baldock, J. Mitigation of N2O emissions from surface-irrigated cropping systems using water management and the nitrification inhibitor DMPP. Soil Res. 2016, 54, 481–493. [Google Scholar] [CrossRef]
  92. Scheer, C.; Wassmann, R.; Kienzler, K.; Ibragimov, N.; Eschanov, R. Nitrous oxide emissions from fertilized, irrigated cotton (Gossypium hirsutum L.) in the Aral Sea Basin, Uzbekistan: Influence of nitrogen applications and irrigation practices. Soil Biol. Biochem. 2008, 40, 290–301. [Google Scholar] [CrossRef]
  93. Liu, C.; Zheng, X.; Zhou, Z.; Han, S.; Wang, Y.; Wang, K.; Liang, W.; Li, M.; Chen, D.; Yang, Z. Nitrous oxide and nitric oxide emissions from an irrigated cotton field in Northern China. Plant Soil 2010, 332, 123–134. [Google Scholar] [CrossRef]
  94. Cui, F.; Yan, G.; Zhou, Z.; Zheng, X.; Deng, J. Annual emissions of nitrous oxide and nitric oxide from a wheat-maize cropping system on a silt loam calcareous soil in the North China Plain. Soil Biol. Biochem. 2012, 48, 10–19. [Google Scholar] [CrossRef]
Figure 1. Experimental design of the test plots. U: urea; AN: ammonium nitrate; DMPP: ammonium sulphate nitrate with DMPP nitrification inhibitor.
Agronomy 12 01349 g001
Figure 2. Daily emission of N2O according to the implemented management system. The different letters indicate: a = seeding; b = first fertilisation with DMPP; c = first fertilisation with U and AN; d = second fertilisation with DMPP; e = second fertilisation with U and AN; f = first irrigation; g = last irrigation.
Agronomy 12 01349 g002
Figure 3. Daily emission of N2O according to the type of the used fertiliser. The different letters indicate: a = seeding; b = first fertilisation with DMPP; c = first fertilisation with U and AN; d = second fertilisation with DMPP; e = second fertilisation with U and AN; f = first irrigation; g = last irrigation.
Agronomy 12 01349 g003
Figure 4. Daily emission of N2O according to the applied irrigation dose. The different letters indicate: a = seeding; b = first fertilisation with DMPP; c = first fertilisation with U and AN; d = second fertilisation with DMPP; e = second fertilisation with U and AN; f = first irrigation; g = last irrigation.
Agronomy 12 01349 g004
Figure 5. Spatial representation of the main components for each variable studied independently.
Agronomy 12 01349 g005
Figure 6. Spatial representation of the main components as a function of the interaction of the variables studied in pairs.
Agronomy 12 01349 g006
Figure 7. Spatial representation of the main components as a function of the interaction of the three studied variables.
Agronomy 12 01349 g007
Table 1. The field operations performed each season per soil management system.
Conventional Tillage
Season 2016Season 2017Season 2018
DateField operationDateField operationDateField operation
17 February 2016Disk plough
10 March 2016Chisel plough01 February 2017Chisel plough22 February 2018Chisel plough
06 April 2016Disk + tine harrow06 April 2017Disk + tine harrow05 April 2018Disk + tine harrow
07 April 2016Seeding06 April 2017Seeding06 April 2018Seeding
07 May 2016Cultivator08 May 2017Cultivator16 May 2018Cultivator
20 October 2016Disk plough22 October 2017Chisel plough
No till
Season 2016Season 2017Season 2018
DateField operationDateField operationDateField operation
16 February 2016Herbicide Glyphosate + Fluroxypyr29 March 2017Herbicide Glyphosate + Fluroxypyr27 March 2018Herbicide Glyphosate + Fluroxypyr
07 April 2016Seeding06 April 2017Seeding06 April 2018Seeding
24 May 2016Selective herbicide 09 May 2017Selective herbicide22 May 2018Selective herbicide
21 October 2016Herbicide Glyphosate22 October 2017Herbicide Glyphosate
Table 2. Fertilisers used in the trial; N-richness, doses, and application dates are indicated.
Basic fertiliser (kg ha−1)400 (8-15-15)
Differentiated FertilisationUrea (U):
46% N
Calcium Ammonium Nitrate (AN):
27% N
Ammonium Sulphate Nitrate with Nitrification Inhibitor (DMPP): 26% N
Total amount of fertiliser (kg ha−1)5839931030
1st application (35%)
How much? (kg ha−1)204348360
When?2 weeks after emergence2 weeks after emergenceWith seeding
2nd application (65%)
How much? (kg ha−1)379645670
When?1 month after emergence1 month after emergence3 weeks after emergence
Table 3. The physical and chemical characteristics of different soil layers at the study site.
Soil SystemDepthpH H2OpH CaCl2PKOCOMCO3−2CECSandLimeClayTexture
cm mg kg−1%meq (100g)−1%
Tillage0–58.607.7712.23252.10.410.6918.6311.9247.4934.9917.52Loamy
5–108.587.739.86202.10.400.6817.9312.0946.3936.4117.20Loamy
10–208.637.789.36123.50.400.6818.2112.6947.2936.6816.03Loamy
20–408.767.856.2199.40.280.4820.5911.4049.4234.5915.99Loamy
40–608.667.886.01103.80.220.3719.9911.8551.3833.7114.91Loamy
No-Till0–58.557.756.52235.90.440.7519.9810.9552.5332.3115.16Sandy–Loam
5–108.657.774.43126.20.400.6820.0411.8853.4432.3414.22Sandy–Loam
10–208.587.665.01179.90.440.7420.2810.8447.136.6316.27Loamy
20–408.647.842.9095.20.300.5121.5611.3549.3534.7115.94Loamy
40–608.677.782.21102.60.270.4620.279.7351.7334.7513.52Loamy
P: available phosphorus; K: exchangeable potassium; OC: organic carbon; OM: organic matter; CEC: cation exchange capacity.
Table 4. Dynamic of emission measurements during the three seasons studied.
SEASON201620172018
1st N2O measurement14 April 201617 April 20179 April 2018
Dynamic of measurementFrom 14 April 2016 to 28 July 2016
2 measurements a week
From 17 April 2017 to 27 July 2017
2 measurements a week
From 9 April 2018 to 26 July 2018
2 measurements a week
From 2 August 2016 to 14 September 2016
Once a week
From 10 August 2017 to 7 September 2017
Once a week
From 2 August 2018 to 6 September 2018
Once a week
Last N2O measurement14 September 20167 September 20176 September 2018
Table 5. Maize production (kg ha−1) in each season according to the irrigation dose.
Irrigation Dose201620172018
100%11,39312,13310,381
75%11,05011,38310,465
Table 6. Cumulative N2O emissions (g N ha−1) for the three studied variables and in all seasons for 180 days (±standard error).
Management systemFertilisationIrrigation
NTTUANDMPP100%75%
1st season411.6 ± 20.6453.6 ± 25.5475.4 ± 19.9489.3 ± 31.4381.2 ± 21.1445.6 ± 24.9419.6 ± 21.9
2nd season510.8 ± 26.8499.7 ± 21.8542.0 ± 14.0575.1 ± 29.2463.3 ± 20.5512.8 ± 21.7497.7 ± 26.8
3rd season384.2 ± 15.8395.1 ± 9.74394.6 ± 16.5414.3 ± 13.0388.4 ± 14.3403.7 ± 10.8375.6 ± 14.5
Table 7. Correlation matrix of the studied variables.
Management SystemIrrigationFertiliserNO3N2ODays
Irrigation0.4240
p-value0.0000
Fertiliser0.00510.2670
0.94360.0000
NO3−0.00620.00620.9781
0.93080.93080.0000
N2O−0.43030.8656−0.8756−0.0460
−0.00250.0025−0.5038−0.0047
Days 0.19100.97210.87560.94740.3694
0.00000.35310.00250.03440.0011
PC1−0.0106−0.0094−0.8590−0.0037−0.1894 0.8622
0.88240.89560.00000.95840.0089 0.0000
PC2−0.7445−0.21130.0913−0.5773−0.6572−0.0614
0.00000.00270.19960.00000.0000 0.3891
PC3−0.18980.97600.0181−0.5920−0.0967 0.0055
0.00720.00000.79990.00000.1741 0.9382
Publisher’s Note: MDPI stays neutral with regard to jurisdictional claims in published maps and institutional affiliations.

