Article

Investigation of Two QTL Conferring Seedling Resistance to Fusarium Crown Rot in Barley on Reducing Grain Yield Loss under Field Environments

1
Commonwealth Scientific and Industrial Research Organisation (CSIRO) Agriculture and Food, 306 Carmody Road, St. Lucia, QLD 4067, Australia
2
Tasmanian Institute of Agriculture, University of Tasmania, Prospect, TAS 7250, Australia
3
Centre for Crop Health, University of Southern Queensland, Toowoomba, QLD 4350, Australia
4
Leslie Research Facility, Department of Agriculture and Fisheries, Toowoomba, QLD 4350, Australia
5
The Plant Breeding Institute, School of Life and Environmental Sciences, The University of Sydney, Narrabri, NSW 2390, Australia
*
Authors to whom correspondence should be addressed.
Agronomy 2022, 12(6), 1282; https://doi.org/10.3390/agronomy12061282
Submission received: 6 April 2022 / Revised: 9 May 2022 / Accepted: 25 May 2022 / Published: 27 May 2022
(This article belongs to the Collection Crop Breeding for Stress Tolerance)

Abstract

:
Fusarium crown rot (FCR) is one of the most damaging cereal diseases in semi-arid regions worldwide. Genetic studies on FCR resistance have mainly focused on disease symptoms measured by the browning of either leaf sheaths in seedlings or stems of mature plants. Two major QTLs conferring FCR resistance in barley, Qcsr.cpi-1H and Qcrs.cpi-4H, were previously identified in the growth room. They could explain up to 33.4 and 45.3% of phenotypic variance, respectively. This is the first study where the possible effects of FCR-resistant loci identified in the previous studies based on seedling assay are tested for their abilities to reduce grain yield loss. Near isogenic lines (NILs) and backcross (BC) lines targeting these two loci were assessed in the 2017 and 2018 crop seasons. Results from the NILs showed that the presence of a resistance allele at either the 1HL or 4HL locus reduced grain yield loss by an average of 12.0% and 10.7%, respectively. Grain yields of the top BC lines containing resistance alleles at both loci were 34.4% higher than the average of the commercial varieties under FCR inoculation. These lines will be highly valuable in breeding barley varieties with enhanced resistance to FCR.

1. Introduction

Fusarium crown rot (FCR) is a chronic and severe disease affecting cereal production in semi-arid regions worldwide. A survey conducted a decade ago indicated that the disease caused an estimated annual grain yield loss of AUD 79 million in wheat and barley in Australia [1,2]. Reports show that FCR can reduce grain yield by up to 35% in the USA [3], 43% in Turkey [4] and 45% in Iran [5]. This is likely due to the increase in the intensity of cereal production for economic reasons and the wide adoption of reduced tillage for moisture conservation [6]. FCR has become more prevalent in many parts of semi-arid regions in recent years [3,4,5,7,8,9,10,11,12]. An earlier study from Liu et al. (2012) [13] showed that, compared with bread wheat, Fusarium pseudograminearum biomass accumulated at an earlier timepoint and more rapidly in barley compared to bread wheat at similar stages of FCR infection. It has long been recognized that growing resistant varieties is a major component in minimizing FCR damage [14,15]. However, barley varieties with high levels of resistance to FCR are still not available.
FCR is predominantly caused by F. pseudograminearum, although other species of Fusarium can also cause the disease [8,16]. This disease can be induced from seed germination to milky ripening, and field infection is believed to be mainly through physical contact with infected stubble [6,17]. Its symptom of stem-base browning has been widely used to measure FCR severity [15,18]. Whiteheads or premature death of inflorescences during early grain fill are the most pronounced visual impact of FCR in wheat [18,19,20]. Depending on the severity of the disease, whiteheads can be completely devoid of grain or possess shrivelled grains, resulting in an increase in screenings, which are the reasons for crop yield reduction and often quality downgrade. Whiteheads are the easiest symptom to quantify and are frequently reported [19,20,21,22]. However, barley generally does not produce whiteheads and measuring the stem browning itself is probably not a reliable indication [23], so it would be better assessed under field conditions through yield trials.
Several sources of FCR resistance were identified by screening germplasm representing different geographical origins and plant types [24]. Four QTLs conferring seedling resistance have been reported on chromosome arms 1HL [25], 3HL [26], 4HL [27] and 6HL [28], respectively. Recent results have raised questions about the breeding value of the locus on 3HL, given its close association with plant height [25]. Near isogenic lines (NILs) targeting the 1HL [29] and 4HL [30] loci in barley have been obtained. As the resistant and susceptible isolines for a given pair of NILs share a similar genetic background, which is essentially fixed, the differences between them are mainly due to the differences in the targeted locus. Thus, NILs can make accurate phenotyping possible in both glasshouse and field trials. Moreover, the feasibility of enhancing FCR resistance by pyramiding 1HL, 3HL and 4HL QTLs was investigated [31]. Clearly, the three QTLs showed strong additive effects, indicating that gene pyramiding can be an effective approach to improving FCR resistance.
Compared to the complexity of field trials, assessing FCR resistance based on seedling assays is convenient and fast. Results from seedling assays also tend to be more repeatable as they are routinely conducted in environments that are easier to control compared with field trials. Due to these advantages, various methods of seedling assays have been developed [32,33,34,35,36]. However, the ultimate objective of such studies is to develop FCR-resistant varieties that can reduce grain yield loss under disease infection in the field. In other words, seedling assays would only be valuable if the resistance detected translates into reducing yield loss under field environments. It is not clear if any of the reported QTLs detected in seedling assays can translate into field resistance, although an earlier study did demonstrate that the resistant allele at a locus conferring seedling resistance on chromosome arm 3BL in wheat reduced the percentage of whiteheads in the field environments [15]. The present study aimed at clarifying if the resistance loci derived from seedling assays affect grain yield loss under field environments. We assessed NILs and BC lines targeting two FCR-resistant loci in barley over two growing seasons. Results obtained from these field trials are reported here.

2. Materials and Methods

2.1. Plant Materials

Ten sets of NILs derived from the seedling assay, five for the 1HL locus [29] and five for the 4HL locus [30], were developed in the previous studies and assessed under the field environments (Table S1). They were produced based on the method of the heterogeneous inbred family (HIF) [37] combined with the fast-generation technique [38] in glasshouses at Queensland Bioscience Precinct (QBP) in Brisbane, Australia. Additionally, ten BC1F8 lines (Table S2) and fifteen additional BC3F6 lines (Table S3) containing resistant alleles at both the 1HL and 4HL loci were also assessed under field conditions.
The resistant donor for the 4HL locus (AWCS276) is a wild barley (Hordeum spontaneum C. Koch.) accession [27]. The resistant donor for the 1HL locus (AWCS079) is a landrace [25]. The two donors were crossed and then backcrossed with commercial varieties, which cover each of the three agro-ecological regions in Australia, including Baudin, Commander, Fleet, Grimmet, Westminster, Compass, La Trobe, Spartacus, Franklin and Lockyer. The approach of single seed-descendent based on the fast-generation method [38] was used to process the BC lines to higher generation in glasshouses. Plants with undesirable characteristics, including those which differ significantly from commercial barley varieties in flowering time or plant height, were discarded at each generation during the process. A single row was then planted at CSIRO Gatton Research Station (Latitude 27.533° S; Longitude 152.339° E) for each of the plants selected from the glasshouse experiments. Top lines from single rows were selected based on agronomic characteristics including seedling vigour, tiller number, maturity and height, and then were genotyped using markers linked closely with either the 1HL or 4HL locus. Details of marker analysis were as described by Chen et al. (2015) [31]. Selected lines with resistant alleles at both loci were then further tested at multiple field sites over two seasons.

2.2. Inoculum Preparation

Colonised grain inoculum for all the field trials was prepared using a modified version of the Dodman and Wildermuth method [17]. Half-strength potato dextrose agar was initially used to culture each of six F. pseudograminearum (Fp) isolates provided by the University of Southern Queensland. The inoculated plates were incubated for 7 days at room temperature before the mycelium was scraped and then were incubated for a further 5–7 days under a combination of cool white and black fluorescent lights with a 12 h photoperiod. The plates for each of the six Fp isolates were cut into small pieces and used to inoculate separate batches of autoclaved durum wheat grain. The inoculated grains were grown at 25 °C for three weeks and then air dried at 30 °C before pooling the colonized grain into equal quantities of the six Fp isolates. A mixture of isolates was used to ensure consistent aggressiveness of the inoculum.

2.3. Conditions of Trial Sites

Results reported in this publication were obtained from four field trials. Ten sets of NILs and ten BC1F8 lines were assessed at two field sites in the 2017 crop season, one at Plant Breeding Institute (PBI) Narrabri, New South Wales (Latitude 30.285° S; Longitude 149.800° E), and the other at CSIRO Gatton Research Station, Queensland, Australia (Latitude 27.533° S; Longitude 152.339° E). The other two field trials were conducted during the 2018 crop season by assessing ten BC1F8 lines and fifteen BC3F6 lines containing both resistant loci, one at PBI Narrabri and the other at Tosari Crop Research Centre (Tosari), Tummvaille, Queensland, Australia (Latitude 27.835° S; Longitude 151.450° E). Six varieties were used as controls in these four field trials. A plant density of 150 plants/m2 was sown in each of the plots. At the Gatton site, each of the plots consisted of 7 rows spaced at 25 cm, and the rows were 6 metres in length, while at the Narrabri and Tosari sites, each plot was 6 metres in length with 6 rows spaced at 23 cm. Inoculum was placed above the seeds during sowing for the Fp-inoculated plots. The soil type was grey vertosol at the PBI Narrabri site and black vertosol at both the Gatton and Tosari sites.

2.4. Trial Design

The experimental plots were arranged in an augmented randomised incomplete block design, with inoculum serving as the split plot and genotypes the main plot. Two inoculum treatments (non-inoculated and Fp-inoculated) were randomised to strips and genotypes to main plots to produce paired subplots of each genotype across the treatment strips. Genotype main plots were grouped along each pair of rows to form incomplete blocks, where genotype allocation was partially balanced across the incomplete blocks (Figure S1). The inoculum was delivered to each furrow at the rate of 2 g per meter of row (72 g/plot) above the seeds during sowing.

2.5. Data Collection

The grain from the middle 4 metres of each plot was machine-harvested at maturity and used for estimating grain yield. Thousand kernel weight (TKW) was estimated by weighing a random sample of 300 kernels from the harvested grain from each plot. FCR severity based on stem browning of the main tillers was measured from 30 plants randomly sampled from the middle four rows of each of the Fp-inoculated plots. The plants were collected after the grains had been machine-harvested and placed in a 45 °C oven for 7 days. The plants were then cleaned and stored at room temperature until rating. FCR severity of the main stems was scored using a scale of 0 (no observed discoloration) to 5 (the darkest discoloration found in a given trial) on the basal 150 mm of the main tillers. The disease index (DI) value was then calculated for each plot following the formula of DI = (∑nX/5N) × 100, where X is the scale value of each plant, n is the number of plants in the category, and N is the total number of plants assessed for each line [30,38].

2.6. Statistical Analysis

Three categories of genotypes were included in these experiments: NILs, BC lines, and commercial varieties. Given that it was of a greater interest to compare the NILs with each other and to compare the BC lines and the varieties with each other, separate analyses were conducted where each set of genotypes was the focus. In the analysis of the NILs, the trials grown in 2018 were excluded as the NILs were not grown, while the analysis of the BC lines and varieties included all trials. Terms accounting for all treatments were included in the analyses; however, an additional factor was created in each analysis, which was coded as one level for all genotypes of interest and another level for all other genotypes. This allowed the data to be partitioned within the analysis into that of interest and that of no interest without discarding any data. This ensured that the correct degrees of freedom were used in the analyses and allowed the terms relating to the experimental design to be estimated accurately. Grain yield, TKW and DI were each analysed for each set of genotypes in a linear mixed model framework. The model for yield and TKW for the NILs included terms for trial, Fp treatment, locus, presence of resistant allele (henceforth referred to as allele) at each locus, and genotypes within the allele and locus combinations, along with the interactions between these terms as fixed effects. In addition, a term was included to account for all treatments relating to BC lines and commercial varieties. The model for DI was the same, except all terms involving Fp treatment were removed as data were only collected on Fp-inoculated plots. The model for yield and TKW for the BC lines and varieties included terms for trial, Fp treatment and genotype, along with the interactions between these terms as fixed effects. In addition, a term was included to account for all treatments relating to NILs. The model for DI was the same, except all terms involving Fp treatment were removed as data were only collected on Fp-inoculated plots. In all models, terms relating to the experimental design were included as random effects and were fitted separately for each trial, and residual variance was also fitted separately for each trial. Variance parameters were estimated using residual maximum likelihood (REML) estimation [39]. Predictions of trait means were generated from the model as empirical Best Linear Unbiased Estimators. The significance of fixed effects was assessed using a Wald test with a value of α = 0.05, with the denominator degrees of freedom calculated according to Kenward and Roger (1997) [40]. Means of significant effects were compared using Fisher’s protected least significant difference test, which also uses a significance level of α = 0.05. The analyses were performed using ASReml-R [41] in the R software environment [42]. Where appropriate, grain yield reduction was calculated as the yield difference between non-inoculated and Fp-inoculated treatments, expressed in the percentage of the non-inoculated treatments using the formula, reduction (%) = [(YnYFp) ÷ (Yn)] × 100, where Yn and YFp represent grain yield under non-inoculated and Fp-inoculated conditions, respectively. Similarly, the TKW reduction was calculated using the formula, reduction (%) = [(TKWnTKWFp) ÷ (TKWn)] × 100, where TKWn and TKWFp represent TKW under non-inoculated and Fp-inoculated conditions, respectively.

3. Results

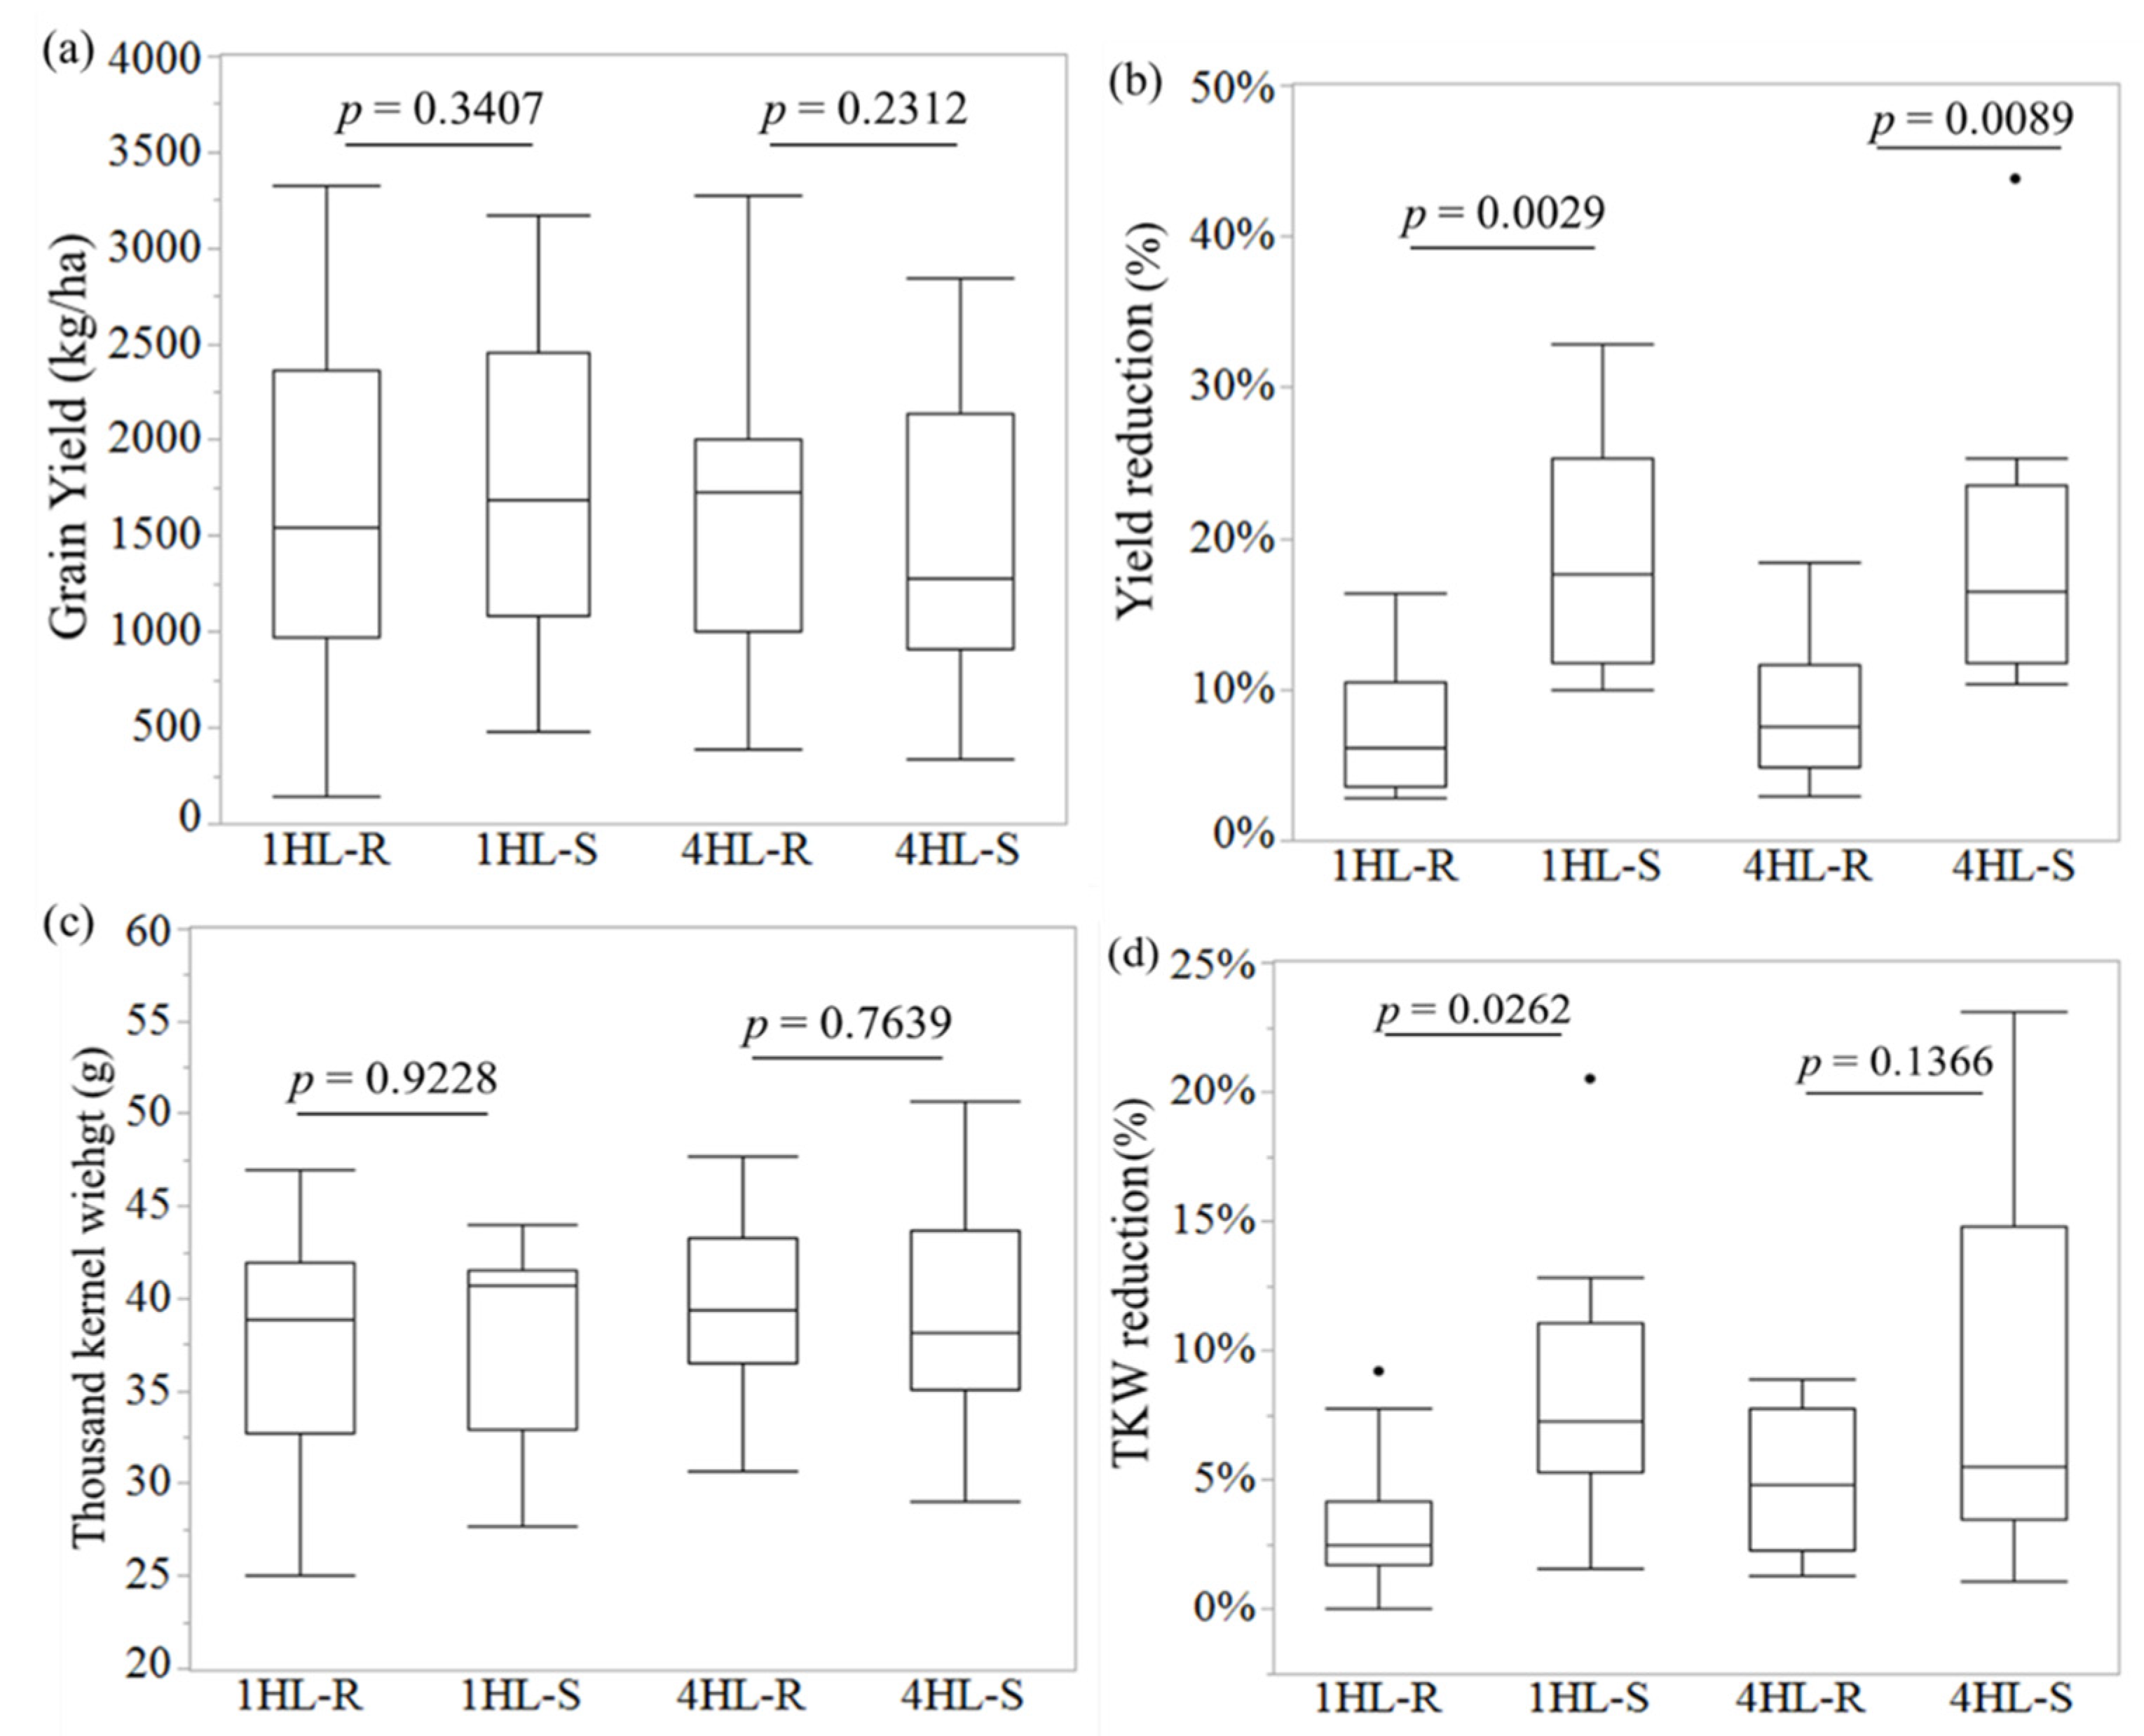
3.1. Field Performance of the near Isogenic Lines

The significance of the effects tested in the analysis of the NILs is summarized in Table 1. For grain yield, there was a significant interaction between trial, locus, allele and genotype and a significant interaction between Fp treatment, locus and allele. For TKW, there was a significant interaction between trial, locus, allele and genotype and between Fp treatment, locus, allele and genotype. For DI, there was a significant interaction between allele and locus.
Although there was a significant interaction between trial and genotype (nested within locus and allele), genotype patterns were consistent for both Fp treatments within a trial. However, Fp treatment did interact with locus and allele, indicating that Fp treatment was not consistent across locus or allele. Without Fp inoculation, statistically significant differences in grain yield between the resistant (“R”) and susceptible (“S”) isolines were not detected for NIL pairs targeting either the 1HL or 4HL loci. The average grain yields of these NILs were approx. 1600 kg/ha across the trials (Figure 1a). However, the “R” and “S” isolines reacted very differently to Fp inoculation. The average grain yield loss of the “R” isolines at the 1HL locus was 7.1%, compared to its counterparts of 19.1% on average (Figure 1b). Thus, the presence of the resistant allele at the 1HL locus reduced grain yield loss by 12.0% on average. Similar results were also obtained for the NILs targeting the 4HL locus, and the presence of the resistant allele at the 4HL locus reduced grain yield loss by 10.7% on average (Figure 1b).
The significant interactions between trial, locus, allele and genotype and between Fp treatment, locus, allele and genotype indicated that genotypes responded differently to Fp treatment and trials, while the effects of trial and Fp treatment were consistent across each other. Based on combined data from all trials, significant differences in TKW for the non-inoculated treatment were not detected between “R” and “S” isolines among the NILs targeting either the 1HL or 4HL loci (Figure 1c). TKW for the “R” isolines targeting the 1HL locus ranged from 25.0 to 47.0 g, with an average of 37.7 g, while its counterparts ranged from 27.7 to 43.3 g, with an average of 37.9 g. TKW for the 4HL NILs was slightly higher than the NILs for the 1HL locus. TKW for the “R” isolines for the 4HL locus ranged from 30.7 g to 47.7 g, with an average of 39.6 g, and TKW for “S” isolines ranged from 29.0 g to 50.7 g, with an average of 39.1 g (Figure 1c). Significant changes in TKW were detected under Fp inoculation between the “R” and “S” isolines of the 1HL NILs but not between the “R” and “S” isolines for the 4HL NILs (Figure 1d). The differences in TKW between isolines containing the resistant allele at the 1HL locus varied from 0.0% to 9.2%, with an average of 3.3%, while the difference between non-inoculated and inoculated trials without the resistant allele varied from 1.6% to 20.5%, with an average of 8.4% (Figure 1d).
Across genotypes, there were significant differences in DI between resistant and susceptible isolines targeting both the 1HL and 4HL loci, and these differences were consistent across trials. Significant differences in FCR severity between the “R” and “S” isolines targeting both the 1HL and 4HL loci were detected in the Fp-inoculated trials. Based on combined data from all trials, the effects of the resistant allele at the 1HL locus reduced FCR severity by an average of 21.8%, whereas the effects of the resistant allele 4HL reduced FCR severity by an average of 20.2% (Table 2).

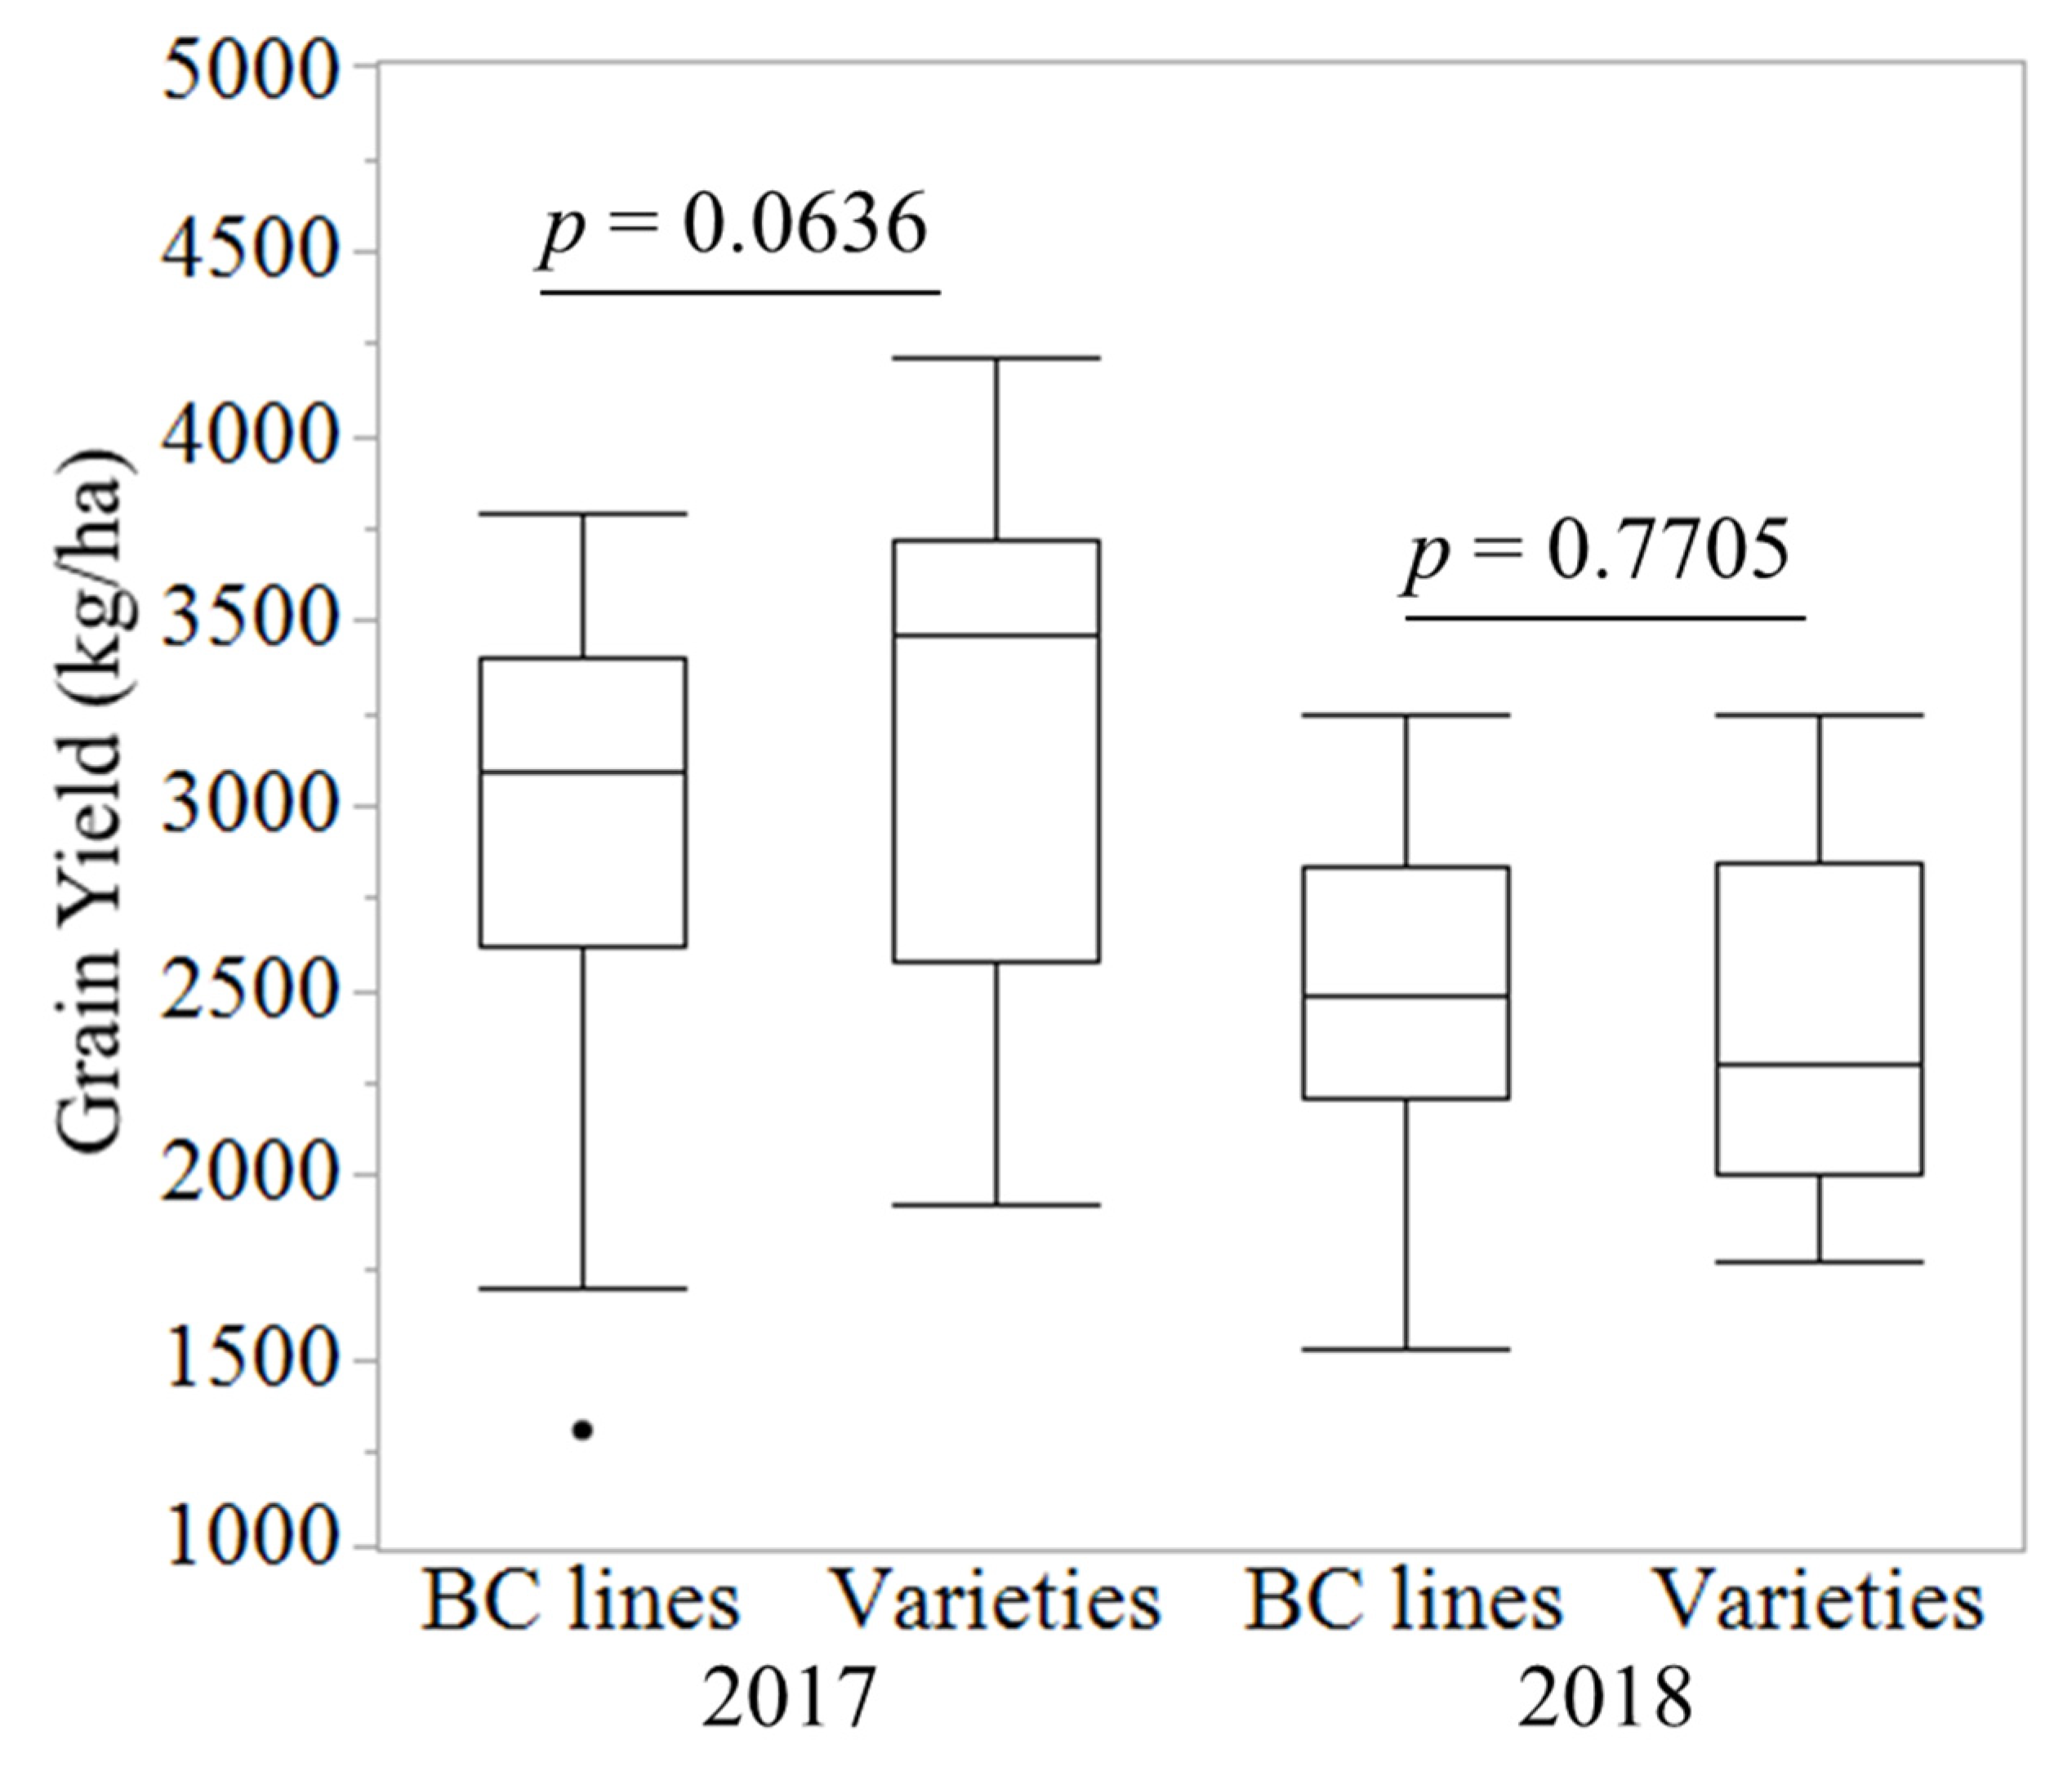
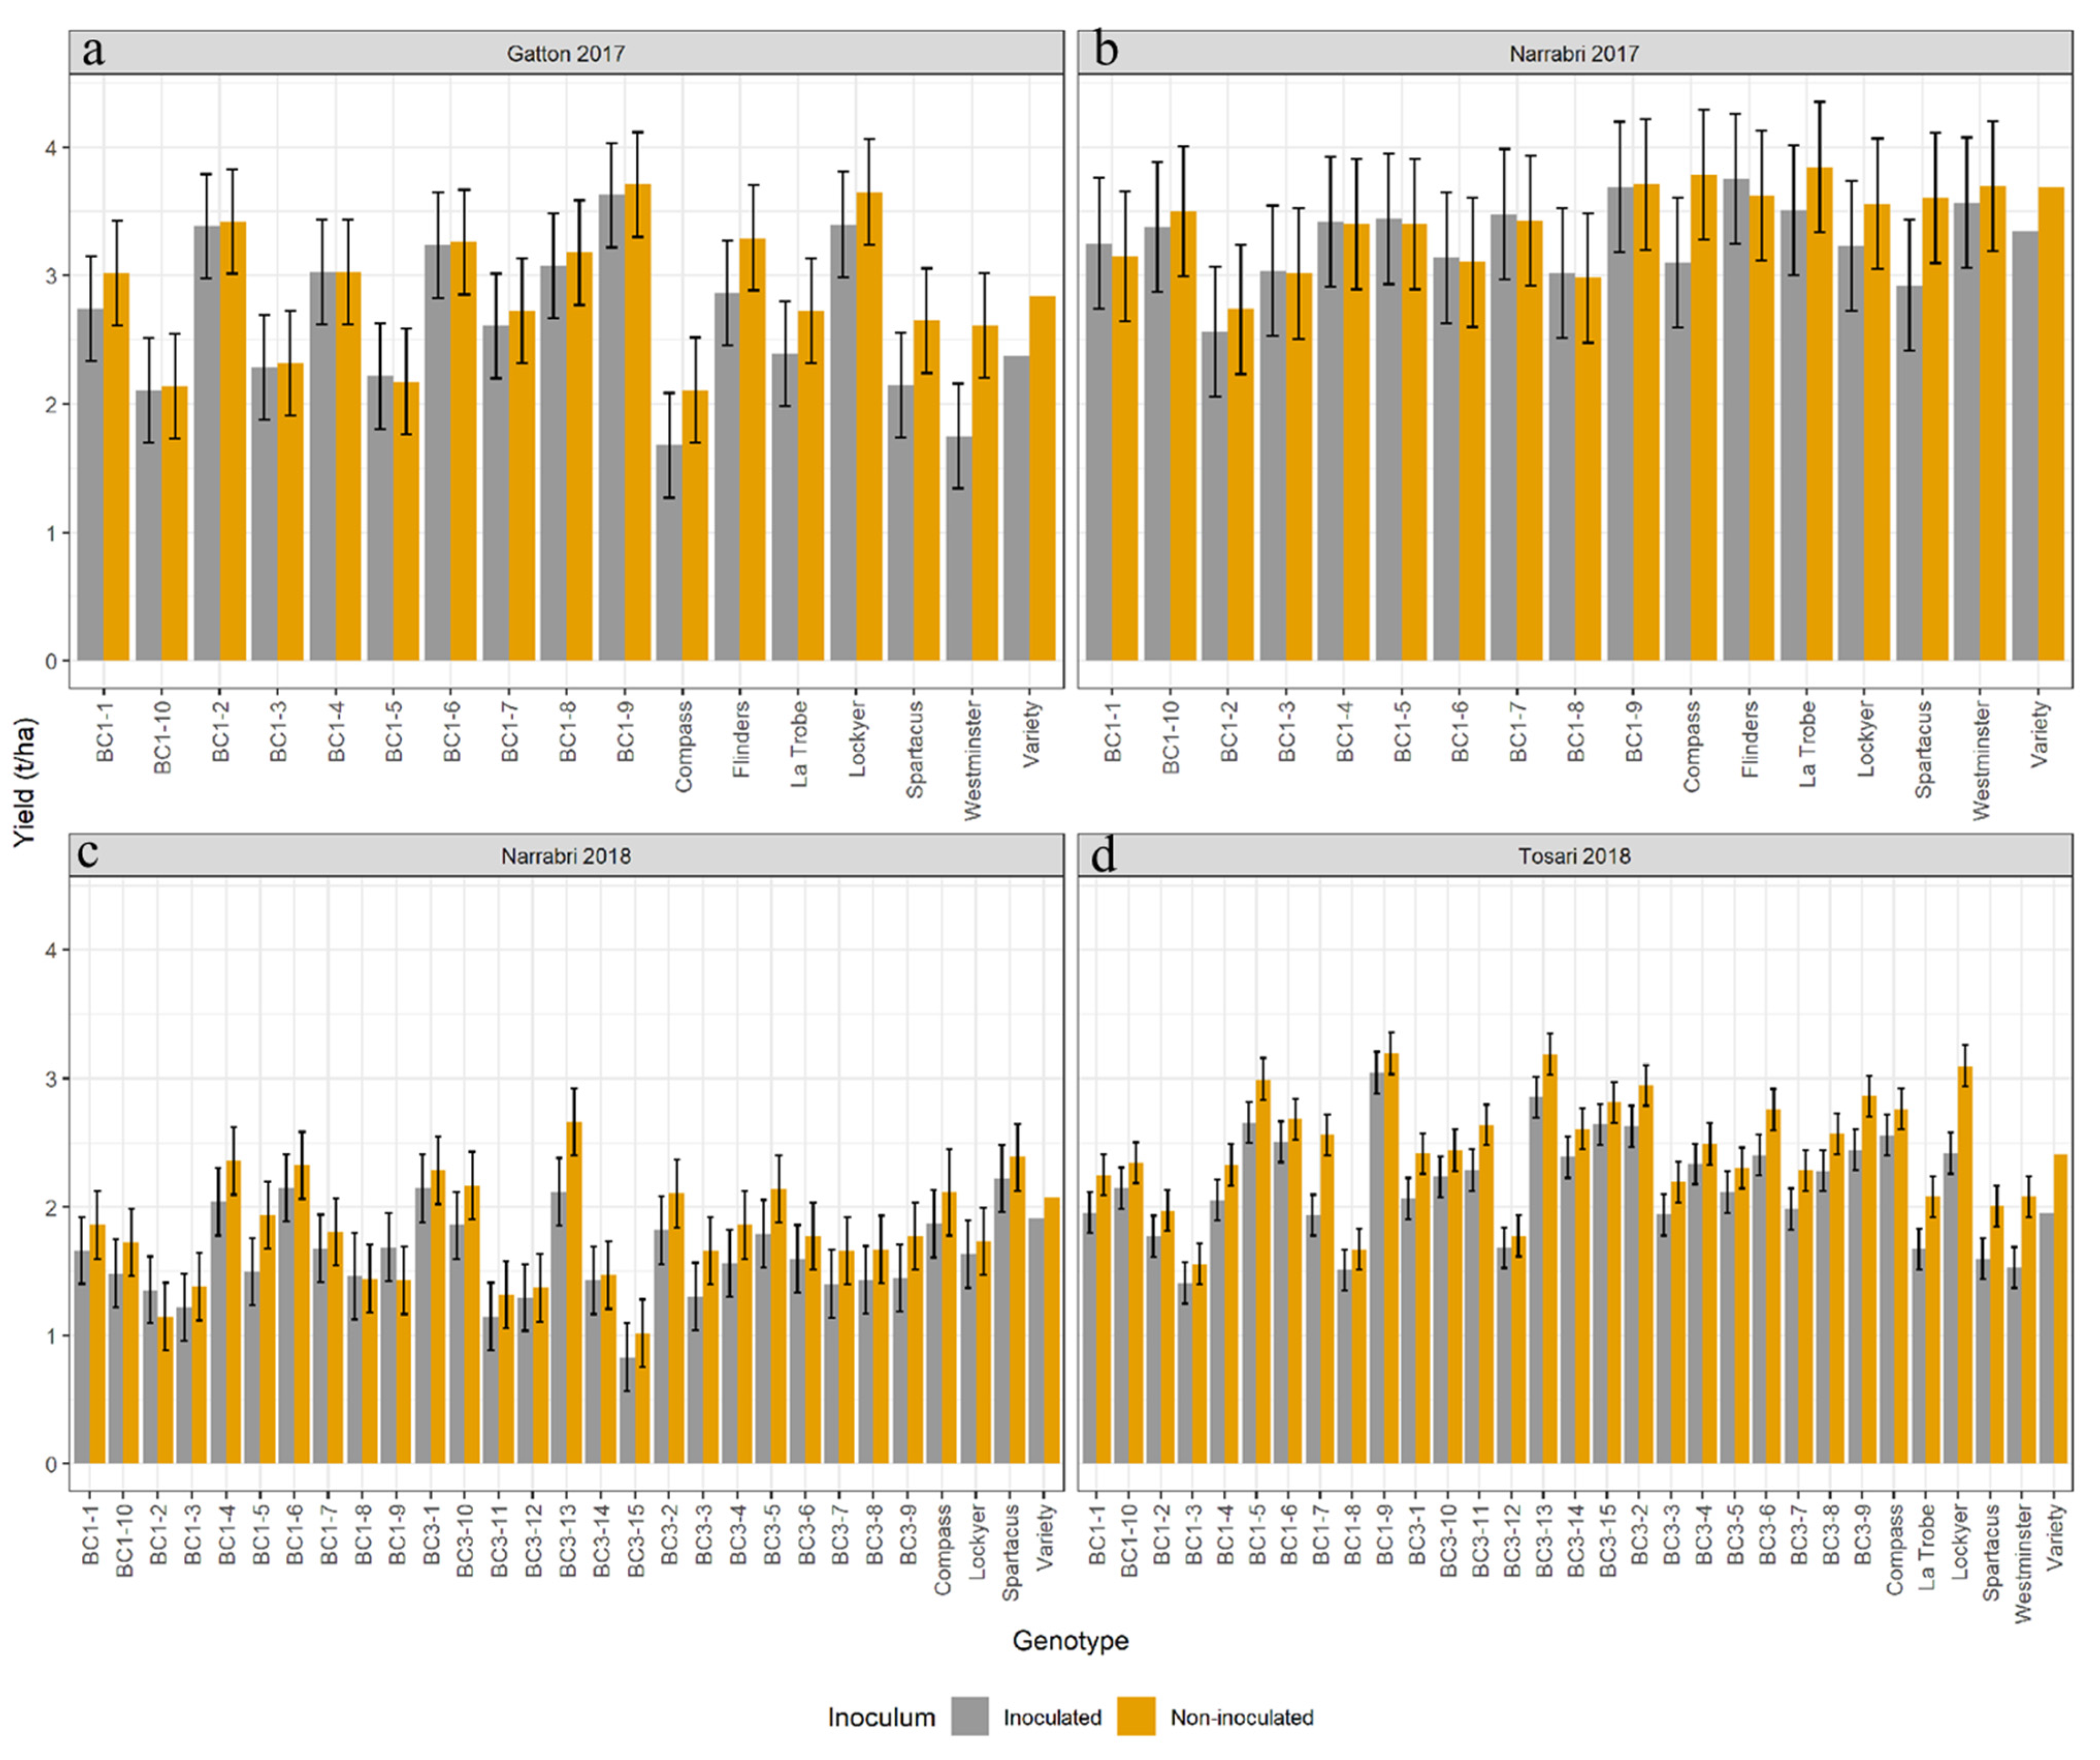
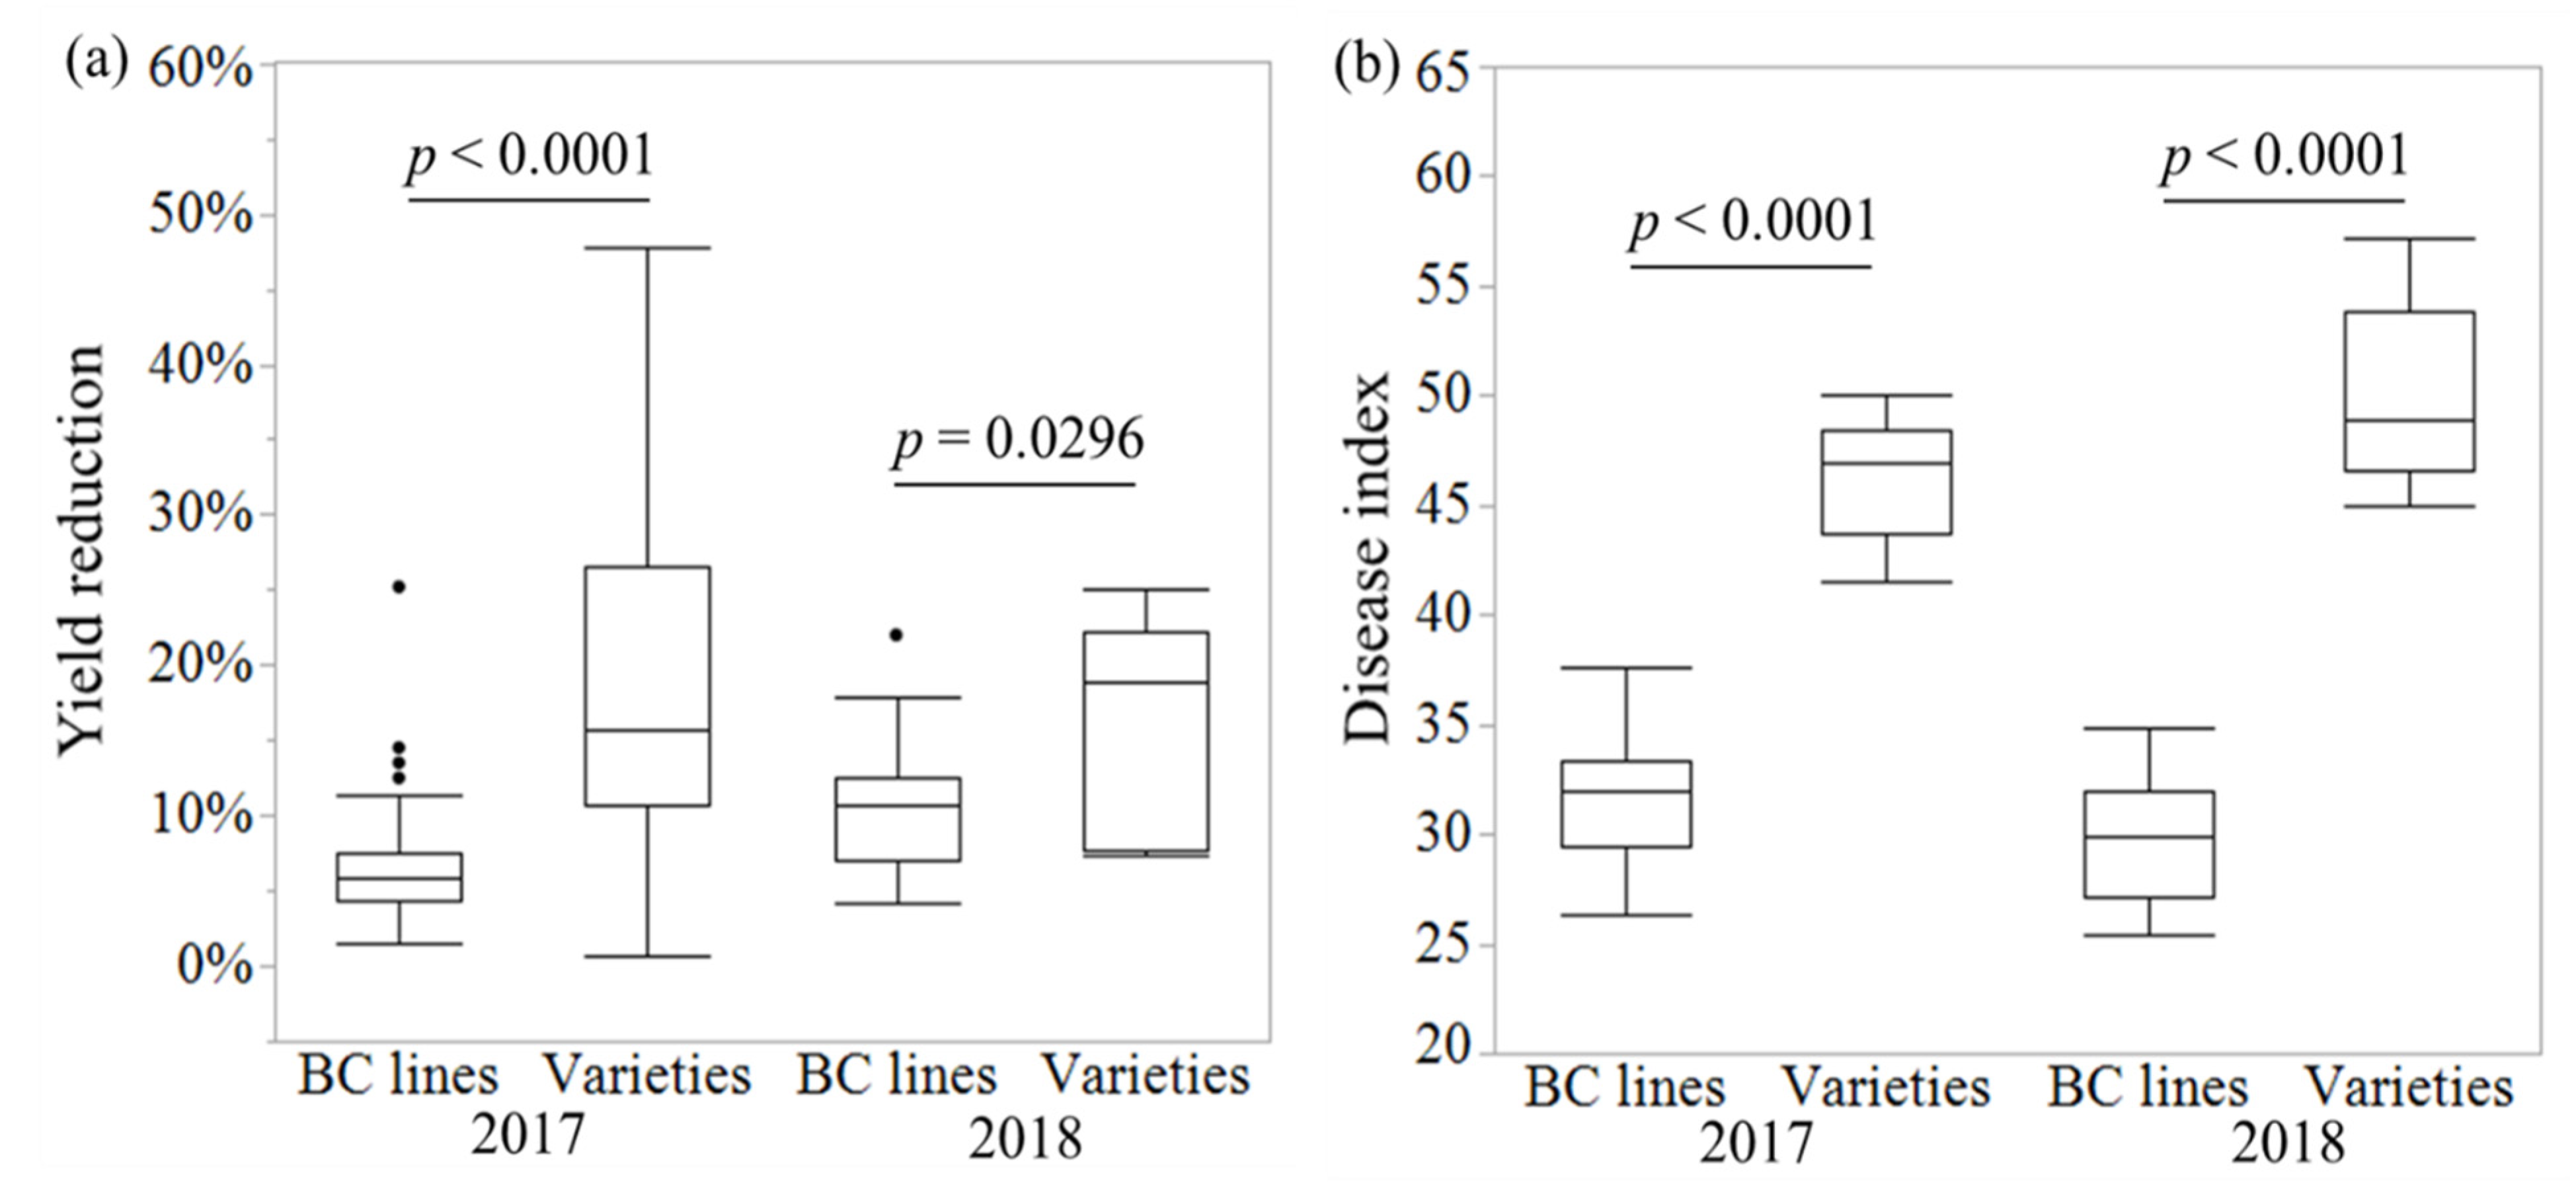
3.2. Field Performance of the BC Lines

The significance of the effects tested in the analysis of the BC lines and varieties are summarized in Table 3. For grain yield, there was a significant interaction between trial, Fp treatment and genotype. For TKW, there was a significant effect for trial and for genotype, while for DI, there was only a significant effect for genotype.
The significant interaction between trial, Fp treatment, and genotype indicated that genotypes responded differently to Fp treatment at different trials. The average grain yield of the BC lines and the commercial varieties did not differ significantly for the non-inoculated trials (Figure 2). However, grain yields for three of the ten BC lines assessed in the 2017 crop season were significantly higher (p < 0.01) than Compass and one significantly (p < 0.05) higher than Spartacus and Westminster, and three BC lines (BC1-02, BC1-08 and BC1-09) yielded significantly (p < 0.01) higher than the average yield of the commercial varieties at the Gatton trial (Figure 3a), while only BC1-09 line yielded significantly (p < 0.01) higher than the average of varieties at the Narrabri trial (Figure 3b). Of the twenty-five BC lines assessed in the 2018 crop season, one BC line yielded significantly (p < 0.01) higher than Lockyer at the Narrabri site in 2018 (Figure 3c), while 13 BC lines yielded significantly higher than Spartacus and 12 significantly (p < 0.05) higher than La Trobe and Westminster and six (BC1-06, BC1-09, BC3-09, BC3-11 and BC3-13) produced significantly (p < 0.05) higher grain yield compared to the average of the commercial varieties in the non-inoculated trials at the Tosari site (Figure 3d). Grain yields of the best two lines (BC1-09 and BC3-13) were as much as 22.0% higher than the average of the commercial varieties in the non-inoculated conditions (Figure 3).
Significant differences in yield reduction were detected between BC lines and varieties in the Fp-inoculated trials at both sites in 2017 and one site in 2018 (Figure 4a). The average yield reduction in the BC lines was 8.2% (varied from 5.5 to 17.2%) compared with the average of 22.8% for the local varieties at the Gatton trial (Figure 3a). Five BC lines yielded significantly higher than Westminster and Compass, three significantly higher than Spartacus and one significantly higher than La Trobe, and three of the ten BC lines (BC1-02, BC-1-08 and BC1-09) yielded significantly better than the average of the varieties under FCR infection. Similar results were also detected from the Narrabri trial. Yield reductions of the BC lines varied from 1.9 to 13.3%, with an average of 5.4%, compared with an average of 13.5% for the commercial varieties (Figure 3b). Two of the BC lines (BC1-05 and BC1-09) yielded significantly better than the average of the varieties under FCR infection. Of the 25 BC lines assessed in the 2018 crop season, 24 except BC1-07 lost less grain yield (with an average of 10.2%) than the commercial varieties under FCR infection (with an average of 18.6%). Eighteen BC lines yielded significantly higher than Westminster, 17 significantly higher than Spartacus, 14 significantly higher than La Trobe, and one significantly higher than Compass and Lockyer. Seven BC lines (BC1-05, BC1-06, BC1-09, BC3-02, BC3-09, BC3-10 and BC3-13) recorded significantly higher grain yields compared to the average of the varieties (Figure 3). Grain yields of the best two BC lines (BC1-09 and BC3-13) were as much as 34.4% higher than the average of the local varieties in the Fp-inoculated trials.
Significant main effects for genotype and trial indicated that both of these factors influenced TKW. Based on combined data from all trials, significant differences in TKW for the non-inoculated treatment were not detected between BC lines and the local varieties in the 2017 crop season. However, significant differences were detected in the 2018 crop season (Figure S2a). TKW for the BC lines ranged from 33.3 to 51.7 g in 2017 and from 33.3 to 46.7 g in 2018, while TKW for the local varieties was from 29.7 to 46.0 g in 2017 and from 36.7 to 46.7 g in 2018, respectively (Figure S2a). TKW for both BC lines and commercial varieties was not significantly different between the non-inoculated and Fp-inoculated treatments (Figure S2b,c) in both the 2017 and 2018 crop seasons. The average TKW for the BC lines changed slightly from 39.5 g to 38.5 g and from 38.5 g to 37.9 g in 2017 and 2018, respectively, while the average TKW for the varieties changed from 38.3 g to 36.1 g and from 41.7 g to 41.0 g in 2017 and 2018, respectively. As TKW for both BC lines and varieties was recorded higher in some of the Fp-inoculated plots compared to the non-inoculated plots, the differences in TKW reduction between BC lines and commercial varieties were not significant in all trials (Figure S2d).
Significant differences between BC lines containing both the resistant alleles and commercial varieties in FCR severity were detected under the Fp-inoculated treatment (Figure 4b). DI values of the BC lines ranged from 26.3 to 37.7, with an average of 31.8, whereas those of the varieties varied from 41.6 to 50.0, with an average of 46.4 in the 2017 trials. The difference in DI values between the BC lines and the commercial varieties was 31.5% on average. Similar results were also obtained in 2018. DI values among the BC lines ranged from 25.4 to 34.9, with an average of 29.9, whereas those of the varieties varied from 45.0 to 57.2, with an average of 49.8. The difference in DI values on average between the BC lines and the commercial varieties was as much as 40.0% (Figure 4b).

4. Discussion

FCR is a major constraint to cereal production in semi-arid regions worldwide, and this disease has become more prevalent in recent years. Research in genetic improvement of FCR resistance has led to the identification of several QTLs conferring seedling resistance. NILs targeting some of these loci in both barley and wheat have been generated [29,30,43], and BC lines containing resistant alleles at two or more loci have been obtained [31,44]. The study demonstrates for the first time that resistance QTLs identified from a particular method of seedling assay [34] not only reduced FCR symptoms development as measured by stem browning in the field but also significantly reduced grain yield loss from the disease. The best two selected BC lines (BC1-09 and BC3-13) possessing resistant alleles at both the targeted loci also showed similar yield potential to that of the commercial varieties in both Fp-inoculated and non-inoculated plots. In spite of the lack of adaptation of the donor lines, a few backcrosses with adapted varieties were required to produce lines with good agronomic performance and yield potential. Markers co-segregating with both of the targeted loci have been obtained [45,46], further facilitating the adoption of them in breeding programs.
Interestingly, significant differences in TKW were detected only between the “R” and “S” isolines for the NIL pairs of 1HL under Fp inoculation but not between the “R” and “S” isolines for the NILs targeting the 4HL NILs. Although both loci were detected from the same seedlings assay, the mechanisms of these two loci might be different, which potentially caused such differences in TKW reduction. As significant differences in kernel numbers per spike were not observed in any of the trials, it is hypothesised that changes in numbers of fertile tillers must be responsible for the yield differences detected. This likelihood is supported by the fact that, although Fp-treatments reduced kernel yield significantly, whiteheads were not observed in any of the trials. Considering that both loci assessed in this study were detected from seedling assays [25,27,31], it is not surprising that resistant alleles might have reduced losses in tiller numbers under Fp-treatments. These results also indicated that estimating yield loss based on “whiteheads” [6,36] may not be reliable in barley. Further investigations are warranted to assess different yield components to clarify the main contributing factors for the significant yield reduction in the presence of FCR.
Different from the BC lines, NILs used in this study were obtained from the previous studies [29,30] and generated from simple crosses or three-way crosses between exotic genotypes (both donors for the resistant alleles) and commercial varieties. The selection of agronomic characteristics was not conducted at any stage during their development. Thus, their relatively low yield potentials were expected [47,48]. Some of the NILs also lodged severely in some of the trials, making them difficult to manage and harvest. Nevertheless, consistent results in reducing FCR severity as well as grain yield loss under the disease infection were obtained from the NILs targeting both loci in this study. These results demonstrated the huge advantage of using NILs in such studies: comparing two lines is all that is required to assess the effects of any given locus in a given genetic background.
It is of note that the differences among the NILs tended to be higher compared with those detected between BC lines possessing the same resistant alleles. This was the case for both FCR severity and yield reduction under FCR infection. These differences were not surprising as the NILs and BC lines have different genetic backgrounds. Results from previous studies showed that FCR severity interacts strongly with other characteristics. For example, interactions between FCR severity and plant height and flowering time were observed in germplasm screening [24] and QTLs mapping studies [25,26,27,49]. Assessing NILs for various reduced height genes showed that dwarf isolines gave reduced symptoms of the disease in both wheat [50] and barley [51]. The difference in FCR severity observed between the tall and dwarf isolines was not associated with expression levels of genes associated with resistance to this disease [50]. Results from another study also showed that F. pseudograminearum hyphae were detected earlier and proliferated more rapidly during the time course of FCR development in the tall isolines [52]. As FCR resistance is highly quantitative, such interactions indicate that genotypes with a given resistant gene may not necessarily show milder disease symptoms than those without it.
Importantly, both loci that were detected from a seedling assay showed improved field resistance to FCR infection assessed in this study [24]. As described in the review by Liu and Ogbonnaya (2015) [15], several other methods of FCR inoculation and assessments are also available. Results from an earlier study showed that different loci of resistance could be detected by different methods [35]. Clearly, the field performance of resistance loci detected by different methods of seedling assays may also vary. In other words, the results from this study do not infer by any means that differences in FCR resistance among genotypes detected from the use of different methods of seedling assay can all be reliably used to predict their field performance.

Supplementary Materials

The following supporting information can be downloaded at: https://www.mdpi.com/article/10.3390/agronomy12061282/s1, Figure S1: An example of trial layout in one of the field sites. nil represents non-inoculated treatment and plus represents Fp-inoculated treatment; Figure S2: Box plot distributions of TKW differences between BC lines and local varieties in the non-inoculated treatment (a), differences in local varieties between non-inoculated and Fp-inoculated treatments (b), differences in BC lines between non-inoculated and Fp-inoculated treatments (c), and differences in TKW loss between BC lines and local varieties with one way ANOVA student’s t test (p-value are provided). Boxes indicate the 25 and 75 percentiles, respectively; the median is indicated by the solid horizontal line. Whiskers represent the range and black dots the outliers; Table S1: Pedigrees for the NILs targeting the 1HL- and 4HL- resistant loci used for the field assessments; Table S2: Pedigrees of BC1 lines containing both 1HL- and 4HL- resistant loci used for the field assessment in 2017 and 2018; Table S3: Pedigrees of BC3 lines containing both 1HL- and 4HL- resistant loci assessed in 2018.

Author Contributions

C.L., P.D. and Z.Z. conceived the work and wrote the manuscript. Z.Z., P.D., J.P. and C.P. contributed to the field assessment. J.P., M.Z., P.D. and C.P. contributed to the preparation and revision of the manuscript. A.K., B.M. and S.G. contributed to the design and statistical analysis of the data. All authors have read and agreed to the published version of the manuscript.

Funding

The work reported here was partially funded by the Grains Research and Development Corporation, Australia (Project CFF00010).

Institutional Review Board Statement

Not applicable.

Informed Consent Statement

Not applicable.

Acknowledgments

The authors are grateful to Andrew James and Jiri Stiller for their constructive suggestions during the preparation of the manuscript. The authors also wish to thank Caritta Eliasson, Anca Rusu and Rosalie Sabburg for their technical supports.

Conflicts of Interest

The authors declare that the research was conducted in the absence of any commercial or financial relationship that could construe as a potential conflict of interest.

References

  1. Murray, G.M.; Brennan, J.P. Estimating disease losses to the Australian wheat industry. Australas. Plant Pathol. 2009, 38, 558–570. [Google Scholar] [CrossRef]
  2. Murray, G.M.; Brennan, J.P. Estimating disease losses to the Australian barley industry. Australas. Plant Pathol. 2010, 39, 85–96. [Google Scholar] [CrossRef]
  3. Smiley, R.W.; Gourlie, J.A.; Easley, S.A.; Patterson, L.-M.; Whittaker, R.G. Crop Damage Estimates for Crown Rot of Wheat and Barley in the Pacific Northwest. Plant Dis. 2005, 89, 595–604. [Google Scholar] [CrossRef] [Green Version]
  4. Tunali, B.; Nicol, J.M.; Hodson, D.; Uçkun, Z.; Büyük, O.; Erdurmuş, D.; Hekimhan, H.; Aktaş, H.; Akbudak, M.A.; Bağci, S.A. Root and Crown Rot Fungi Associated with Spring, Facultative, and Winter Wheat in Turkey. Plant Dis. 2008, 92, 1299–1306. [Google Scholar] [CrossRef] [PubMed] [Green Version]
  5. Saremi, H.; Ammarellou, A.; Jafary, H. Incidence of crown rot disease caused by Fusarium pseudograminearum as a new soil born fungal species in North West Iran Pak. J. Biol. Sci. 2007, 20, 3606–3612. [Google Scholar]
  6. Chakraborty, S.; Liu, C.J.; Mitter, V.; Scott, J.B.; Akinsanmi, O.; Ali, S.; Dill-Macky, R.; Nicol, J.; Backhouse, D.; Simpfendorfer, S. Pathogen population structure and epidemiology are keys to wheat crown rot and Fusarium head blight management. Australas. Plant Pathol. 2006, 35, 643–655. [Google Scholar] [CrossRef]
  7. Matny, O.N.; Bates, S.T.; Song, Z. Original Article. Geographic distribution of Fusarium culmorum chemotypes associated with wheat crown rot in Iraq. J. Plant Prot. Res. 2017, 57, 43–49. [Google Scholar] [CrossRef]
  8. Minati, M.H. First record of nine Fusarium spp. causing root rot on wheat (Triticum aestivum L.) in Iraq. AIP Conf. Proc. 2020, 2290, 020009. [Google Scholar] [CrossRef]
  9. Chakraborty, S.; Obanor, F.; Westecott, R.; Abeywickrama, K. Wheat Crown Rot Pathogens Fusarium graminearum and F. pseudograminearum Lack Specialization. Phytopathology 2010, 100, 1057–1065. [Google Scholar] [CrossRef] [Green Version]
  10. Hameed, M.; Rana, R.; Ali, Z. Identification and characterization of a novel Iraqi isolate of Fusarium pseudograminearum causing crown rot in wheat. Genet. Mol. Res. 2012, 11, 1341–1348. [Google Scholar] [CrossRef]
  11. Li, H.L.; He, X.L.; Ding, S.L.; Yuan, H.X.; Chen, L.L. First Report of Fusarium culmorum Causing Crown Rot of Wheat in China. Plant Dis. 2016, 100, 2532. [Google Scholar] [CrossRef]
  12. Xu, F.; Song, Y.L.; Wang, J.M.; Liu, L.L.; Zhao, K. Occurrence of Fusarium Crown Rot Caused by Fusarium pseudograminearum on Barley in China. Plant Dis. 2017, 101, 837. [Google Scholar] [CrossRef]
  13. Liu, Y.; Ma, J.; Yan, W.; Yan, G.; Zhou, M.; Wei, Y.; Zheng, Y.; Liu, C. Different Tolerance in Bread Wheat, Durum Wheat and Barley to Fusarium Crown Rot Disease Caused by Fusarium pseudograminearum. J. Phytopathol. 2012, 160, 412–417. [Google Scholar] [CrossRef]
  14. Purss, G. Pathogenic specialization in Fusarium graminearum. Aust. J. Agric. Res. 1971, 22, 553–561. [Google Scholar] [CrossRef]
  15. Liu, C.; Ogbonnaya, F.C. Resistance to Fusarium crown rot in wheat and barley: A review. Plant Breed. 2015, 134, 365–372. [Google Scholar] [CrossRef]
  16. Akinsanmi, O.; Mitter, V.; Simpfendorfer, S.; Backhouse, D.; Chakraborty, S. Identity and pathogenicity of Fusarium spp. isolated from wheat fields in Queensland and northern New South Wales. Aust. J. Agric. Res. 2004, 55, 97–107. [Google Scholar] [CrossRef]
  17. Dodman, R.; Wildermuth, G. Inoculation methods for assessing resistance in wheat to crown rot caused by Fusarium graminearum Group 1. Crop Pasture Sci. 1987, 38, 473–486. [Google Scholar]
  18. Burgess, L.W.; Backhouse, D.; Summerell, B.A.; Swan, L.J. Crown Rot of Wheat, Fusarium: Paul E; Nelson Memorial Symposium; APS Press: St. Paul, MN, USA, 2001; pp. 1–294. [Google Scholar]
  19. Cook, R.J. Untold Stories: Forty Years of Field Research on Root Diseases of Wheat; American Phytopathological Society (APS Press): St. Paul, MN, USA, 2017. [Google Scholar] [CrossRef]
  20. Smiley, R.W. Fusarium Crown Rot Whitehead Symptom as Influenced by Wheat Crop Management and Sampling Date. Plant Dis. 2019, 103, 2612–2623. [Google Scholar] [CrossRef]
  21. Summerell, B.A.; Leslie, J.F.; Backhouse, D.; Bryden, W.L.; Burgess, L.W. Fusarium: Paul E. Nelson Memorial Symposium; American Phytopathological Society (APS Press): St. Paul, MN, USA, 2001. [Google Scholar]
  22. Smiley, R.W. Water and Temperature Parameters Associated with Winter Wheat Diseases Caused by Soilborne Pathogens. Plant Dis. 2009, 93, 73–80. [Google Scholar] [CrossRef] [Green Version]
  23. Kazan, K.; Gardiner, D.M. Fusarium crown rot caused by Fusarium pseudograminearum in cereal crops: Recent progress and future prospects. Mol. Plant Pathol. 2018, 19, 1547–1562. [Google Scholar] [CrossRef] [Green Version]
  24. Liu, Y.X.; Zheng, Y.L.; Wei, Y.; Zhou, M.X.; Liu, C.J. Genotypic differences to crown rot caused by Fusarium pseudograminearum in barley (Hordeum vulgare L.). Plant Breed. 2012, 131, 728–732. [Google Scholar] [CrossRef]
  25. Chen, G.D.; Liu, Y.X.; Wei, Y.M.; McIntyre, C.L.; Zhou, M.X.; Zheng, Y.-L.; Liu, C.J. Major QTL for Fusarium crown rot resistance in a barley landrace. Theor. Appl. Genet. 2013, 126, 2511–2520. [Google Scholar] [CrossRef] [PubMed]
  26. Li, H.B.; Zhou, M.X.; Liu, C.J. A major QTL conferring crown rot resistance in barley and its association with plant height. Theor. Appl. Genet. 2009, 118, 903–910. [Google Scholar] [CrossRef] [PubMed]
  27. Chen, G.; Liu, Y.; Ma, J.; Zheng, Z.; Wei, Y.; McIntyre, C.L.; Zheng, Y.-L.; Liu, C. A Novel and Major Quantitative Trait Locus for Fusarium Crown Rot Resistance in a Genotype of Wild Barley (Hordeum spontaneum L.). PLoS ONE 2013, 8, e58040. [Google Scholar] [CrossRef] [Green Version]
  28. Gao, S.; Zheng, Z.; Hu, H.; Shi, H.; Ma, J.; Liu, Y.; Wei, Y.; Zheng, Y.-L.; Zhou, M.; Liu, C. A Novel QTL Conferring Fusarium Crown Rot Resistance Located on Chromosome Arm 6HL in Barley. Front. Plant Sci. 2019, 10, 1206. [Google Scholar] [CrossRef] [Green Version]
  29. Gao, S.; Zheng, Z.; Powell, J.; Habib, A.; Stiller, J.; Zhou, M.; Liu, C. Validation and delineation of a locus conferring Fusarium crown rot resistance on 1HL in barley by analysing transcriptomes from multiple pairs of near isogenic lines. BMC Genom. 2019, 20, 650. [Google Scholar] [CrossRef] [Green Version]
  30. Habib, A.; Shabala, S.; Shabala, L.; Zhou, M.; Liu, C. Near-isogenic lines developed for a major QTL on chromosome arm 4HL conferring Fusarium crown rot resistance in barley. Euphytica 2015, 209, 555–563. [Google Scholar] [CrossRef]
  31. Chen, G.; Habib, A.; Wei, Y.; Zheng, Y.-L.; Shabala, S.; Zhou, M.; Liu, C. Enhancing Fusarium crown rot resistance by pyramiding large-effect QTL in barley. Mol. Breed. 2015, 35, 26. [Google Scholar] [CrossRef]
  32. Wildermuth, G.; McNamara, R. Testing wheat seedlings for resistance to crown rot caused by Fusarium graminearum group 1. Plant Dis. 1994, 10, 949–953. [Google Scholar] [CrossRef]
  33. Mitter, V.; Zhang, M.C.; Liu, C.J.; Ghosh, R.; Ghosh, M.; Chakraborty, S. A high-throughput glasshouse bioassay to detect crown rot resistance in wheat germplasm. Plant Pathol. 2006, 55, 433–441. [Google Scholar] [CrossRef]
  34. Li, X.; Liu, C.; Chakraborty, S.; Manners, J.M.; Kazan, K. A Simple Method for the Assessment of Crown Rot Disease Severity in Wheat Seedlings Inoculated with Fusarium pseudograminearum. J. Phytopathol. 2008, 156, 751–754. [Google Scholar] [CrossRef]
  35. Yang, X.; Ma, J.; Li, H.; Ma, H.; Yao, J.; Liu, C. Different genes can be responsible for crown rot resistance at different developmental stages of wheat and barley. Eur. J. Plant Pathol. 2010, 128, 495–502. [Google Scholar] [CrossRef]
  36. Martin, A.; Bovill, W.D.; Percy, C.D.; Herde, D.; Fletcher, S.; Kelly, A.; Neate, S.M.; Sutherland, M.W. Markers for seedling and adult plant crown rot resistance in four partially resistant bread wheat sources. Theor. Appl. Genet. 2014, 128, 377–385. [Google Scholar] [CrossRef] [PubMed]
  37. Tuinstra, M.R.; Ejeta, G.; Goldsbrough, P.B. Heterogeneous inbred family (HIF) analysis: A method for developing near-isogenic lines that differ at quantitative trait loci. Theor. Appl. Genet. 1997, 95, 1005–1011. [Google Scholar] [CrossRef]
  38. Zheng, Z.; Wang, H.B.; Chen, G.D.; Yan, G.; Liu, C.J. A procedure allowing up to eight generations of wheat and nine generations of barley per annum. Euphytica 2013, 191, 311–316. [Google Scholar] [CrossRef]
  39. Patterson, H.D.; Thompson, R. Recovery of inter-block information when block sizes are unequal. Biometrika 1971, 58, 545–554. [Google Scholar] [CrossRef]
  40. Kenward, M.G.; Roger, J.H. Small sample inference for fixed effects from restricted maximum likelihood. Biometrics 1997, 53, 983–997. [Google Scholar] [CrossRef] [Green Version]
  41. Butler, D.; Cullis, B.R.; Gilmour, A.; Gogel, B. ASReml-R Reference Manual The State of Queensland; Department of Primary Industries and Fisheries: Brisbane, Australia, 2009. [Google Scholar]
  42. R Development Core Team R. R: A Language and Environment for Statistical Computing; R Foundation for Statistical Computing: Vienna, Austria, 2011. [Google Scholar]
  43. Ma, J.; Yan, G.; Liu, C.J. Development of near-isogenic lines for a major QTL on 3BL conferring Fusarium crown rot resistance in hexaploid wheat. Euphytica 2012, 183, 147–152. [Google Scholar] [CrossRef]
  44. Zheng, Z.; Gao, S.; Zhou, M.; Yan, G.; Liu, C. Enhancing Fusarium crown rot resistance by pyramiding large-effect QTL in common wheat (Triticum aestivum L.). Mol. Breed. 2017, 37, 107. [Google Scholar] [CrossRef]
  45. Gao, S.; Zheng, Z.; Hu, H.; Jiang, Y.; Liu, M.; Stiller, J.; Zhou, M.; Liu, C. Delineating a locus conferring Fusarium crown rot resistance on chromosome arm 1HL in barley by developing and analysing a large population derived from near isogenic lines. Crop J. 2020, 8, 1002–1010. [Google Scholar] [CrossRef]
  46. Jiang, Y.; Habib, A.; Zheng, Z.; Zhou, M.; Wei, Y.; Zheng, Y.-L.; Liu, C. Development of tightly linked markers and identification of candidate genes for Fusarium crown rot resistance in barley by exploiting a near-isogenic line-derived population. Theor. Appl. Genet. 2018, 132, 217–225. [Google Scholar] [CrossRef] [PubMed]
  47. Ma, Z.; Xue, S.; Lin, F.; Yang, S.; Li, G.; Tang, M.; Kong, Z.; Cao, Y.; Zhao, D.; Jia, H.; et al. Mapping and validation of scab resistance QTLs in the Nanda2419 × Wangshuibai population. Cereal Res. Commun. 2008, 36, 245–251. [Google Scholar] [CrossRef]
  48. McCartney, C.A.; Somers, D.J.; Fedak, G.; Depauw, R.M.; Thomas, J.; Fox, S.L.; Humphreys, D.G.; Lukow, O.; Savard, M.E.; McCallum, B.D.; et al. The evaluation of FHB resistance QTLs introgressed into elite Canadian spring wheat germplasm. Mol. Breed. 2007, 20, 209–221. [Google Scholar] [CrossRef]
  49. Zheng, Z.; Kilian, A.; Yan, G.; Liu, C. QTL Conferring Fusarium Crown Rot Resistance in the Elite Bread Wheat Variety EGA Wylie. PLoS ONE 2014, 9, e96011. [Google Scholar] [CrossRef] [Green Version]
  50. Liu, Y.X.; Yang, X.M.; Ma, J.; Wei, Y.M.; Zheng, Y.L.; Ma, H.X.; Yao, J.B.; Yan, G.; Wang, Y.-G.; Manners, J.M.; et al. Plant Height Affects Fusarium Crown Rot Severity in Wheat. Phytopathology 2010, 100, 1276–1281. [Google Scholar] [CrossRef] [Green Version]
  51. Chen, G.; Yan, W.; Liu, Y.; Wei, Y.; Zhou, M.; Zheng, Y.-L.; Manners, J.M.; Liu, C. The non-gibberellic acid-responsive semi-dwarfing gene uzu affects Fusarium crown rot resistance in barley. BMC Plant Biol. 2014, 14, 22. [Google Scholar] [CrossRef] [Green Version]
  52. Bai, Z.; Liu, C. Histological Evidence for Different Spread of Fusarium crown rot in Barley Genotypes with Different Heights. J. Phytopathol. 2015, 163, 91–97. [Google Scholar] [CrossRef]
Figure 1. Box plot distributions of (a) grain yield without Fp inoculation, (b) grain yield reductions with Fp inoculation, (c) TKW without Fp inoculation and (d) TKW reductions with Fp inoculation between the isolines with or without the 1HL- and 4HL-resistant loci. Boxes indicate the 25 and 75 percentiles, respectively; the median is indicated by the solid horizontal line. Whiskers represent the range, and black dots represent outliers.
Agronomy 12 01282 g001
Figure 2. Box plot distributions of grain yield between BC lines and local varieties with one-way ANOVA student’s t test. Boxes indicate the 25 and 75 percentiles, respectively; the median is indicated by the solid horizontal line. Whiskers represent the range and the black dot the outlier.
Agronomy 12 01282 g002
Figure 3. Performance of BC1 and BC3 lines compared with commercial varieties on grain yield at four locations (a) Gatton in 2017, (b) PBI Narrabri in 2017, (c) PBI Narrabri in 2018 and (d) Tosari in 2018. Variety: the average of all commercial varieties.
Agronomy 12 01282 g003
Figure 4. Box plot distributions of yield reduction (a) and disease indices for FCR severity (b) between BC lines and varieties with one-way ANOVA student’s t test (p-value are provided). Boxes indicate the 25 and 75 percentiles, respectively; the median is indicated by the solid horizontal line. Whiskers represent the range, and black dots represent outliers.
Agronomy 12 01282 g004
Table 1. Summary of the significance of fixed effects from the analysis of yield, thousand kernel weight (TKW) and disease index (DI) for the ten sets of NILs at two field sites in 2017, including the numerator degrees of freedom (d.f.) and the denominator degrees of freedom (den. d.f.). The denominator degrees of freedom are calculated according to Kenward and Roger (1997) [40].
Termd.f.Grain YieldTKWDI
den. d.f.p-Valueden. d.f.p-Valueden. d.f.p-Value
Trial (T)143.60.04393.2<0.001102.20.198
Inoculation (I)198.30.04290<0.001
Locus (L)11.10.03392.40.032102.20.002
T:I180.30.72195.20.556
L:Allele (A)239.6<0.00190.70.008102.2<0.001
T:L169.1<0.00190.90.494102.20.68
I:L186.50.77984.40.719
L:A:Genotype (G)1615<0.00190.1<0.001102.20.826
T:L:A284.60.115920.081102.20.616
I:L:A285.8<0.00181.30.001
T:I:L186.10.6181.60.973
T:L:A:G1685.1<0.00190.1<0.001102.21
I:L:A:G1685.60.95181.80.034
T:I:L:A286.30.4181.50.1
T:I:L:A:G1685.30.58480.90.33
Table 2. A comparison of the disease index for the ten pairs of NILs targeting either the 1HL or 4HL locus at two locations in the 2017 trials.
GenotypeGattonNarrabri
DIDifference (%)p-ValueDIDifference (%)p-Value
CR1H_1R33.228.0%<0.0129.324.5%<0.01
CR1H_1S46.1 38.8
CR1H_3R34.412.2%<0.0131.518.0%<0.01
CR1H_3S39.2 38.4
CR1H_7R29.327.4%<0.0129.316.8%<0.01
CR1H_7S40.4 35.3
CR1H_8R29.324.5%<0.0129.819.2%<0.01
CR1H_8S38.8 36.9
CR1H_9R28.924.9%<0.0129.322.9%<0.01
CR1H_9S38.4 38.1
CR4H_1R31.930.8%<0.0131.915.2%<0.01
CR4H_1S46.1 37.7
CR4H_3R31.927.1%<0.0131.923.1%<0.01
CR4H_3S43.9 41.6
CR4H_4R40.817.1%<0.0137.712.6%<0.05
CR4H_4S49.2 43.1
CR4H_6R39.215.7%<0.0137.311.1%<0.05
CR4H_6S46.5 41.9
CR4H_8R31.125.9%<0.0131.123.0%<0.01
CR4H_8S41.9 40.4
Table 3. Summary of the significance of fixed effects from the analysis of yield, thousand kernel weight (TKW) and disease index (DI) for the BC lines and commercial varieties from the four field trials, including the numerator degrees of freedom (d.f.) and the denominator degrees of freedom (den. d.f.). The denominator degrees of freedom are calculated according to Kenward and Roger (1997) [40].
Termd.f.Grain YieldTKWDI
den. d.f.p-Valueden. d.f.p-Valueden. d.f.p-Value
Trial (T)33.70.00416.3<0.00188.90.496
Inoculation (I)12.8<0.001154.50.132
Genotype (G)3043.5<0.00156.5<0.00147.6<0.001
T:I311.20.00383.60.235
T:G5673.40.00198.30.43889.60.074
I:G3028.8<0.001105.30.198
T:I:G5652.60.002730.722
Publisher’s Note: MDPI stays neutral with regard to jurisdictional claims in published maps and institutional affiliations.

