Article

Comparative Analysis of Transcriptome Profiles Reveals the Mechanisms in the Difference of Low Potassium Tolerance among Cultivated and Tibetan Wild Barleys

1
College of Agriculture & Biological Sciences, Dali University, Dali 671003, China
2
Department of Agronomy, Zijingang Campus, Zhejiang University, Hangzhou 310058, China
*
Author to whom correspondence should be addressed.
These authors contributed equally to this work.
Agronomy 2022, 12(5), 1094; https://doi.org/10.3390/agronomy12051094
Submission received: 8 April 2022 / Revised: 27 April 2022 / Accepted: 29 April 2022 / Published: 30 April 2022
(This article belongs to the Topic Plant Nutrition Biofortification)

Abstract

:
Potassium (K) deficiency is a bottleneck for crop production. Thus, developing low K (LK)-tolerant crop cultivars to relieve the issue is extremely urgent. Our previous studies had found that Tibetan annual wild barley accessions showed a higher LK tolerance than the cultivated barley. In this study, RNA-sequencing was performed on three barley genotypes, wild (XZ153, LK tolerance; XZ141, LK sensitivity) and cultivated (ZD9, LK sensitivity) barley genotypes, to compare the transcriptome profiles of their shoots at two time points after LK stress. In total, 4832 genes displayed differential expression at 48 h and 15 d among three genotypes after K stress treatment, with XZ153 having much more differentially expressed genes (DEGs) at 48 h than 15 d, but it was the opposite in ZD9. Meanwhile, GO annotation analysis and KEGG pathway enrichment were implemented on 555 and 814 LK tolerance-associated DEGs at 48 h and 15 d after LK stress, respectively. Three barley genotypes differed significantly in transcriptional level after LK treatment. The high tolerance in wild genotype XZ153 could be attributed to many factors, mainly including K channels, Ca2+ signaling pathway, ethylene biosynthesis process, TCA cycle, glycolysis, pentose phosphate pathway, and photosynthesis. Furthermore, some candidate genes identified in this study may be used to improve the LK tolerance of barley.

1. Introduction

Potassium (K) is crucial for plants and has important physiological functions [1]; however, available K is quite limited in most soil for plants [2]. Thus, K deficiency poses a severe limitation for crop production in the world. The best and most effective way to relieve K deficiency is to develop low K (LK)-tolerant crop varieties. It is well documented that LK tolerance differs greatly among plant species and genotypes within a species [2], so it is possible for us to improve the traits through genetic manipulation. Moreover, it is imperative to reveal the underlying plant mechanisms responding to LK stress.
Barley (Hordeum vulgare L.) is grown around the world. In comparison with cultivated barley, Tibetan annual wild barley has wider genetic diversity [3], particularly in abiotic stress tolerance [4,5,6,7,8]. Our previous studies proved that some Tibetan wild barley genotypes had high LK tolerance [8,9,10]. Moreover, we found that XZ153, an LK-tolerant wild genotype, could remobilize more K from the older leaves into the younger ones than ZD9, an LK-sensitive genotype [11]. Additionally, XZ153 can absorb and accumulate more K to maintain its LK tolerance [12].
Nowadays, the RNA-Sequencing technique is widely applied to studying of gene expression level [13,14]. For example, it has made great function in plants’ responses to salinity [15], drought [16], heat [17], aluminum [18] and nutrient deficiency [19,20].
The previous studies showed wild accession XZ153 had higher LK tolerance than wild accession XZ141 and cultivar ZD9 through root and leaf (older and younger) transcriptome analysis [11,12]. However, there are few studies on the transcriptome of barley differing in LK tolerance. In addition, there is a lack of an overall response mechanism and regulatory network in barley exposed to LK stress. Accordingly, we investigated transcriptome profiling in the shoots of three barley genotypes (XZ153, XZ141, ZD9) responding to LK using RNA-Seq, and predicted that the transcriptome of the three barley genotypes is very different, in order to (1) identify the genotypic difference in the gene expression profiles of three barley genotypes in responding to LK stress; (2) provide more evidence for further improvement of the previous transcriptome study; and (3) construct the possible regulatory networks in barley in response to LK stress.

2. Materials and Methods

2.1. Materials and Plant Growth

The materials used in the current study consisted of three barley genotypes, XZ153, XZ141, and ZD9. XZ153 (low K tolerant) and XZ141 (low K sensitive) are Tibetan wild barley accessions which differ in low K tolerance, and ZD9 is the main cultivar that is low K sensitive. The experiment was performed via hydroponics, and pre-germination treatments and germination methods were done according to Ye et al. [9]. After germination for 7 d, the uniform seedlings were selected and transplanted into the black plastic pots. To avoid K supply from the seed, we removed seeds when transplanted. The hydroponic solution, aeration condition, solution renewal time, and pH were applied according to Zeng et al. and Ye et al. [9,12]. K treatments were 0.01 mM for LK and 1.0 mM for normal (control) treatment. There were three replicates for each treatment.

2.2. RNA-Seq Sample Collection and Preparation

At 48 h and 15 d after LK stress treatment, shoots of seedlings in all treatments and replicates [total 36, 3 genotypes × 2 treatments × 2 sampling times × 3 biological replications] were sampled for RNA-Seq. Additionally, the selection of the two sampling time points (48 h and 15 d) was in reference and summary to the team’s previous research on the transcriptome of barley in response to LK stress [11,12]. Additionally, total RNA was extracted from the harvested shoots using Trizol reagent (Invitrogen, Carlsbad, CA, USA), then the kit NEBNext Poly(A) mRNA Magnetic Isolation Module, NEB#E7490 (New England Biolabs, Inc., Ipswich, MA, USA), was used to isolate mRNA from 1 μg of total RNA. Additionally, the cDNA library was constructed from the purified mRNA according to the protocol provided with the NEBNext Ultra RNA Library Prep Kit for Illumina, NEB #E7530 (New England Biolabs, Inc., Ipswich, MA, USA), and were verified by Qubit 2.0 and Agilent 2100. Additionally, the effective concentration of the cDNA library was measured by Quantitative PCR. The library was sequenced by using an Illumina HiSeqXten platform with a paired-end sequencing length of 150 bp (PE150) at Biomarker Technologies (Beijing, China). All the above steps were conducted according to Ye et al. [11]. Lastly, pure PCR products were obtained, and library quality was further assessed.
Raw data of fasta format were firstly processed after a series of steps, including cluster generation, library sequencing, and generation of paired-end reads. During this process, clean data were procured by abandoning invalid reads, which was the basis of the downstream analyses. Additionally, the accession number of raw data was PRJNA832317 (http://www.ncbi.nlm.nih.gov/bioproject/832317, accessed on 29 April 2022). Next, the clean reads were mapped to a reference genome and gene set (IPK, 160517_Hv_IBSC_PGSB_r1_CDS_HighConf_REPR_annotation.fasta). We only analyzed and annotated the perfect match reads or mismatch reads. Then, we aligned RNA-Seq reads to the barley reference genomes on TopHat (http://tophat.cbcb.umd.edu/, accessed on 8 April 2022) [21], and identified splice junctions between exons [22].

2.3. DEG Identification, GO Annotation, and KEGG Pathway Analysis

In this study, we used the FPKM to figure the library’s normalized expression data [23]. A standard of p-value ≤ 0.01 and absolute log2 (fold change) ≥ 1 through DEseq2 was applied to identify DEGs [24]. GO and KEGG enrichment analysis were carried out on the BMK Cloud platform (www.biocloud.net, accessed on 5 October 2021) using GOseq R packages [25] and KOBAS software [26], respectively.

2.4. Statistical Analysis

Significance of the differences among treatments and genotypes are measured by Duncan’s Multiple Range Test on SPSS statistical software, and the difference at p < 0.05 means it is significant.

3. Results

3.1. Evaluation of RNA-Seq Reads and Mapping Results

A total of 299.92 Gb clean reads were obtained; each sample’s clean data reached up to 6.25 Gb, and the sequence alignment efficiency ranged from 79.38% to 85.37%. The obtained reads could be classified into two parts, multiple and unique mapped reads (Table S1). Meanwhile, we got a total of 34,719 expressed genes from all samples, which could provide favorable conditions for subsequent expression profiling analysis.
For the validity of RNA-Seq data, eight DEGs identified in the two sampling times were selected for qRT-PCR analysis (Table S2). They included WD repeat-containing protein (MLOC_60578), Pentatricopeptide repeat-containing protein (MLOC_75411), 40S ribosomal protein (Hordeum_vulgare_newGene_10508), Dihydrolipoyl dehydrogenase 1 (MLOC_10877), ATP synthase subunit beta (EPlHVUG00000010007), S-adenosylmethionine decarboxylase (MLOC_69795), Photosystem II reaction center protein Z (EPlHVUG00000010036), BTB/POZ and TAZ domain-containing protein 2 (MLOC_14183) (Table S2). The gene expression patterns obtained from qRT-PCR were highly consistent with those from RNA-Seq analysis (Figure 1). Hence, the data obtained from RNA-seq were reliable.

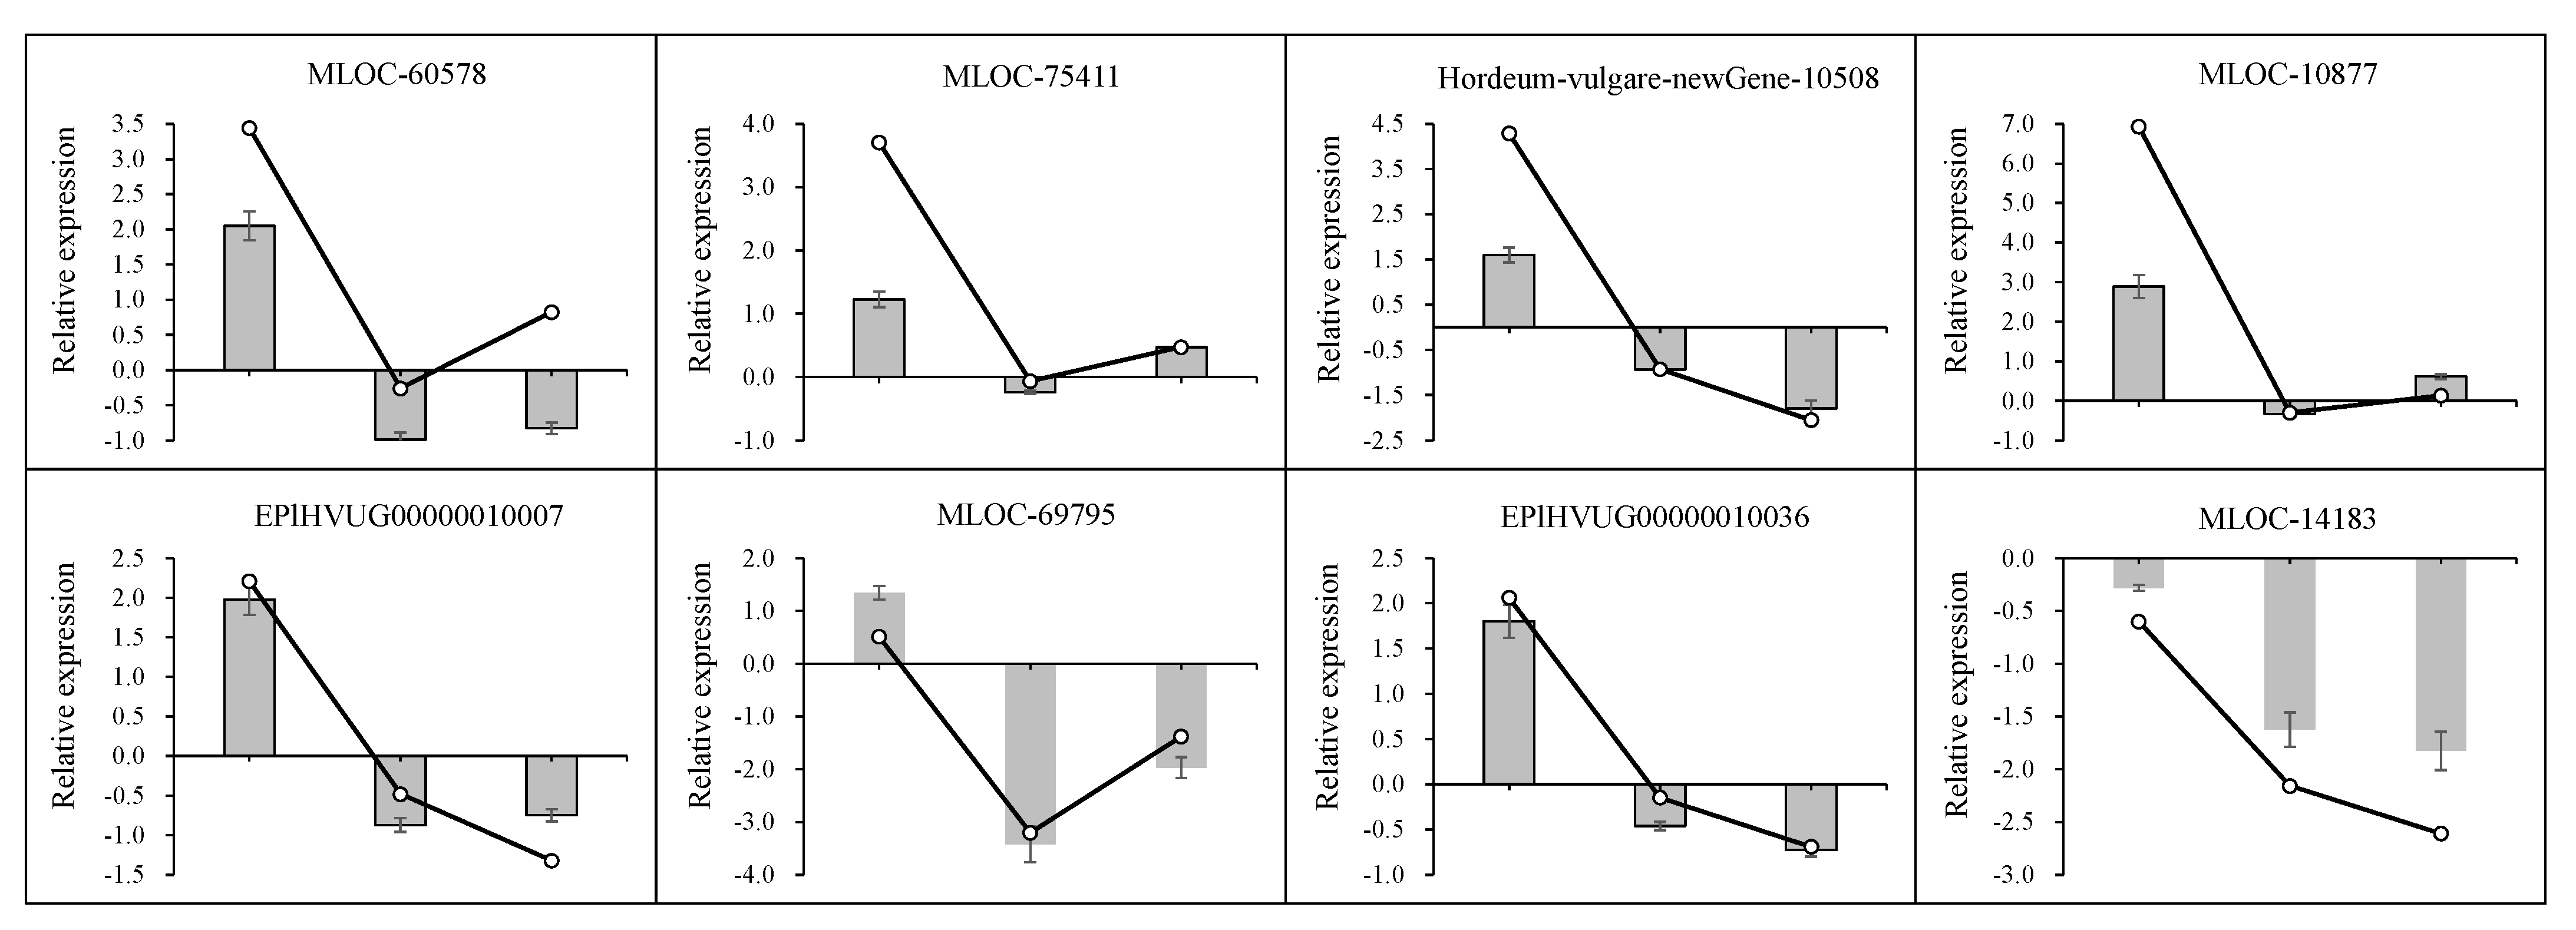
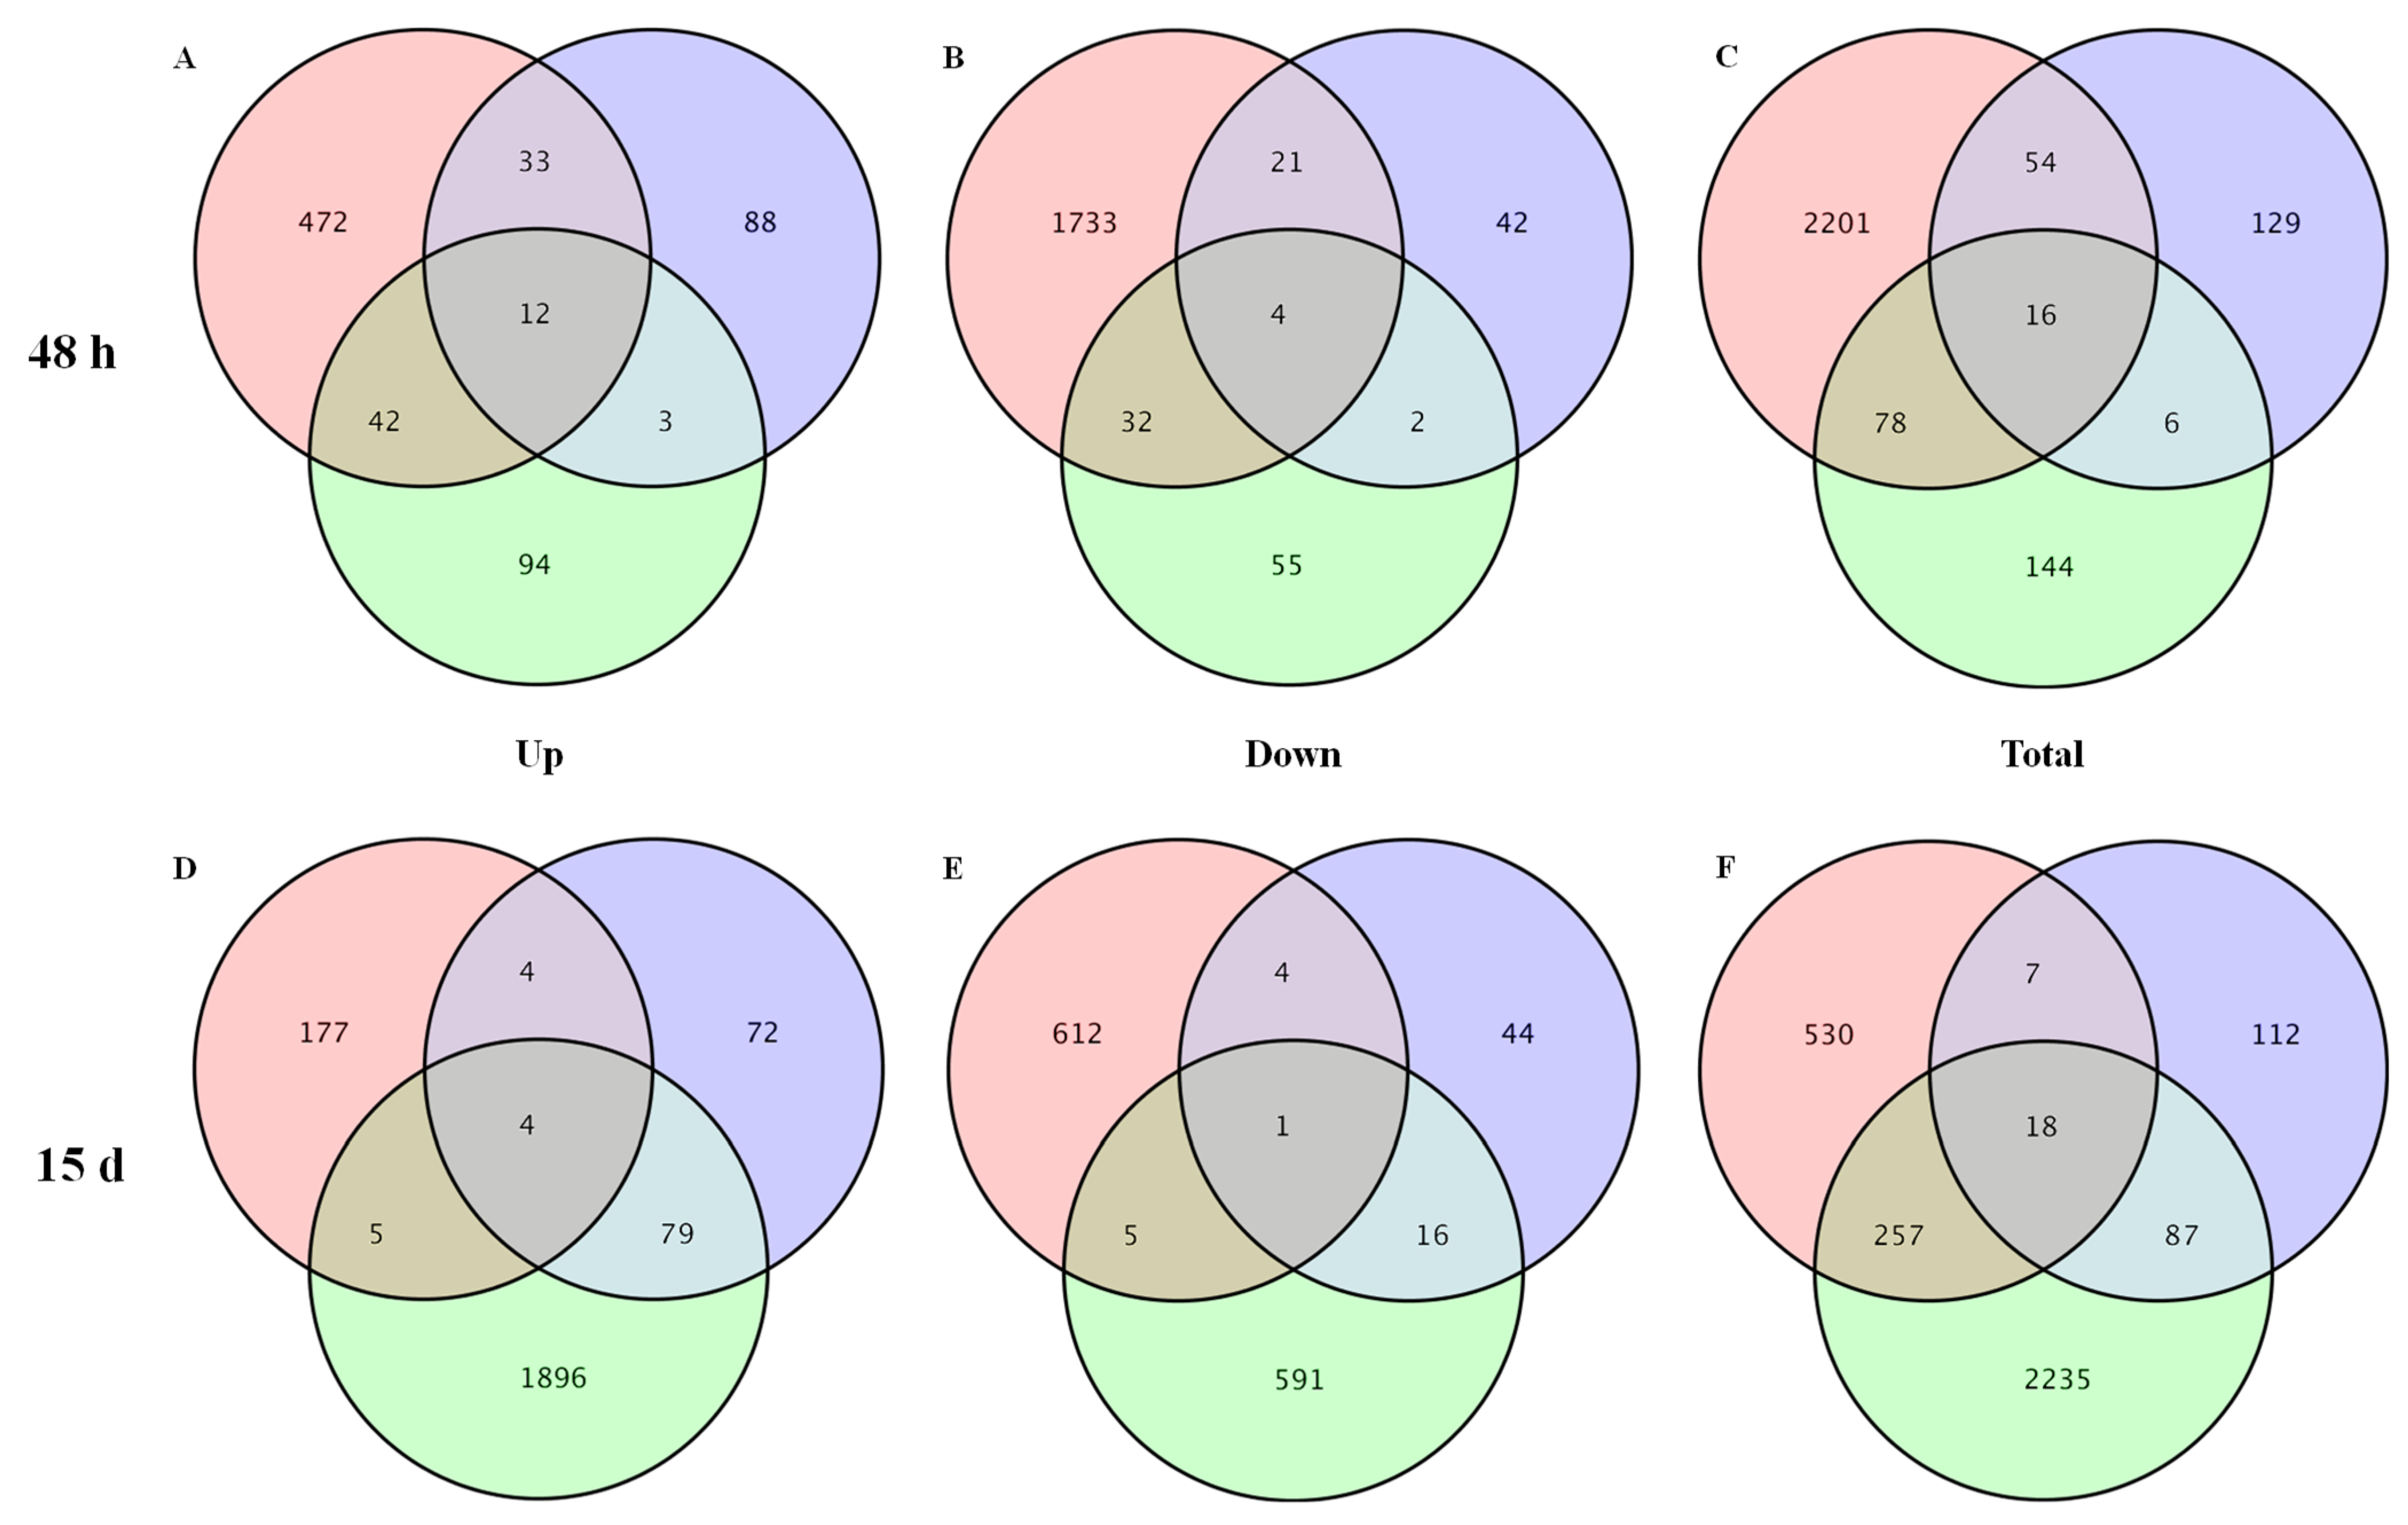
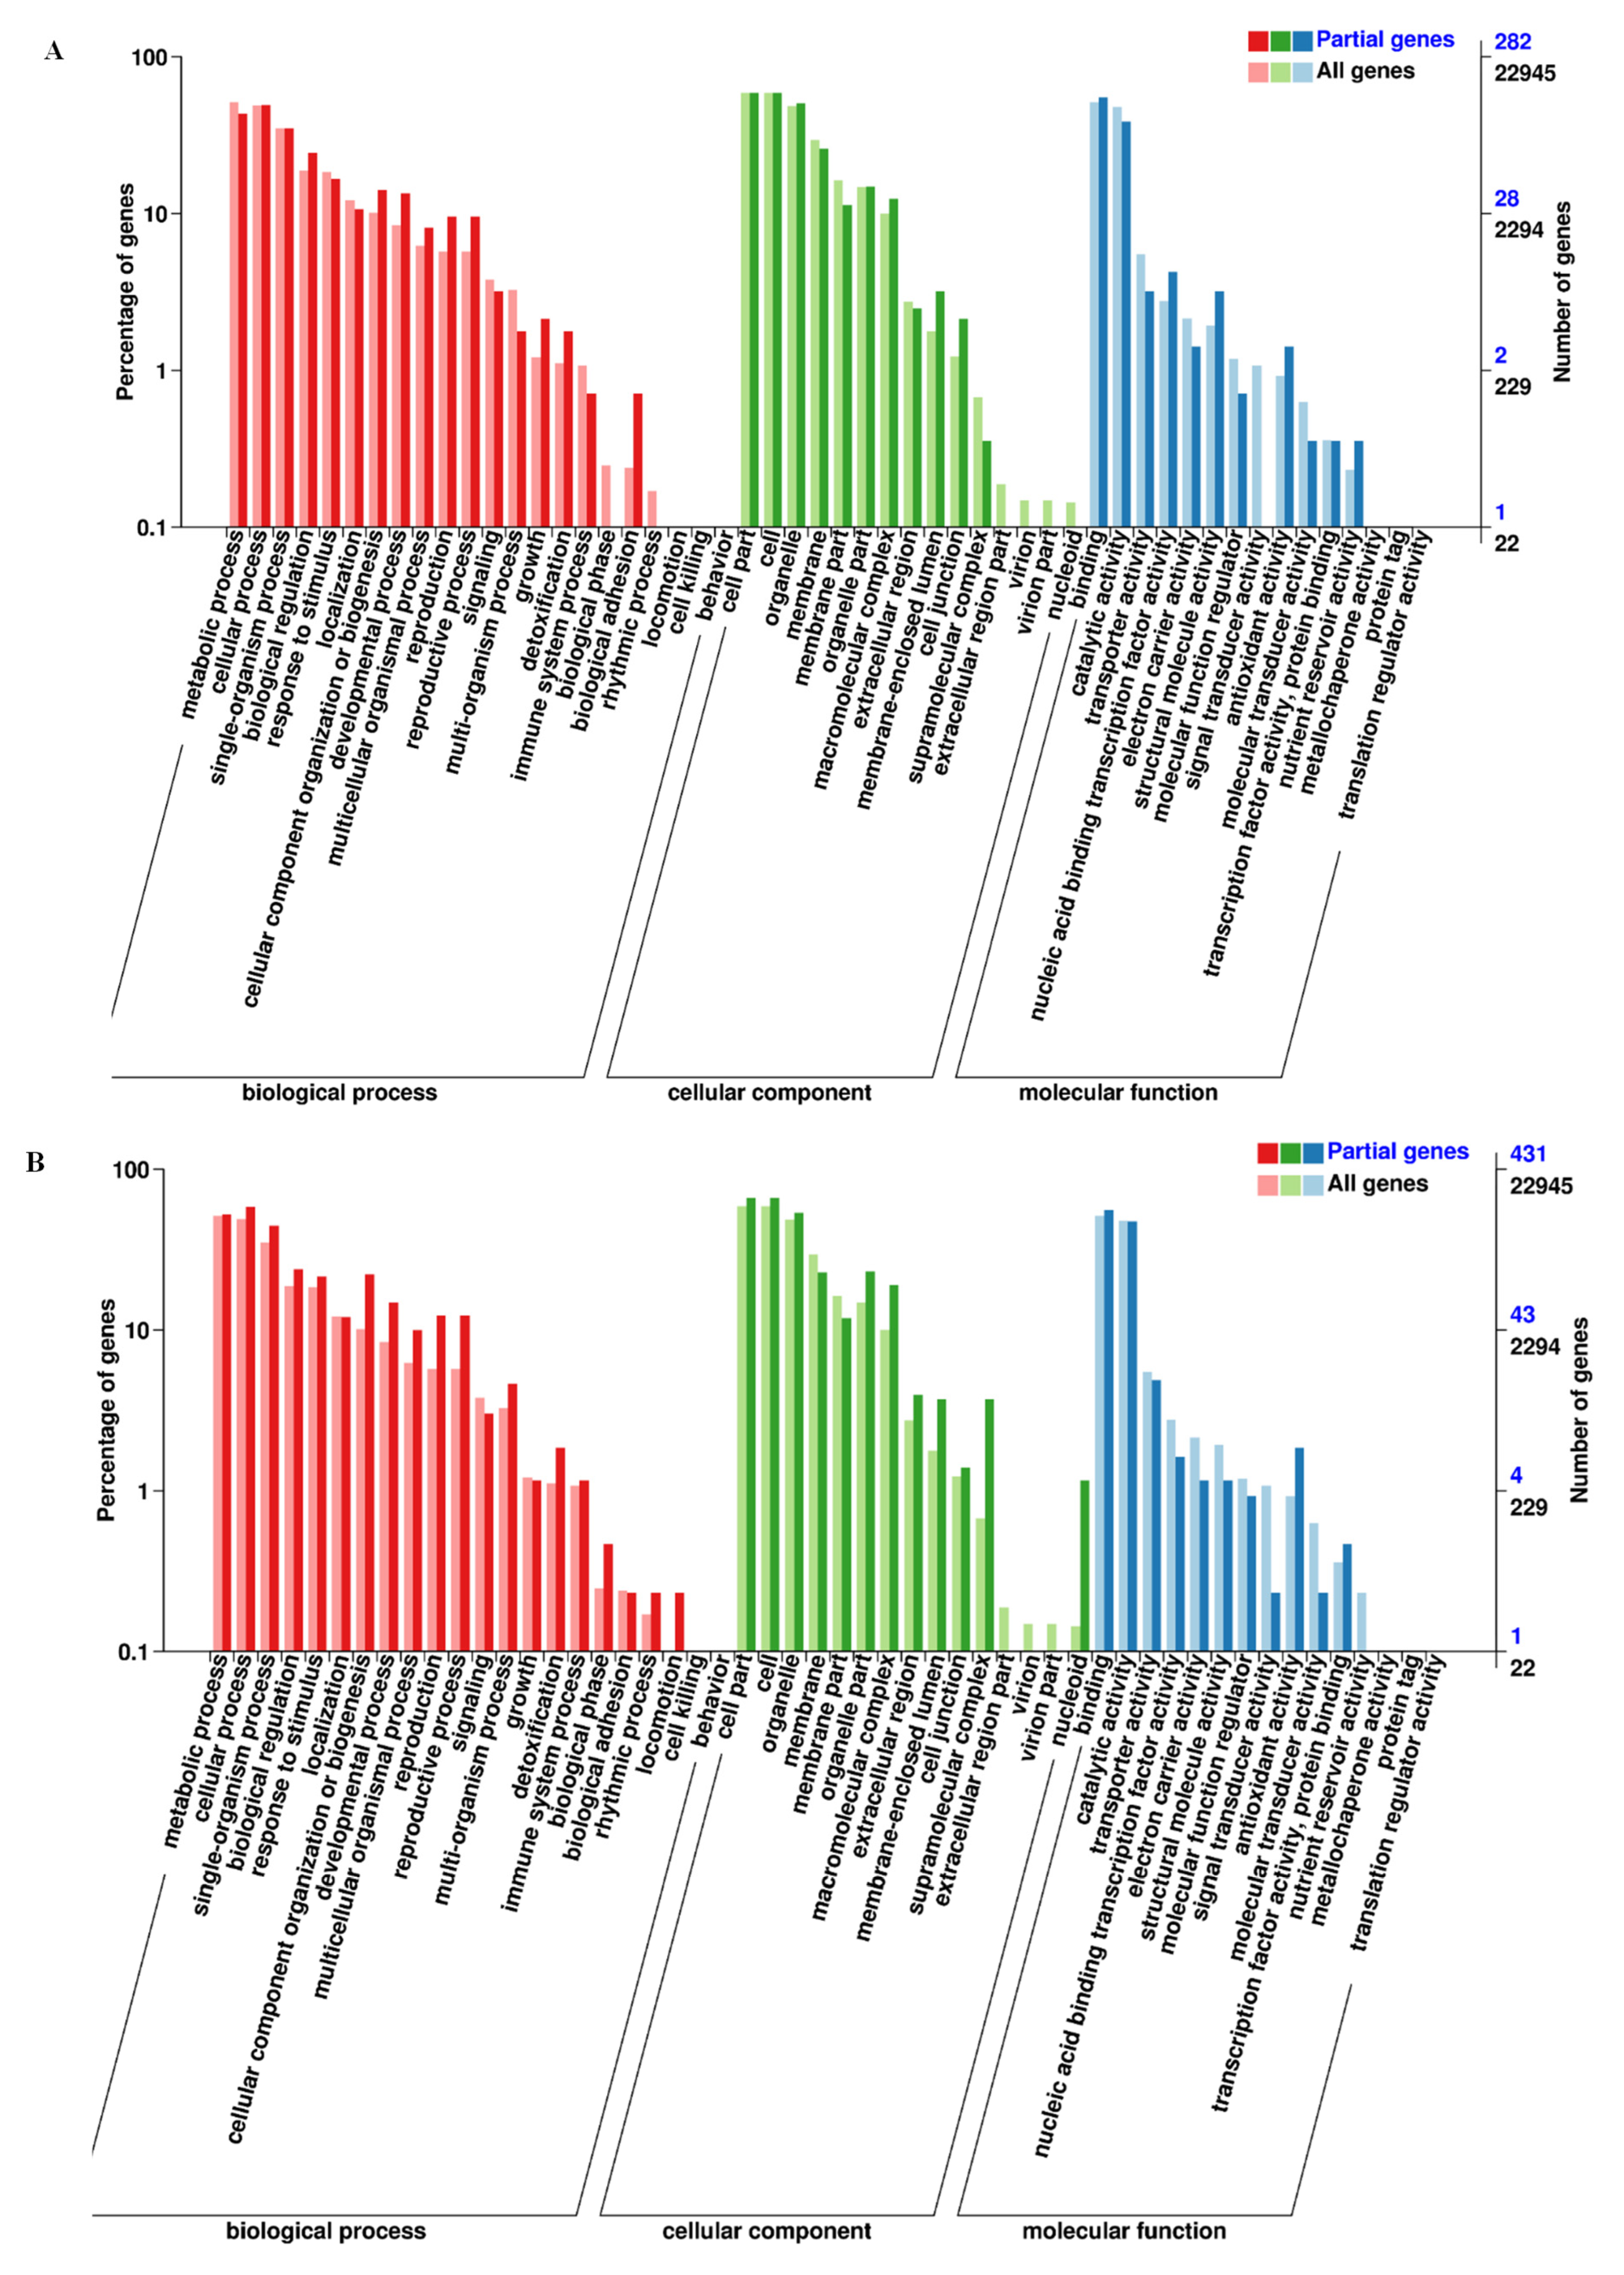
3.2. DEGs Identification, GO Function, and KEGG Analysis

A total of 4832 genes had differential expression at 48 h and 15 d after LK stress in three genotypes (Tables S3 and S4, Figure 2). In detail, 2628 and 3246 DEGs were identified at 48 h and 15 d, respectively. XZ153 had more DEGs at 48 h than 15 d, but it was the opposite in ZD9 (Figure 2). Nearly the same amount of DEGs was identified at two time points in XZ141 (Figure 2). Thus, the gene expression pattern of XZ153 differed from the other two genotypes (XZ141 and ZD9), and it is necessary to conduct a further analysis among these three genotypes in response to LK stress.
Then, we focused on these DEGs, which were up-regulated (unchanged) in XZ153, but down-regulated/unchanged (down-regulated) in XZ141 and ZD9. Consequently, 555 and 814 DEGs met the screening criteria for further study at 48 h and 15 d after LK stress, respectively (Tables S5 and S6).
Through GO annotation analysis, these DEGs were divided into 39 and 43 groups at two time points, which were attached to three main classifications: cellular component (43.6% at 48 h and 46.5% at 15 d), molecular function (28.2% at 48 h and 27.9% at 15 d), and biological process (28.2% at 48 h and 25.6% at 15 d) (Figure 3, Tables S7 and S8). For KEGG pathway analysis, 101 and 221 enzymes were matched to 53 and 57 KEGG pathways at 48 h and 15 d after LK stress, respectively, including DNA replication, ribosome, RNA transport, ribosome biogenesis in eukaryotes, purine metabolism, mismatch repair, ubiquitin-mediated proteolysis, plant hormone signal transduction, nucleotide excision repair, homologous recombination, and so on (Figure 4, Tables S9 and S10).

3.3. DEGs Associated with Transcription Factors (TFs), Transporters, and Kinases

In the current study, 42 DEGs involved in TFs were confirmed, including 32 and 14 DEGs at 48 h and 15 d, respectively. Moreover, they could be classified into Zinc finger (9), MYB (9), AP2/EREBP (9), bHLH (8), WRKY (2), HMG (2), MADS-box (1), Homeodomain (1), and HSF (1) (Table S11). Additionally, 33 DEGs related to protein transporters and kinases were identified, including 15 and 22 DEGs at 48 h and 15 d, respectively (Table S12). Moreover, they could be classified into LRR (26), CRK (2), Yellow-strike (2), MATE (1), ammonium (1), and nitrate (1), with LRR being the largest class, which occupied 78.8% of the total DEGs (Table S12).

3.4. DEGs Involved in K Transposition and Ca2+ Signaling Pathway

Here, we paid attention to these DEGs participating in K transposition in response to LK stress and identified two important K channels (Table 1). These two channels belong to shaker-type channels, one being the outward-rectifying K channel GORK, controlling K release from the guard cell, and the other being the inward-rectifying K channel KAT. Meanwhile, three Ca2+ sensors involved in the Ca2+ signaling pathway were found (Table 1), including two calmodulin-like proteins (CML1 and CML29) and one calcium-dependent protein kinase (CDPK1). More importantly, their expression differed greatly among the three genotypes, with XZ153 having higher expression level (Table 1).

3.5. DEGs Involved in the Ethylene Biosynthesis Process

In addition to the K transport system and Ca2+ signaling pathway, the DEGs participating in the SAM cycle of the ethylene biosynthesis process were also identified after LK stress. Four DEGs encoded three enzymes: S-adenosylmethionine decarboxylase, 1-aminocyclopropane-1-carboxylate oxidase, and DNA (cytosine-5)-methyltransferase (Table 2, Figure 5). Moreover, four AP2-like ethylene-responsive transcription factors were identified after LK stress, including two DEGs expressed at both time points (Table 3).

3.6. The DEGs Involved in the Four Interrelated Metabolic Pathways

In this study, we identified DEGs encoding some enzymes participating in four interrelated metabolic pathways, named the TCA cycle, pentose phosphate pathway (PPP), glycolysis, and gluconeogenesis (Table 4). In detail, ATP-citrate synthase (CS), dihydrolipoyl dehydrogenase 1(DLD), and pyruvate decarboxylase 2 (PDC) were involved in the TCA cycle; phosphogluconate dehydrogenase (PGDH) participated in the PPP; pyruvate kinase (PK), phosphoglycerate kinase (PGK), and phosphoenolpyruvate carboxylase kinase (PPCK) participated in the glycolysis pathway; and 6-phosphofructokinase was associated with the gluconeogenesis pathway (Table 4, Figure 6).

3.7. DEGs Associated with Photosynthesis

Except for the above DEGs, the DEGs involved in photosynthesis were also identified at 48 h and 15d after LK stress (Table 5, Figure 7), including ATP synthase, photosystem II reaction center protein, light-harvesting complex II chlorophyll a/b binding protein, NAD(P)H dehydrogenase (quinone) FQR1-like, and NADH-plastoquinone oxidoreductase (Table 5). Moreover, three photosystem II reaction center proteins, i.e., Psb K, Psb I, and Psb Z, were detected at 15 d, and highly expressed in XZ153. LHC II chlorophyll a/b binding protein also showed the highest expression in XZ153 at 48 h after LK stress (Table 5).

4. Discussion

4.1. K Channels and Ca2+ Signaling Pathway Contribute to LK Stress Response in XZ153

Previous research had found many K transporters and channels in plants participated in K uptake and mobilization [27]. Most of them could be induced or up-regulated by LK stress [28]. In the current study, two kinds of shaker-type channels, GORK and KAT, were up-regulated after LK stress only in XZ153 (Table 1). Moreover, functional analysis showed that KAT1, KAT2, and GORK were basically expressed in the guard cells, and synergistically mediated the inward or outward potassium ion flow [29,30,31,32]. This result was consistent with our recent finding that GORK was up-regulated in the XZ153′ leaves under LK stress [11]. Moreover, Ca2+ is an important second messenger responding to various biotic and abiotic stresses in plants, including nutrient deficiency [33,34,35]. Calcium signals are sensed, decoded, and conducted by calcium sensors. Additionally, Ca2+ sensors mainly include CBLs, CDPKs, CaMs, and CML [36,37]. In this study, two CML (CML1 and CML29) and one CDPK (CDPK1) were identified, being only up-regulated in XZ153 after LK treatment (Table 1). In short, the tolerant genotype XZ153 could better respond to LK stress than XZ141 and ZD9 by K channels and calcium signaling pathways.

4.2. Ethylene Biosynthesis Process May Benefit to LK Stress Response

Ethylene is the first plant hormone in response to K deficiency [38,39]. In this study, 1-aminocyclopropane-1-carboxylate synthase oxidase (ACO), S-adenosylmethionine decarboxylase, and DNA (cytosine-5)-methyltransferase encoded by four DEGs involved in ethylene biosynthesis process were identified (Table 2, Figure 5). Additionally, 90% of SAM is used for transmethylation [40]. Interestingly, the expression of two MTs [DNA (cytosine-5)-methyltransferase] was down-regulated in XZ141 and ZD9, but unchanged in XZ153 (Table 2). Additionally, the AP2 transcription factor was a factor responding to LK stress [41]. Coincidently, many AP2-like ethylene-responsive transcription factors were up-regulated/unchanged in XZ153, while down-regulated in the other two barley genotypes in this study (Table 3). The expression was consistent with previous studies in the roots and leaves of barley after LK stress [11,12]. Therefore, the DEGs identified in this study contribute to the high LK tolerance in XZ153, and importantly complemented the ethylene biosynthesis pathway response to LK stress in barley constructed by predecessors [11,12,42,43].

4.3. The TCA Cycle, Glycolysis, and PPP Are Closely Related to LK Tolerant Stress

The TCA cycle is a vital pathway of respiration in plants [44]. Here, we identified three kinds of DEGs involved in the TCA cycle: dihydrolipoyl dehydrogenase (DLD), citrate synthase (CS), and pyruvate decarboxylase (Table 4). In plants, dihydrolipoyl dehydrogenase (DLD) is an important component of multi-enzyme complexes of pyruvate dehydrogenase complex [45]. DLD catalyzes the irreversible reaction of pyruvate to acetyl CoA. In this study, dihydrolipoyl dehydrogenase 1 was highly up-regulated only in XZ153 (Table 4). Interestingly, a previous study found that over-expression of DLD improved photosynthesis, and as a result, biomass was increased [46]. Thus, the activity of DLD in TCA cycle may have a great influence on plant photosynthesis. Additionally, citrate synthase (CS) is a pivotal and rate-limiting enzyme catalyzing oxaloacetate and acetyl-CoA to produce citrate [47,48,49]. Here, CS was up-regulated in XZ153 under LK stress (Table 4). Furthermore, a study found some miRNAs and their targets could mutually corroborate other enzymes in TCA cycle after LK stress in barley [42], and the DEGs identified in this study just encoded some of these enzymes. Therefore, it may be assumed that DLD and CS activity in the TCA cycle has a positive effect on the plants when exposed to LK stress.
Glycolysis is a process of glucose breaking down to form pyruvate [50]. Additionally, three enzymes, pyruvate kinase (PK), phosphofructokinase (PFK), and phosphoglycerate kinase (PGK) were identified after LK stress (Table 4, Figure 6). PK irreversibly catalyzes PEP into pyruvate in glycolysis and is a key rate-limiting enzyme [51]. The effect of PK also was proved in one research on miRNAs responding to LK stress [42]. Additionally, PFK and PGK catalyze a reversible reaction in glycolysis. Thus, these enzymes can regulate the glycolysis pathway [52,53]. The expression level of these three enzymes was higher in XZ153 than XZ141 and ZD9 (Table 4). Furthermore, phosphoenolpyruvate carboxylase kinase (PPCK) is an enzyme in the pyruvate carboxylation branch (gluconeogenesis), together with pyruvate carboxylase (PC), catalyzes pyruvate from oxaloacetate to phosphoenolpyruvate bypassing the “energy barrier” [54]. Coincidently, the expression patter of PPCK1 was similar with that of the above three enzymes (Table 4). All these reactions resulted in the pyruvate accumulation in XZ153. Therefore, the high expression of these enzymes in glycolysis may be a vital factor for XZ153 in response to LK stress.
The expression of 6-phosphogluconate dehydrogenase (6PGDH) was higher in XZ153 but unchanged in XZ141 and ZD9 after LK stress in this study (Table 4). Additionally, 6PGDH is a rate-limiting enzyme at the oxidation stage in PPP [55]. Interestingly, a study of miRNAs found that bdi-miR164c negatively regulated 6PGDH in PPP after LK stress [42], and this finding was confirmed by the current study. Therefor we speculated that XZ153 could maintain relatively normal condition in the pentose phosphate pathway under LK stress.
On the whole, a brief schematic diagram characterizing each pathway and relevant enzymes can be developed (Figure 6). In short, these results complemented the previous study on miRNAs responding to LK stress [42], and three pathways might account for LK stress tolerance in XZ153.

4.4. The DEGs Involved in Photosynthesis Contribute to LK Tolerance

Photosynthesis is important for plant growth and biomass formation [56,57]. Here, the DEGs associated with ATP synthases, photosystem II reaction center proteins, NADH-plastoquinone oxidoreductase, NAD(P)H dehydrogenase (quinone), and light-harvesting complex II chlorophyll a/b binding protein were identified after LK stress (Table 5, Figure 7). Additionally, the expression of these protein was mostly up-regulated in XZ153 (Table 5). Previous studies showed LK-tolerant crops could keep relatively normal chlorophyll content and photosynthetic rate when suffered from potassium deficiency [9,58]. Furthermore, four miRNAs, negatively regulating three proteins (OEEP1, PSII Q(B) protein, and PSI RC), were involved in photosynthesis and improved the photosynthesis of XZ153 after LK stress [42]. Therefore, better performance in photosynthesis may be attributed to LK tolerance in XZ153.

5. Conclusions

In this study, the transcriptome profiling of XZ153, XZ141, and ZD9 differing in LK tolerance were investigated under LK stress. According to the results, XZ153 had stronger LK tolerance, which could be attributed to many factors, mainly including K channels, Ca2+ signaling pathway, ethylene biosynthesis process, TCA cycle, glycolysis, PPP, and photosynthesis. A brief diagram was developed to explain the LK-tolerant mechanism in XZ153 (Figure 8). The research was an integrated study on LK responses at the whole transcriptome level in the leaves of wild and cultivated barleys, and further supplemented the previous studies on LK response in barley. Based on the results, we constructed and improved the possible regulatory networks of LK response in barley. Furthermore, some candidate genes identified in this study may be used for the genetic improvement of LK tolerance in barley, but further study is needed. Therefore, based on the obtained results, we will make functional assumptions about the candidate gene. For example, when the target gene is a transporter, we will focus on its transport capacity with the help of yeast. In brief, we will next carry out the overexpression and gene editing of target genes in barley for gene function analysis, and it will eventually lay the foundation for LK tolerance breeding of barley and other crops.

Supplementary Materials

The following supporting information can be downloaded at: https://www.mdpi.com/article/10.3390/agronomy12051094/s1, Table S1: Summary of RNA-Seq and mapping results after 48 h and 15 d LK stress; Table S2: Primers were listed for real-time PCR; Table S3: The FPKM value of 4832 DEGs; Table S4: Gene accession numbers and sequences of 4832 DEGs; Table S5: The DEGs satisfying XZ153 condition at 48 h; Table S6: The DEGs satisfying XZ153 condition at 15 d; Table S7: Functional classification of LK-tolerance-related DEGs after 48 h LK stress; Table S8: Functional classification of LK-tolerance-related DEGs after 15 d LK stress; Table S9: Pathway analysis of LK-tolerance-related DEGs based on the KEGG data after 48 h of LK stress; Table S10: Pathway analysis of LK-tolerance-related DEGs based on the KEGG data after 15 d of LK stress; Table S11: Genes encoding TFs showing genotypic difference expression at 48 h and 15 d after LK stress; Table S12: Genes encoding protein transporters and kinases showing genotypic difference expression at 48 h and 15 d after LK stress.

Author Contributions

Conceptualization, Z.Y.; data curation, Z.Y.; formal analysis, C.L. and X.H.; funding acquisition, Z.Y.; investigation, Z.Y., C.L. and X.H.; methodology, Z.Y.; project administration, Z.Y. and C.L.; resources, Z.Y.; software, C.L. and X.H.; supervision, Z.Y. and X.H.; validation, Z.Y. and X.H.; visualization, Z.Y. and X.H.; writing—original draft preparation, Z.Y. and X.H.; writing—review and editing, Z.Y. All authors have read and agreed to the published version of the manuscript.

Funding

This research was funded by the Doctoral Research Start-up Project of Dali University (KY2096124140) and Basic Research Project of Yunnan Science and Technology Department-Youth Project (202201AU070003). The funding body provided the financial support in carrying out the experiments, sample and data analysis, and MS writing.

Data Availability Statement

Not applicable.

Acknowledgments

We thank Dongfa Sun (Huazhong Agricultural University, China) for providing Tibetan wild barley accessions.

Conflicts of Interest

The authors declare no conflict of interest.

References

  1. Wang, Y.; Wu, W.H. Genetic approaches for improvement of the crop potassium acquisition and utilization efficiency. Curr. Opin. Plant Biol. 2015, 25, 46–52. [Google Scholar] [CrossRef] [PubMed] [Green Version]
  2. Rengel, Z.; Damon, P.M. Crops and genotypes differ in efficiency of potassium uptake and use. Physiol. Plant 2008, 133, 624–636. [Google Scholar] [CrossRef] [PubMed]
  3. Dai, F.; Nevo, E.; Wu, D.Z.; Comadran, J.; Zhou, M.X.; Qiu, L.; Chen, Z.H.; Beiles, A.; Chen, G.X.; Zhang, G.P. Tibet is one of the centers of domestication of cultivated barley. Proc. Natl. Acad. Sci. USA 2012, 109, 16969–16973. [Google Scholar] [CrossRef] [PubMed] [Green Version]
  4. Cai, S.G.; Wu, D.Z.; Jabeen, Z.; Huang, Y.Q.; Huang, Y.C.; Zhang, G.P. Genome-wide association analysis of aluminum tolerance in cultivated and Tibetan wild barley. PLoS ONE 2013, 8, e69776. [Google Scholar] [CrossRef] [PubMed] [Green Version]
  5. He, X.Y.; Zeng, J.B.; Cao, F.B.; Ahmed, I.M.; Zhang, G.P.; Vincze, E.; Wu, F.B. HvEXPB7, a novel β-expansin gene revealed by the root hair transcriptome of Tibetan wild barley, improves root hair growth under drought stress. J. Exp. Bot. 2015, 66, 7405–7419. [Google Scholar] [CrossRef] [Green Version]
  6. Wu, D.Z.; Shen, Q.F.; Cai, S.G.; Chen, Z.H.; Dai, F.; Zhang, G.P. Ionomic responses and correlations between elements and metabolites under salt stress in wild and cultivated barley. Plant Cell Physiol. 2013, 54, 1976–1988. [Google Scholar] [CrossRef] [PubMed] [Green Version]
  7. Wu, D.Z.; Sato, K.; Ma, J.F. Genome-wide association mapping of cadmium accumulation in different organs of barley. New Phytol. 2015, 208, 817–829. [Google Scholar] [CrossRef]
  8. Zhu, B.; Zeng, J.B.; Wu, D.Z.; Cai, S.G.; Yang, L.N.; Zhang, G.P. Identification and physiological characterization of low potassium tolerant germplasm in Tibetan Plateau annual wild barley. J. Zhejiang Univ. (Agric. Life Sci.) 2014, 40, 165–174. [Google Scholar]
  9. Ye, Z.L.; Zeng, J.B.; Li, X.; Zeng, F.R.; Zhang, G.P. Physiological characterizations of three barley genotypes in response to low potassium stress. Acta Physiol. Plant. 2017, 39, 232. [Google Scholar] [CrossRef]
  10. Zeng, J.B.; Quan, X.Y.; He, X.Y.; Cai, S.G.; Ye, Z.L.; Chen, G.; Zhang, G.P. Root and leaf metabolite profiles analysis reveals the adaptive strategies to low potassium stress in barley. BMC Plant Biol. 2018, 18, 187. [Google Scholar] [CrossRef]
  11. Ye, Z.L.; Zeng, J.B.; Ma, X.Y.; Long, L.Z.; Zhang, G.P. Transcriptome profilling analysis reveals involvement of SAM cycle and methionine pathway in low potassium tolerance in barley. Curr. Plant Biol. 2021, 25, 100190. [Google Scholar] [CrossRef]
  12. Zeng, J.B.; He, X.Y.; Wu, D.Z.; Zhu, B.; Cai, S.G.; Nadira, U.A.; Jabeen, Z.; Zhang, G.P. Comparative transcriptome profiling of two Tibetan wild barley genotypes in responses to low potassium. PLoS ONE 2014, 9, e100567. [Google Scholar] [CrossRef] [Green Version]
  13. Marioni, J.C.; Mason, C.E.; Mane, S.M.; Stephens, M.; Gilad, Y. RNA-Seq: An assessment of technical reproducibility and comparison with gene expression arrays. Genome Res. 2008, 18, 1509–1517. [Google Scholar] [CrossRef] [PubMed] [Green Version]
  14. Wang, Z.; Gerstein, M.; Snyder, M. RNA-Seq: A revolutionary tool for transcriptomics. Nat. Rev. Genet. 2009, 10, 57–63. [Google Scholar] [CrossRef] [PubMed]
  15. Postnikova, O.A.; Shao, J.; Nemchinov, L.G. Analysis of the Alfalfa root transcriptome in response to salinity stress. Plant Cell Physiol. 2013, 54, 1041–1055. [Google Scholar] [CrossRef]
  16. Hübner, S.; Korol, A.B.; Schmid, K.J. RNA-Seq analysis identifies genes associated with differential reproductive success under drought-stress in accessions of wild barley Hordeum spontaneum. BMC Plant Biol. 2015, 15, 134. [Google Scholar] [CrossRef] [Green Version]
  17. Gleason, L.U.; Burton, R.S. RNA-seq reveals regional differences in transcriptome response to heat stress in the marine snail Chlorostoma funebralis. Mol. Ecol. 2015, 24, 610–627. [Google Scholar] [CrossRef]
  18. Wu, L.Y.; Yu, J.H.; Shen, Q.F.; Huang, L.; Wu, D.Z.; Zhang, G.P. Identification of microRNAs in response to aluminum stress in the roots of Tibetan wild barley and cultivated barley. BMC Genom. 2018, 19, 560. [Google Scholar] [CrossRef] [Green Version]
  19. Gupta, S.; Yadav, B.S.; Raj, U.; Freilich, S.; Varadwaj, P.K. Transcriptomic analysis of soil Grown T. aestivum cv. root to reveal the changes in expression of genes in response to multiple nutrients deficiency. Front. Plant Sci. 2017, 8, 1025. [Google Scholar] [CrossRef] [Green Version]
  20. Zhao, W.C.; Yang, X.Y.; Yu, H.J.; Jiang, W.J.; Sun, N.; Liu, X.R.; Liu, X.L.; Zhang, X.M.; Wang, Y.; Gu, X.F. RNA-Seq-based transcriptome profiling of early nitrogen deficiency response in cucumber seedlings provides new insight into the putative nitrogen regulatory network. Plant Cell Physiol. 2015, 56, 455–467. [Google Scholar] [CrossRef] [Green Version]
  21. Long, L.Z.; Ma, X.Y.; Ye, L.Z.; Zeng, J.B.; Chen, G.; Zhang, G.P. Root plasticity and Pi recycling within plants contribute to low-P tolerance in Tibetan wild barley. BMC Plant Biol. 2019, 19, 341. [Google Scholar] [CrossRef] [PubMed] [Green Version]
  22. Mascher, M.; Gundlach, H.; Himmelbach, A.; Beier, S.; Twardziok, S.O.; Wicker, T.; Radchuk, V.; Dockter, C.; Hedley, P.E.; Russell, J.; et al. A chromosome conformation capture ordered sequence of the barley genome. Nature 2017, 544, 427–433. [Google Scholar] [CrossRef] [PubMed] [Green Version]
  23. Mortazavi, A.; Williams, B.A.; Mccue, K.; Schaeffer, L.; Wold, B. Mapping and quantifying mammalian transcriptomes by RNA-Seq. Nat. Methods 2008, 5, 621–628. [Google Scholar] [CrossRef] [PubMed]
  24. O’Rourke, J.A.; Yang, S.S.; Miller, S.S.; Bucciarelli, B.; Liu, J.Q.; Rydeen, A.; Bozsoki, Z.; Uhde-Stone, C.; Tu, Z.J.; Allan, D.; et al. An RNASeq transcriptome analysis of orthophosphate-deficient white lupin reveals novel insights into phosphorus acclimation in plants. Plant Physiol. 2013, 161, 705–724. [Google Scholar] [CrossRef] [Green Version]
  25. Young, M.D.; Wakefield, M.J.; Smyth, G.K.; Oshlack, A. Gene ontology analysis for RNA-seq: Accounting for selection bias. Genome Biol. 2010, 11, R14. [Google Scholar] [CrossRef] [Green Version]
  26. Mao, X.Z.; Cai, T.; Olyarchuk, J.G.; Wei, L.P. Automated genome annotation and pathway identification using the KEGG Orthology (KO) as a controlled vocabulary. Bioinformatics 2005, 21, 3787–3793. [Google Scholar] [CrossRef]
  27. Wang, Y.; Wu, W.H. Potassium transport and signaling in higher plants. Annu. Rev. Plant Biol. 2013, 64, 451–476. [Google Scholar] [CrossRef] [Green Version]
  28. Hong, J.P.; Takeshi, Y.; Kondou, Y.; Schachtman, D.P.; Matsui, M.; Shin, R. Identification and characterization of transcription factors regulating Arabidopsis HAK5. Plant Cell Physiol. 2013, 54, 1478–1490. [Google Scholar] [CrossRef] [Green Version]
  29. Kwak, J.M.; Murata, Y.; Baizabal-Aguirre, V.M.; Merrill, J.; Wang, M.; Kemper, A.; Hawke, S.D.; Tallman, G.; Schroeder, J.I. Dominant negative guard cell K+ channel mutants reduce inward-rectifying K+ currents and light-induced stomatal opening in Arabidopsis. Plant Physiol. 2001, 27, 473–485. [Google Scholar] [CrossRef]
  30. Szyroki, A.; Ivashikina, N.; Dietrich, P.; Roelfsema, M.R.G.; Ache, P.; Reintanz, B.; Deeken, R.; Godde, M.; Felle, H.; Steinmeyer, R.; et al. KAT1 is not essential for stomatal opening. Proc. Natl. Acad. Sci. USA 2001, 98, 2917–2921. [Google Scholar] [CrossRef] [Green Version]
  31. Ache, P.; Becker, D.; Ivashikina, N.; Dietrich, P.; Roelfsema, M.R.G.; Hedrich, R. GORK, a delayed outward rectifier expressed in guard cells of Arabidopsis thaliana, is a K+-selective, K+-sensing ion channel. FEBS Lett. 2000, 486, 93–98. [Google Scholar] [CrossRef] [Green Version]
  32. Hosy, E.; Vavasseur, A.; Mouline, K.; Dreyer, I.; Gaymard, F.; Poree, F.; Boucherez, J.; Lebaudy, A.; Bouchez, D.; Very, A.A.; et al. The Arabidopsis outward K+ channel GORK is involved in regulation of stomatal movements and plant transpiration. Proc. Natl. Acad. Sci. USA 2003, 100, 5549–5554. [Google Scholar] [CrossRef] [PubMed] [Green Version]
  33. Berridge, M.J.; Lipp, P.; Bootman, M.D. The versatility and universality of calcium signaling. Nat. Rev. Mol. Cell Biol. 2000, 1, 11–21. [Google Scholar] [CrossRef] [PubMed]
  34. Bowler, C.; Fluhr, R. The role of calcium and activated oxygens as signals for controlling cross-tolerance. Trends Plant Sci. 2000, 5, 241–246. [Google Scholar] [CrossRef]
  35. Valentina, L.V.; Paola, D.; Alessandra, A. Towards understanding plant calcium signaling through calmodulin-like proteins: A biochemical and structural perspective. Int. J. Mol. Sci. 2018, 19, 1331. [Google Scholar]
  36. Cheong, Y.H.; Pandey, G.K.; Grant, J.J.; Batistic, O.; Li, L.; Kim, B.G.; Lee, S.C.; Kudla, J.; Luan, S. Two calcineurin B-like calcium sensors, interacting with protein kinase CIPK23, regulate leaf transpiration and root potassium uptake in Arabidopsis. Plant J. 2007, 52, 223–239. [Google Scholar] [CrossRef]
  37. Zhu, X.; Dunand, C.; Snedden, W.; Galaud, J.P. CaM and CML emergence in the green lineage. Trends Plant Sci. 2015, 20, 483–489. [Google Scholar] [CrossRef]
  38. Merchante, C.; Alonso, J.M.; Stepanova, A.N. Ethylene signaling: Simple ligand, complex regulation. Curr. Opin. Plant Biol. 2013, 16, 554–560. [Google Scholar] [CrossRef]
  39. Shin, R.; Schachtman, D.P. Hydrogen peroxide mediates plant root cell response to nutrient deprivation. Proc. Natl. Acad. Sci. USA 2004, 101, 8827–8832. [Google Scholar] [CrossRef] [Green Version]
  40. Giovanelli, J.; Mudd, S.H.; Datko, A.H. Quantitative analysis of pathways of methionine metabolism and their regulation in Lemna. Plant Physiol. 1985, 78, 555–560. [Google Scholar] [CrossRef] [Green Version]
  41. Kim, M.J.; Ruzicka, D.; Shin, R.; Schachtman, D.P. The Arabidopsis AP2/ERF transcription factor RAP2.11 modulates plant response to low-potassium conditions. Mol. Plant 2012, 5, 1042–1057. [Google Scholar] [CrossRef] [PubMed] [Green Version]
  42. Ye, Z.L.; Zeng, J.B.; Long, L.Z.; Ye, L.Z.; Zhang, G.P. Identification of microRNAs in response to low potassium stress in the shoots of Tibetan wild barley and cultivated barley. Curr. Plant Biol. 2020, 25, 100193. [Google Scholar] [CrossRef]
  43. Ye, Z.L.; Zeng, J.B.; Ye, L.Z.; Long, L.Z.; Zhang, G.P. Genome-wide association analysis of potassium uptake and translocation rates under low K stress in Tibetan wild barley. Euphytica 2020, 216, 35. [Google Scholar] [CrossRef]
  44. Schnarrenberger, C.; Martin, W. Evolution of the enzymes of the citric acid cycle and the glyoxylate cycle of higher plants. Eur. J. Biochem. 2002, 269, 868–883. [Google Scholar] [CrossRef] [Green Version]
  45. Millar, A.H.; Knorpp, C.; Leaver, C.J.; Hill, S.A. Plant mitochondrial pyruvate dehydrogenase complex: Purification and identification of catalytic components in potato. Biochem. J. 1998, 334, 571–576. [Google Scholar] [CrossRef] [Green Version]
  46. Timm, S.; Wittmiss, M.; Gamlien, S.; Ewald, R.; Florian, A.; Frank, M.; Wirtz, M.; Hell, R.; Fernie, A.R.; Bauwea, H. Mitochondrial Dihydrolipoyl Dehydrogenase Activity Shapes Photosynthesis and Photorespiration of Arabidopsis thaliana. Plant Cell 2015, 27, 1968–1984. [Google Scholar] [CrossRef] [Green Version]
  47. Kang, W.; Harada, Y.; Yamatoya, K.; Kawano, N.; Kanai, S.; Miyamoto, Y.; Nakamura, A.; Miyado, M.; Hayashi, Y.; Kuroki, Y.; et al. Correction, Extra-mitochondrial citrate synthase initiates calcium oscillation and suppresses age-dependent sperm dysfunction. Lab. Investig. 2020, 100, 665. [Google Scholar] [CrossRef] [Green Version]
  48. Ren, M.M.; Yang, X.; Bie, J.T.; Wang, Z.; Liu, M.M.; Li, Y.T.; Shao, G.Z.; Luo, J.Y. Citrate synthase desuccinylation by SIRT5 promotes colon cancer cell proliferation and migration. Biol. Chem. 2020, 401, 1031–1039. [Google Scholar] [CrossRef]
  49. Anoop, V.M.; Basu, U.; McCammon, M.T.; McAlister-Henn, L.; Taylor, G.J. Modulation of citrate metabolism alters aluminum tolerance in yeast and transgenic canola overexpressing a mitochondrial citrate synthase. Plant Physiol. 2003, 132, 2205–2217. [Google Scholar] [CrossRef] [Green Version]
  50. Fernie, A.R.; Carrari, F.; Sweetlove, L.J. Respiratory metabolism: Glycolysis, the TCA cycle and mitochondrial electron transport. Curr. Opin. Plant Biol. 2004, 7, 254–261. [Google Scholar] [CrossRef]
  51. Guan, C.F.; Wang, M.K.; Zhang, Y.F.; Ruan, X.F.; Zhang, Q.L.; Luo, Z.R.; Yang, Y. DkWRKY interacts with pyruvate kinase gene DkPK1 and promotes natural deastringency in C-PCNA persimmon. Plant Sci. 2020, 290, 110285. [Google Scholar] [CrossRef] [PubMed]
  52. Schaeffer, C.; Johann, P.; Nehls, U.; Hampp, R. Evidence for an up-regulation of the host and a down-regulation of the fungal phosphofructokinase activity in ectomycorrhizas of Norway spruce and fly agaric. New Phytol. 1996, 134, 697–702. [Google Scholar] [CrossRef] [PubMed]
  53. Mustroph, A.; Stock, J.; Hess, N.; Aldous, S.; Dreilich, A.; Grimm, B. Characterization of the phosphofructokinase gene family in rice and its expression under oxygen deficiency stress. Front. Plant Sci. 2013, 4, 125. [Google Scholar] [CrossRef] [PubMed] [Green Version]
  54. Hartwell, J.; Gill, A.; Nimmo, G.A.; Wilkins, M.B.; Jenkins, G.L.; Nimmo, H.G. Phosphoenolpyruvate carboxylase kinase is a novel protein kinase regulated at the level of expression. Plant J. 1999, 20, 333–342. [Google Scholar] [CrossRef] [PubMed]
  55. Xiong, Y.Q.; DeFraia, C.; Williams, D.; Zhang, X.D.; Mou, Z.L. Characterization of Arabidopsis 6-phosphogluconolactonase T-DNA insertion mutants reveal an essential role for the oxidative section of the plastidic pentose phosphate pathway in plant growth and development. Plant Cell Physiol. 2009, 50, 1277–1291. [Google Scholar] [CrossRef]
  56. Lebaudy, A.; Vavasseur, A.; Hosy, E.; Hosy, E.; Dreyer, I.; Leonhardt, N.; Thibaud, J.B.; Sentenac, H. Plant adaptation to fluctuating environment and biomass production are strongly dependent on guard cell potassium channels. Proc. Natl. Acad. Sci. USA 2008, 105, 5271–5276. [Google Scholar] [CrossRef] [Green Version]
  57. Martin, W.F.; Bryant, D.A.; Beatty, J.T. A physiological perspective on the origin and evolution of photosynthesis. FEMS Microbiol. Rev. 2018, 42, 205–231. [Google Scholar] [CrossRef] [Green Version]
  58. Zhao, X.; Du, Q.; Zhao, Y.; Wang, H.; Li, Y.; Wang, X.; Yu, H. Effects of different potassium stress on leaf photosynthesis and chlorophyll fluorescence in Maize (Zea mays L.) at seedling stage. Agric. Sci. 2016, 7, 44–53. [Google Scholar]
Figure 1. The qRT-PCR validation of eight differentially expressed genes. The bars represent SD (n = 3). The columns indicate relative expression by the qRT-PCR and solid lines by the RNA-seq. From left to right: XZ153, XZ141, and ZD9.
Agronomy 12 01094 g001
Figure 2. A Venn diagram describing overlaps among differentially expressed genes (DEGs) in XZ153, XZ141, and ZD9. (A) Up-regulated genes at 48 h after low-K treatment. (B) Down-regulated genes at 48 h after low-K treatment. (C) Total-regulated genes at 48 h after low-K treatment. (D) Up-regulated genes at 15 d after low-K treatment. (E) Down-regulated genes at 15 d after low-K treatment. (F) Total-regulated genes at 15 d after low-K treatment. Pink, purple, and green represents genotype XZ153, XZ141, and ZD9, respectively.
Agronomy 12 01094 g002
Figure 3. Functional classification of LK-tolerance-related DEGs identified in three barley accessions after 48 h (A) and 15 d (B) of LK stress by Gene Ontology (GO) categorization. The bold color indicates the representation in the whole genome; the light color indicates representation in the DEGs.
Agronomy 12 01094 g003
Figure 4. Pathway analysis of LK-tolerance-related DEGs based on the KEGG data after 48 h (A) and 15 d (B) of LK stress. The X-axis indicates the pathways; the Y-axis indicates the numbers of annotated genes.
Agronomy 12 01094 g004
Figure 5. Pathways highlighting the involvement of SAM and methionine involving in ethylene biosynthesis process. SAM: S-Adenosyl-L methionine; SAMS: S-Adenosyl-L-methionine synthase; DNMT: DNA (cytosine-5-)-methyltransferase; SAM-D-MT: S-Adenosyl-L-methionine dependent methyltransferase; SAMDC: S-Adenosyl-L-methionine decarboxylase; SAH: S-Adenosyl-L-homocysteine; SAHH: S-Adenosyl-L-homocysteine hydrolase; Hcy: Homocysteine; HMT: Homocysteine S-methyltransferase; Met: methionine; MTA: S-Methyl-59-thioadenosine; MTAN: 59-Methylthioadenosine Nucleosidase; MTK: S-methyl-5-thioribose kinase; MTR: S-methyl-5-thio-D-ribose; MTR-1-P: S-methyl-5-thio-D-ribose 1-phosphate; ACC: S-Aminocyclopropane-1- carboxylate; ACS: S-Aminocyclopropane-1-carboxylate synthase; ACO: S-Aminocyclopropane-1-carboxylate oxidase. The three differentially expressed enzymes (DEGs) colored in red were detected in this study. The seven differentially expressed enzymes (DEGs) colored in purple were detected from Ye et al. (2021a). The two differentially expressed enzymes (miRNAs) colored in blue were detected from Ye et al. (2021b). The four enzymes identified by GWAS colored in green were detected from Ye et al. (2020). The three differentially expressed enzymes (DEGs) colored in brown were detected from Zeng et al. (2014).
Agronomy 12 01094 g005
Figure 6. Brief schematic summary of the connections among TCA cycle, glycolysis and pentose phosphate pathway. TCA cycle (blue), tricarboxylic acid cycle: NAD+ is converted to NADH by the 2-OGDH and MDH reactions; CS, citrate synthase; ACO, aconitase; IDH, isocitrate dehydrogenase; 2-OGDH, 2-oxoglutarate dehydrogenase complex; SCoA L, succinyl CoA ligase; SDH, succinate dehydrogenase; FUM, fumarase; MDH, malate dehydrogenase; PDC, pyruvate dehydrogenase complex; DC, dicarboxylate carrier. Glycolysis (purple): ADP is converted to ATP by the PK reaction; GK: glucokinase; PGI: phosphoglucose isomerase; PFK: phosphofructokinase-1; AD: aldolase; PK: pyruvate kinase. Pentose phosphate pathway (green): NADP+ is converted to NADPH by the 6PGDH reaction; G6PDH: glucose 6-phosphate dehydrogenase; 6PGDH, 6-phosphogluconate dehydrogenase; RPI: ribose-5-phophate isomerase; TK, transketolase; TA, transaldolase. Pyruvate carboxylation branch (brown): In gluconeogenesis, PC and PPCK catalyze the conversion of pyruvate from oxaloacetate to phosphoenolpyruvate is known as the pyruvate carboxylation branch. ATP consumption by pyruvate carboxylation pathway is the pathway through which pyruvate bypasses the “energy barrier” to produce phosphoenolpyruvate into gluconeogenesis; PC: pyruvate carboxylase; PPCK: phosphoenolpyruvate carboxylase kinase; The enzymes (DEGs) colored in red were detected in this study. The enzymes (miRNAs) colored in blue were detected from Ye et al. (2021). The black bold substances represent the same metabolites which can enter into other metabolic pathways.
Agronomy 12 01094 g006
Figure 7. The DEGs involved in photosynthesis after 48 h (A) and 15 d (B) of LK stress. The red boxes indicate the protein identified in this study.
Agronomy 12 01094 g007aAgronomy 12 01094 g007b
Figure 8. A hypothetical model of LK tolerance mechanism underlying in XZ153. Genes are shown by different colors and relative expression levels are shown by a color gradient from low (blue) to high (red). For each heatmap, from left to right: XZ153 (first column), XZ141 (second column), ZD9 (third column).
Agronomy 12 01094 g008
Table 1. The DEGs involved in K+ channels and Ca2+ signaling pathway at 48 h and 15 d after LK stress.
TimeGroupsGene Id Log2 (Fold Change) Seq Description
XZ153XZ141ZD9
48 hK channelMLOC_560431.08 up1.01 normal0.84 normalPotassium channel GORK
Ca2+ signaling pathwayMLOC_139021.09 up0.90 normal0.19 normalProbable calcium-binding protein CML29
15 dK channel MLOC_607631.47 up----−0.99 normalPotassium channel KAT3
Ca2+ signaling pathway MLOC_754522.08 up0.29 normal0.58 normalCalmodulin-like protein 1 CML1
MLOC_6391−0.21 normal−0.17 normal−1.13 downCalcium-dependent protein kinase 1 CDPK1
‘--’ and ‘normal’ presented in the table means no detection and without significant gene expression in this study, respectively.
Table 2. The DEGs involved in SAM cycle and ethylene biosynthesis process at 15 d after LK stress.
Gene Id Log2 (Fold Change) Seq Description
XZ153XZ141ZD9
MLOC_70078−1.00 normal−2.05 down−0.91 normal1-aminocyclopropane-1-carboxylate oxidase 1
MLOC_697950.51 normal−3.21 down−1.38 downS-adenosylmethionine decarboxylase beta chain
MLOC_619040.31 normal−0.87 normal−1.04 downDNA (cytosine-5)-methyltransferase 1B
MLOC_119520.09 normal−0.63 normal−1.14 downDNA (cytosine-5)-methyltransferase 3
‘normal’ presented in the table means without significant gene expression in this study.
Table 3. Summary of AP2-like ethylene-responsive transcription factors participated in ethylene biosynthesis.
TimeGene Id Log2 (Fold Change) Seq Description
XZ153XZ141ZD9
48 hNewGene_284171.61 up0.74 normal2.10 normalAP2-like ethylene-responsive transcription factor ANT
NewGene_20761.38 up0.44 normal0.95 normalAP2-like ethylene-responsive transcription factor AIL5
15 dNewGene_20760.30 normal−0.54 normal−1.02 downAP2-like ethylene-responsive transcription factor AIL5
MLOC_102210.34 normal−0.86 normal−1.82 downAP2-like ethylene-responsive transcription factor ANT
MLOC_63425−0.29 normal−0.26 normal−1.14 downAP2-like ethylene-responsive transcription factor ANT
NewGene_28417−0.37 normal−0.93 normal−1.35 downAP2-like ethylene-responsive transcription factor ANT
‘normal’ presented in the table means without significant gene expression in this study. NewGene_ presented in the table stands for Hordeum_vulgare_newGene_.
Table 4. The DEGs involved in four metabolic pathways at 48 h and 15 d after being exposed to LK stress.
TimeGroupsGene Id Log2 (Fold Change) Seq Description
XZ153XZ141ZD9
48 hTCA cyclenewGene_137961.01 up0.15 normal−0.24 normalATP-citrate synthase
MLOC_108776.93 up−0.30 normal0.13 normalDihydrolipoyl dehydrogenase 1
MLOC_7202---------infdownPyruvate decarboxylase 2 PDC2
The PPP newGene_208921.20 up0.17 normal0.44 normalPhosphogluconate dehydrogenase
15 dGlycolysisnewGene_11921.31 normal−0.21 normal−3.64 downPyruvate kinase isozyme A
newGene_97440.52 normal−0.35 normal−1.10 downPhosphoglycerate kinase
MLOC_656760.23 normal−0.09 normal−1.29 down6-phosphofructokinase complex
GluconeogenesisMLOC_13152−0.41 normal−0.95 normal−1.07 downPhosphoenolpyruvate carboxylase kinase 1 PPCK1
‘--’ and ‘normal’ presented in the table means no detection and without significant gene expression in this study, respectively. Additionally, ‘NewGene_’ presented in the table stands for ‘Hordeum_vulgare_newGene_’.
Table 5. The DEGs involved in four metabolic pathways at 48 h and 15 d after being exposed to LK stress.
TimeGene Id Log2 (Fold Change) Seq Description
XZ153XZ141ZD9
48 hMLOC_58581−0.03 normal−7.59 down0.77 normalATP synthase subunit
MLOC_38677----−1.60down----Probable NAD(P)H dehydrogenase(quinone) FQR1-like 1
MLOC_273182.42 up----0.21 normalProbable NAD(P)H dehydrogenase(quinone) FQR1-like 2
MLOC_90330.03 normal−3.10 down−0.43 normalLight-harvesting complex II chlorophyll a/b binding protein 1
15 dEPlHVUG000000100072.21 normal−0.48 normal−1.32 downATP synthase CF1 beta subunit
EPlHVUG000000100061.29 up0.01 normal0.13 normalNADH-plastoquinone oxidoreductase subunit 5
EPlHVUG000000100451.51 up−0.10 normal−0.33 normalPhotosystem II reaction center protein K
EPlHVUG000000100461.13 up0.19 normal−0.29 normalPhotosystem II reaction center protein I
EPlHVUG000000100362.06 up−0.15 normal−0.69 normalPhotosystem II reaction center protein Z
‘--’ and ‘normal’ presented in the table means no detection and without significant gene expression in this study, respectively.
Publisher’s Note: MDPI stays neutral with regard to jurisdictional claims in published maps and institutional affiliations.

