Article

Water Evaporation Reduction Using Sunlight Splitting Technology

1
Department of Optics and Optical Engineering, School of Physics, University of Science and Technology of China, Hefei 230026, China
2
School of Life Sciences, Jiangsu Normal University, Xuzhou 221116, China
3
School of Science, Hubei University of Technology, Wuhan 430068, China
4
College of Agricultural Engineering and Technology, SKUAST-Kashmir, Srinagar 190025, India
*
Authors to whom correspondence should be addressed.
Agronomy 2022, 12(5), 1067; https://doi.org/10.3390/agronomy12051067
Submission received: 17 March 2022 / Revised: 22 April 2022 / Accepted: 26 April 2022 / Published: 28 April 2022
(This article belongs to the Special Issue Agrivoltaic: Challenge and Progress)

Abstract

:
The imbalance between precipitation and water evaporation has caused crop yield reduction, drought, and desertification. Furthermore, most parts of the world are short of water, including China. We proposed a low-cost polymer multilayer film to reduce water evaporation by only passing through several sunlight wavelengths necessary for photosynthesis. A series of experiments were conducted to characterize the influence of partial sunlight on the reduction of water evaporation. Evaporation containers and evaporation pans were placed in open-air (CK), under a glass shed (GS), and under a glass-shed covered with multilayer films (GMF). Our results showed a significant reduction in water evaporation under GMF. Cumulative soil surface evaporation of CK, GS and GMF over 45 days was 80.53 mm, 68.12 mm, and 56.79 mm, respectively. Under GMF, cumulative water evaporation from soil and pan surfaces decreased by 29% and 26%. The slope ( β 1 0 ) of simple linear regression showed a significant relationship between evaporation time and cumulative water evaporation (p = 0.000 < α = 0.05 shown in the ANOVA table). The correlation coefficient was more than 0.91 in all treatments, suggesting a strong positive linear relationship. This study may contribute to future drought resistance and agrivoltaic sustainability development.

1. Introduction

There is a continual drive to conserve water consumption and increase irrigation efficiency in agriculture, particularly in areas with limited water supplies [1,2,3]. Crop irrigation accounts for 70% of global water extractions and reserves more than 40% of globally available calories [4,5,6]. Water scarcity and associated uncertainty are generally increasing worldwide, including in several major river basins, according to the study in reference [7]. In the coming decades, social changes and climate change in many parts of the world will aggravate the water shortage problem [7,8,9,10,11]. Evaporation increases as the humidity drops, the air warmer, or the wind stronger [12]. However, not all of these weather elements contribute equally to water evaporation. The main factor increasing evaporation is the vapor pressure deficit [13]. Evaporation occurs when water vapor diffuses to air at the air–water interface [12]. Therefore, the key to alleviating evaporation is reducing the interaction at the air–water interface.
Researchers have conducted various approaches in the early stages to reduce water evaporation. Since then, worries about water resources have prompted the development of techniques that reduce soil evaporation [14,15,16,17,18,19,20,21], increase soil moisture conservation [22] and reduce water consumption [23]. Among these techniques, mulches are applied to the water soil surface as a protective layer to decrease water evaporation. Mulches have been used worldwide to reduce water evaporation from the soil and pan surfaces, such as gravel mulches [24,25,26,27], organic mulches (crop wastes and trimmed branches) [28,29], synthetic mulches (asphalt and plastic sheets) [1,2,19,28,30], and shading mulches of materials [31,32]. Mulching has numerous advantages for plants and crops. However, with its use, many organic and synthetic mulches deprive the soil of light, water, and air and add excessive heat, dangerous bugs, and high acidity levels. It often seems like the disadvantages of mulching may outweigh the benefits [33]. Furthermore, transport and application costs are high, and the product is bulky [34]. Therefore, there are gaps in discovering a more effective and multi-benefit approach that increases crop yield, provides many investment opportunities to farmers, saves the ecological, and conserves water and soil moisture in the agriculture field. To protect agricultural land from the risks of using mulches on agricultural lands, cover the effects of climate change, find solutions to the water scarcity of farming lands, and address population growth needs, studies have used agrivoltaic techniques to reduce water evaporation and provide multi-benefits across food, energy, and water nexuses [21,22,23].
In the present study, we proposed polymer multilayer films as a multi-benefit approach for water-saving in agriculture. Compared with other techniques, it has many advantages, including a practical, low cost, and sustainable process that can reduce water evaporation. The solution is based on spectral separation to select the red, blue, and far-red light from the sunlight for the photosynthesis of plants. The rest of the sunlight can generate electricity by a CPV (concentrated photovoltaic) design. The Multiplication Co-extrusion (MCE) process, which is capable of economically and continuously producing, has been adopted to prepare alternately superimposed multilayer films [35,36,37]. Our previous work has confirmed that the film has excellent UV resistance and can be used outdoors for a long time [38]. This new approach has the effect of removing most sun radiation from the surfaces of water, soil and plants/crops, such as removing the yellow and green light, the infrared, and the ultraviolet rays. Thus, it can solve the factors that influence water loss, crop yield reduction, drought, and desertification. The impact of partial sunlight on the soil surface or evaporation pan may be quite different from the impact of the total sunlight spectrum. Therefore, in this study, the main objectives are: (1) to determine the impact of partial sunlight on cumulative water evaporation from the soil and pan surfaces; and (2) to investigate how polymer multilayer films can reduce water evaporation.

2. Materials and Methods

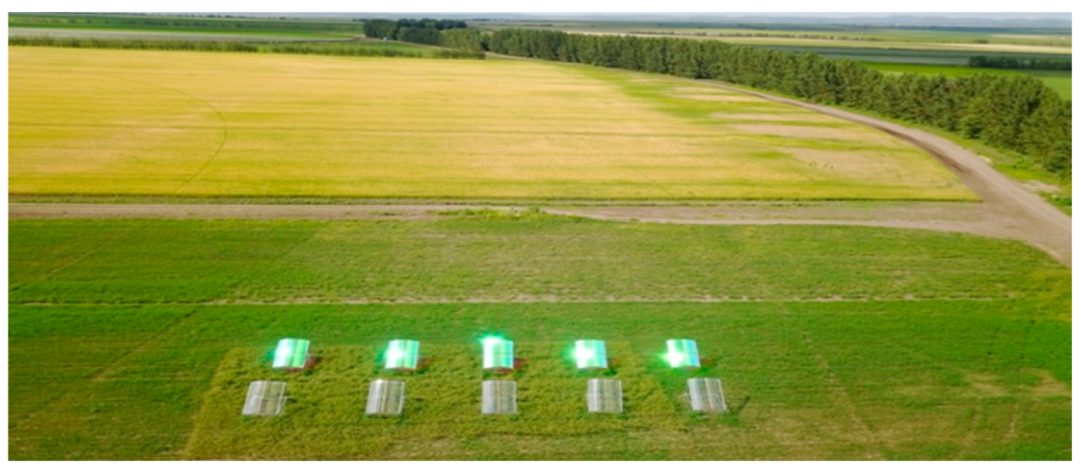
2.1. Experimental Site

The experiments were conducted in the Fuyang City, Anhui Province; the experiment site is at latitude 32°58′ N and longitude 115°55′ E and is 4 m above sea level. Fuyang City is located at the southern end of the Huanghuai Plain in the northwest of Anhui Province, on the south edge of the warm temperate zone, which belongs to the warm temperate zone semi-humid Monsoon climate. The monsoon is obvious; the four seasons are distinct, the climate is mild, and the rainfall is moderate. The annual average rainfall is 820–950 mm. The active accumulated temperature more significant than 0 °C has an annual average of 5359–5474 °C. The annual sunshine hours are 2200–2500 h, the frost-free period is 220–230 days, and the average relative humidity is 58.5%.

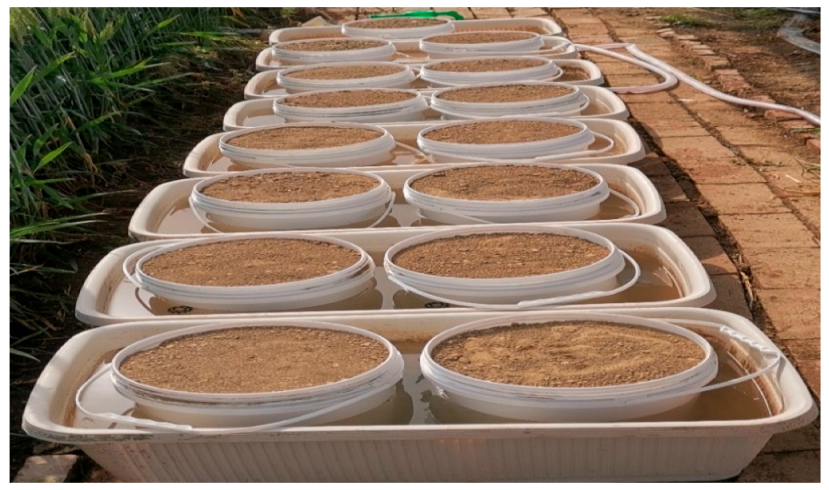
2.2. Experimental Materials

In the experiment, air-dried loamy soil was used. Table 1 shows the basic physical and chemical properties of soil. The soil properties were tested by Sichuan Huabiao Testing Technology Co. Ltd., Chengdu, Sichuan 610016, China.
The evaporation container (white plastic buckets) has a high-temperature resistance of +130 °C, a low-temperature resistance of −30 °C, and weighs 406 g. The container has a top diameter of 26.0 cm, a bottom diameter of 22.0 cm, and a height of 28.5 cm, with a nine holes diameter of 1 cm at the bottom.
For Chinese standard pan evaporation (Model ADM7, built-in China), a 274 g, stainless-steel metal cylinder with a bottom cover was used, which had 5 mm wall thickness, 20 cm diameter, 11 cm depth, and a stainless-steel metal screen [2,39,40].
Climate Stations: We set up three weather stations. The first was in bare soil (CK), the second was under a glass shed (GS), and the third was under a glass-shed covered with multilayer film (GMF). Micrometeorological data were collected at 24-h intervals (from 8:00 a.m. to 8:00 a.m. the next day). Air temperature (°C), wind speed (m s 1 ), relative humidity (%), and solar radiation (W m 2 ) were the variables collected using data loggers.

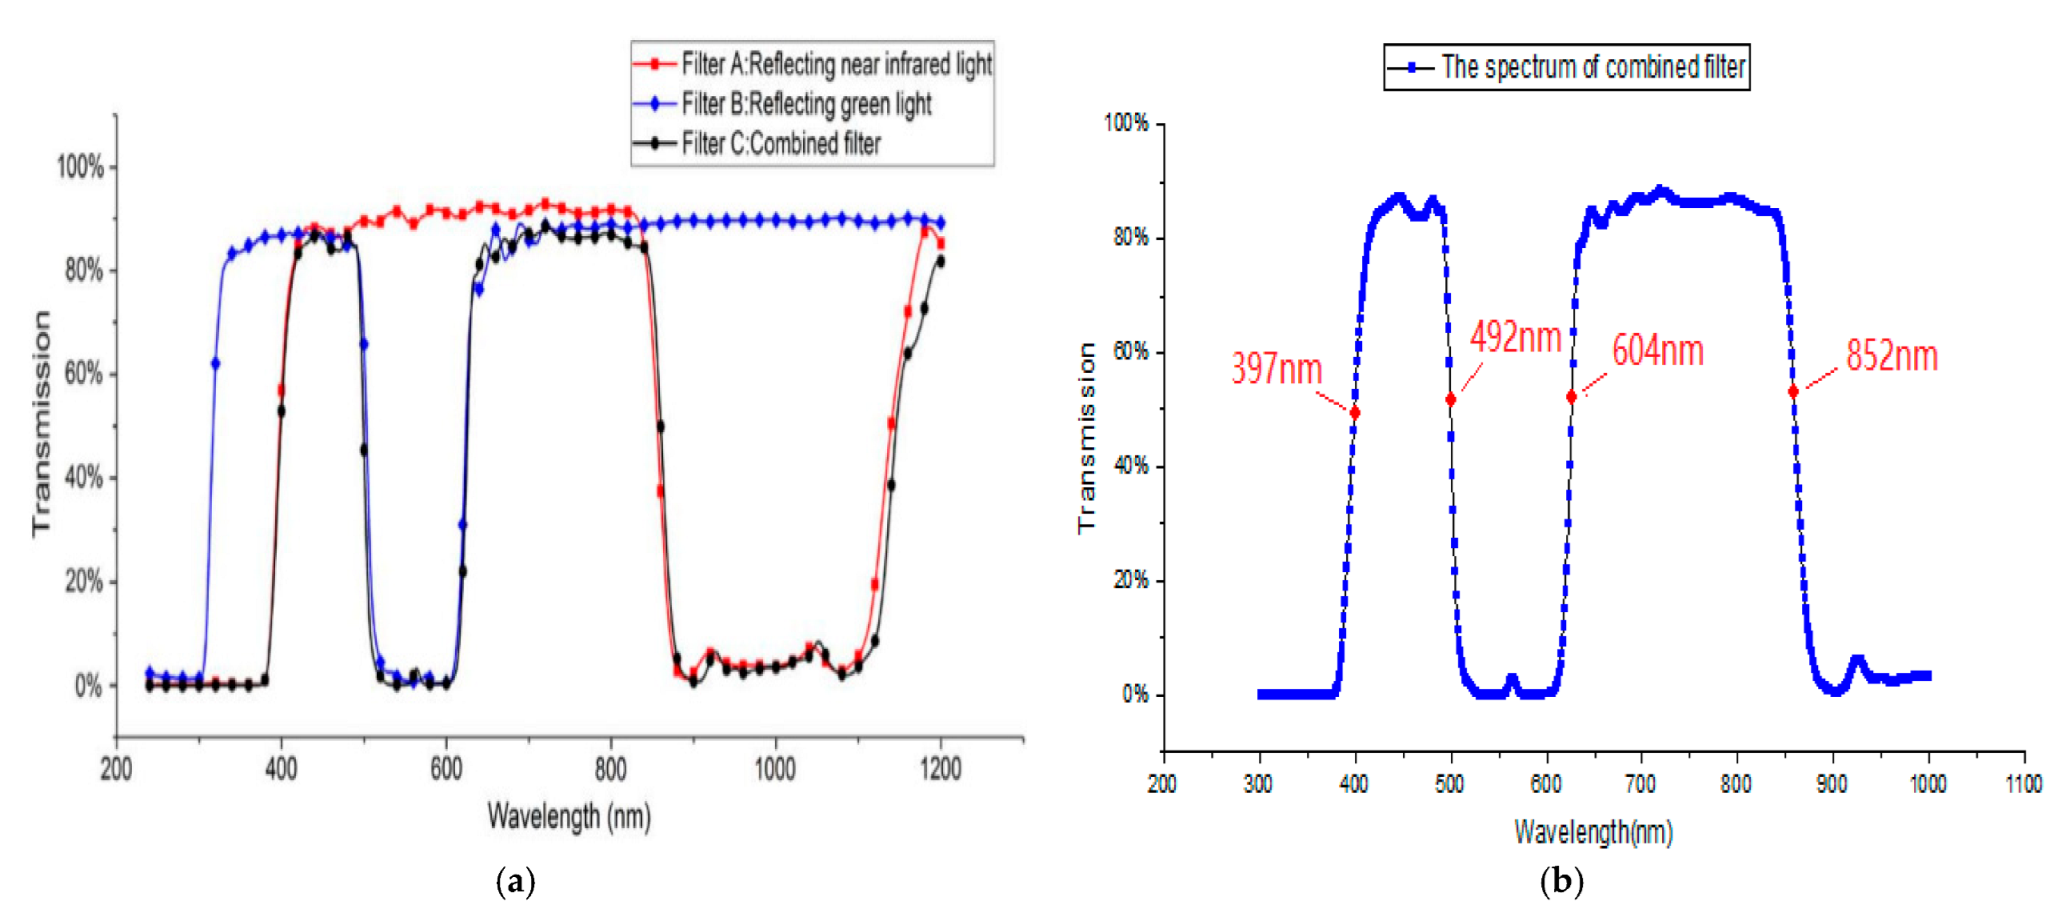
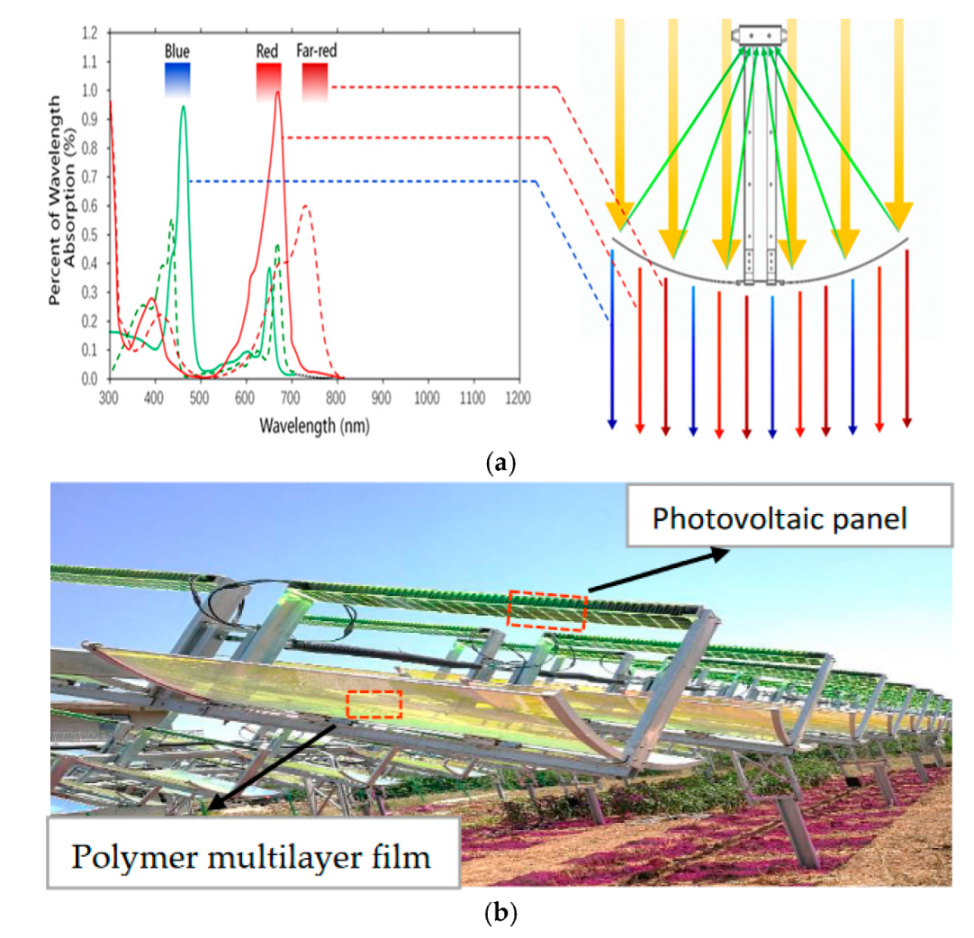
2.3. Sunlight Splitting Technology

The splitting technology used polymer multilayer films based on the physical principle of optical interference to separate sunlight into two parts. The first part is the transmittance spectrum wavelengths, and the other part is the reflection spectrum wavelengths. The transmittance spectrum includes blue light with a 450 ± 30 nm wavelength, red light with a 650 ± 30 nm wavelength, and far-red light with 735 ± 30 nm. The reflection spectrum wavelengths include 60% visible light, infrared, and ultraviolet rays. The transmittance spectrum can be optimized to affect the expression of optimizing the range to improve the temperature under the film and the leaf water potential, which affects the stomatal conductance on soil water evaporation and plant/crop growth. The reflection spectrum wavelengths can generate electricity. Polymer materials with different refractive indices were decided using polycarbonate (PC) and polymethyl methacrylate (PMMA). Figure 1a shows the spectral of the two mixed polymer films. Film A has a higher reflectivity in the 850–1150 nm range, whereas film B has a higher reflectivity in the 500–600 nm range. The blue curved transmission spectrum can be generated by merging these two films, as shown in Figure 1b. The necessary two peaks have been achieved within the blue-light and red-light zones. The two films are applied to bent glass panels [38,40,41].

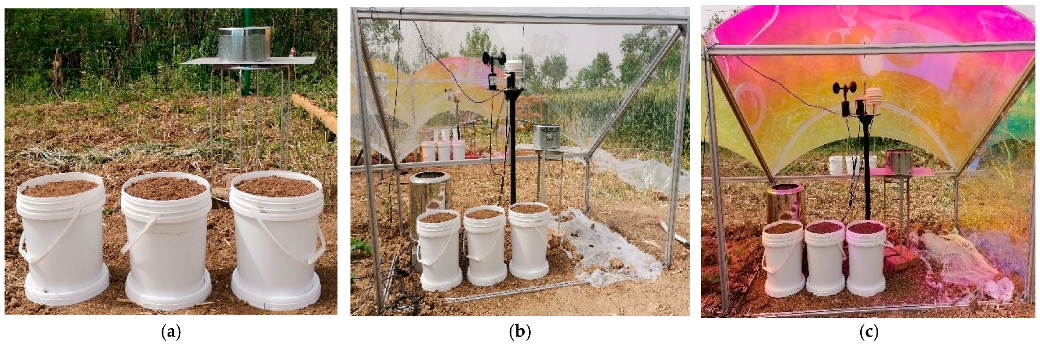
2.4. Experimental Design and Procedures

We used loam soil from the 0 to15 cm layer of an agricultural field, the most common soil type used in the area for agriculture. The soil was air-dried for 78 h and then carefully mixed to achieve a uniform moisture content distribution. The screens were placed inside the evaporation containers to prevent soil particles from leaking through the tiny holes in the bottom. The air-dried soil was packed at a depth of 25 cm into the evaporation containers. The soil-filled evaporation containers were placed at a 10 cm water depth (Figure 2) (48 h). Water was moved by capillary force from the bottom holes to the surface of the soil containers for 48 h. The evaporation containers were then removed from the water tank to discharge gravity water for 24 h through the bottom holes, while the soil containers were covered with plastic covers to prevent soil evaporation. We then weighed the evaporation containers. Three experimental treatments were designed; evaporation containers and pans were placed in CK and under GS and GMF (Figure 3). Three replicates were used in each experiment.
The evaporation experiment was carried out in natural settings with the initial soil water content of the field capacity. When it rained, the evaporation containers were covered with plastic covers. Every day at 8:00 a.m., we weighted evaporation containers using an electronic scale of 30 ± 1 kg. At the same time, the on-site water evaporation pans were weighed. The experiments lasted 45 days in the summer season from 8 May to 25 June 2021. Using data loggers, weather stations measured the daily temperature, relative humidity, wind speed, and solar radiation conditions.

2.5. Experimental Data Analysis

The soil surface evaporation volumes ( E m s ) were calculated as the weight changes in the evaporation containers every day. Evaporation pan weight changes were recorded on the same day as the pan evaporation volume ( E m p ). The soil surface evaporation E m s (kg/day) and the pan surface evaporation E m p (kg/day) were converted into the soil surface evaporation E s s (mm/day) and the pan surface evaporation E s p (mm/day) by the following Equations [26]:
E s s = E m s × 1000   cm 3 kg 1 × 10 mm 1 cm 1 A s o i l
E s p = E m p × 1000   cm 3 kg 1 × 10 mm 1 cm 1 A p a n ,
where A s o i l is the area of the soil surface, cm2; A p a n is the area of pan surface, cm2. The following formula was used to calculate the dry soil mass   M s [26]:
M s = M d s 1 + θ d s ,
where   θ d s is the water content of the air-dried soil [m3/m3], and M d s is the mass of the air-dried soil in kg. The volumetric water content ( θ v ) of soil is the amount of liquid water per unit volume of soil. By dividing mass by density, volume is calculated as follows [42]:
θ v = θ g ρ s o i l ρ w a t e r ,
where θ g is gravimetric water content (kg), ρ s o i l is the density of the air-dry soil (g cm 3 ), ρ w a t e r is the density of water, which is close to 1 g cm 3 . The mass of water per mass of dry soil is known as gravimetric water content ( θ g ) [42], and it is the mass of water per mass of dry soil. The value of θ g is obtained by subtracting the weight of dry soil ( m d r y ) from the weight of wet soil ( m w e t ), and then dividing by the weight of dry soil.
θ g = m w e t m d r y m d r y .
The weight changes of the evaporation containers before and after they were placed in the water tank was a measurement of the absorbed water (Maw). On the first day ( M 1 ), the initial masses of the soil water were calculated as [26]:
M 1 = M a w + M s × θ d s ,
where M s is the dry soil mass in kilograms, and θ d s is the air-dried soil water content in m3/m3. The surface evaporation on the i th day is given as E m s i ( i = 1, 2, …, 45), while the masses of the soil water on an i th day ( M i ) are shown as:
M i = M i 1 E m s i 1 i = 2 ,   3 ,   ,   45 .
On the i th day, the soil water content θ i is estimated as follows:
θ i = M i M s i = 1 ,   2 ,   ,   45 s .

2.6. Statistical Analysis

The linear regression model:
y = β 0 + β 1 x + ε   ,
where β 0 is the regression line’s y-intercept, β 1 is the regression line’s slope and, ε is the error term. The population parameters are b 0   a n d   b 1 and the sample statistics used to estimate β 0   a n d   β 1 are b 0   a n d   b 1 .
y ^ = b 0   + b 1 x ,
where y ^ is the anticipated y value for a given x value, b 0 is the line’s y-intercept, and b 1 is the line’s slope
The gradient ( β 1 ) is tested for significance between the cumulative water evaporation and evaporation times. If the gradient of the line ( β 1 0 ), there is a relationship between cumulative water evaporation and evaporation times. Test for significance of the slope coefficient of the regression model using a level of α = 0.05 [43]. The SPSS25.0 program was used to estimate the linear regression equation, R2 (coefficient of determination), R (correlation coefficient), and ANOVA.

3. Results

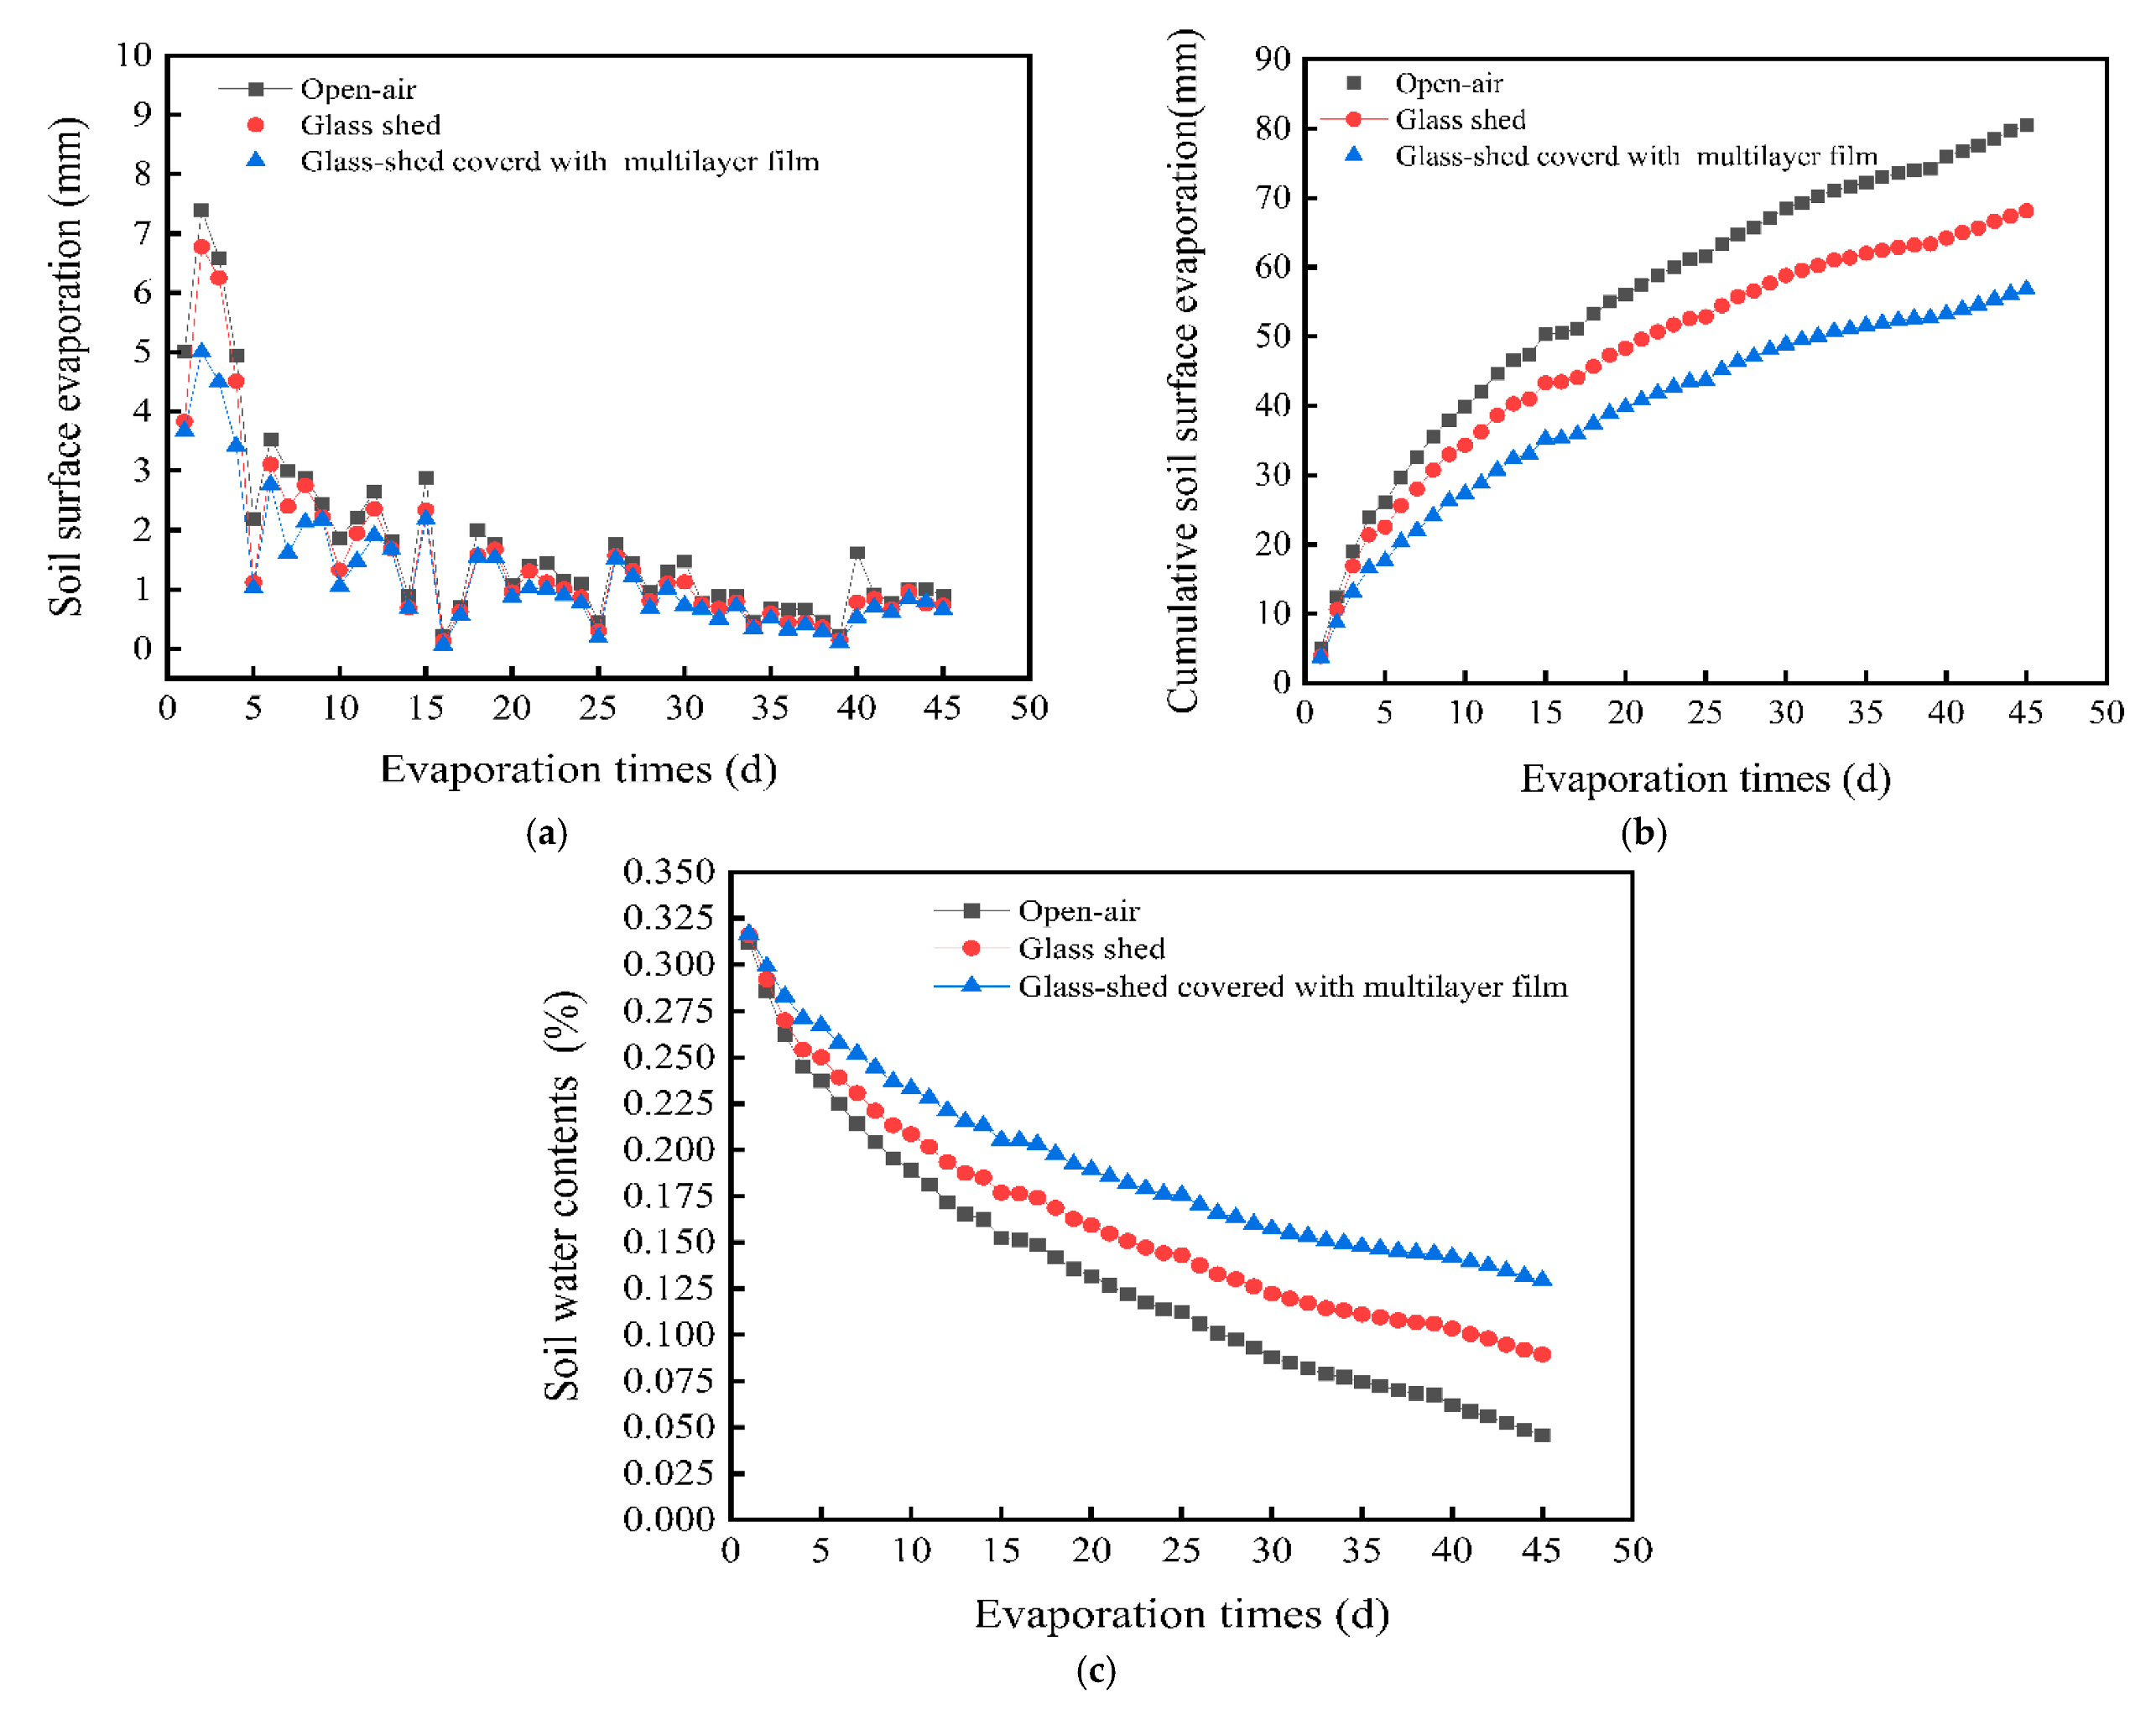
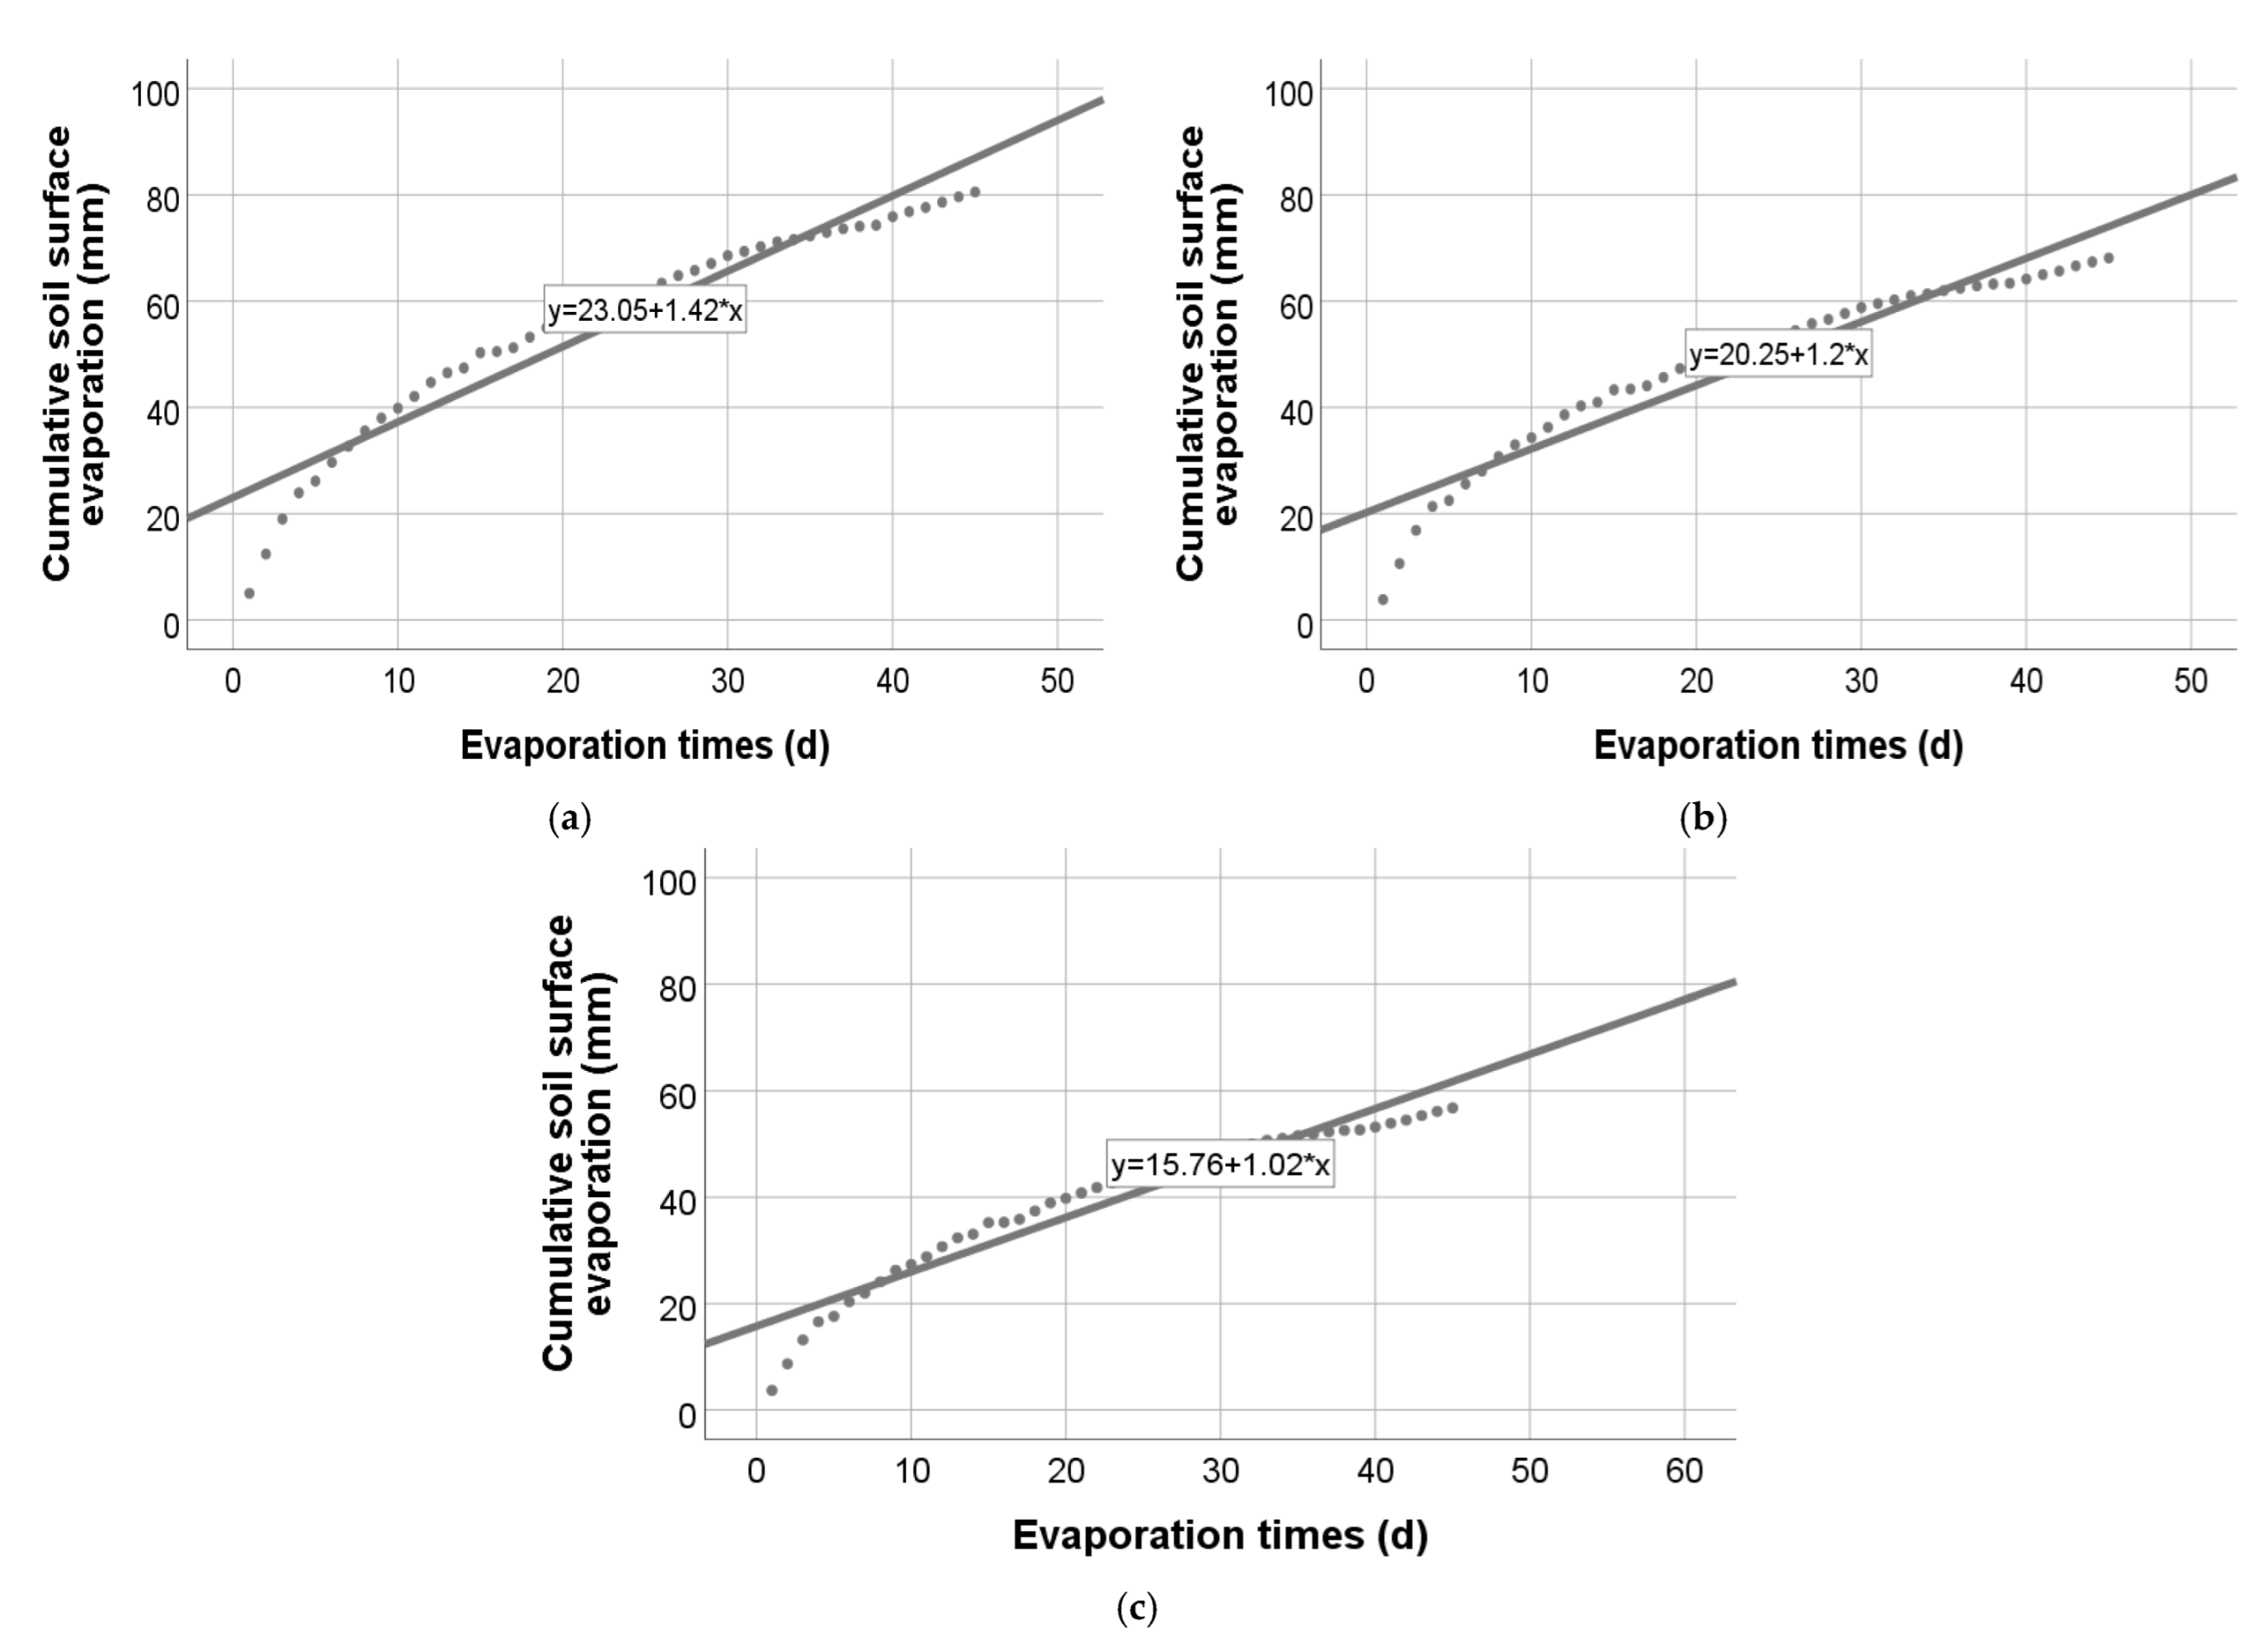
3.1. Cumulative Evaporation of Water from the Soil Surface

As time functions, the cumulative soil surface evaporation processes in three treatments are shown in (Figure 4a). The cumulative soil surface evaporation in CK over 45 days was 80.53 mm, compared to under the GS and GMF were 68.12 mm and 56.79 mm, respectively. Partial sunlight had a considerable impact on reducing cumulative evaporation.
The SPSS statistical analysis outputs in Figure 5 and Table 2, Table 3 and Table 4 explain the relationship between evaporation time and cumulative soil surface evaporation in the CK, under GS, and GMF.

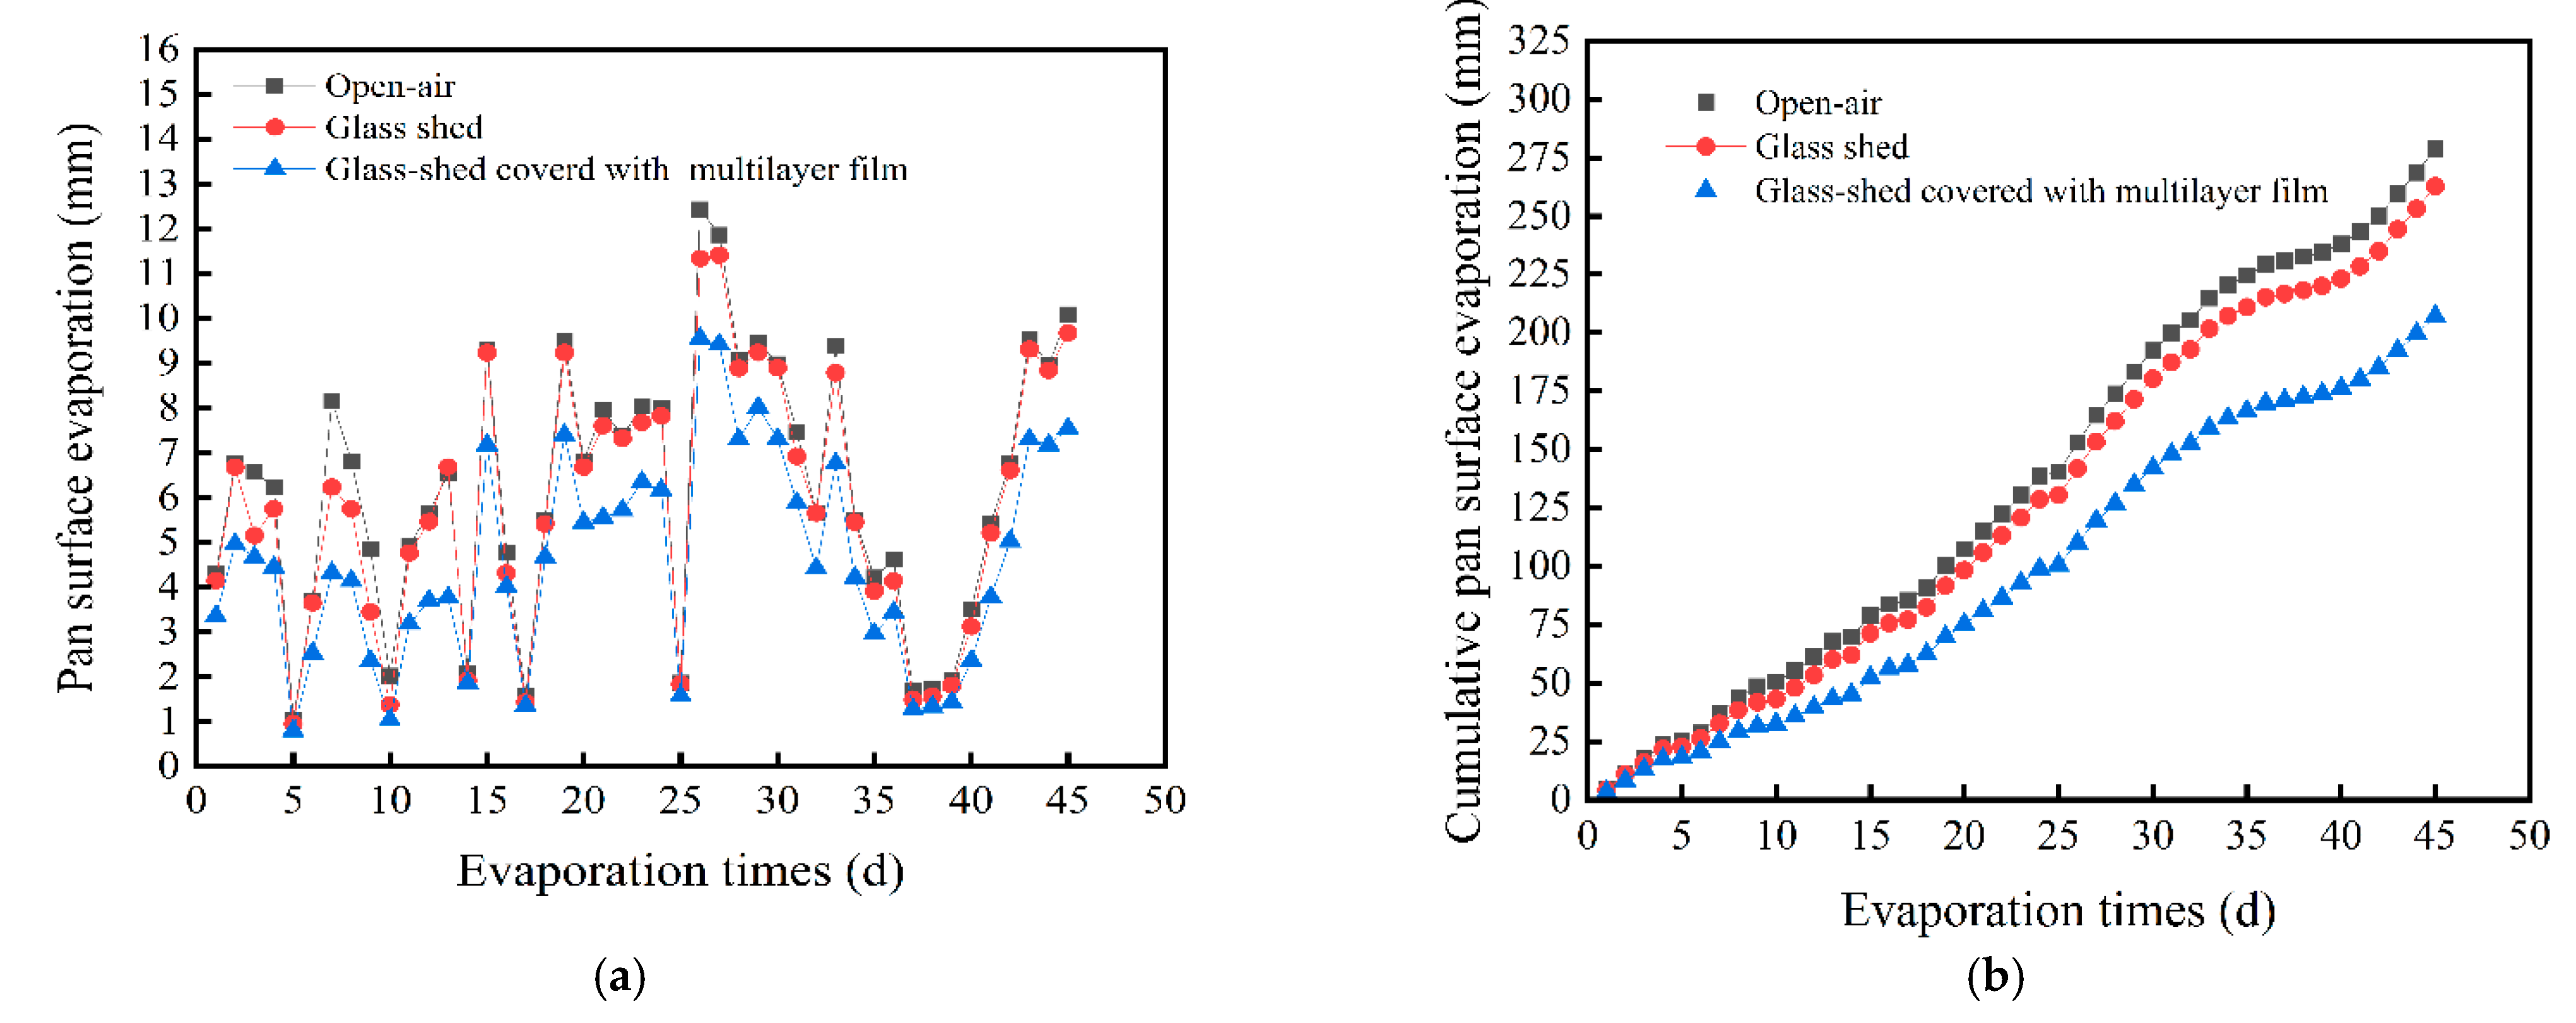
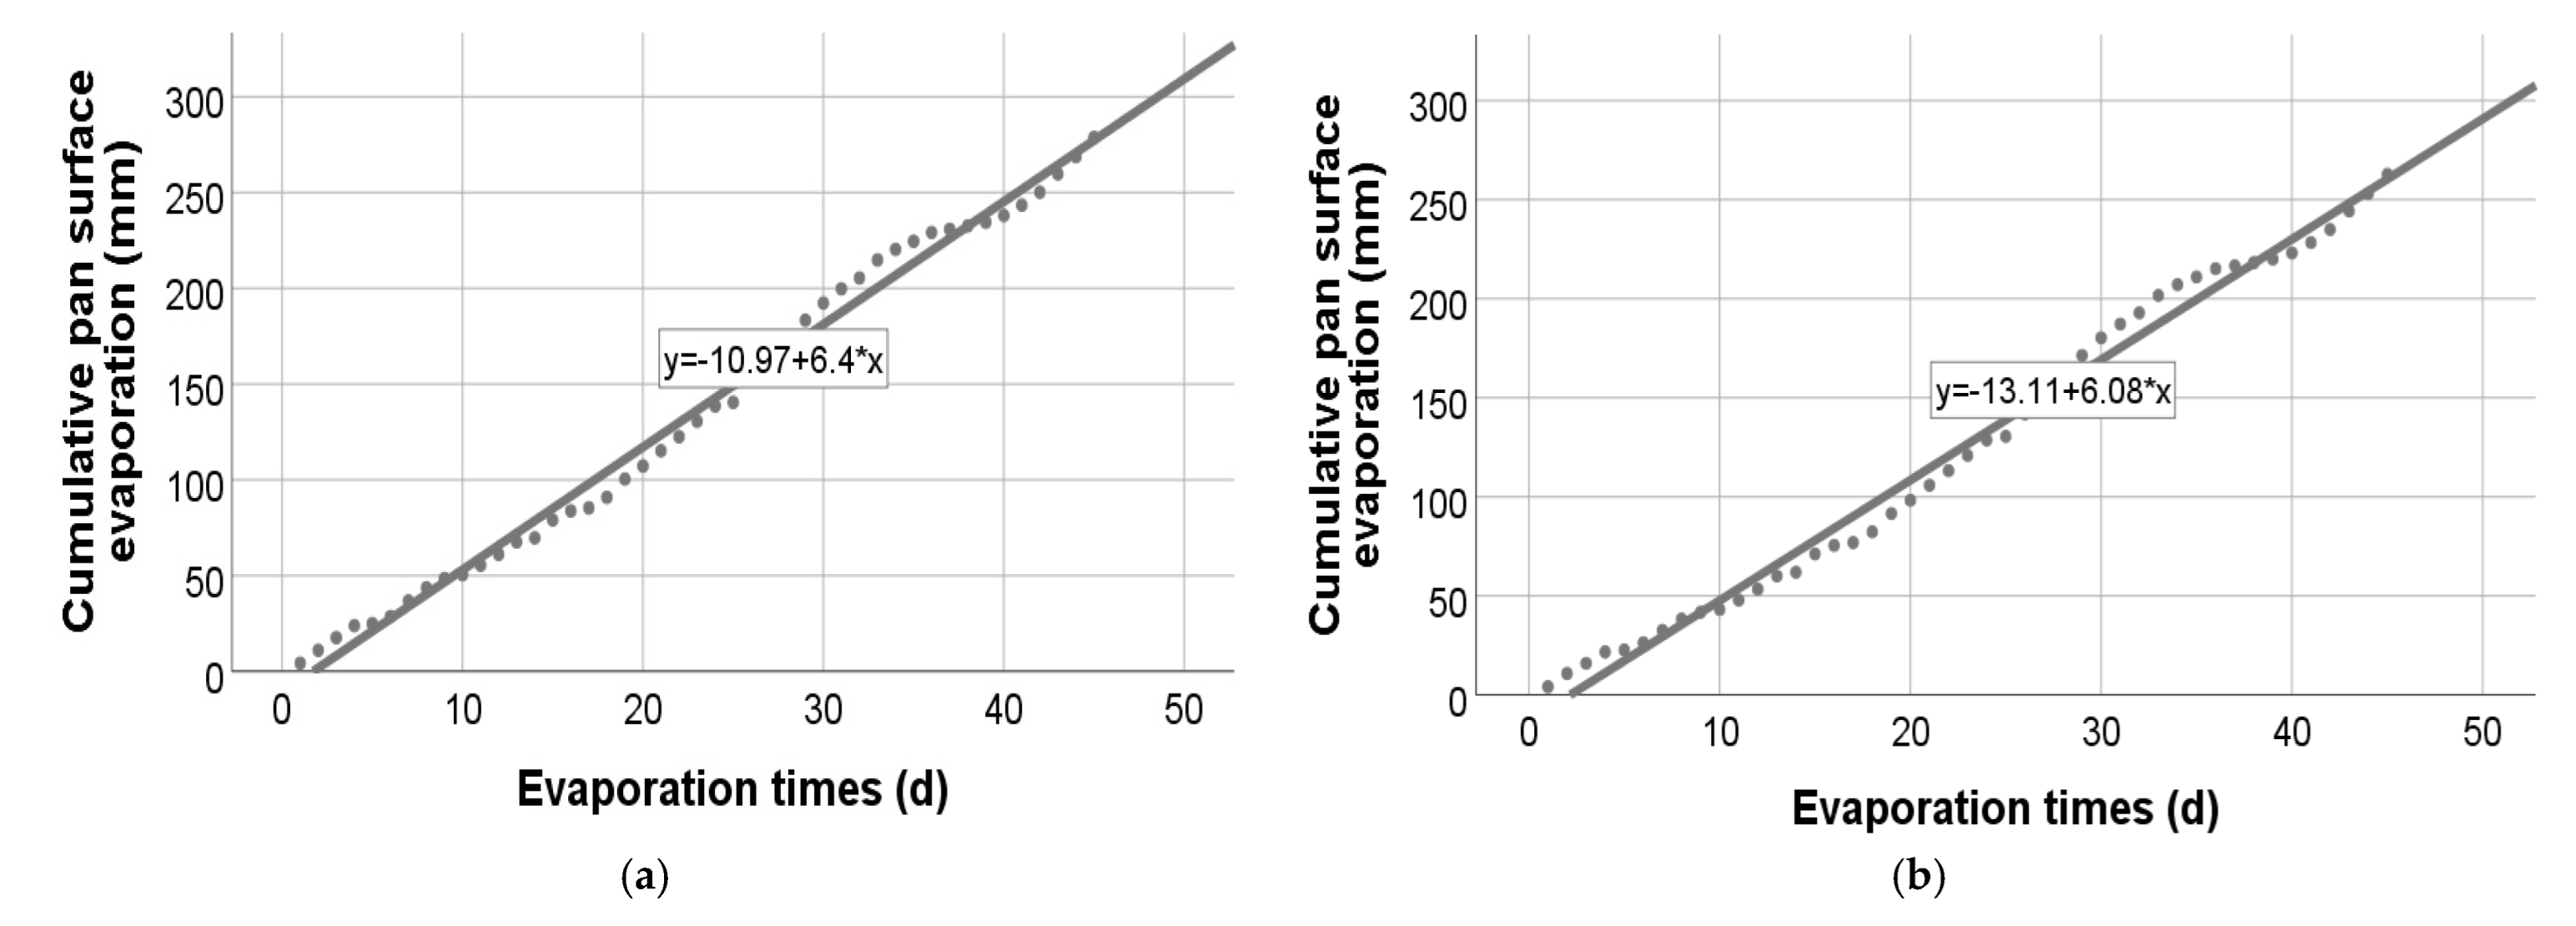
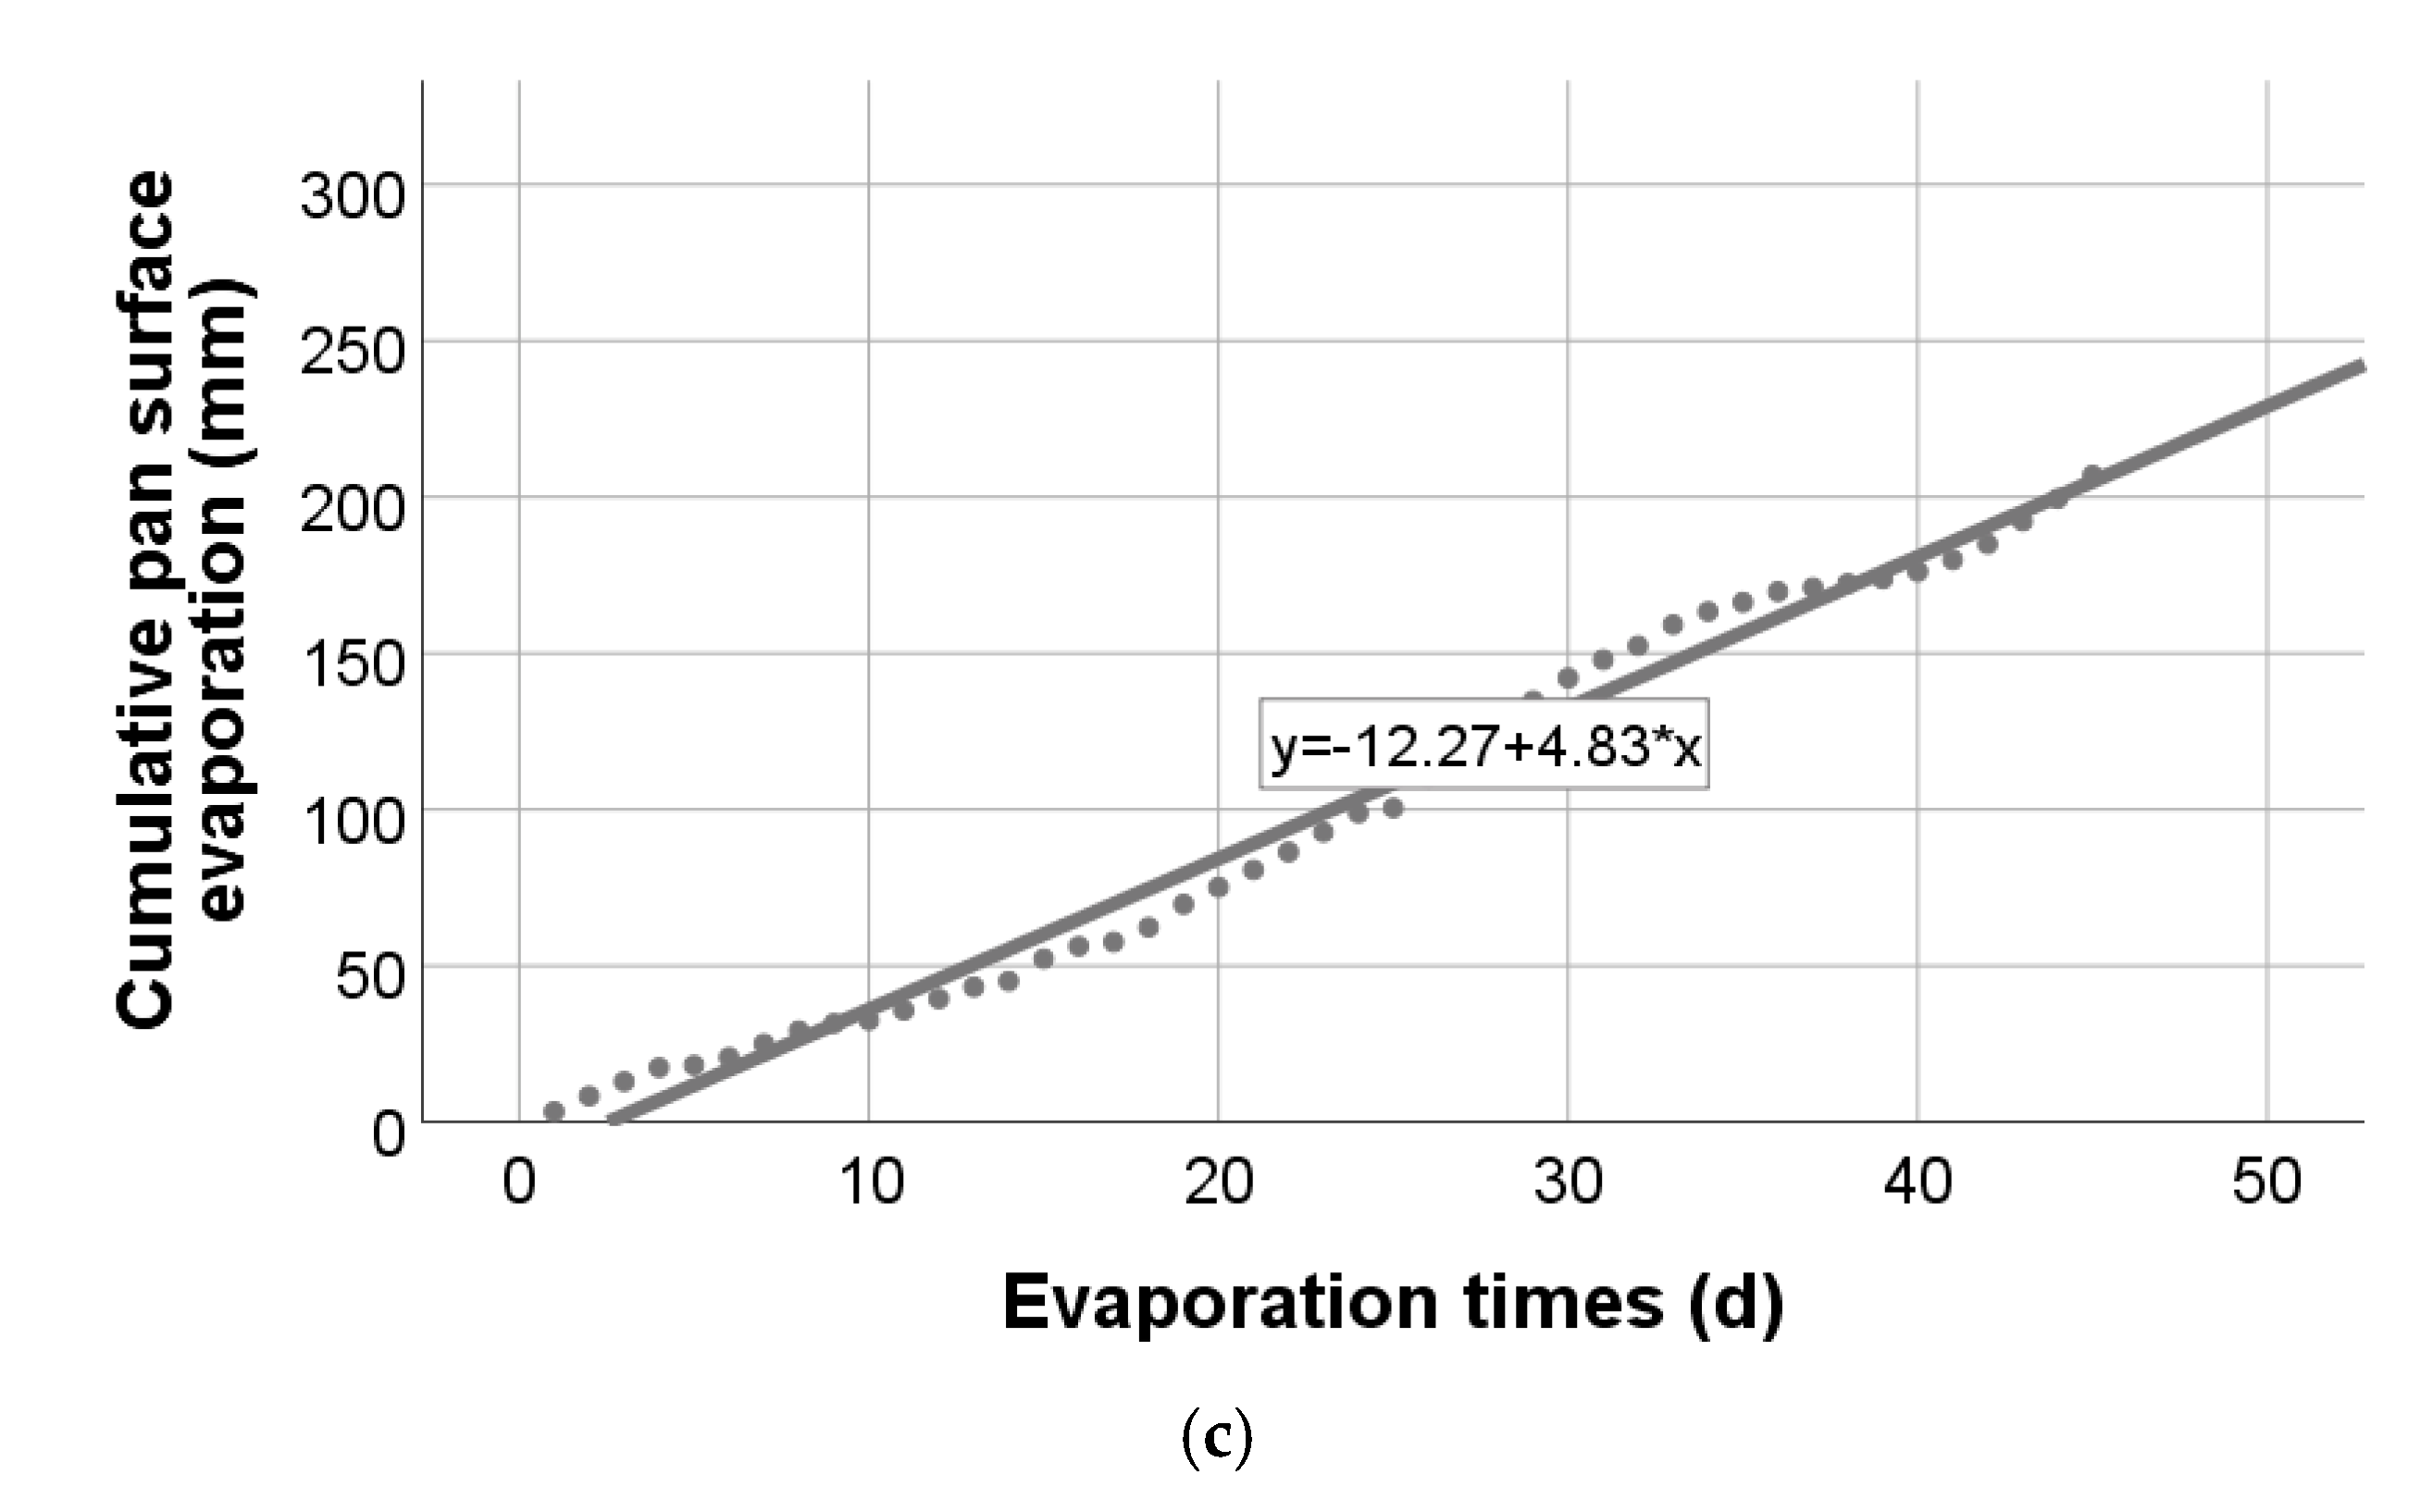
3.2. Cumulative Evaporation of Pan Surface

The cumulative evaporation processes of the pan surface are shown as a function of time (Figure 6a). The cumulative evaporation of the pan surface of the CK over 45 days was 278.76 mm, compared to 262.74 mm, and 206.49 mm under GS and GMF. Figure 6d shows the mean temperature during the experiment period in the three treatments. There is a relationship between the temperature and the solar radiation; when the temperature becomes high, the solar radiation also becomes high. We note through Figure 6a,c that when the solar radiation is high, the amount of water evaporation is high in the CK and GS, while the solar radiation under GMF is low. The amount of water evaporation is low.
The SPSS statistical analysis outputs in Figure 7 and Table 5, Table 6 and Table 7 explain the relationship between evaporation time and cumulative pan surface evaporation in the CK, and under GS and GMF.

4. Discussion

4.1. The Soil Surface Evaporation and the Mechanism of Evaporation Reduction under the GMF

Due to surface evaporation, the capillary force drives soil water to the soil surface via the soil profile. Water from the soil surface evaporates to form water vapor and diffuses into the atmosphere. Evaporation occurs when water vapor diffuses to air at the air–water interface. The evaporation restriction mechanism under the multilayer films is as follows: Firstly, the multilayer polymer films were applied to separate sunlight wavelengths. The red, blue, and far-red light from the sunlight is selectively transmitted for the photosynthesis of plants. The other wavelengths, such as yellow, green, infrared and ultraviolet rays, were reflected (Figure 8a). It can generate electricity by concentrated PV (Figure 8b). Secondly, the sunlight passing through polymer multilayer films enhances the environmental conditions. Therefore, it can reduce the interaction at the air–water interface and avoid water vapor diffusion. Thirdly, GMF prevents direct sunlight from reaching the soil surface; as a result, the processes of the capillary force can be reduced, preventing liquid water from rapidly diffusing off the soil surface. Finally, due to poor vapor diffusion, the moisture or vapor contained within the soil surface is relatively high under partial sunlight, avoiding water evaporation from the soil surface.
After the multilayer films separate the sunlight, the plant’s growth is not affected. We conducted experiments for planting forage in the Hulunbuir Prairie in Hailar, Inner Mongolia province (Figure 9). Compared with the control group without the polymer multilayer film, the forage yield under GMF increased by 20%.

4.2. Cumulative Evaporation of Water from the Soil Surface

As time functions, the cumulative soil surface evaporation processes in three treatments are shown in (Figure 4a). The cumulative soil surface evaporation in CK over 45 days was 80.53 mm, compared to under the GS and GMF were 68.12 mm and 56.79 mm, respectively. Partial sunlight had a considerable impact on reducing cumulative evaporation. Throughout the 45 days, the control treatment CK had the highest cumulative evaporation, and then GS and the GMF had the lowest cumulative evaporation. Compared to the CK, the GS and GMF have reduced evaporation from the soil surface by 15% and 29%, respectively. The cumulative soil surface evaporation value under the GS is higher than a GMF (Figure 4b); this explains that a GMF decreases evaporation significantly.
The evaporation of the soil surface is influenced by the soil water content weather conditions (solar radiation, wind speed, air temperature, humidity). The weather conditions were directly exposed to CK and GS’s soil surface in this experiment. The evaporation process under GMF did not affect soil water content. The soil water content in the CK and GS influenced the evaporation process over the first ten days. The water evaporation from the soil surface was fast, and the soil water content dropped rapidly. After evaporation, the rapid loss of soil water in the first few days resulted in a soil water shortage. The partial sunlight limited the soil water evaporation to optimize the soil surface under GMF from start to finish. Figure 4b,c shows the gradual loss of soil water content. Evaporation was high in the first eight days, in the second twelve days it was unstable, and the evaporation processes have remained consistent for the last 25 days (Figure 4b). By the end of the 45 days, soil moisture conservation under GMF was 39%, compared to 33% and 27%, respectively, in the GS and CK.
The SPSS statistical analysis outputs (Figure 5) and Table 2, Table 3 and Table 4 explain the relationship between evaporation time and cumulative soil surface evaporation in the CK and under GS and GMF. The coefficients table is the most crucial. It contains the coefficients for the regression equation and tests of significance. The ‘B’ column in the coefficients (Table 4) in CK and under GS and GMF, respectively, gives us the regression line’s gradient values and intercept terms. The simple linear regression equation is shown in Figure 5 for the three treatments. The critical information from Table 2 is the R2 values of 0.925, 0.913 and 0.925 in CK and under GS and GMF, respectively. This indicates that only gestation models can explain 92.5%, 91.3%, and 92.5% of the cumulative soil surface evaporation. That is relatively high, so predictions from the regression equation are reasonably reliable. It also means that only 7.5%, 8.7%, and 7.5% in CK and under GS and GMF, respectively, of the variation, is still unexplained.
Simple linear regression was carried out to investigate the relationship between evaporation time at cumulative soil surface evaporation. The scatterplot showed a strong positive linear relationship between the evaporation time and cumulative evaporation, confirmed by a correlation coefficient (Table 2) of 0.962, 0.957, and 0.962 in CK and under GS and GMF, respectively. Simple linear regression showed a significant relationship between evaporation time and cumulative soil surface evaporation (p < 0.000) shown in the ANOVA (Table 3) in CK, under GS, and GMF, respectively. The slope coefficient for gestation in the ‘B’ column (Table 4) was 1.420, 1.196, and 1.023 in CK and under GS and GMF, respectively. Hence, the cumulative soil surface evaporation (mm) increases by 1.420, 1.196, and 1.023 in CK and under GS and GMF, respectively.

4.3. Cumulative Evaporation of Pan Surface

The cumulative evaporation processes of the pan surface are shown as a function of time (Figure 6a). The cumulative evaporation of the pan surface of the CK over 45 days was 278.76 mm compared to 262.74 mm, and 206.49 mm under GS and GMF. Solar radiation influenced the evaporation process. The partial sunlight efficiently reduces evaporation. Figure 6a,c note that the evaporation from the pan surface is related to the sun’s influence on the three treatments. The evaporation was higher on the CK and then under the GS. However, it is the lowest under GMF. That means the total sunlight has the effect of more than partial sunlight on evaporation. Thus, under GMF, the amount of the sun reaches less than in CK and GS. Compared to CK, cumulative pan surface evaporation under GS and GMF was decreased by 6% and 26%, respectively. The cumulative pan surface evaporation value under the GS is higher than under GMF (Figure 6b); this explains that a GMF decreases evaporation significantly.
This proves that the multilayer film allows only spectrum wavelengths that provide plants with photosynthesis and blocks several sunlight wavelengths that are unnecessary for photosynthesis. Over 45 days, the average solar radiation under GMF was 28 W m 2 compared to GS and CK, which were 40 W m 2 and 51 W m 2 respectively. The findings support that the influence of GMF significantly impacts crop quality and yield.
Our next objective is to construct an optical polymer multilayer film with two transmission peaks at 660 nm and 450 nm to reduce water evaporation by more than 50% and enhance power generation efficiency in this unique agrivoltaic system.
The SPSS statistical analysis outputs (Figure 7 and Table 5, Table 6 and Table 7) explain the relationship between evaporation time and cumulative pan surface evaporation in the CK and under GS and GMF. The coefficients table is the most crucial. It contains the coefficients for the regression equation and tests of significance. The ‘B’ column in the coefficients (Table 7) in CK and under GS and GMF, respectively, gives us the values of the gradient and intercept terms for the regression line. The simple linear regression equation can be shown (Figure 7). The critical information from Table 5 is the R2 values of 0.991, 0.989, and 0.986 in CK and under GS and GMF, respectively. This indicates that only gestation models can explain 99.1%, 98.9% and 98.6% of cumulative pan surface evaporation. This is relatively high, so predictions from the regression equation are reasonably reliable. It also means that only 0.9%, 1.1%, and 1.4% in CK and under GS and GMF, respectively, of the variation is still unexplained, so adding other independent variables could improve the fit of the models.
Simple linear regression was carried out to investigate the relationship between evaporation time at cumulative pan surface evaporation. The scatterplot showed a strong positive linear relationship between the evaporation time and cumulative evaporation, confirmed with a correlation coefficient (Table 5) of 0.996, 0.995, and 0.993 in CK and under GS and GMF, respectively. Simple linear regression showed a significant relationship between evaporation time and cumulative pan surface evaporation (p < 0.000) shown in the ANOVA (Table 6) in CK and under GS and GMF, respectively. In the ‘B’ column (Table 7), the slope coefficient for gestation was 6.405, 6.078, and 4.828 in CK and under GS and GMF, respectively. Hence, the cumulative soil surface evaporation increases by 6.405, 6.078, and 4.828 in CK and under GS and GMF, respectively.

5. Conclusions

In the present study, we studied the impact of partial sunlight on soil surface evaporation and pan surface evaporation. We concluded as follows:
The cumulative soil surface evaporation in the CK, and under the GS and the GMF was 80.53 mm, 68.12 mm, and 56.79 mm, respectively.
The cumulative evaporation of the pan surface in the CK and under the GS and the GMF was 278.76 mm, 262.74 mm, and 206.49 mm, respectively.
The results showed a significant reduction in water evaporation in the soil and pan surfaces by 29% and 26% under the GMF.
The soil water content under the GMF, the GS, and the CK conserved water at 39%, 33% and 27%, respectively. According to the data logged by meteorological stations for three experimental treatments, solar radiation under GMF was reduced by 45% compared to that in the CK.
SPSS examined the correlation between cumulative soil and pan surfaces evaporation and evaporation time. The coefficient of determination and the correlation coefficient indicated a positive and perfect linear relationship.
Using the glass covered with polymer multilayer film in our novel agrivoltaic techniques could help overcome the challenges of water scarcity, food and energy demand.

Author Contributions

Data curation, A.A.A.O., X.L., F.Z., X.Z. and S.O.H.M.; Formal analysis, A.A.A.O., M.L. and S.O.H.M.; Funding acquisition, W.L.; Investigation, F.Z. and Y.L.; Methodology, M.L., X.L. and X.Z.; Resources, W.L.; Software, A.A.A.O.; Supervision, W.L.; Validation, X.Z.; Visualization, Y.L.; Writing—original draft, A.A.A.O.; Writing—review & editing, J.Z., J.I. and R.K. All authors have read and agreed to the published version of the manuscript.

Funding

The research was funded by “Fuyang Municipal Government—Fuyang Normal University Horizontal Project grant number SXHZ202011, “the CRSRI Open Research Program” under grant CKWV2019726/KY, and “the Fundamental Research Funds for the Central Universities” under grant WK529000000.

Data Availability Statement

The datasets used and analyzed during the current study are available from the corresponding author on reasonable request.

Conflicts of Interest

The authors declare that they have no known competing financial interests or personal relationships that could have influenced the work reported in this paper.

References

  1. Awan, K.S. Effect of Mulch on Soil Physical Properties and N, P, K Concentration in Maize (Zea mays) Shoots under Two Tillage Systems. Int. J. Agric. Biol. 2009, 11, 119–124. [Google Scholar]
  2. Khorsandi, F. Soil Water Conservation by Course Textured Volcanic Rock Mulch. Soc. Appl. Sci. 2011, 2, 762–765. [Google Scholar]
  3. Pereira, L.S.; Oweis, T.; Zairi, A. Irrigation management under water scarcity. Agric. Water Manag. 2002, 57, 175–206. [Google Scholar] [CrossRef]
  4. Pérez-Blanco, C.D.; Hrast-Essenfelder, A.; Perry, C. Irrigation Technology and Water Conservation: A Review of the Theory and Evidence. Rev. Environ. Econ. Policy 2020, 14, 216–239. [Google Scholar] [CrossRef]
  5. Grafton, R.Q.; Williams, J.; Jiang, Q. Possible pathways and tensions in the food and water nexus. Earth’s Future 2017, 5, 449–462. [Google Scholar] [CrossRef] [Green Version]
  6. Grafton, R.Q.; Williams, J.; Perry, C.J.; Molle, F.; Ringler, C.; Steduto, P.; Udall, B.; Wheeler, S.A.; Wang, Y.; Garrick, D.; et al. The paradox of irrigation efficiency. Science 2018, 361, 748–750. [Google Scholar] [CrossRef] [Green Version]
  7. Greve, P.; Kahil, T.; Mochizuki, J.; Schinko, T.; Satoh, Y.; Burek, P.; Fischer, G.; Tramberend, S.; Burtscher, R.; Langan, S.; et al. Global assessment of water challenges under uncertainty in water scarcity projections. Nat. Sustain. 2018, 1, 486–494. [Google Scholar] [CrossRef]
  8. AbdAllah, A. Impacts of Kaolin and Pinoline foliar application on growth, yield and water use efficiency of tomato (Solanum lycopersicum L.) grown under water deficit: A comparative study. J. Saudi Soc. Agric. Sci. 2019, 18, 256–268. [Google Scholar] [CrossRef]
  9. AbdAllah, A.M.; Mashaheet, A.M.; Zobel, R.; Burkey, K.O. Physiological basis for controlling water consumption by two snap beans genotypes using different anti-transpirants. Agric. Water Manag. 2019, 214, 17–27. [Google Scholar] [CrossRef]
  10. Morsy, S.M.; Elbasyoni, I.S.; Abdallah, A.M.; Baenziger, P.S. Imposing water deficit on modern and wild wheat collections to identify drought-resilient genotypes. J. Agron. Crop Sci. 2021, 1–14. [Google Scholar] [CrossRef]
  11. Shalaby, M.M.; Nassar, I.N.; Abdallah, A.M. Evaporation suppression from open water surface using various floating covers with consideration of water ecology. J. Hydrol. 2021, 598, 126482. [Google Scholar] [CrossRef]
  12. Nguyen, T.B.T.; Nguyen, T.H.N.; Pham, Q.T. Water loss due to evaporation from open reservoirs under weather conditions in Vietnam. Asia-Pac. J. Chem. Eng. 2020, 15, e2488. [Google Scholar] [CrossRef]
  13. Meziani, A.; Remini, B.; Boutoutaou, D. Estimating evaporation from dam-reservoirs in arid and semi-arid regions case of Algeria. J. Eng. Appl. Sci. 2020, 15, 2097–2107. [Google Scholar]
  14. Lemon, E.R. The Potentialities for Decreasing Soil Moisture Evaporation Loss. Soil Sci. Soc. Am. J. 1956, 20, 120–125. [Google Scholar] [CrossRef]
  15. Xie, Z.; Wang, Y.; Jiang, W.; Wei, X. Evaporation and evapotranspiration in a watermelon field mulched with gravel of different sizes in northwest China. Agric. Water Manag. 2006, 81, 173–184. [Google Scholar] [CrossRef]
  16. Mitchell, J.P.; Singh, P.; Wallender, W.W.; Munk, D.S.; Wroble, J.F.; Horwath, W.R.; Hogan, P.; Roy, R.; Hanson, B.R. No-tillage and high-residue practices reduce soil water evaporation. Calif. Agric. 2012, 66, 55–61. [Google Scholar] [CrossRef] [Green Version]
  17. Youssef, Y.; Khodzinskaya, A. A Review of Evaporation Reduction Methods from Water Surfaces. E3S Web Conf. 2019, 97, 05044. [Google Scholar] [CrossRef]
  18. Knowles, J.F.; Blanken, P.D.; Williams, M.W.; Chowanski, K.M. Energy and surface moisture seasonally limit evaporation and sublimation from snow-free alpine tundra. Agric. For. Meteorol. 2012, 157, 106–115. [Google Scholar] [CrossRef]
  19. Kasirajan, S.; Ngouajio, M. Polyethylene and biodegradable mulches for agricultural applications: A review. Agron. Sustain. Dev. 2012, 32, 501–529. [Google Scholar] [CrossRef]
  20. Iqbal, R.; Raza, M.A.S.; Valipour, M.; Saleem, M.F.; Zaheer, M.S.; Ahmad, S.; Toleikiene, M.; Haider, I.; Aslam, M.U.; Nazar, M.A. Potential agricultural and environmental benefits of mulches—A review. Bull. Natl. Res. Cent. 2020, 44, 75. [Google Scholar] [CrossRef]
  21. McKuin, B.; Zumkehr, A.; Ta, J.; Bales, R.; Viers, J.H.; Pathak, T.; Campbell, J.E. Energy and water co-benefits from covering canals with solar panels. Nat. Sustain. 2021, 4, 609–617. [Google Scholar] [CrossRef]
  22. Barron-Gafford, G.A.; Pavao-Zuckerman, M.A.; Minor, R.L.; Sutter, L.F.; Barnett-Moreno, I.; Blackett, D.T.; Thompson, M.; Dimond, K.; Gerlak, A.K.; Nabhan, G.P.; et al. Agrivoltaics provide mutual benefits across the food–energy–water nexus in drylands. Nat. Sustain. 2019, 2, 848–855. [Google Scholar] [CrossRef]
  23. Elamri, Y.; Cheviron, B.; Lopez, J.-M.; Dejean, C.; Belaud, G. Water budget and crop modelling for agrivoltaic systems: Application to irrigated lettuces. Agric. Water Manag. 2018, 208, 440–453. [Google Scholar] [CrossRef]
  24. Awodoyin, R.; Ogbeide, F.; Oluwole, O. Effects of Three Mulch Types on the Growth and Yield of Tomato (Lycopersicon esculentum Mill.) and Weed Suppression in Ibadan, Rainforest-savanna Transition Zone of Nigeria. Trop. Agric. Res. Ext. 2010, 10, 53. [Google Scholar] [CrossRef] [Green Version]
  25. Adams, J.E. Influence of Mulches on Runoff, Erosion, and Soil Moisture Depletion. Soil Sci. Soc. Am. J. 1966, 30, 110–114. [Google Scholar] [CrossRef]
  26. Yuan, C.; Lei, T.; Mao, L.; Liu, H.; Wu, Y. Soil surface evaporation processes under mulches of different sized gravel. Catena 2009, 78, 117–121. [Google Scholar] [CrossRef]
  27. McMillen, M. The Effect of Mulch Type and Thickness on the Soil Surface Evaporation Rate. Digit. Commons 2013. Available online: https://digitalcommons.calpoly.edu/cgi/viewcontent.cgi?article=1026&context=hcssp (accessed on 16 March 2022).
  28. Zribi, W.; Aragüés, R.; Medina, E.; Faci, J. Efficiency of inorganic and organic mulching materials for soil evaporation control. Soil Tillage Res. 2015, 148, 40–45. [Google Scholar] [CrossRef] [Green Version]
  29. Liao, Y.; Cao, H.-X.; Liu, X.; Li, H.-T.; Hu, Q.-Y.; Xue, W.-K. By increasing infiltration and reducing evaporation, mulching can improve the soil water environment and apple yield of orchards in semiarid areas. Agric. Water Manag. 2021, 253, 106936. [Google Scholar] [CrossRef]
  30. Wu, Y.; Du, T.; Ding, R.; Yuan, Y.; Li, S.; Tong, L. An isotope method to quantify soil evaporation and evaluate water vapor movement under plastic film mulch. Agric. Water Manag. 2017, 184, 59–66. [Google Scholar] [CrossRef]
  31. Alvarez, V.M.; Baille, A.; Martínez, J.M.; González-Real, M.M. Efficiency of shading materials in reducing evaporation from free water surfaces. Agric. Water Manag. 2006, 84, 229–239. [Google Scholar] [CrossRef]
  32. Tesfuhuney, W.A.; Van Rensburg, L.D.; Walker, S.; Allemann, J. Quantifying and predicting soil water evaporation as influenced by runoff strip lengths and mulch cover. Agric. Water Manag. 2015, 152, 7–16. [Google Scholar] [CrossRef]
  33. Loz, B. What Are the Disadvantages of Mulching? Available online: https://takeayard.com/mulching-disadvantages/ (accessed on 17 November 2020).
  34. Nyamoti, M. State Four Disadvantages of Organic Mulches. Available online: https://www.atikaschool.org/agriculturetopicalquestions/state-four-disadvantages-of-organic-mulches (accessed on 16 June 2020).
  35. Weber, M.F.; Stover, C.A.; Gilbert, L.R.; Nevitt, T.J.; Ouderkirk, A.J. Giant Birefringent Optics in Multilayer Polymer Mirrors. Science 2000, 287, 2451–2456. [Google Scholar] [CrossRef] [PubMed] [Green Version]
  36. Singer, K.D.; Kazmierczak, T.; Lott, J.; Song, H.; Wu, Y.; Andrews, J.; Baer, E.; Hiltner, A.; Weder, C. Melt-processed all-polymer distributed Bragg reflector laser. Opt. Express 2008, 16, 10358–10363. [Google Scholar] [CrossRef] [PubMed]
  37. Andrews, J.H.; Crescimanno, M.; Dawson, N.J.; Mao, G.; Petrus, J.B.; Singer, K.D.; Baer, E.; Song, H. Folding flexible co-extruded all-polymer multilayer distributed feedback films to control lasing. Opt. Express 2012, 20, 15580–15588. [Google Scholar] [CrossRef]
  38. Li, M.; Liu, W.; Zhang, F.; Zhang, X.; Omer, A.A.A.; Zhang, Z.; Liu, Y.; Zhao, S. Polymer multilayer film with excellent UV-resistance & high transmittance and its application for glass-free photovoltaic modules. Sol. Energy Mater. Sol. Cells 2021, 229, 111103. [Google Scholar] [CrossRef]
  39. Liu, H.-J.; Kang, Y. Sprinkler irrigation scheduling of winter wheat in the North China Plain using a 20 cm standard pan. Irrig. Sci. 2006, 25, 149–159. [Google Scholar] [CrossRef]
  40. Liu, W.; Liu, L.; Guan, C.; Zhang, F.; Li, M.; Lv, H.; Yao, P.; Ingenhoff, J. A novel agricultural photovoltaic system based on solar spectrum separation. Sol. Energy 2018, 162, 84–94. [Google Scholar] [CrossRef]
  41. Li, M.; Liu, Y.; Zhang, F.; Zhang, X.; Zhang, Z.; Omer, A.A.A.; Zhao, S.; Liu, W. Design of multi-passband polymer multilayer film and its application in photovoltaic agriculture. Chin. Opt. Lett. 2021, 19, 112201. [Google Scholar] [CrossRef]
  42. Bilskie, J.; Scientific, C. Soil Water Status: Content and Potential; Campbell Scientific, Inc.: Logan, UT, USA, 2001; Volume 435, pp. 753–2342. [Google Scholar]
  43. Loftus, S.C. Chapter 19—Simple linear regression. In Basic Statistics; Loftus, R.S.C., Ed.; Academic Press: Cambridge, MA, USA, 2022; pp. 227–247. [Google Scholar]
Figure 1. The splitting sunlight technology used polymer multilayer films to separate sunlight (a) The spectrum of the individual polymer films and (b) the spectrum of the combined polymer films.
Agronomy 12 01067 g001
Figure 2. The evaporation containers filled with dried soil are put into a 10 cm water depth tank.
Agronomy 12 01067 g002
Figure 3. The design of three experiment treatments, evaporation containers and pans evaporation placed (a) in the open-air, (b) under a glass shed, and (c) under a glass-shed covered with multilayer film.
Agronomy 12 01067 g003
Figure 4. The effect of three treatments on the evaporation of water from the soil surface is (a) soil surface evaporation of each day (mm), (b) cumulative soil surface evaporation (mm), and (c) soil water content (%).
Agronomy 12 01067 g004
Figure 5. Cumulative soil surface evaporation and evaporation time under three treatments basis on the fitting equation in the (a) open-air, (b) under glass shed, and (c) a glass-shed covered with multilayer interference film.
Agronomy 12 01067 g005
Figure 6. The effect of three treatments on the evaporation of water from the surface of the pan (a) pan surface evaporation (mm) (b), cumulative pan surface evaporation (mm), (c) solar radiation (W/m2), and (d) mean temperature (°C).
Agronomy 12 01067 g006aAgronomy 12 01067 g006b
Figure 7. Cumulative pan surface evaporation and time under three treatments basis with the fitting equation in the (a) open-air, (b) under glass shed, and (c) a glass-shed covered with multilayer interference film.
Agronomy 12 01067 g007aAgronomy 12 01067 g007b
Figure 8. Polymer multilayer film applied to novel agrivoltaic system (a) Spectra are required for plant photosynthesis and solar power generation and (b) A novel agrivoltaic system applied in the agricultural field in Fu yang City, Anhui province.
Agronomy 12 01067 g008
Figure 9. The photo of forage planting experiments in the Hulunbuir Prairie in Hailar, in Inner Mongolia province.
Agronomy 12 01067 g009
Table 1. Soil’s basic physical and chemical parameters in the experiment region.
Soil PropertiesValueUnits
pH8.21
Organic matter4.37 g   kg 1
Total nitrogen0.034%
Hydrolyzable nitrogen28.4 mg   kg 1
Available phosphorus2.3 mg   kg 1
Quick-acting potassium163 mg   kg 1
Bulk density (ρbulk)0.995 g   cm 3
Porosity (ε)0.617%
0 to 2 μm (Clay)8.49%
2 to 50 μm (Powder)79.79%
50 to 2000 μm (Sand grain)11.69%
Table 2. The output of the SPSS shows the model Summary (b) of the three treatments.
ModeRR2Adjusted R2Standard Error of the Estimate
Theopen-air
10.962 a0.9250.9235.38838
Glass shed
10.957 a0.9150.9134.83042
Glass-shed covered with multilayer film
10.962 a0.9250.9243.86032
(a). Predictors: (Constant), (d) Evaporation time and (b) Dependent Variable: Cumulative soil surface evaporation (mm).
Table 3. The output of the SPSS shows the analysis variance (ANOVA a) of the three treatments.
ModeSum of SquaresdfMean SquareFSignificant
Theopen-air
1Regression15,299.080115,299.080 526.925 0.000 b
Residual1248.4894329.035
Total16,547.56944
Glass shed
1Regression10,851.165110,851.165 465.058 0.000 b
Residual1003.3164323.333
Total11,854.48144
Glass-shed covered with multilayer interferenc film
1Regression7936.50717936.507 532.577 0.000 b
Residual640.7904314.902
Total8577.29744
a. Dependent Variable: Cumulative soil surface evaporation (mm) and b. Predictors: (Constant), Evaporation time (d).
Table 4. The output of the SPSS shows a coefficients a table of the three treatments.
ModelUnstandardized
Coefficients
Standardized CoefficientstSignificant
BStandard
Error
Beta
Theopen-air
1(Constant)23.049 1.464 14.109 0.000
Evaporation time (d)1.420 0.055 0.962 22.955 0.000
Glass shed
(Constant)20.245 1.464 13.824 0.000
1Evaporation time (d)1.196 0.055 0.957 21.565 0.000
Glass-shed covered with multilayer film
1(Constant)15.758 1.170 13.464 0.000
Evaporation time (d)1.023 0.044 0.962 23.078 0.000
a. Dependent Variable: Cumulative soil surface evaporation (mm).
Table 5. The output of the SPSS shows the model Summary b of the three treatments.
ModeRR2Adjusted R2Standard Error of the Estimate
Theopen-air
1 0.996 a 0.991 0.991 8.06559
Glass shed
1 0.995 a 0.989 0.989 8.45129
Glass-shed covered with multilayer film
1 0.993 a 0.986 0.985 7.75029
a. Predictors: (Constant), Evaporation time (d), and b Dependent Variable: Cumulative pan surface evaporation (mm).
Table 6. The output of the SPSS shows the analysis variance (ANOVA a) of the three treatments.
ModeSum of SquaresdfMean SquareFSignificant
Theopen-air
1Regression 311,340.197 1 311,340.197 4785.890 0.000 b
Residual 2797.312 43 65.054
Total 314,137.510 44
Glass shed
1Regression 280,374.615 1 280,374.615 3925.477 0.000 b
Residual 3071.247 43 71.424
Total 283,445.862 44
Glass-shed covered with multilayer film
1Regression 176,910.569 1 176,910.569 2945.219 0.000 b
Residual 2582.882 43 60.067
Total 179,493.452 44
a. Dependent Variable: Cumulative pan surface evaporation (mm) and b. Predictors: (Constant), Evaporation time (d).
Table 7. The output of the SPSS shows a coefficients a table of the three treatments.
ModelUnstandardized
Coefficients
Standardized CoefficientstSignificant
BStandard
Error
Beta
Theopen-air
1(Constant) −10.969 2.445 −4.486 0.000
Evaporation time (d)6.4050.0930.99669.1800.000
Glass shed
(Constant) −13.106 2.562 −5.115 0.000
1Evaporation time (d) 6.078 0.097 0.995 62.654 0.000
Glass-shed covered with multilayer film
1(Constant) −12.265 2.350 −5.220 0.000
Evaporation time (d) 4.828 0.089 0.993 54.270 0.000
a. Dependent Variable: Cumulative pan surface evaporation (mm).
Publisher’s Note: MDPI stays neutral with regard to jurisdictional claims in published maps and institutional affiliations.

