Article

Soil Available Phosphorus Deficiency Reduces Boll Biomass and Lint Yield by Affecting Sucrose Metabolism in Cotton-Boll Subtending Leaves

1
State Key Laboratory of Crop Biology, College of Agronomy, Shandong Agricultural University, Tai’an 271018, China
2
State Key Laboratory of Cotton Biology, Institute of Cotton Research of Chinese Academy of Agricultural Sciences, Anyang 455000, China
3
Anyang National Climatological Observatory, Anyang 455000, China
*
Authors to whom correspondence should be addressed.
These authors contributed equally to this work.
Agronomy 2022, 12(5), 1065; https://doi.org/10.3390/agronomy12051065
Submission received: 2 April 2022 / Revised: 23 April 2022 / Accepted: 26 April 2022 / Published: 28 April 2022
(This article belongs to the Topic Plant Metabolism under Stress)

Abstract

:
Soil available phosphorus (AP) deficiency and shortage of phosphate rocks limit cotton production in China. Therefore, pool-culture experiments were conducted in 2019 and 2020 using two cotton cultivars (CCRI-79, low-P tolerant; SCRC-28, low-P sensitive) under three soil AP levels (P0: 3 ± 0.5, P1: 6 ± 0.5, and P2 (control): 15 ± 0.5 mg kg−1) to ascertain the effect of soil AP on boll biomass and lint yield. P0 and P1 decreased the P concentration and net photosynthetic rate (Pn) of subtending leaves, thus, reducing boll biomass and lint yield. Additionally, soil AP deficiency decreased boll wall:boll, lint:boll, and lint:seed, and increased seed:boll ratio. Upper fruiting branch positions (FB9–12) had higher lint:seed ratio and proportion of the total lint yield under low soil AP. Moreover, soil AP deficiency also reduced the sucrose transformation rate (Tr) and activities of sucrose-metabolizing enzymes, such as ribulose-1,5-bisphosphate carboxylase-oxygenase (Rubisco), sucrose phosphate synthase (SPS), and sucrose synthase (SuSy), while increased carbohydrate levels (soluble sugar, sucrose, and starch) and the activity of cytosolic fructose-1,6-bisphosphatase (cy-FBPase) in the subtending leaves. The sucrose and starch contents, cy-FBPase, and SPS activities of SCRC-28 were more sensitive to low soil AP than CCRI-79. Higher Tr and activities of initial Rubisco and SuSy in the subtending leaves improved boll biomass and lint yield.

1. Introduction

Cotton is an essential cash crop grown in approximately 76 countries [1]. In China, cotton production increased from 444 thousand tons in 1949 to 6096 thousand tons in 2018, with the highest-ranking worldwide output between 1983 and 2015 [2], and reached 5731 thousand tons in 2021 [3]. However, an insufficient supply of phosphorus (P) fertilizer during the 1980s limited cotton production in the Yellow River Valley. A similar trend was observed in the middle- and low-yield areas of Shandong and Henan provinces that highly depend on P fertilizer. However, the P fertilizer effect on cotton yield declined gradually in the Yangtze River valley [4]. Numerous studies have documented how P fertilizer affects cotton yield and fiber quality [5,6,7,8], but the results differ. For example, the boll number reduced by 8–40% and yield by 10–40% under P deficiency conditions [9,10]. Dorahy et al. [10] also reported that in 17 experiments of P application in eastern Australia, only three experiments indicated a significant increment in lint yield. Similarly, prior studies unraveled varied effects of the intensity and nature of P fertilization on fiber quality [5,6,7,11]. Several factors, including the P status of the soil, or other external factors, such as water [10] and nitrogen (N) fertilizer [12], probably determine the effects of P fertilizer on cotton production.
Phosphorus is required for crop development and growth, as it promotes cell division and stimulates flower bud and boll formation in cotton plants [13]. In contrast, P deficiency seriously limits cotton growth [14] by decreasing the net photosynthetic rate (Pn) [15], resulting in low yield [6]. Thus, P fertilizers are applied to complement soil available P. Unfortunately, metallic elements in soils, such as aluminum, iron, calcium, and magnesium, fix most of the soil P, making it unavailable to plants [16,17]. The range of total P content in the world was 200–5000 mg kg−1, and that in China was 200–1100 mg kg−1 [18]. Globally, 5700 million hectares have insufficient soil available P (AP) [19,20], and approximately 30% of the cultivated land in China has merely 3–5 mg kg−1 of soil AP [21] using the Olsen-P method [22].
Phosphorus deficiency reduced leaf Pn but caused massive starch accumulation in rice shoots [23]. Meanwhile, low-P levels increased the amounts of soluble sugar, sucrose, and starch in bean [24], tomato [25], and cotton [26] leaves. Hermans et al. [27] showed that P deficient arabidopsis accumulates more carbohydrates in its leaves. However, low-P decreased the soluble sugar content of wheat flag leaves [28]. These contrasting reports might be related to the materials and treatments used per study. Nonetheless, the increase/decrease in carbohydrate contents in leaves under low-P ultimately inhibited plant photosynthesis and growth in the different studies [29,30,31].
Carbohydrates can help cotton plants cope with environmental stress by increasing the osmotic pressure in leaves (capacity of humidity guarantee) and roots (capacity of uptake), especially non-structural carbohydrates (sucrose and starch) [32,33]. Photosynthesis of the leaf subtending the cotton boll produces the carbohydrates necessary for cotton boll development, especially sucrose. Therefore, studying sucrose physiological metabolism in the subtending leaves under low-P is crucial [34].
Rubisco is the key enzyme that determines the carbon assimilation rate during photosynthesis. Sucrose phosphate synthase (SPS) and cytosolic fructose-1,6-bisphosphatase (cy-FBPase) are the key rate-limiting enzymes for sucrose synthesis, and their activities are closely related to the sucrose content in plant leaves [35,36,37]. Meanwhile, sucrose synthase (SuSy) catalyzes sucrose synthesis and decomposition [38,39]. Coordinated actions of SPS, SuSy, and cy-FBPase in cotton leaves improved the source (subtending leaf)-sink (cotton boll) sucrose concentration gradient and transportation [40]. Low-P affects the activities of sucrose-metabolizing enzymes [41]. Rubisco activity decreased by 76 and 42% in spinach and maize leaves [42,43] under low-P stress, but its activity was unaffected in sugar beet leaves [44]. Moreover, P deficiency increased SPS and cy-FBPase activities by 97 and 58% in sugar beet leaves [45]. In contrast, SPS and cy-FBPase activities decreased by 4 and 44% in maize leaf under low-P treatment [43]. Meanwhile, P deficiency hardly affected the SuSy activity of sugar beet and maize leaves [43,45]. However, low-P caused lower SuSy activity in tobacco shoots (over ten-fold) and roots (eight-fold) than adequate-P supply [46]. Beans had higher SuSy activity (over two-fold) in root tips [33]. Therefore, different crops and organs have different sucrose metabolic responses under low-P. Many studies showed that P deficiency affects carbohydrate accumulation and distribution in cotton leaves and bolls [47,48], but the explanation for this response is lacking.
Subtending leaves are the main carbohydrate donors for cotton bolls, and boll biomass is an important factor in cotton yield [8]. Therefore, the physiological characteristics of subtending leaves directly affect carbohydrate synthesis and transportation for cotton boll development [49]. During growth and development, cotton plants maintain an indeterminate growth pattern; thus, cotton bolls and subtending leaves at different fruiting branch positions (FBPs) have different ecological environments [50,51]. However, most analyses of the influence of P fertilization on cotton yield were based on the total plant [6,8]. In contrast, some studies have demonstrated that cotton bolls at different FBPs respond differently to nutrient stress [52,53]. The above reports suggest that cotton bolls at different FBPs probably respond differently to P fertilization. However, there are no reports on the effects of low soil AP content on boll biomass, lint yield, and the levels of carbohydrate and sucrose metabolic enzyme activities in subtending leaves of different FBPs.
Thus, this study investigated (1) the effect of low soil AP contents on the carbohydrate content and activities of sucrose-metabolizing enzymes in the subtending leaves, boll biomass, and lint yield under different FBPs; (2) the key carbohydrate and sucrose metabolic enzymes available under low soil AP contents; and (3) the relationship between source indices (carbohydrate content and sucrose-metabolizing enzyme activities) and sink indices (boll biomass and lint yield) under low soil AP. These results will inform cotton production under soil AP deficiency.

2. Materials and Methods

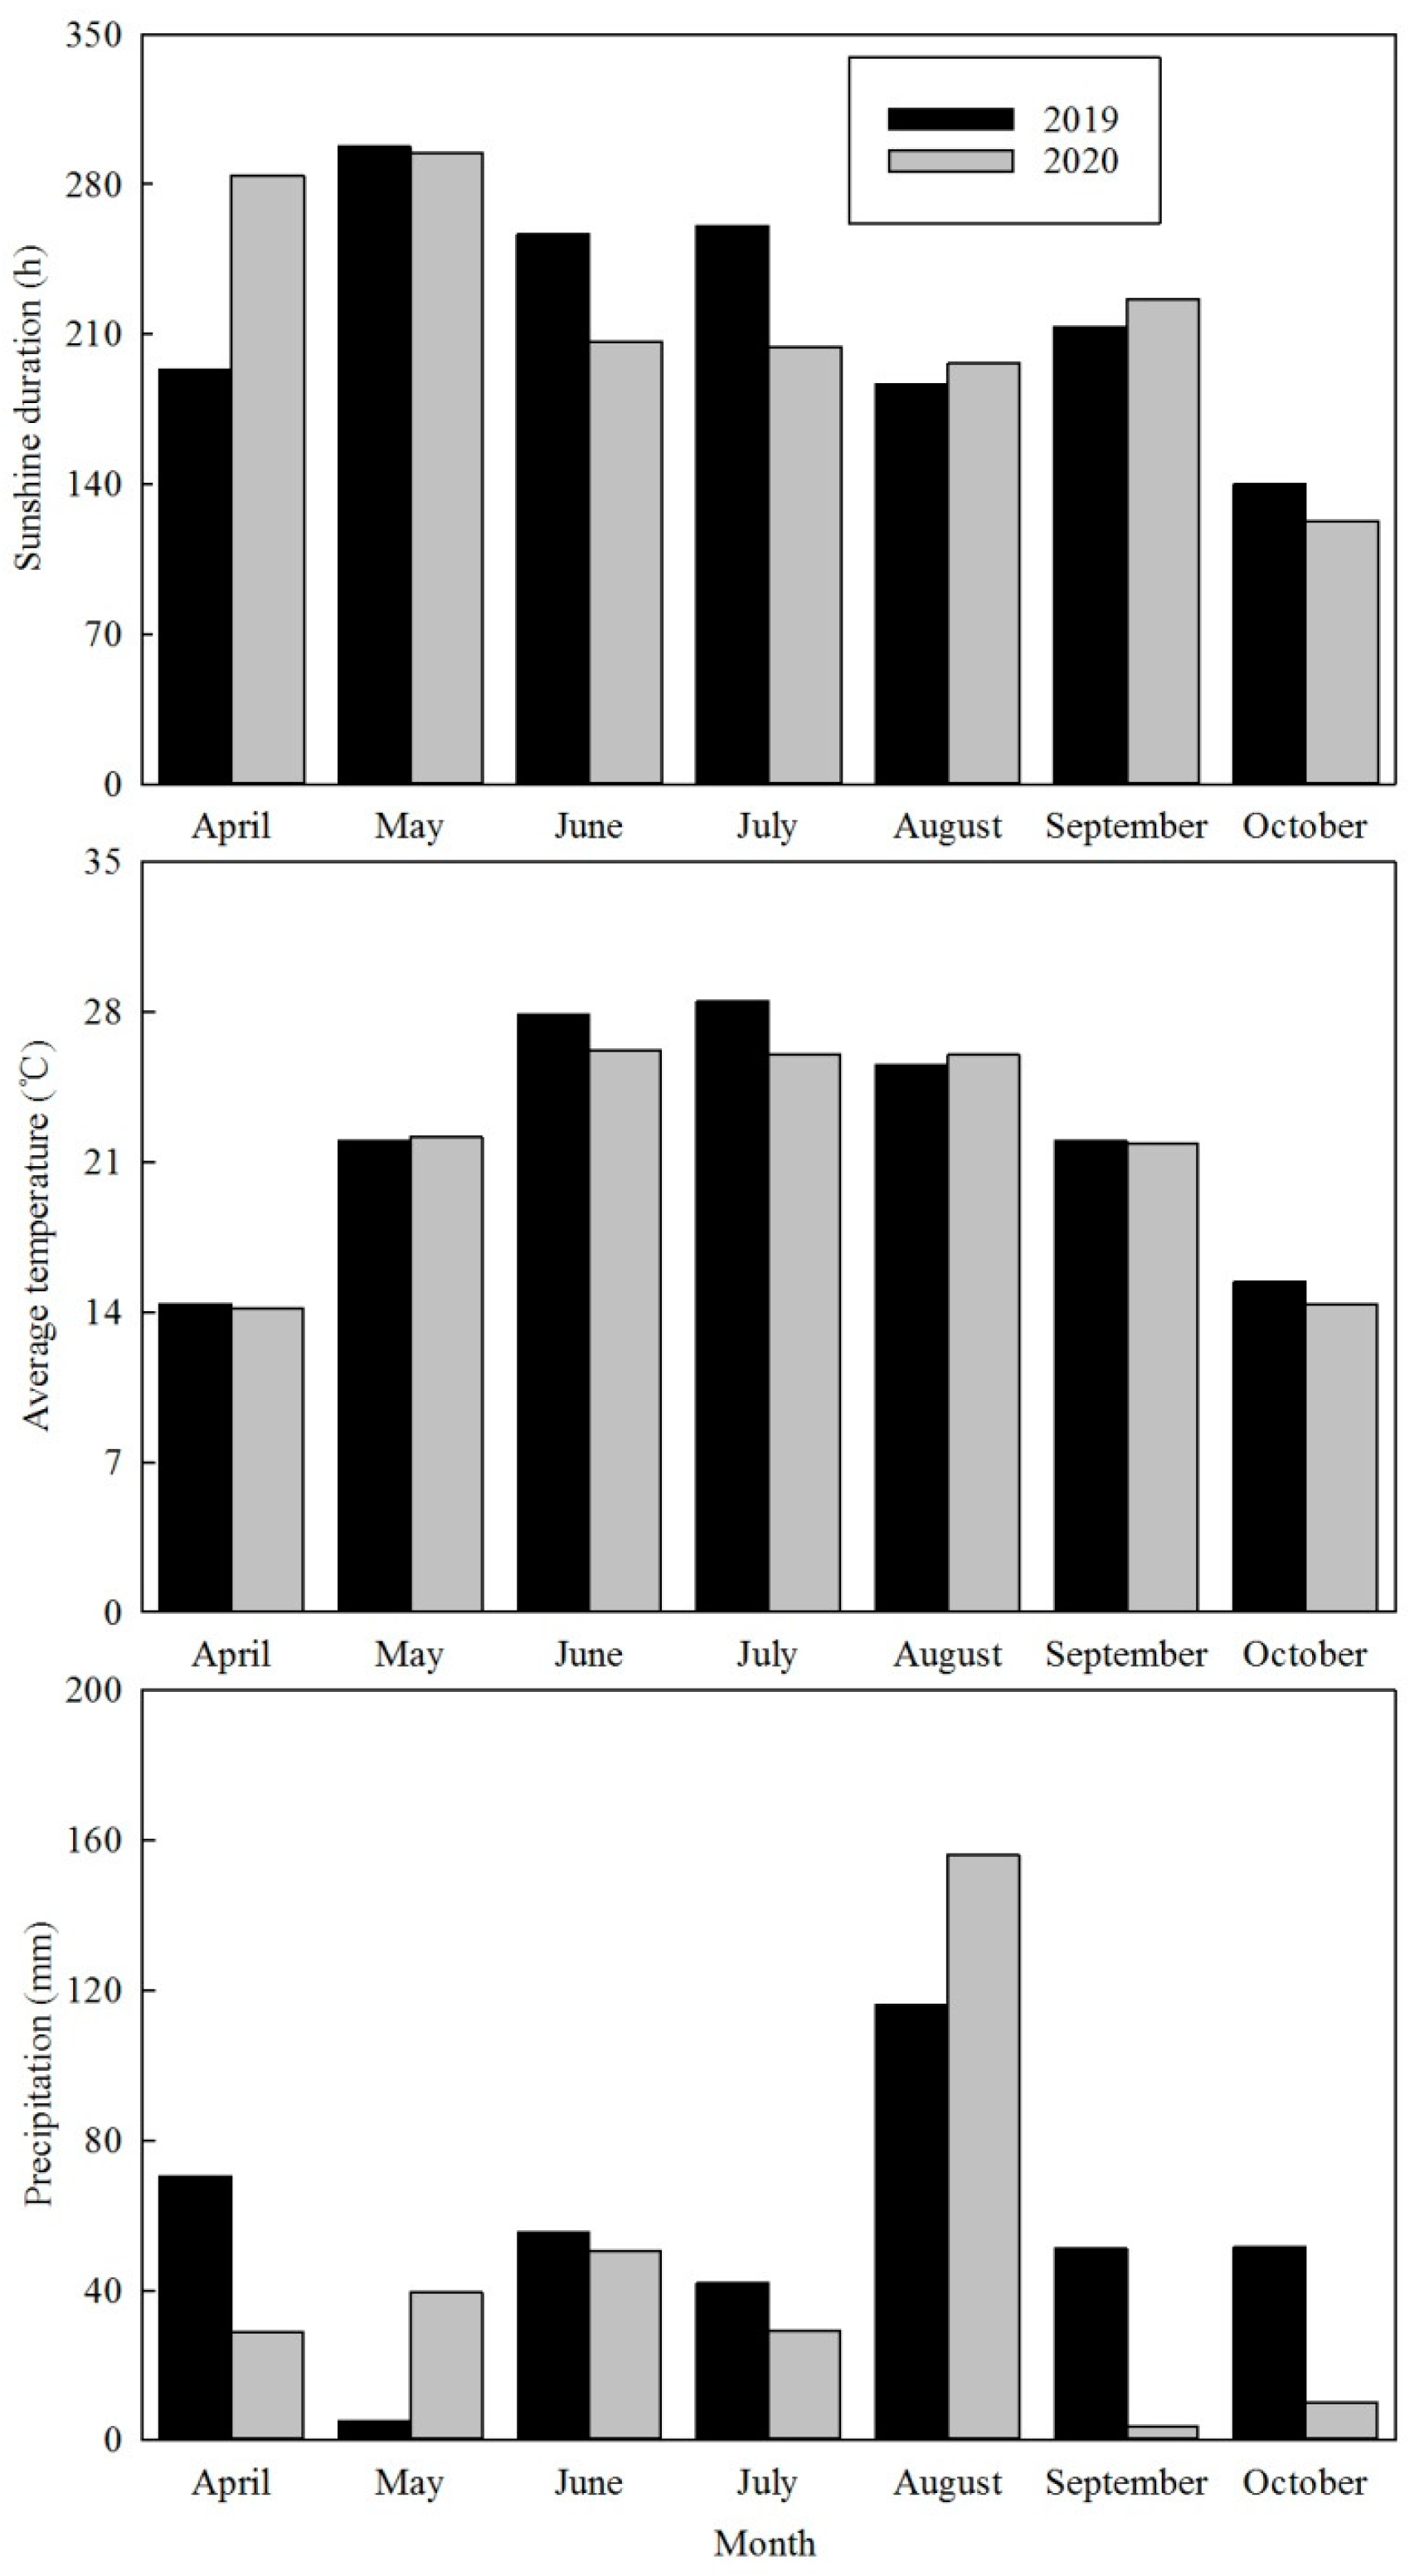
2.1. Description of Experimental Site

Pool-culture experiments were performed at the Institute of Cotton Research, Chinese Academy of Agricultural Sciences (Anyang, Henan Province, China; 36°06′ N and 114°21′ E) in 2019 and 2020. The soil type is classified as Inceptisols (USDA Soil Taxonomy). The experimental soil was clay loam [2], and the soil nutrient profile within 0–20 cm of the soil layer before sowing is presented (Table 1). Figure 1 shows the weather data (including sunshine duration, average temperature, and precipitation) during the 2019–2020 cotton-growing periods.

2.2. Experimental Design and Field Management

Two cotton cultivars with different responses to low-P, CCRI-79 (low-P tolerant) and SCRC-28 (low-P sensitive) were used in this study based on our previous study [26]. The experiment was conducted in a completely random block design at three soil AP levels [26]. The three soil AP levels included: 3 ± 0.5 mg kg−1 (P0, severe soil AP deficiency), 6 ± 0.5 mg kg−1 (P1, mild soil AP deficiency), and 15 ± 0.5 mg kg−1 (P2, as a control) using triple superphosphate (44% P2O5) to adjust soil AP content. The rate of P fertilizer was 0, 50.6, and 202.4 g pool−1 for P0, P1, and P2 in 2019 and 2020. Each pool contained 225 kg N ha−1, with total nitrogen (N), as urea (46% N). The basal fertilizers included 50% total N, total P, and 150 kg K2O ha−1 as potassium sulfate (51% K2O). Moreover, the top application included 50% N fertilizer applied at the beginning of the flowering period [54]. The fertilizers were thoroughly mixed with soils 7 d before planting. After fertilization, each pool was watered sufficiently to dissolve the fertilizer. One month after base manure application, the soil samples were collected, air dried, filtered through a 1 mm sieve, and profiled for AP content using the Olsen-P method [22]. The cotton seeds were sown with a manual drilling machine, leaving 80 cm row spacing. Each pool had five rows with 14.4 m2 area and 52,500 plants ha−1 density. Therefore, the experiments were conducted following the high-yield cotton cultivation management protocol.

2.3. Sampling and Processing

When plants entered the flowering stage, the white flowers of FB2–3, FB6–7, and FB10–11 at the first fruiting position were marked with white plastic tags to record the flowering date [40]. From 10 days post-anthesis (DPA), 8–10 subtending leaves were harvested at 9:00–10:00 a.m. daily for seven days, and the harvested samples were washed in distilled water. Half of the sampled leaves were frozen with liquid nitrogen and stored at −80 °C until enzyme activity determination. In comparison, the other half was dried at 105 °C for 30 min followed by 70 °C until the weight remained unchanged for P concentration and carbohydrate content determination.
When the bolls opened, 20 bolls with boll walls were harvested manually at FB1–4, FB5–8, and FB9–12 [55]. Subsequently, the bolls were divided into boll walls, seeds, and lint. The boll walls and seeds were dried at 70 °C, and the lint at 35 °C to a stable state and weighed. The lint percentage was determined after ginning cotton lint from seeds. The final boll number (according to the FBP) was determined from ten uniformly grown cotton plants. Next, the lint yield at the three FBPs was calculated by the total biomass of lint.

2.4. Leaf Photosynthesis

The net photosynthetic rate (Pn) of the subtending leaves at the first fruiting positions of FB2–3, FB6–7, and FB10–11 were determined at 10, 17, 24, 31, 38, and 45 DPA (9:00 to 11:00 a.m.). The LI-6400XT portable photosynthetic apparatus (LI-COR Biosciences, NE; Li-Cor, Inc., Lincoln, NE, USA) determined the leaf Pn under the settings: light intensity, 1500 μmol m−2 s−1; relative humidity, 65 ± 5%; leaf temperature, 32 ± 2 °C; CO2 concentration, 380 μmol mol−1.

2.5. Leaf Phosphorus Concentration and Carbohydrate Content

The dried leaf samples were grated using an FS-II disintegrator (Zhejiang Top Yunnong Technology Co., Ltd., Hangzhou, Zhejiang, China) with a 0.5 mm sieve. The P concentration was determined using the colorimetric method on an ultraviolet SPECORD 40 spectrophotometer (Analytik Jena GmbH, Jena, Germany).
The dried leaf powder (0.1 g) was put in a 10 mL centrifuge tube containing 80% (v/v) ethanol (5 mL) and mixed for 30 min at 80 °C to extract carbohydrates. After centrifugation (10,000× g, 5 min), the supernatant was poured into a 25 mL volumetric flask. The extraction was performed twice and finally collected and topped to 25 mL with 80% (v/v) ethanol. The soluble sugar and sucrose contents were determined following a previous method [56]. The soluble sugar and sucrose extraction residue was mixed with distilled water (2 mL) and incubated in boiling water for 15 min.
The residue was cooled to 25 °C, HClO4 (2 mL, 9.2 M) was added to the centrifugal tube and chilled in an ice bath for 15 min to extract starch. Distilled water (4 mL) was added to the extract, mixed, and centrifuged at 10,000× g for 10 min, and the supernatant was collected. Next, the procedure was repeated using HClO4 (2 mL, 4.6 M). Finally, all the supernatants were combined and mixed with distilled water to 25 mL. The starch content was determined using the sulfuric acid anthrone colorimetric method at 620 nm, and the standard curve was drawn using different glucose contents [57].

2.6. Analysis of Leaf Enzymes Activities

The frozen leaf tissues (0.2 g) were ground in an ice bath with cold buffer containing Tris HCl (50 mM, pH 7.5), MgCl2 (1 mM), ethylene diaminetetraacetic acid (1 mM), glycerol(12.5%, v/v), polyvinylpyrrolidone (10%, w/v), and β-Mercaptoethanol (10 mM). The homogenate was centrifuged at 15,000× g, 0–4 °C for 15 min, and the supernatants were reserved for determining the ribulose-1,5-bisphosphate carboxylase-oxygenase (Rubisco, E.C. 4.1.1.39) activity using the method of Liu et al. [58].
Cy-FBPase (E.C. 3.1.3.11) was extracted from frozen leaf samples (0.3 g) with buffer containing Tris-HCl (100 mM, pH 8.2), glycerine (5%, v/v), EDTA (1 mM), and β-mercaptoethanol (15 mM) [59]. Briefly, 1 mL of the reaction solution contained Tris-HCl (100 mM, pH 8.2), MgCl2 (5 mM), EDTA (5 mM), NADP (0.5 mM), phosphoglucoisomerase (2 units), glucose-6-phosphate dehydrogenase (1 unit), and an enzyme solution (50 μL). The reaction was started by fructose-1,6-bisphosphate (60 μL, 60 mM) at 25 °C. The cy-FBPase activity was determined from the per-minute change of light absorption at 340 nm.
However, SPS (E.C. 2.4.1.14) and SuSy (E.C. 2.4.1.13) were extracted using a previously described method [60]. Essentially, each reaction solution (550 μL) contained 50 mM fructose-6-P (for SPS) or fructose (for SuSy in the sucrose synthesis direction), 50 mM of UDP-glucose, 50 mM of extraction buffer, 10 mM of MgCl2, and 200 μL of the supernatant. The mixture was incubated at 30 °C for 30 min, and the reaction terminated using 100 μL 2 mol L−1 NaOH and heated to 100 °C for 10 min. Finally, the mixture was cooled to 25 °C and mixed with 0.1% (w/v) resorcin (1 mL) in 95% (v/v) ethanol and 30% (w/v) HCl (3.5 mL) before incubation at 80 °C for 10 min. The activities of SPS and SuSy were measured using the colorimetric method at 480 nm.

2.7. Statistical Analysis

The means, standard errors, and coefficients of variation (CV, %) were determined using MS Excel 2007 (Microsoft corp., Redmond, WA, USA). The means were subjected to 5% variance analysis with the SPSS statistical software Version 18.0 (IBM corp., New York, NY, USA), using the least significant difference (LSD). The Pearson correlation established the specific relevance of individual variables. The sucrose transformation rate (Tr) of subtending leaves to cotton bolls was determined following the Liu et al. [58] protocol as follows:
Tr = (maximum sucrose content − minimum sucrose content)/maximum sucrosecontent × 100%

3. Results

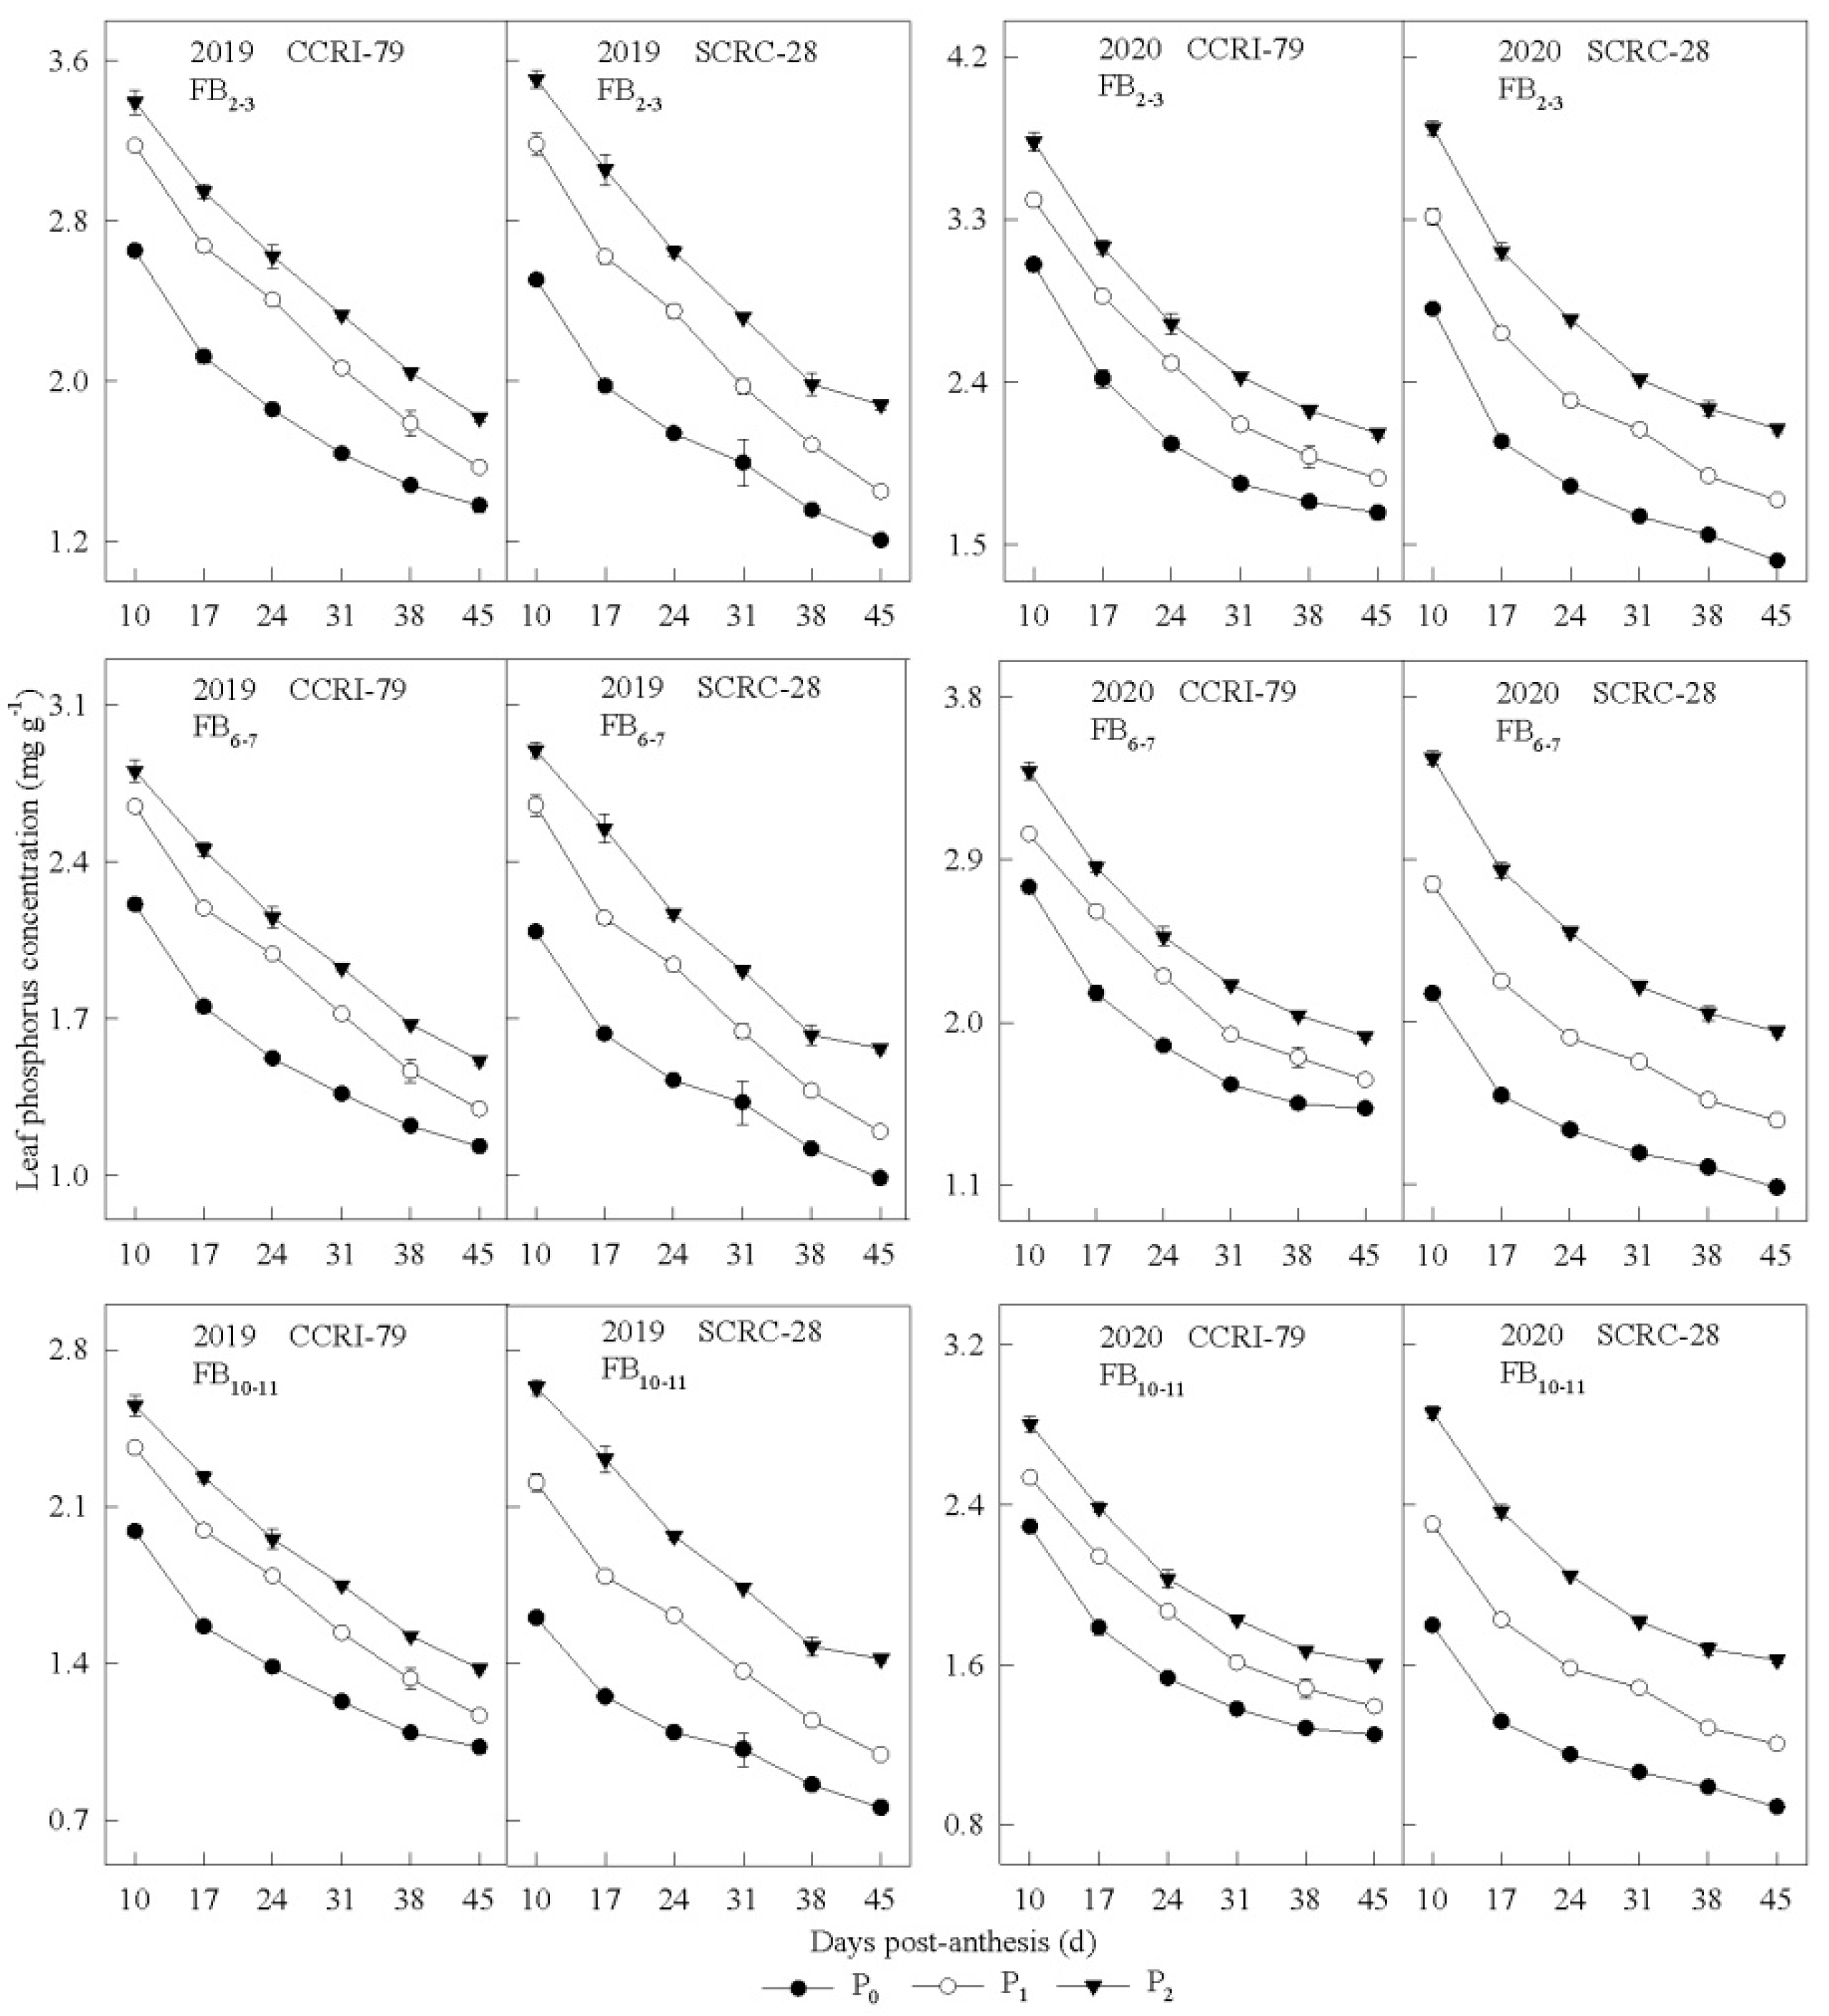
3.1. Phosphorus Concentration in the Subtending Leaves

Soil available phosphorus (AP) deficiency (P0 and P1) reduced the P concentration of leaves subtending the cotton bolls (Figure 2). Soil AP Deficiency (P1 and P0) reduced the average leaf P concentration across the sampling times by 9.8–10.6% and 24.3–24.9% (CCRI-79), and 14.4–18.9% and 32.0–38.7% (SCRC-28), respectively, for FB2–3, FB6–7, and FB10–11 (Figure 2). In SCRC-28, soil AP deficiency decreased the P concentration in the FB10–11 subtending leaves compared to FB2–3 and FB6–7. In contrast, the effect was negligible among the three FBPs of CCRI-79 (Figure 2). Additionally, the P concentration in the subtending leaves decreased gradually over increasing days post-anthesis (DPA) and fruiting branch positions (FBP) (Figure 2).
However, increasing the soil AP content (P0 to P2) decreased the decline rate of leaf P at the three FBPs (except for P1 for both cultivars during the two years). The average concentration of leaf P in CCRI-79 and SCRC-28 was 1.7–2.3 mg g−1 and 1.5–2.3 mg g−1 for the three soil AP treatments, but the variation was higher in SCRC-28 than CCRI-79. Under P1 and P0, the concentrations of leaf P were 8.1 and 18.3% higher in CCRI-79 than SCRC-28 and 1.1% lower than SCRC-28 under P2 (Figure 2).

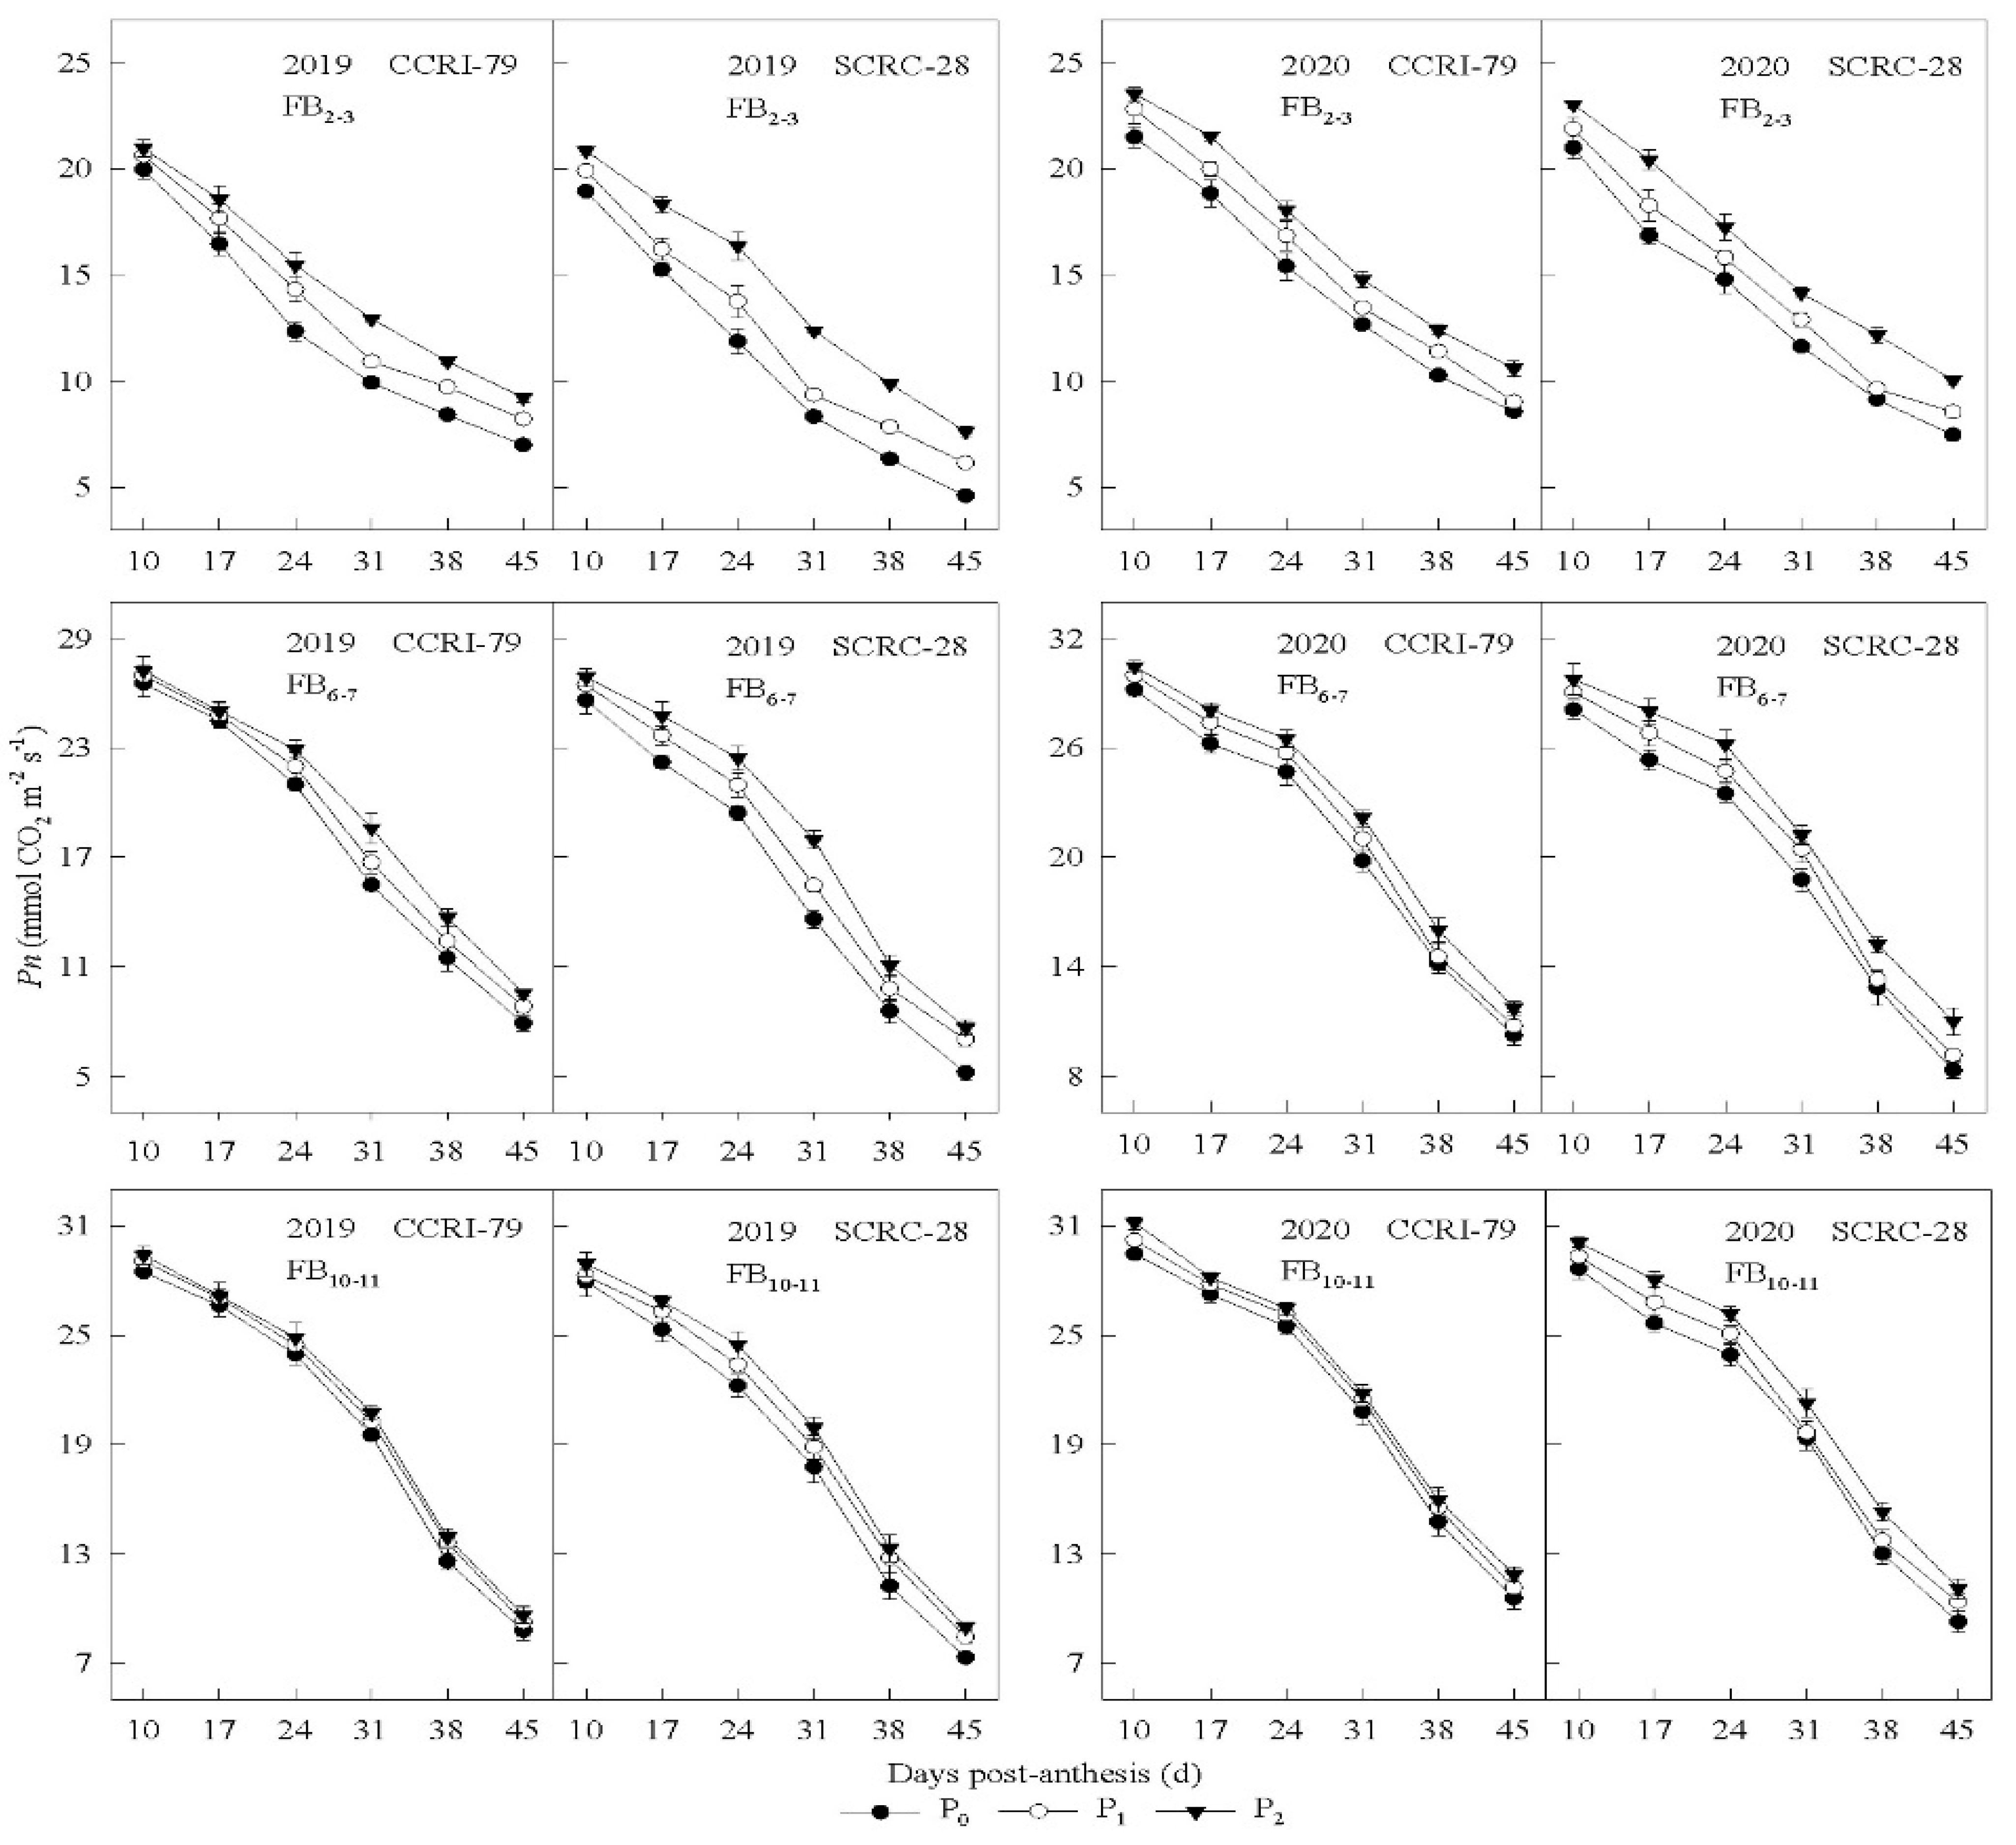
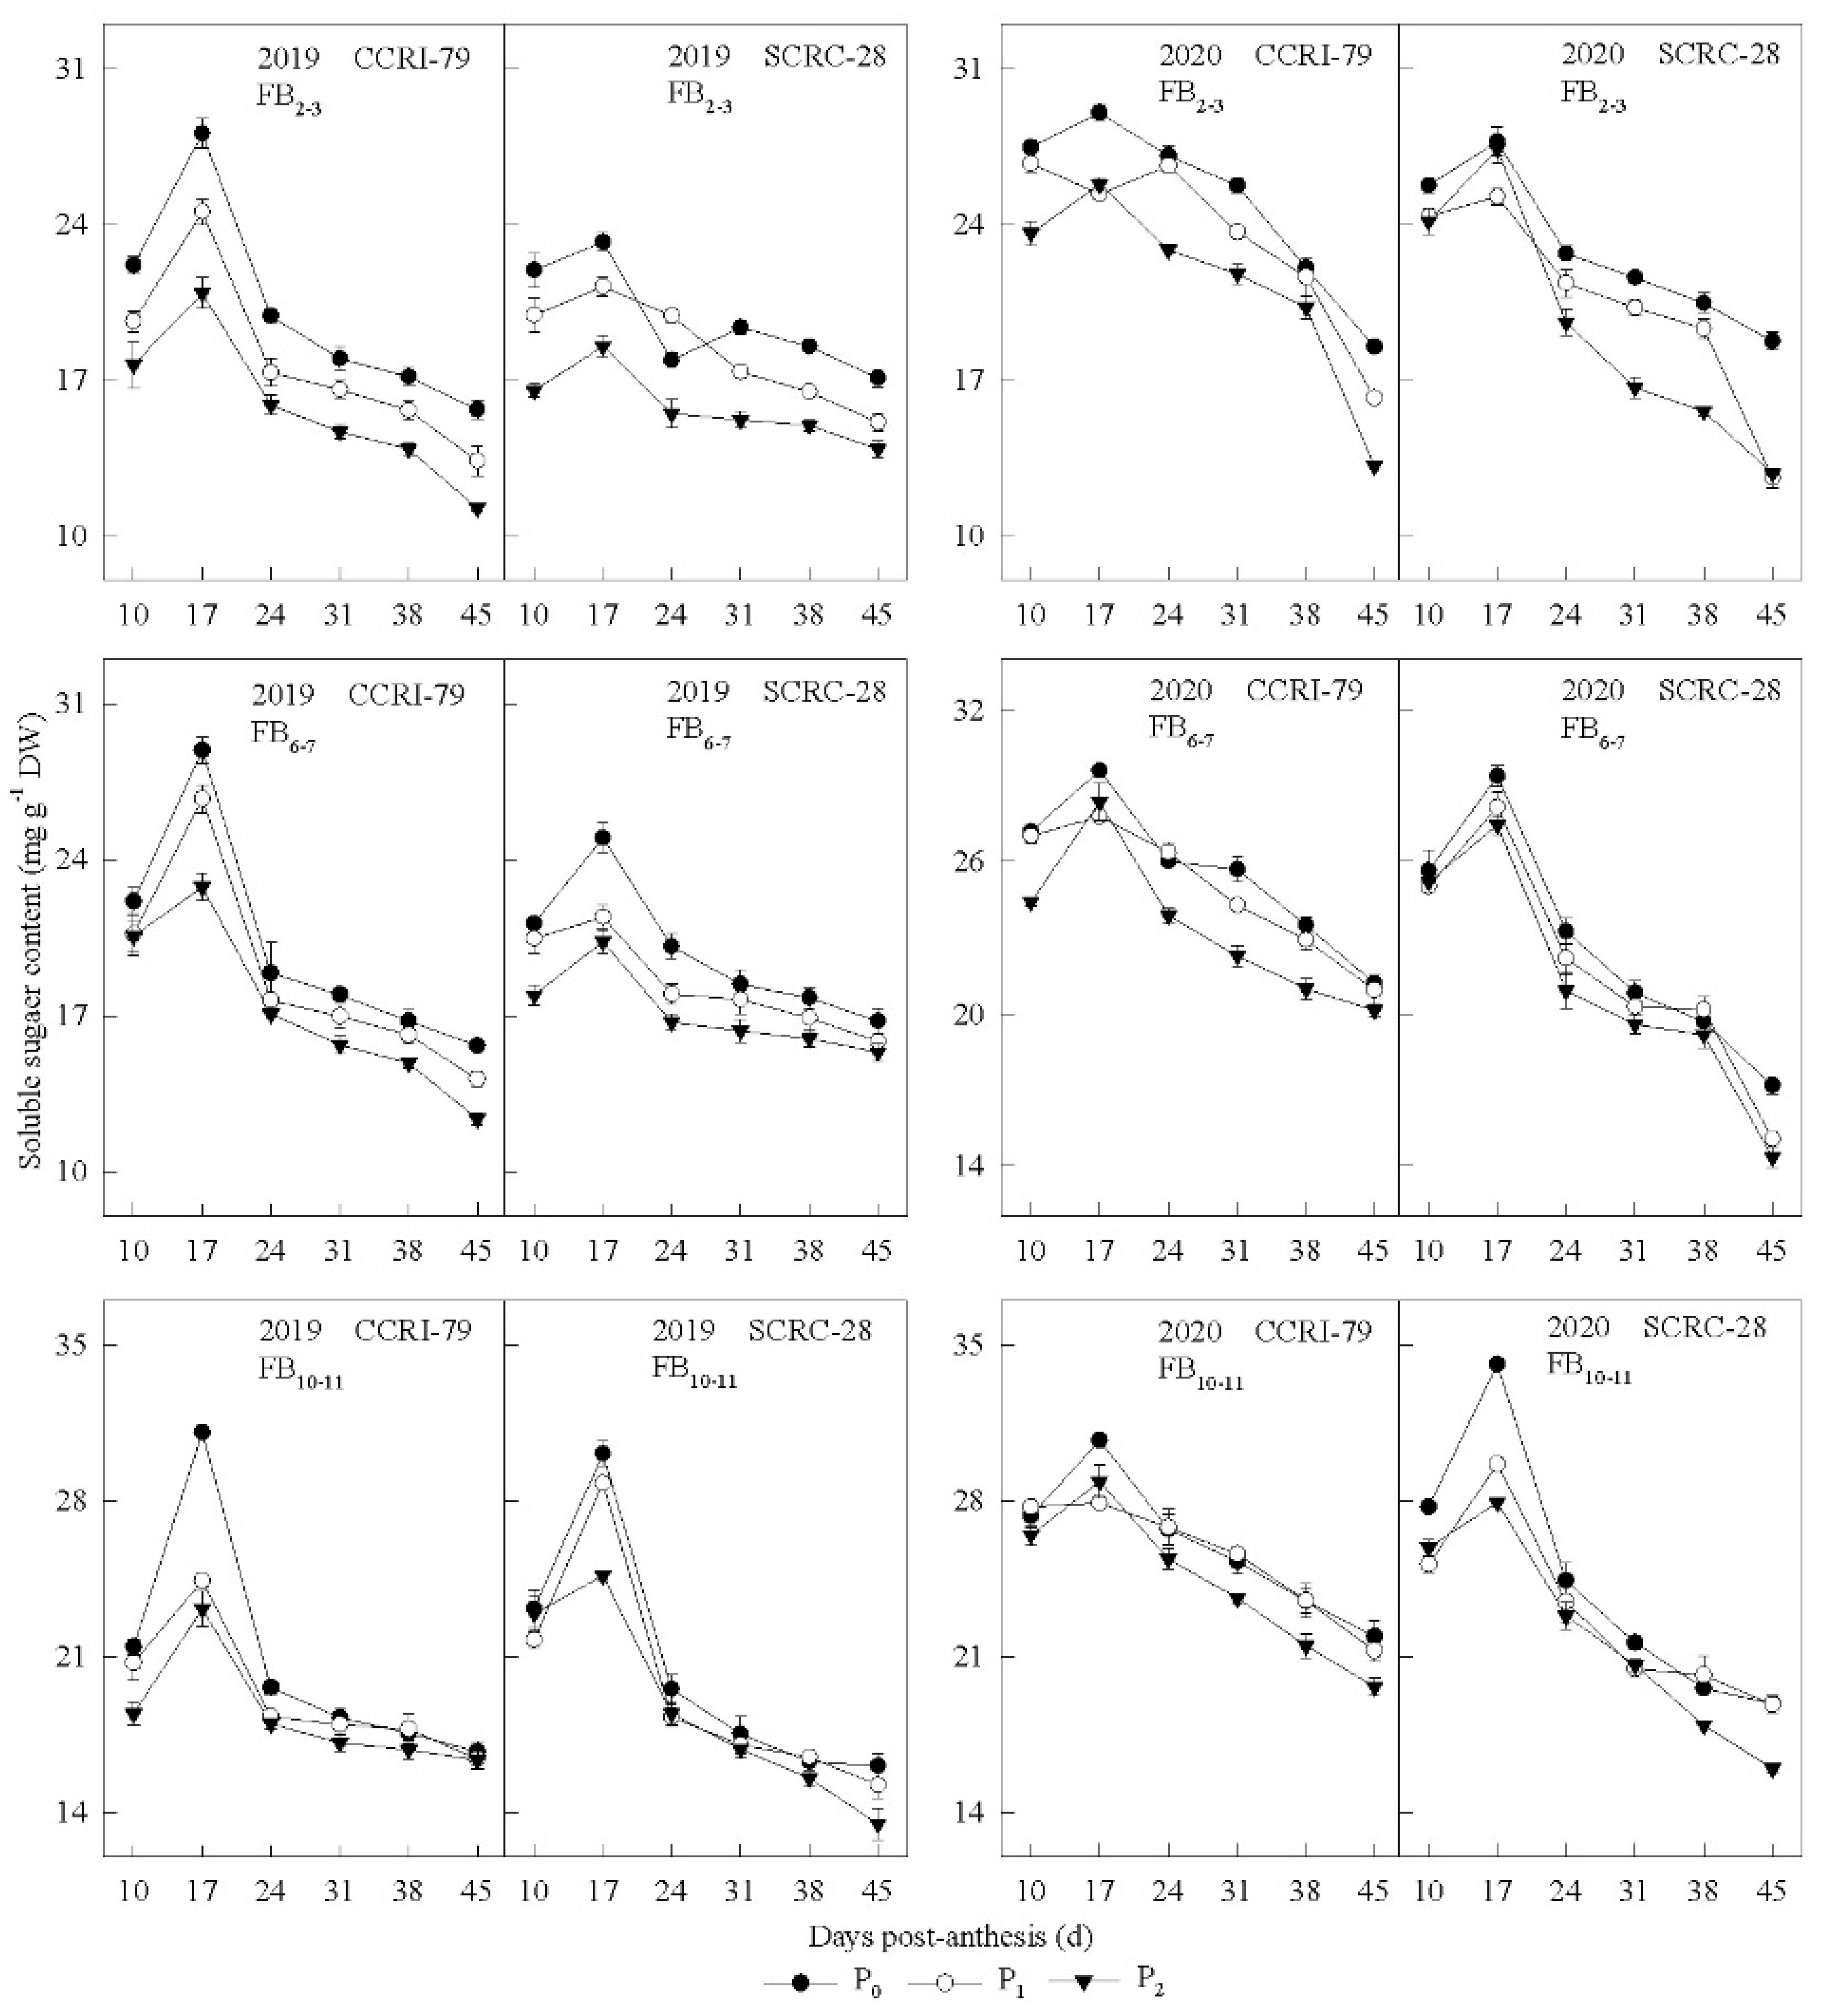
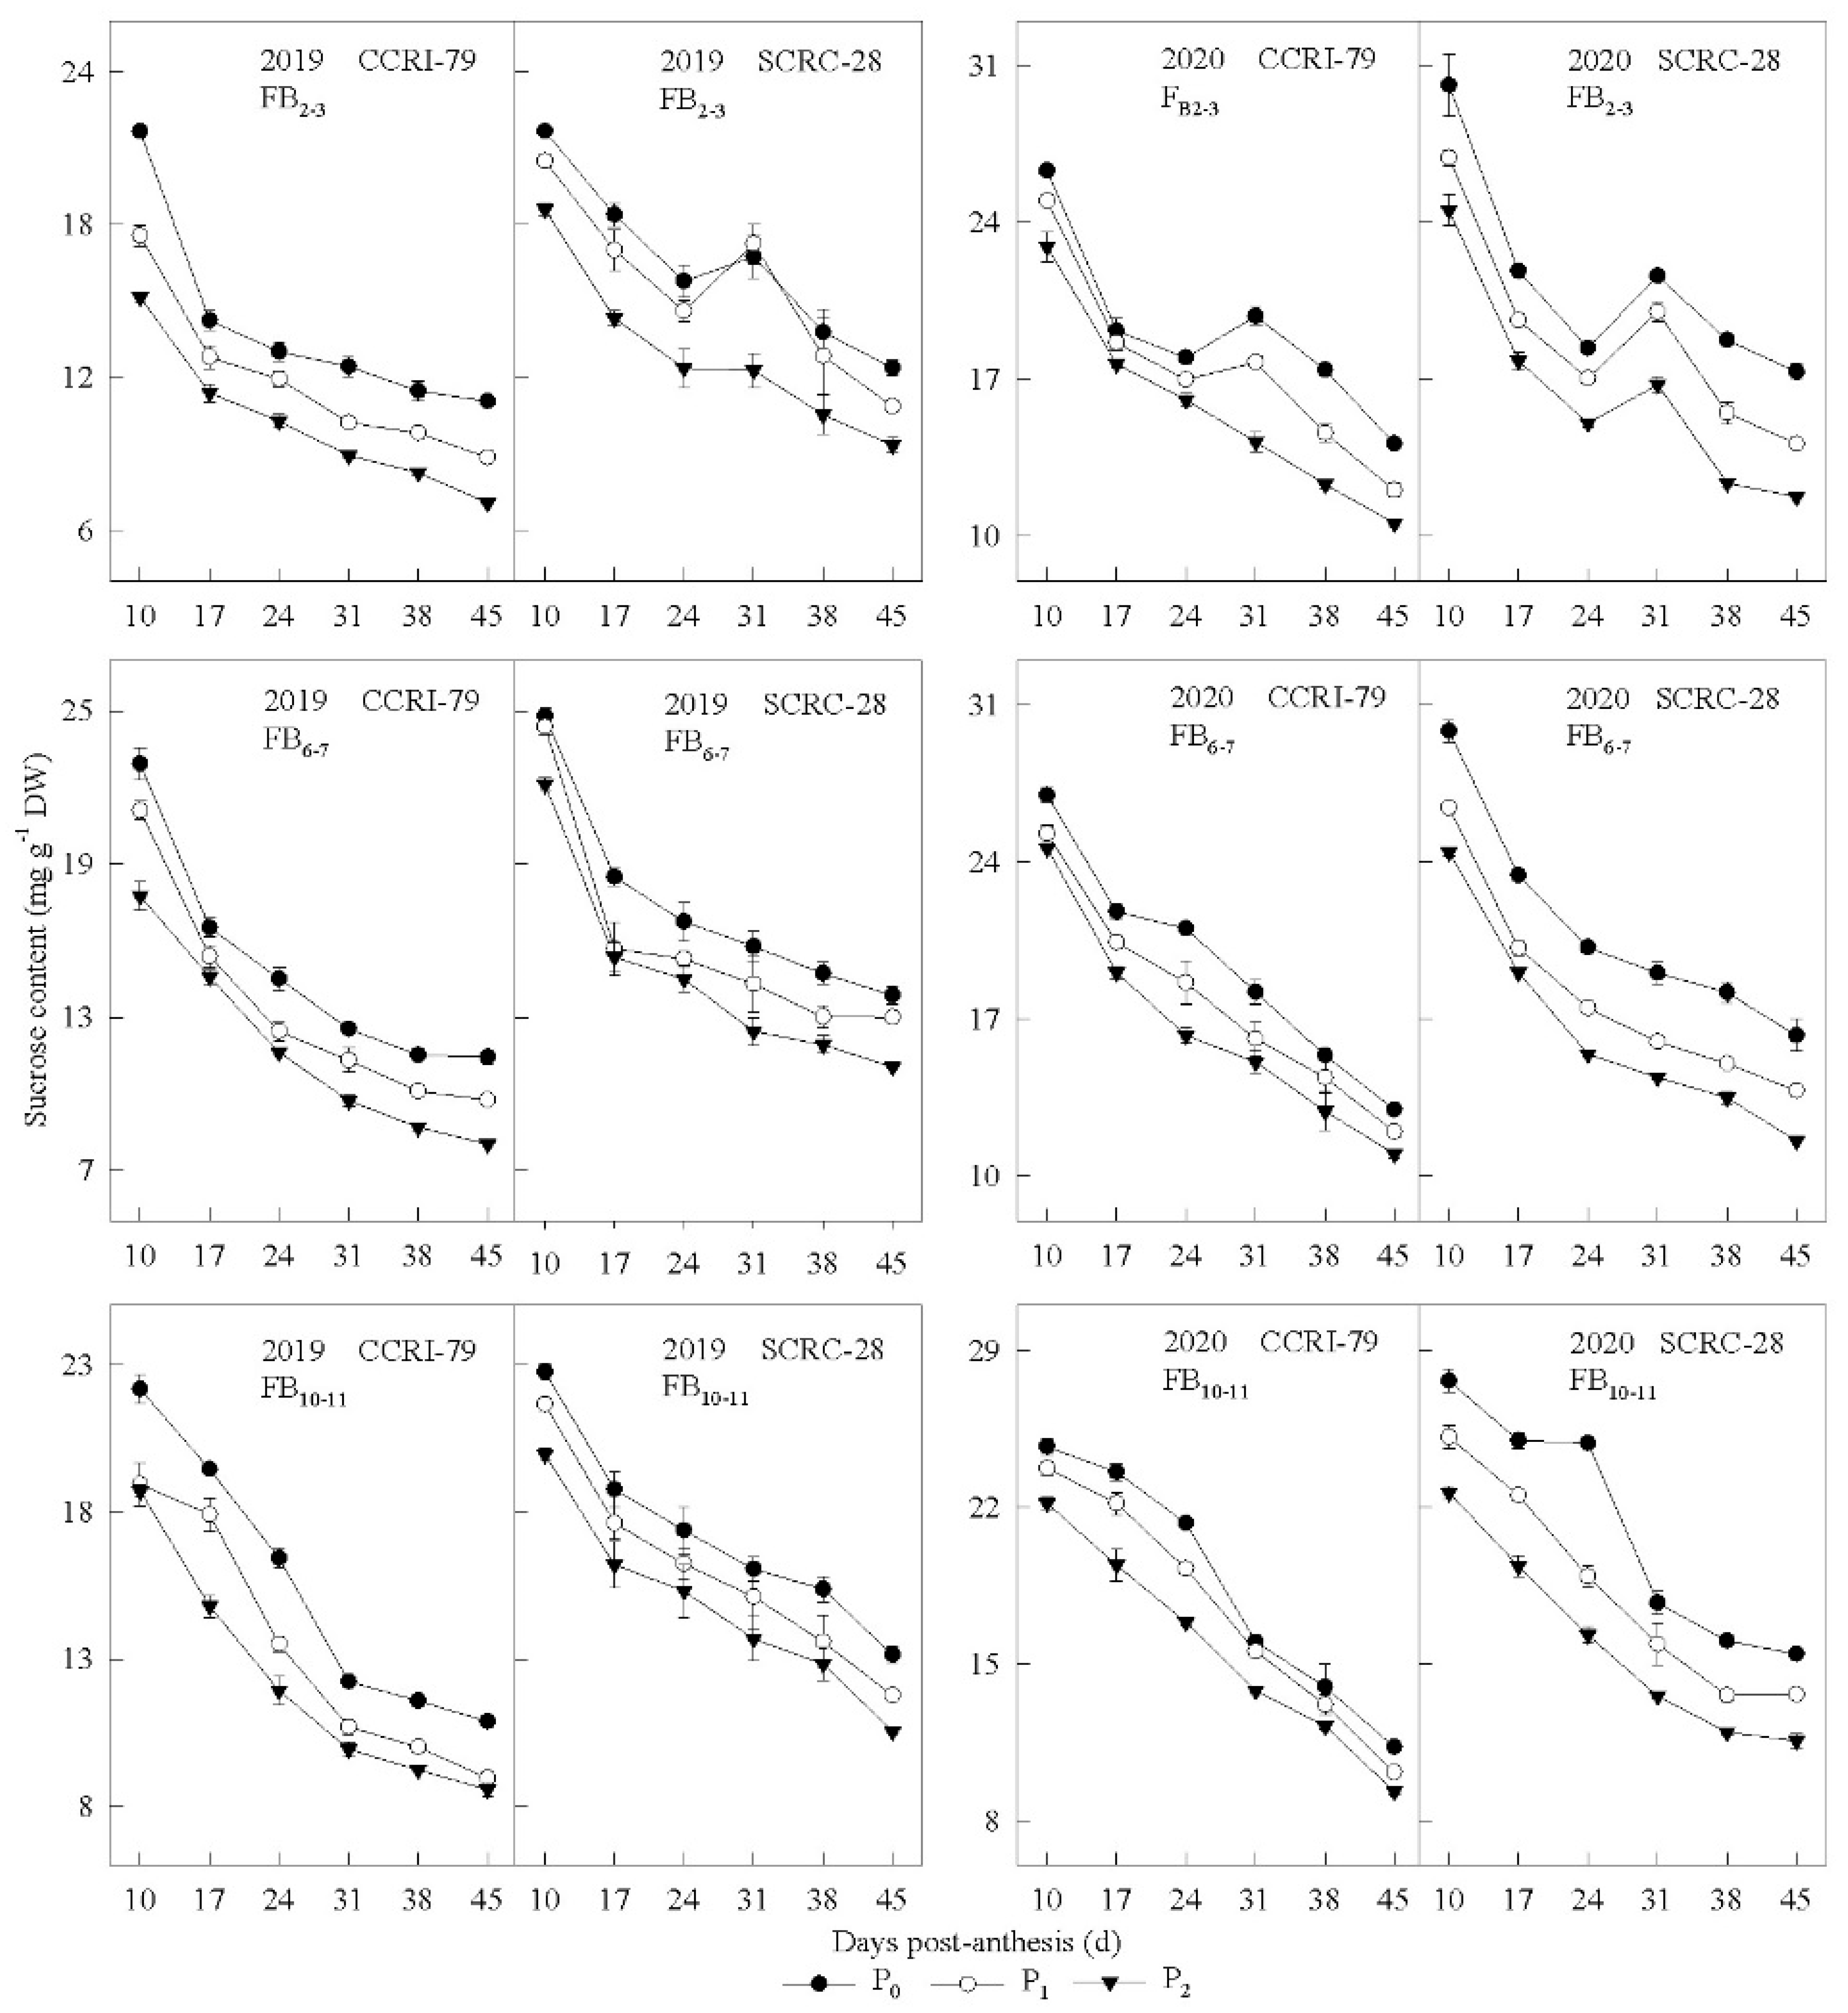
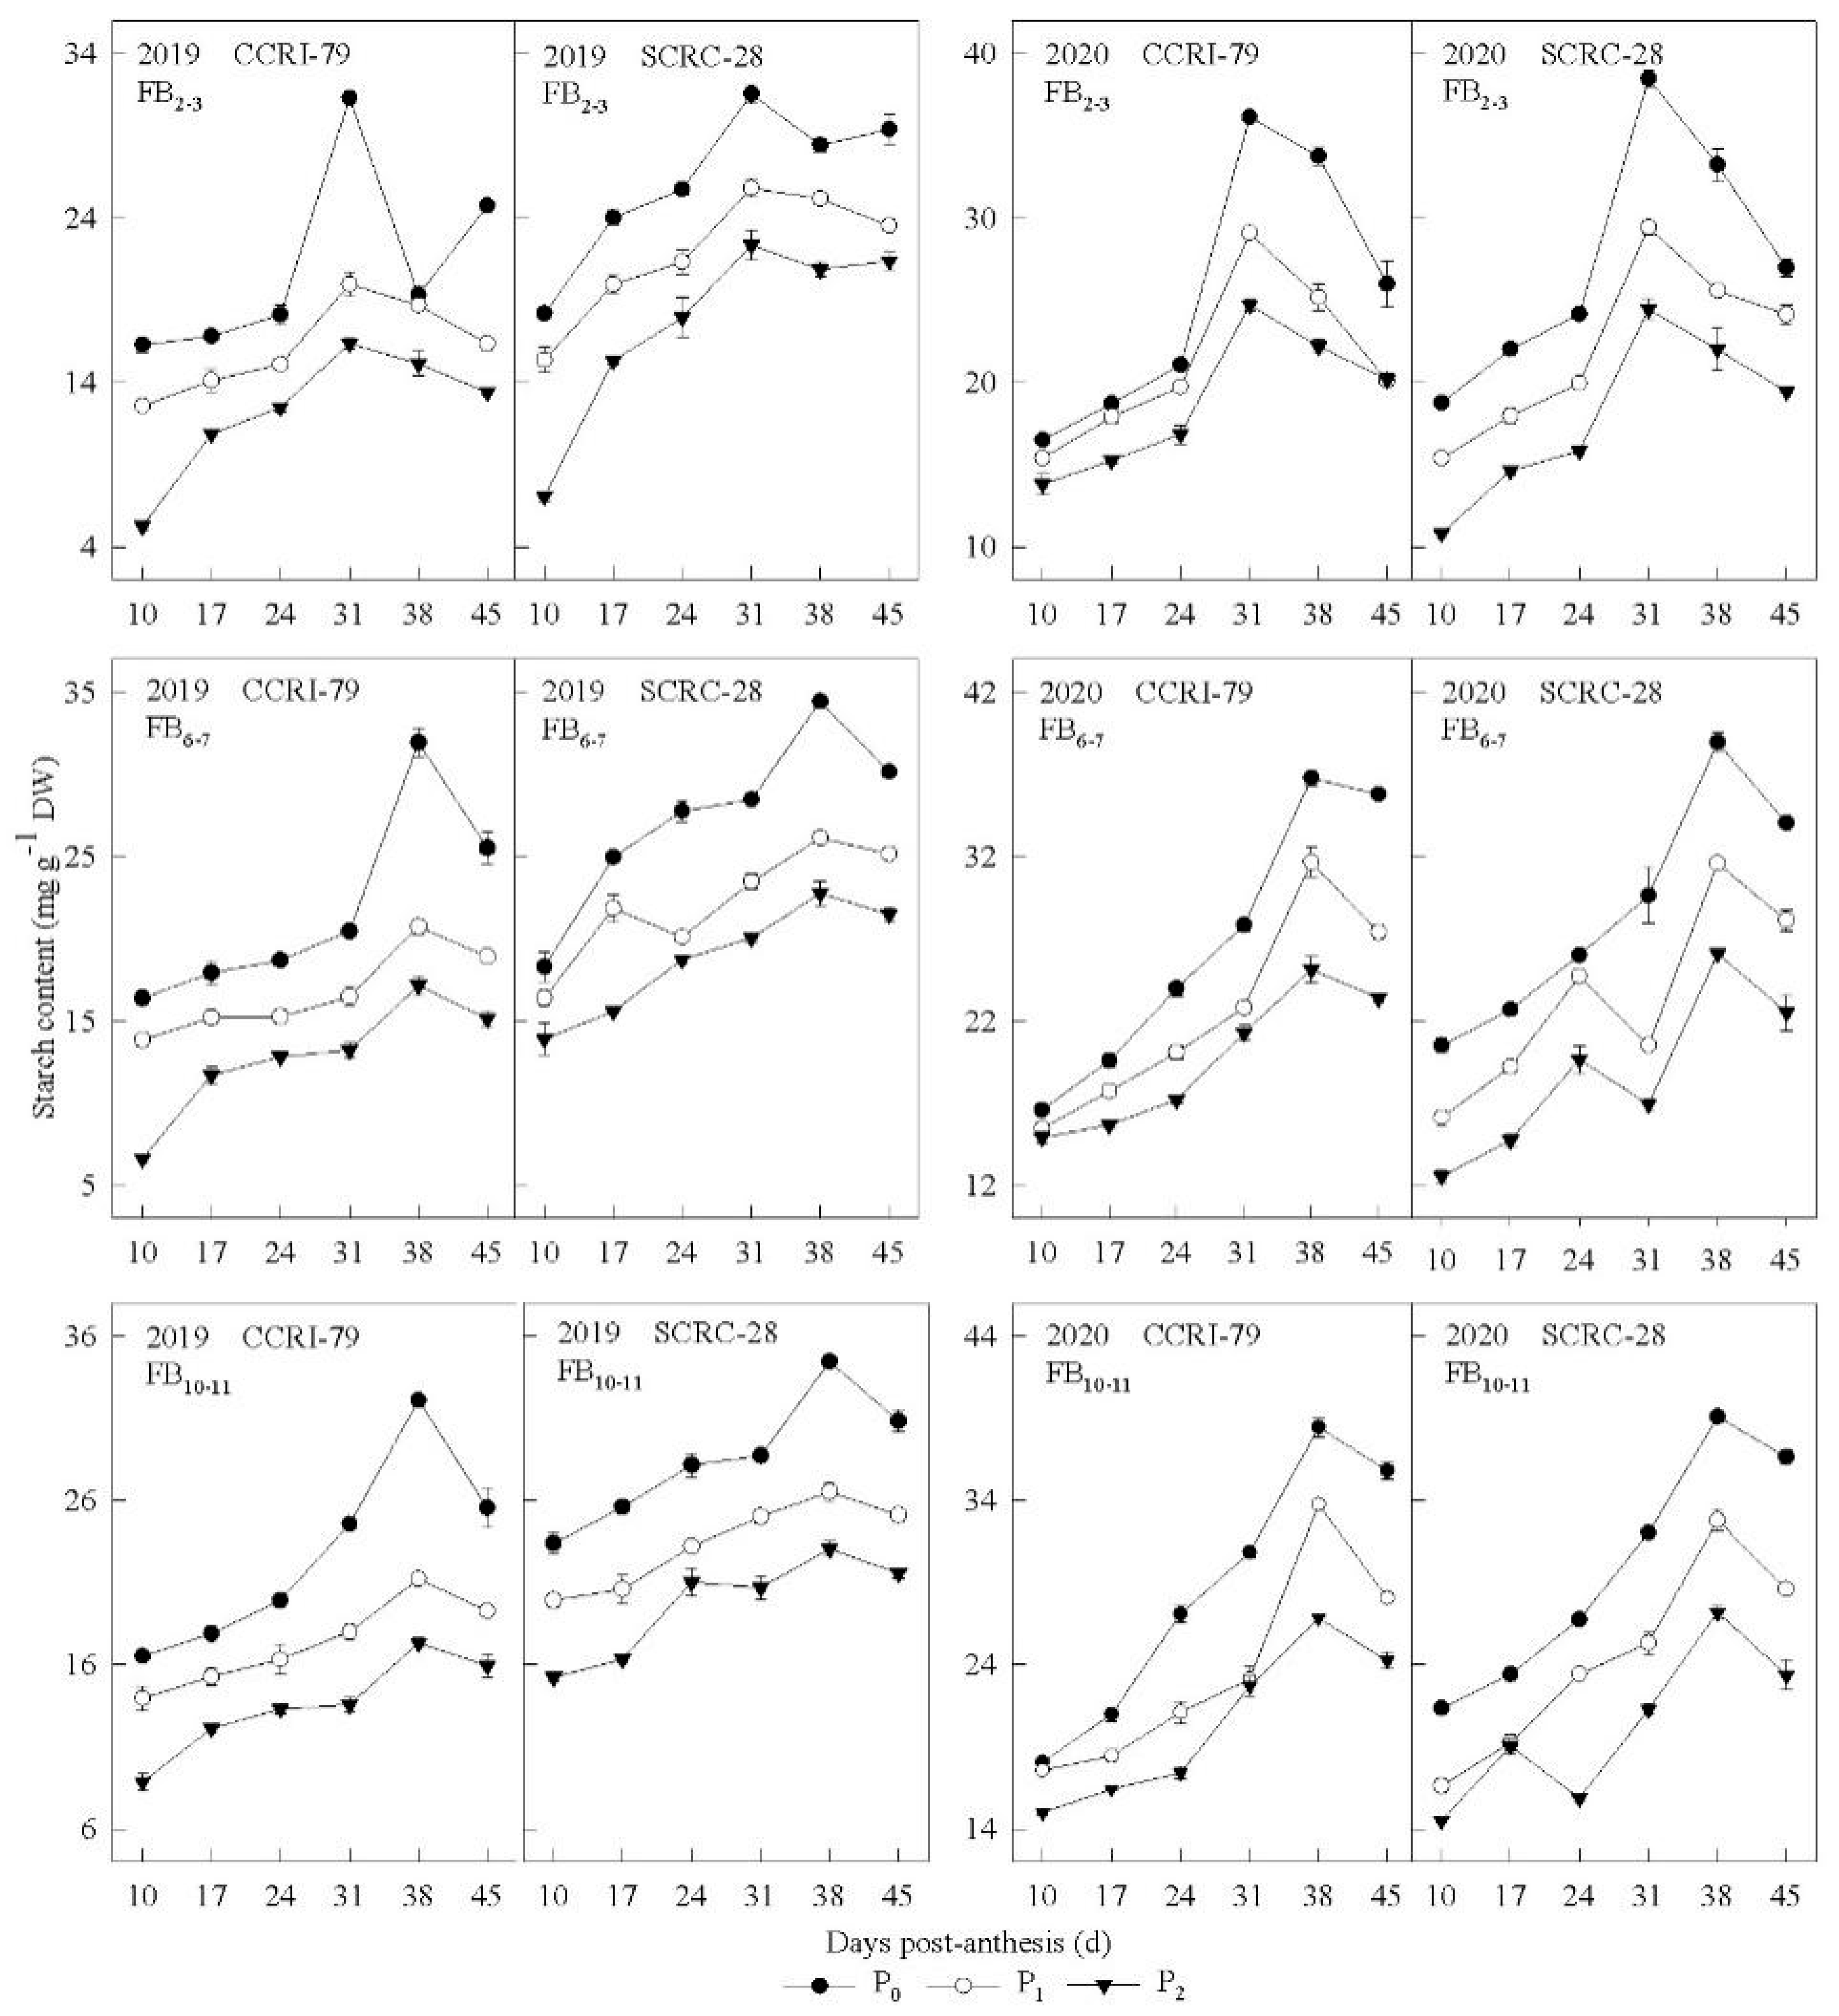
3.2. Pn and Carbohydrate Content in the Subtending Leaves

The Pn of subtending leaves from the three FBPs declined with increasing DPA (Figure 3). Under P1 and P0, the Pn at the three FBPs decreased by 2.0–7.5% and 5.0–14.7% in CCRI-79, and by 4.6–12.2% and 9.0–19.9% in SCRC-28 over the two years (Figure 3). In addition, the subtending leaves of FB10–11 registered lower Pn decline rates than FB2–3 and FB6–7 from both cultivars in the two years. The Pn of CCRI-79 was 6.7 and 8.8% higher than SCRC-28 under P1 and P0 treatments, respectively. In contrast, the Pn was 3.4% higher in CCRI-79 than SCRC-28 in 2019 and 2020 under P2 treatment (Figure 3).
The soluble sugar contents of the subtending leaves increased between 10 and 17 DPA and reduced between 17 and 45 DPA (Figure 4). Essentially, the soluble sugar content increased by 5.1–11.5% and 9.7–22.1% in CCRI-79, and 5.1–10.6% and 10.7–21.0% in SCRC-28 under P1 and P0 treatments, respectively, across the FBPs and years.
Nonetheless, the sucrose content in the subtending leaves reduced with increasing DPA, especially during the early (10–17 DPA) than the late stage (17–45 DPA) (Figure 5). In CCRI-79, the sucrose content increased by 10.2–13.8% and 21.6–28.3%, respectively, under P1 and P0 compared to P2 at the three FBPs in 2019 and 2020. A similar trend was recorded in SCRC-28 with 10.1–17.4% and 24.5–29.1% increments under the same condition and growth period (Figure 3). Increasing soil AP (P0 to P2) decreased the sucrose contents and maximum/minimum sucrose contents of both cultivars at the three FBPs (Table 2). However, the sucrose transformation rate (Tr) increased with increasing soil AP content.
In CCRI-79, Tr decreased by 1.9–2.9% and 4.1–5.9%, but SCRC-28 registered 2.3–4.2% and 4.8–8.3% declines under P1 and P0 treatments at the three FBPs in both years. However, the Tr was 5.7 and 6.5% higher in CCRI-79 than SCRC-28 under P1 and P0, and 4.8% higher in CCRI-79 than SCRC-28 under P2. In addition, the coefficients of variation (CVs) of the Tr were higher in the SCRC-28 than the CCRI-79 subtending leaves (except for FB10–11 in 2020) at the three FBPs (Table 2).
During boll development, the starch contents of the subtending leaves showed a unimodal curve, and peak values appeared 31–38 DPA (Figure 6). In CCRI-79, the starch content increased by 20.2–21.2% and 49.4–51.0% in P1 and P0 compared to P2 across the FBPs and years. Cultivar SCRC-28 had 19.7–24.3% and 46.4–51.3% starch content increments under the same conditions and seasons. Additionally, the subtending leaves of FB6–7 and FB10–11 delayed attaining the peak starch content (at 38 DPA) compared to those of FB2–3 (at 31 DPA). Under the same soil AP treatment, the subtending leaves of FB10–11 had higher starch contents than those of FB2–3 and FB6–7. Meanwhile, the average carbohydrate content (soluble sugar, sucrose, and starch) and Tr over the two years were more affected by soil AP deficiency at FB2–3 and FB6–7 than FB10–11 in both cultivars. The carbohydrate content variation was consistent for both cultivars in 2019 and 2020.

3.3. Correlation of the Carbohydrate Content and Phosphorus Concentration of Subtending Leaves

Carbohydrate content (soluble sugar, sucrose, and starch) is an important index for characterizing the “source” activity of leaves [40]. From 10 to 45 DPA, P concentrations had significant negative correlations with the soluble sugar contents of the subtending leaves of both cultivars, especially at 17 DPA (p < 0.05) (Table 3). The P concentration, sucrose content (at 17–24 DAP, (p < 0.05)), and starch content (at 10–45 DPA, (p < 0.05)) of the subtending leaves were all significantly negative in SCRC-28 but nonsignificant in CCRI-79 (Table 3).

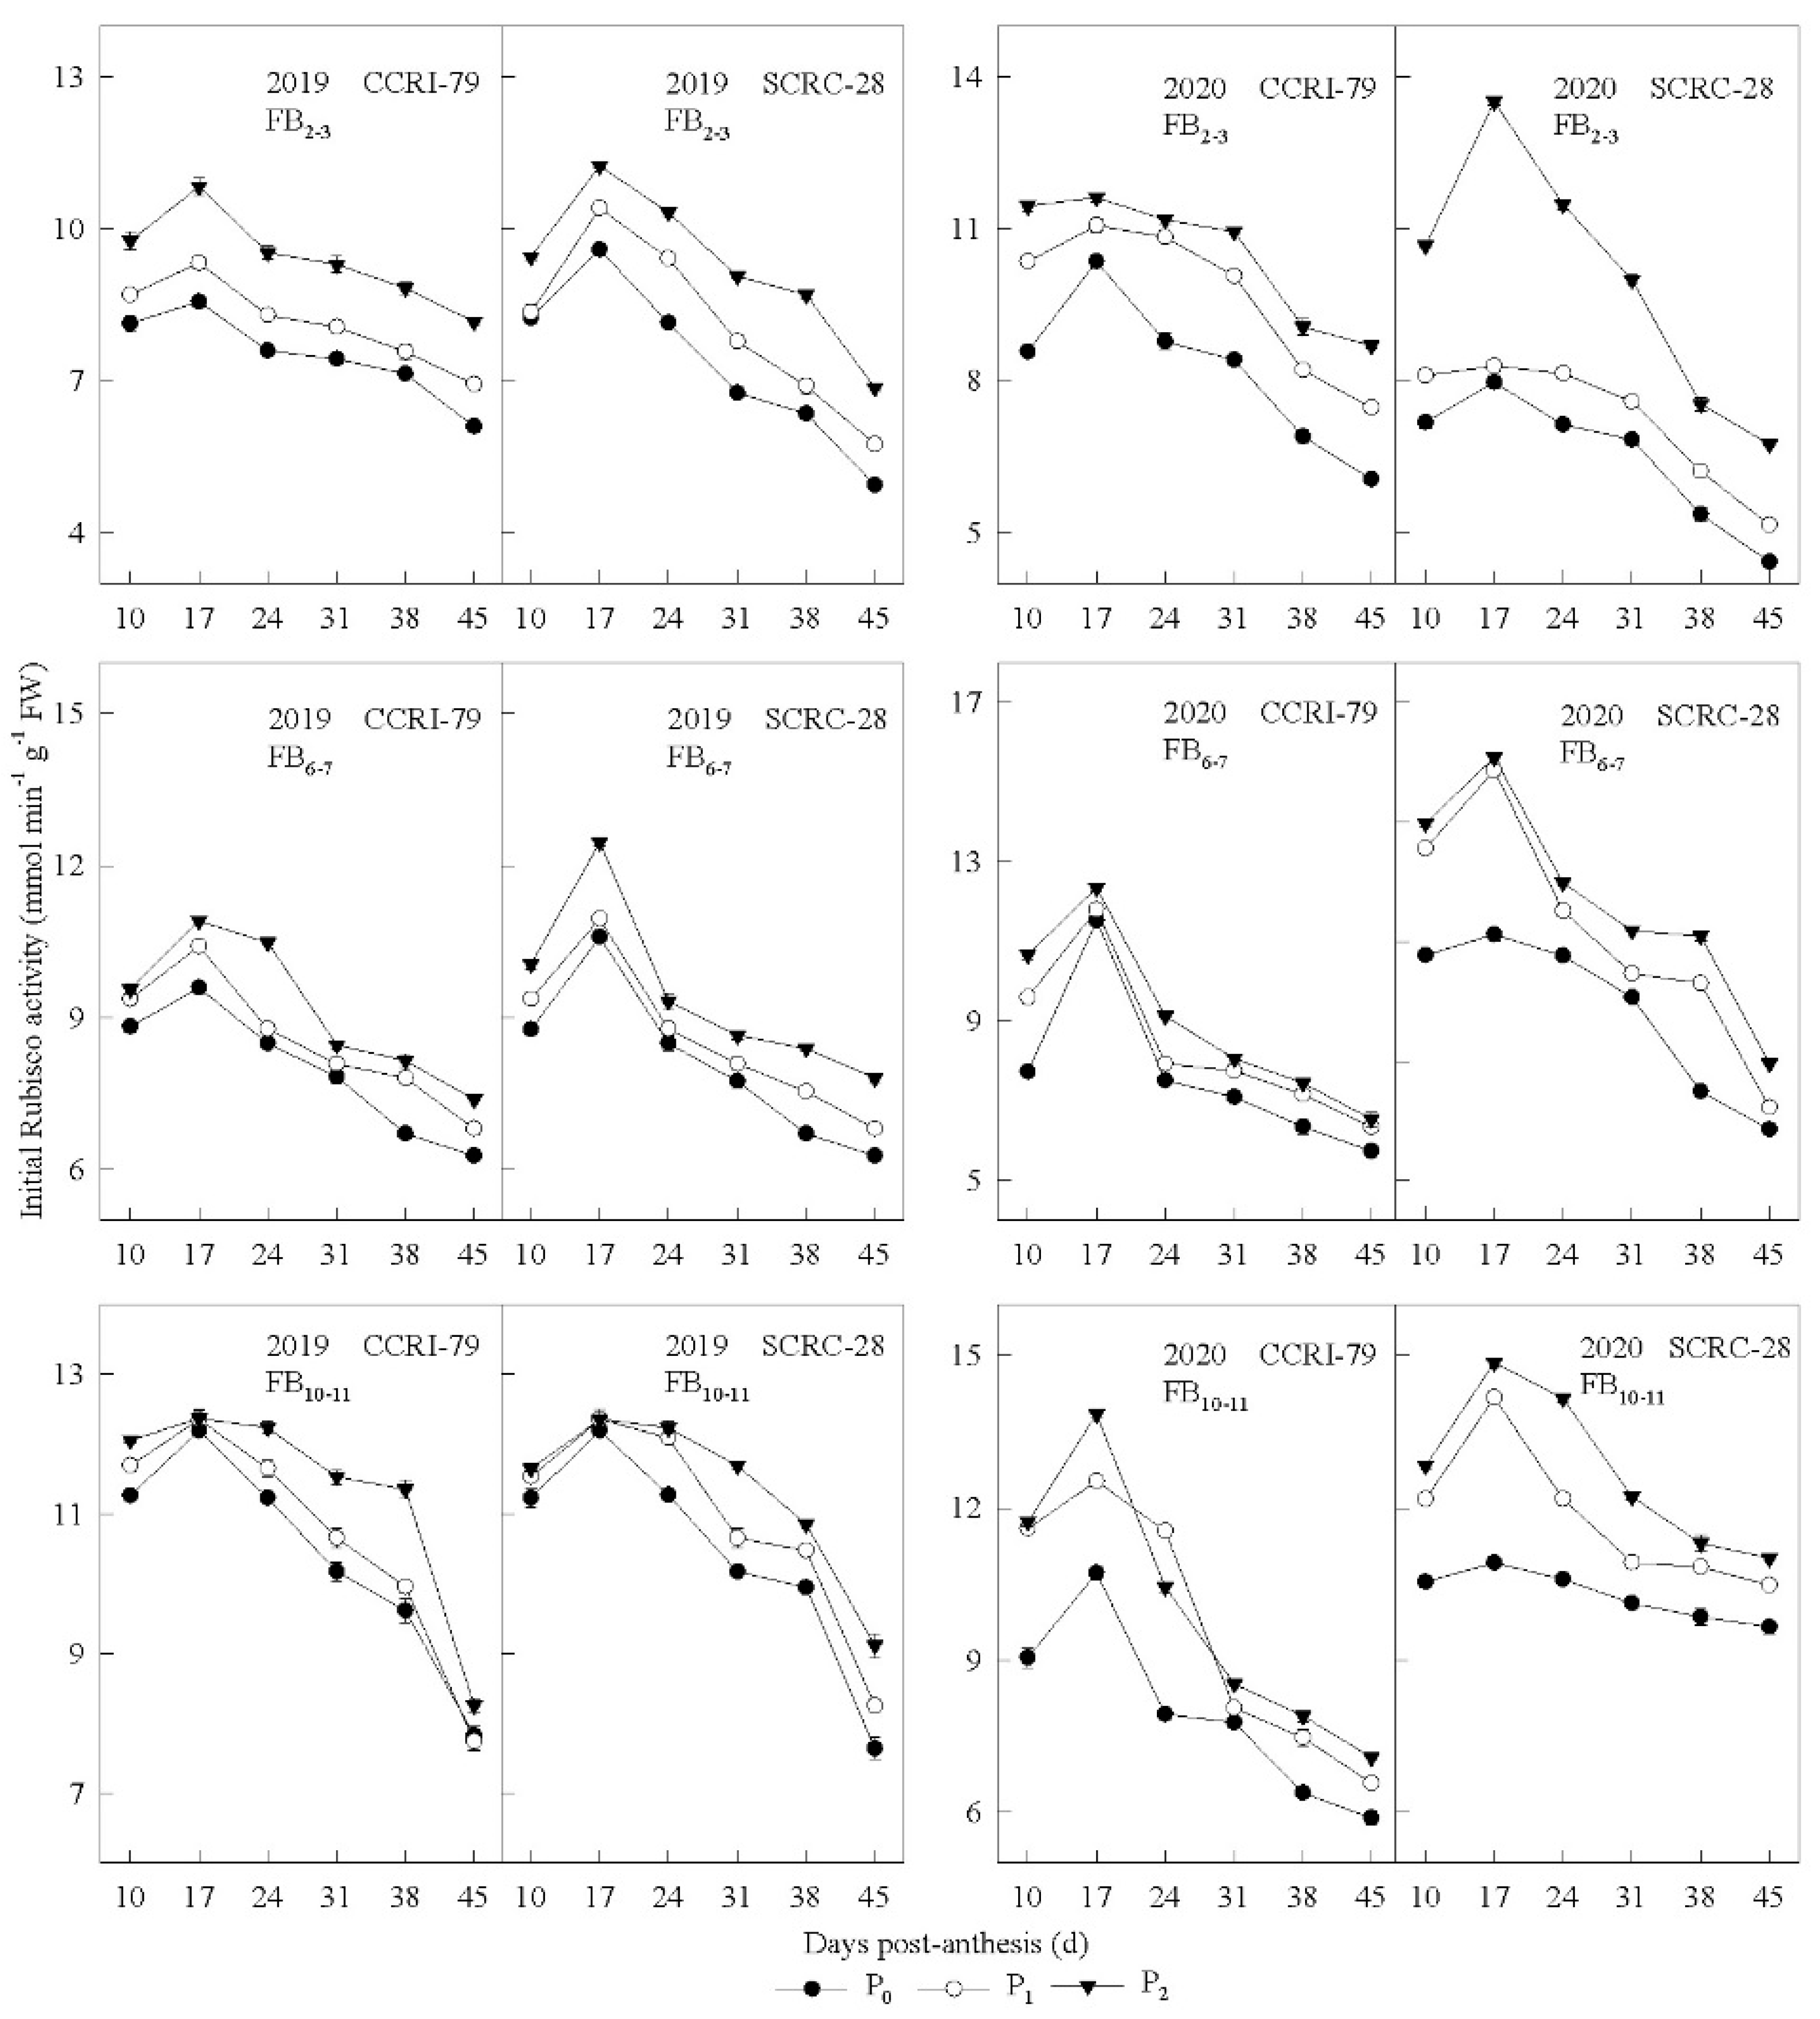
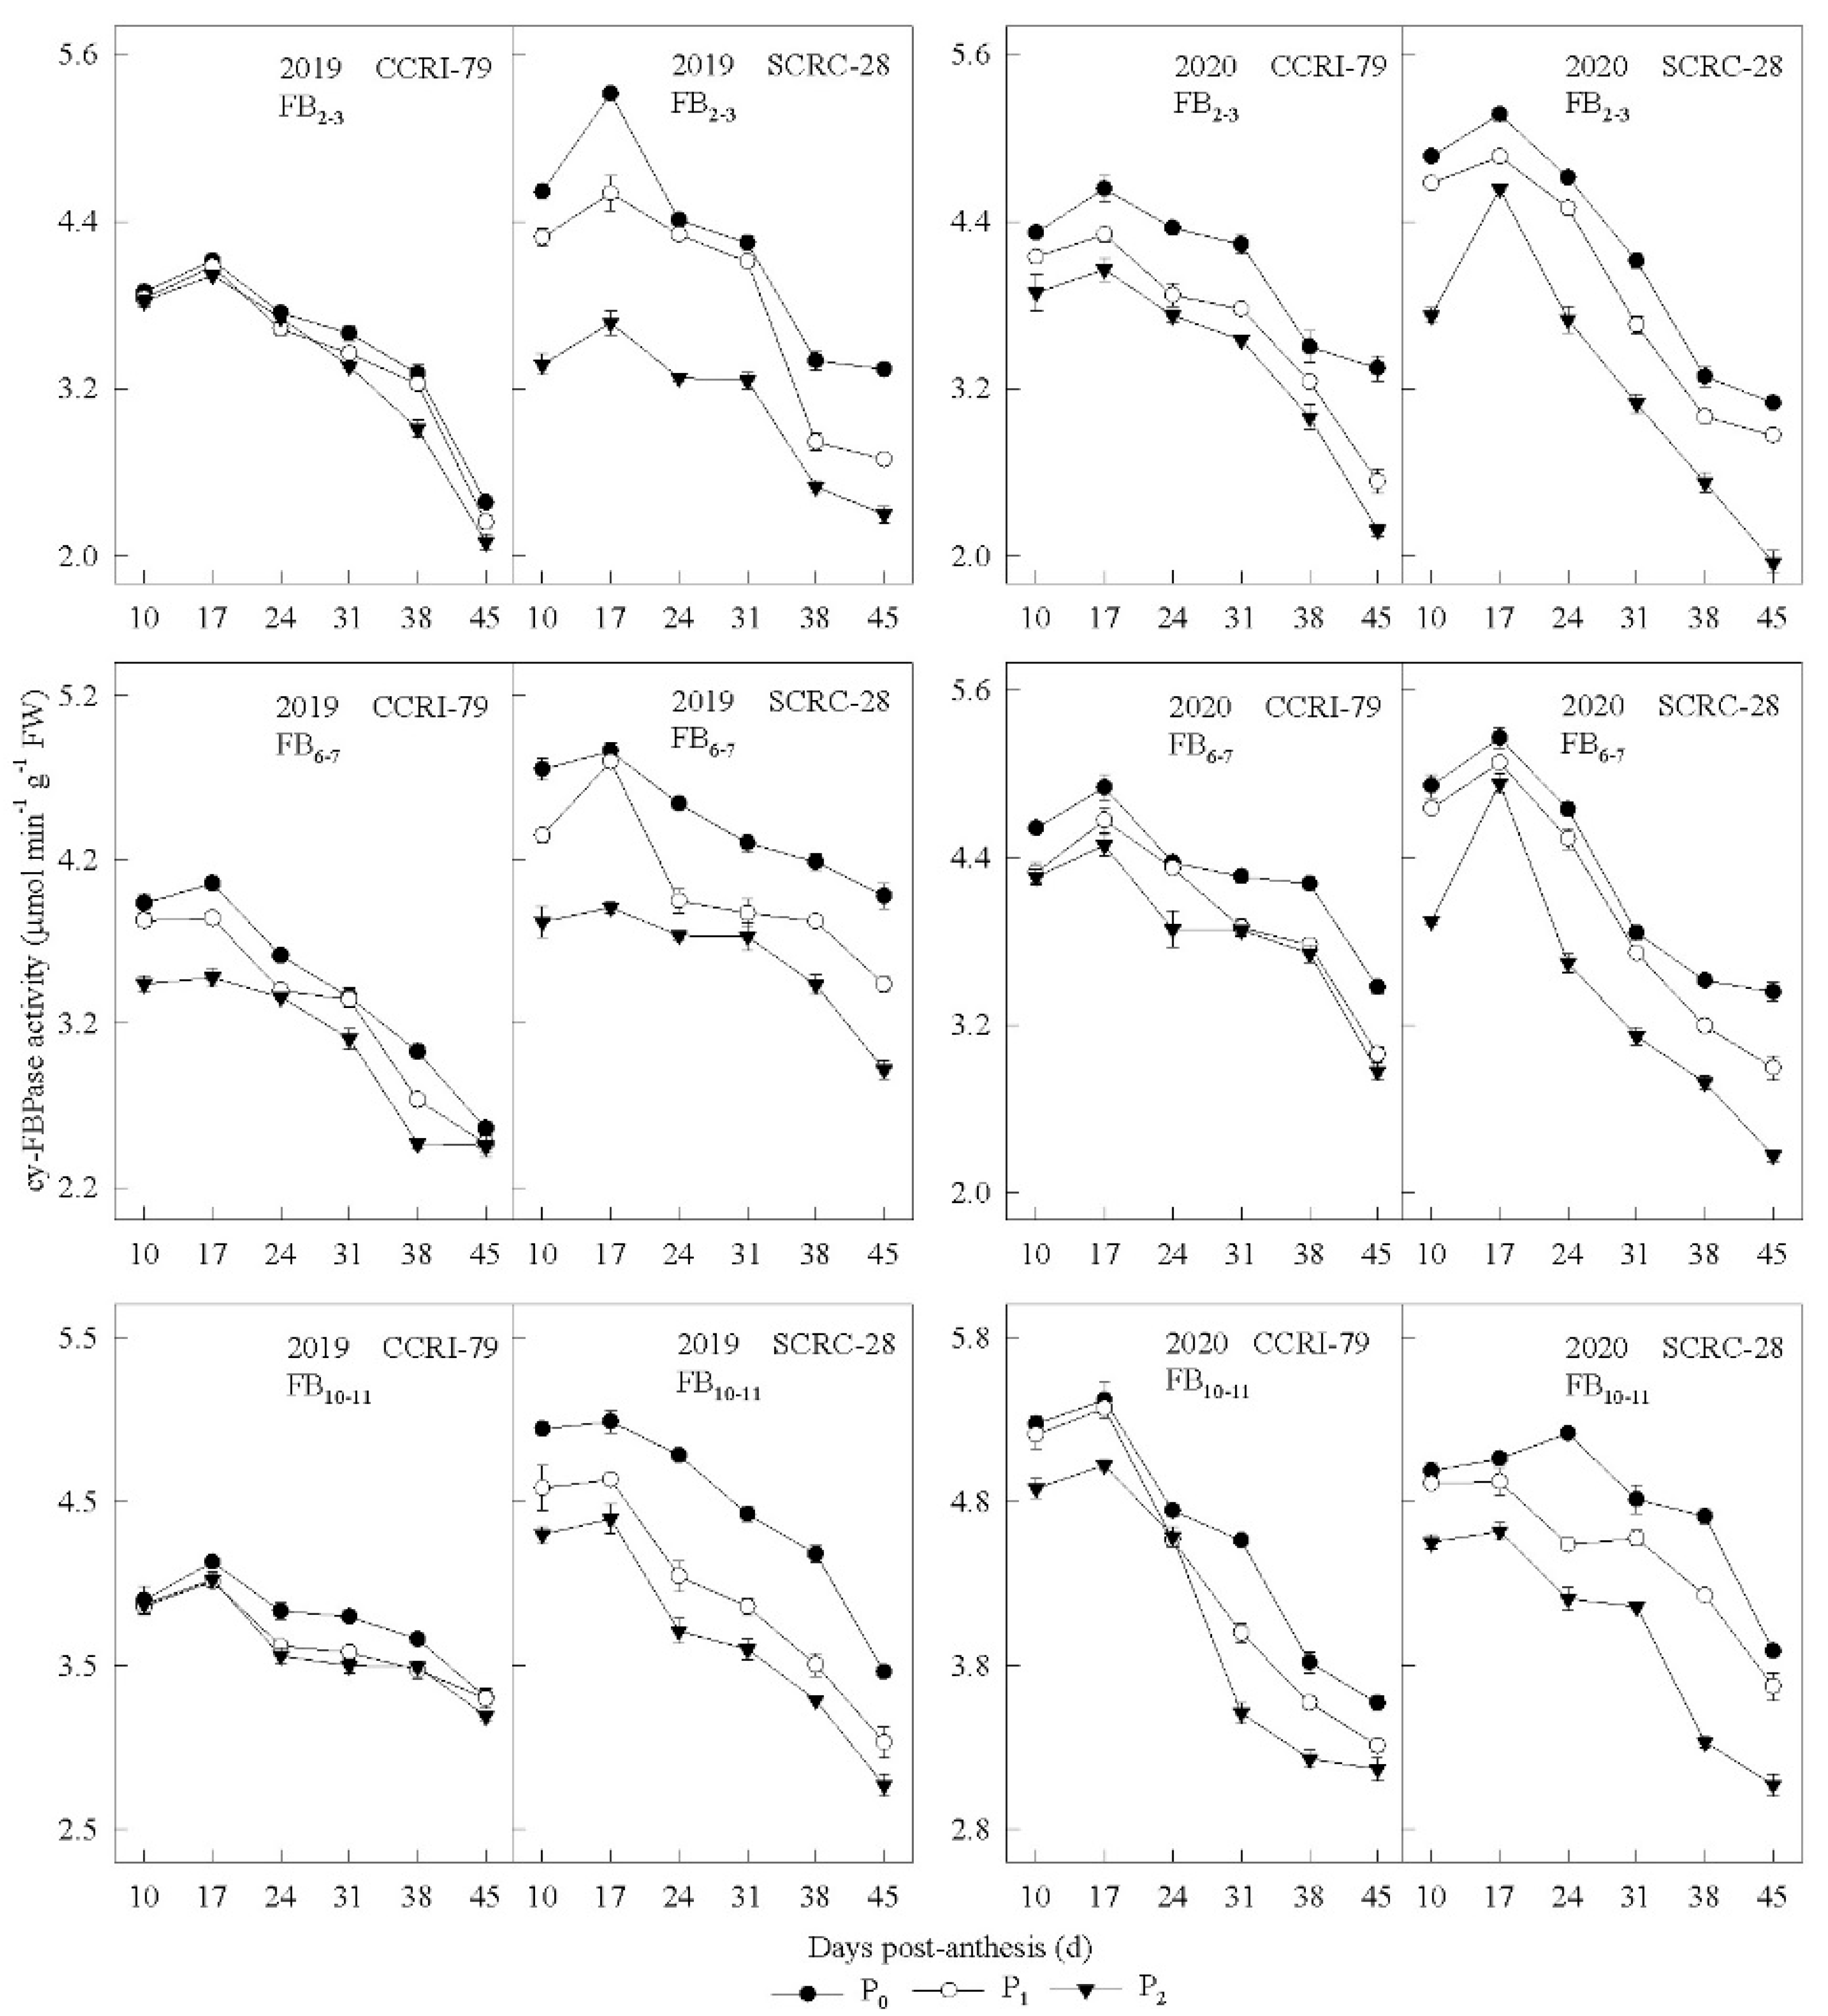
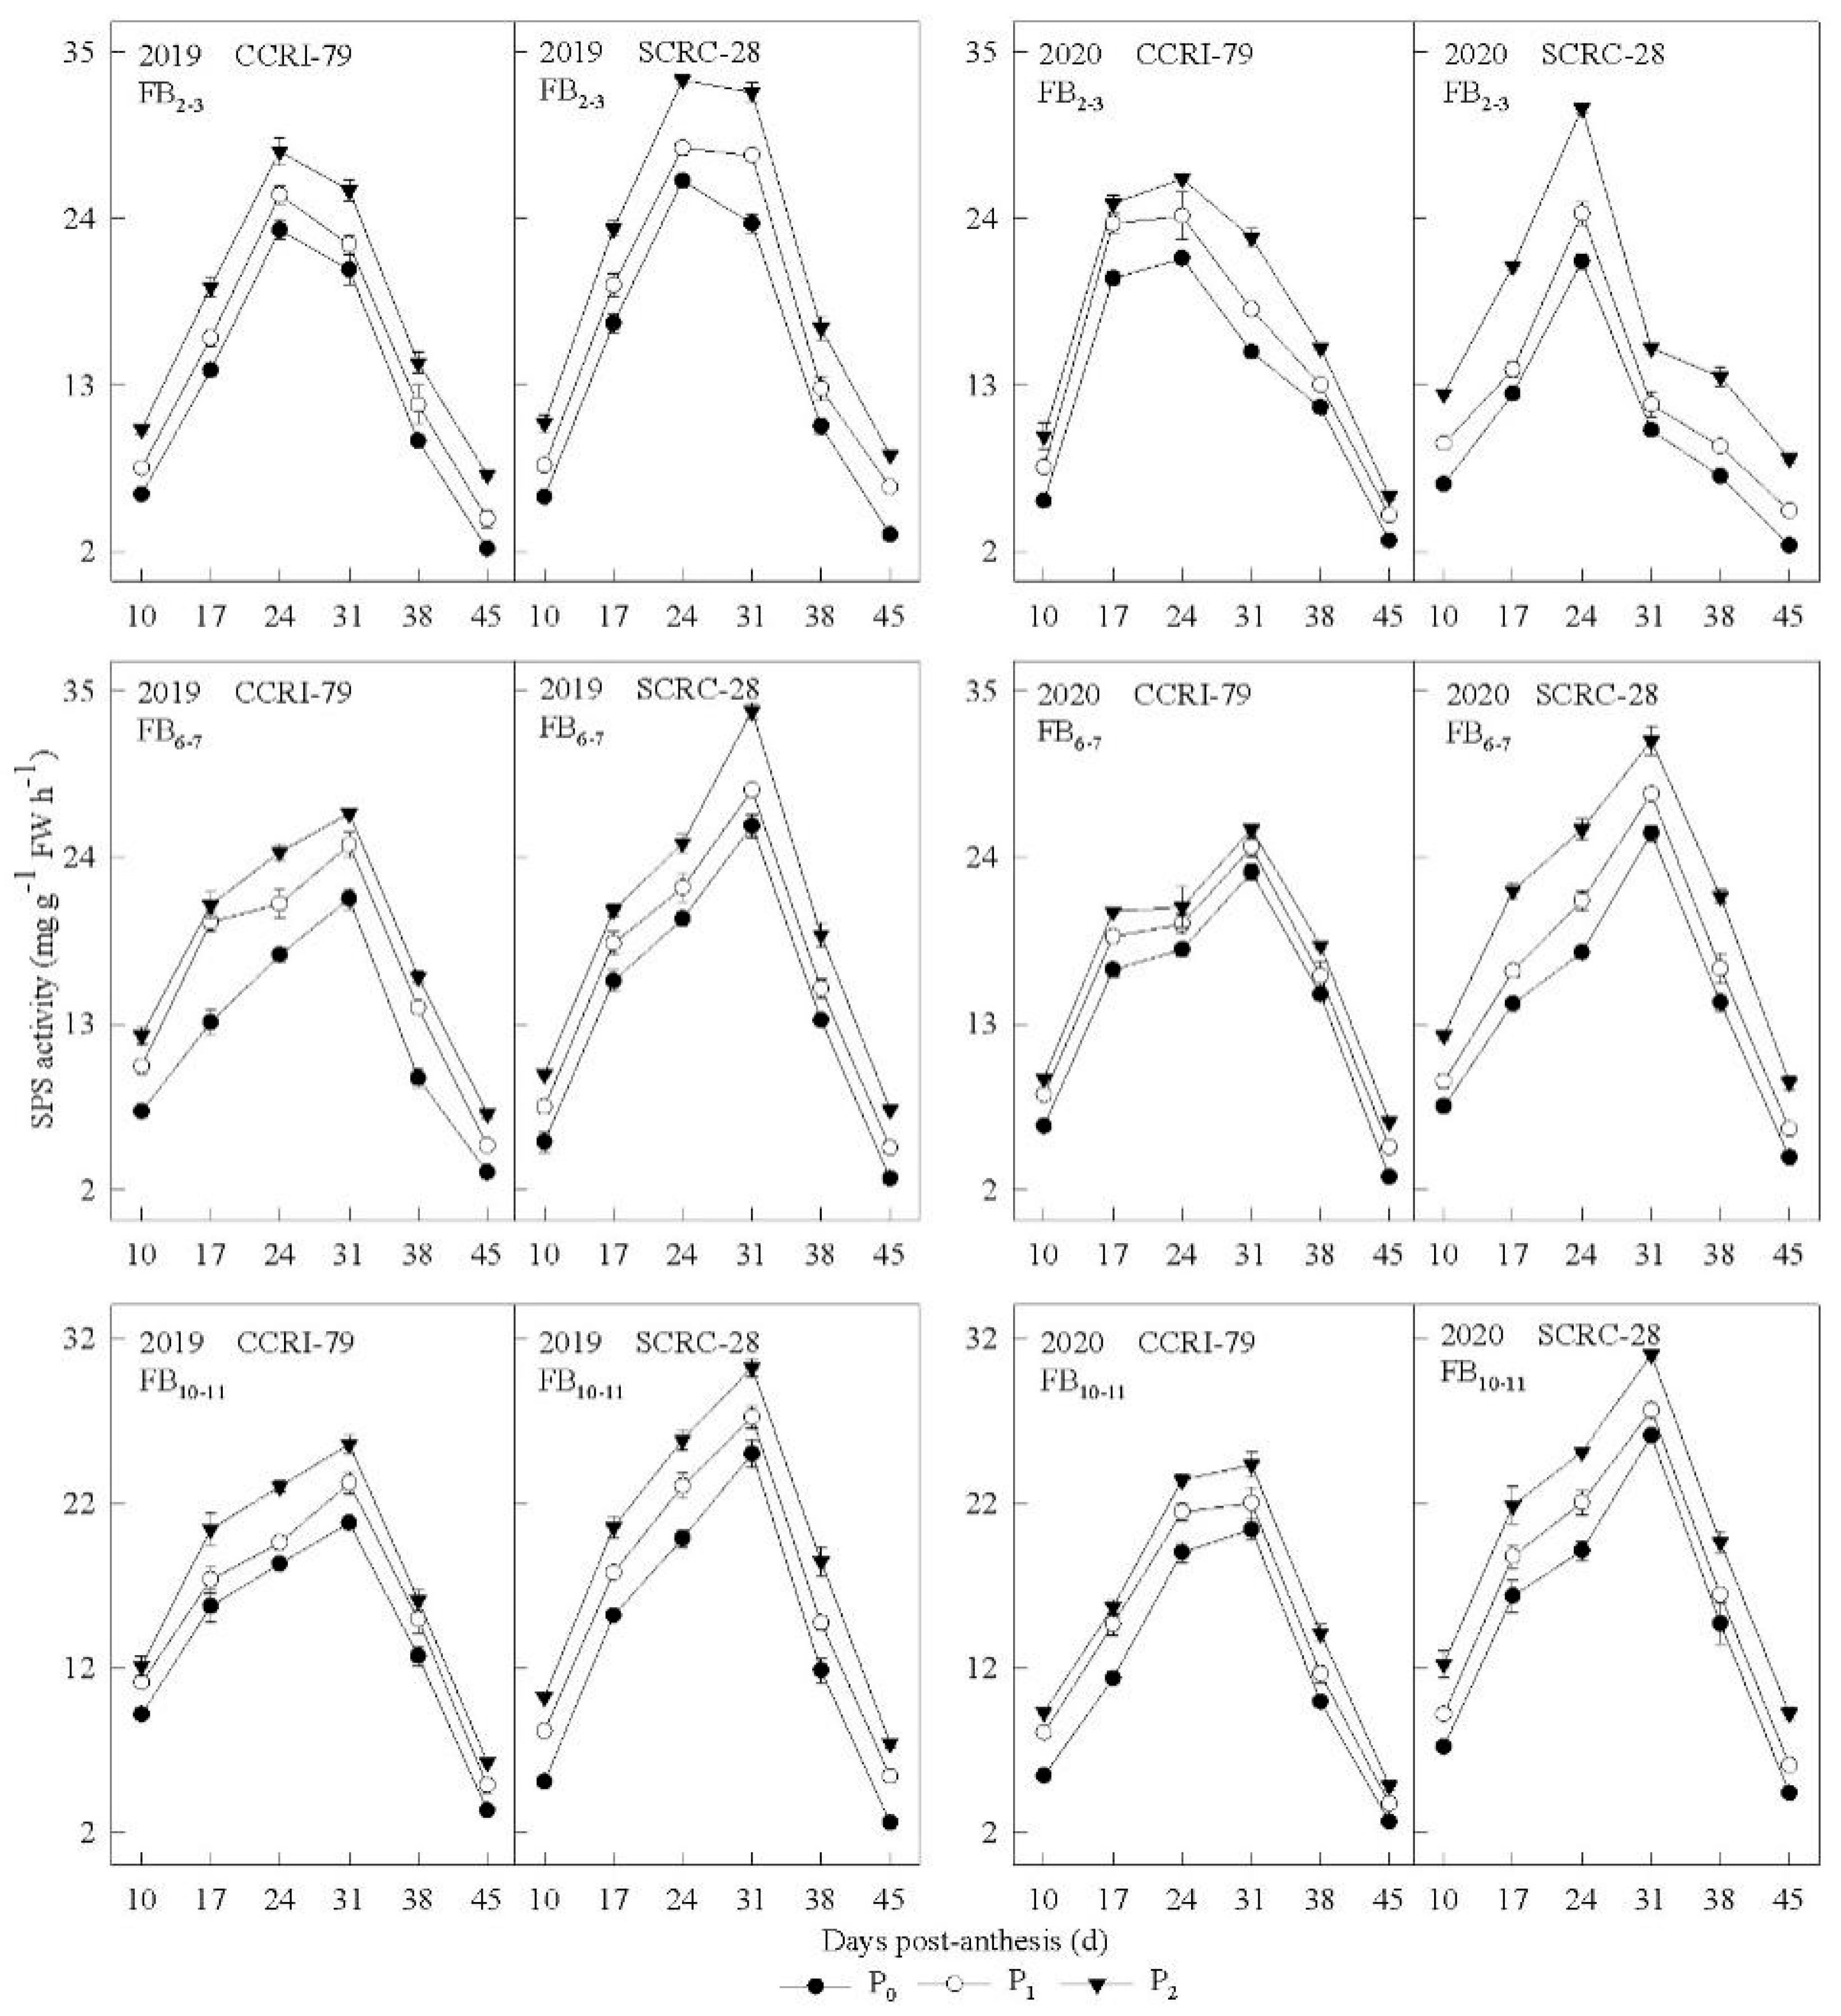
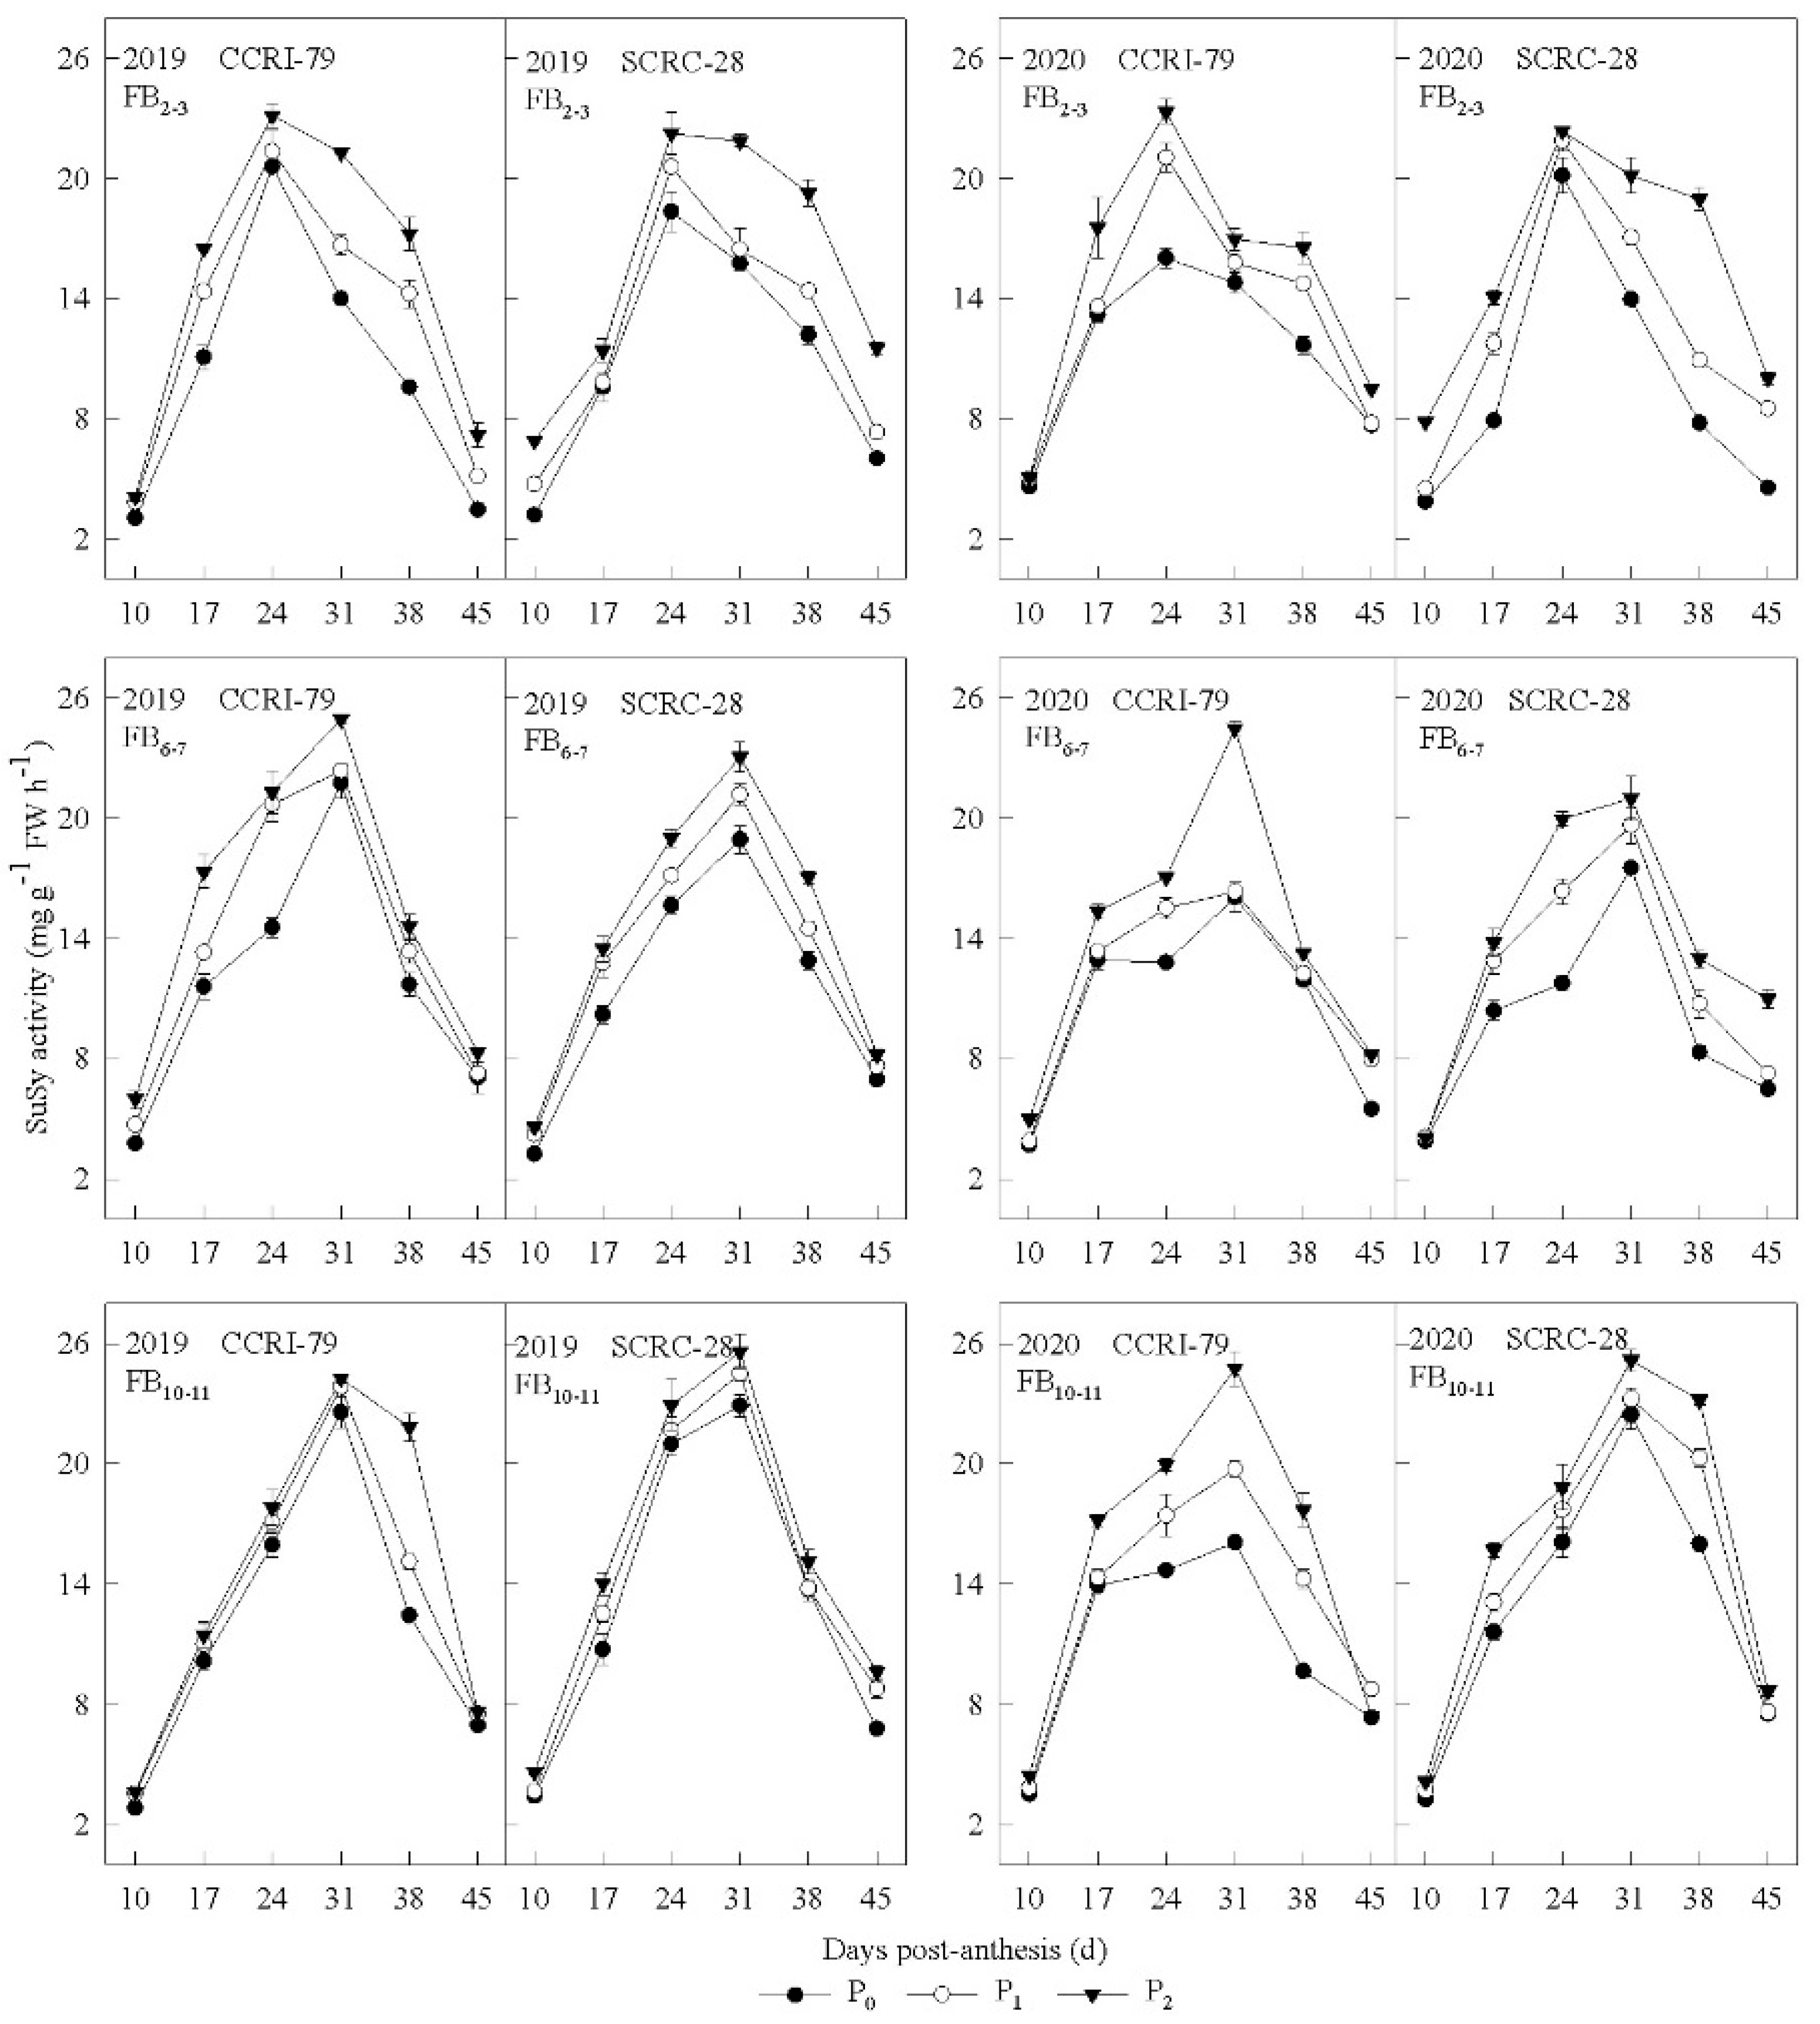
3.4. Sucrose-Metabolizing Enzyme Activities in the Subtending Leaves

The activity of the initial Rubisco from the subtending leaves showed a unimodal curve during the boll development stage and peaked at 17 DPA (Figure 7). However, the initial Rubisco activity in CCRI-79 decreased by 4.3–10.4% and 13.6–21.2% under P1 and P0 treatments compared to P2 at all three FBPs for both years. Under the same conditions, the initial Rubisco activity decreased by 5.7–20.3% and 14.0–28.2% in SCRC-28. Low soil AP (P0 and P1) had a smaller effect on FB10–11 than FB2–3 and FB6–7 (Figure 7).
The cy-FBPase activity of subtending leaves showed similar changes, peaking at 17–24 DPA (Figure 8), but decreased with increasing soil AP (Figure 8). In CCRI-79, the cy-FBPase activity increased by 4.0–5.2% and 8.6–12.7% under P1 and P0, and by 9.8–22.0% and 20.5–33.1% in SCRC-28 compared to P2 at the three FBPs in 2019 and 2020.
During the flowering and boll formation stages, the SPS and SuSy activities of the subtending leaves also demonstrated a unimodal curve with maximum values appearing 24–31 DPA (Figure 9 and Figure 10). In addition, the subtending leaves of FB2–3 attained maximum SPS and SuSy activity faster than FB6–7 and FB10–11. In CCRI-79, the SPS activity of subtending leaves reduced by 10.4–15.4% and 23.8–28.2%, 15.2–22.2%, and 7.8–35.6% in SCRC-28 under P1, and P0 compared to P2 treatments across FBPs and seasons. However, the SuSy activity decreased by 12.2–13.9% and 23.6–27.3% (in CCRI-79), 9.1–20.8%, and 17.1–34.0% (in SCRC-28) under P1 and P0 compared to P2 treatments across the FBPs and years. Interestingly, the activities of SPS and SuSy across the three FBPs were consistent with the initial Rubisco activity of both cultivars over the two years.

3.5. Correlation of Sucrose-Metabolizing Enzyme Activity to the Phosphorus Concentration of Subtending Leaves

At 10–45 DPA, there was no significant correlation between the P concentration and initial Rubisco activity of the subtending leaves of CCRI-79 and SCRC-28 (Table 4). However, the correlation between P concentration and cy-FBPase activity of the subtending leaves varied for both cultivars. For SCRC-28, the P concentration and cy-FBPase activity at 10–38 DAP were significantly negative (p < 0.05) but insignificantly different for CCRI-79 (Table 4). A significant positive correlation was observed between SPS, SuSy activities, and P concentrations of the subtending leaves of both cultivars. A significant positive correlation occurred at 10–24 DPA (p < 0.05) (except for SPS activity at 10 DAP (CCRI-79) and SuSy activity at 17 DAP (SCRC-28)) (Table 4).

3.6. Lint Yield and Yield Components on Different Fruiting Branches

The boll number, boll biomass, lint percentage, and lint yield decreased significantly with decreasing soil AP (P2 to P0) (Table 5). Boll number was the most sensitive (except for CCRI-79 from FB9–12 in both years), and lint percentage was the least sensitive to low soil AP.
In CCRI-79, lint yield decreased by 12.0–25.1% and 28.6–57.1% under P1 and P0 treatments compared to P2, mainly because the boll number decreased by 8.2–12.7%, 12.3–39.4% in 2019 and 2020 across the FBPs. For SCRC-28, lint yield decreased by 14.5–25.8% and 39.3–67.1% at P1 and P0 compared to P2 because the boll number decreased by 5.3–21.4% and 22.8–47.2% over the two years at different FBPs. Under P1 and P0, the lint yield of CCRI-79 was 27.1 and 58.3% higher than SCRC-28, respectively. In contrast, the lint yield was 19.7% higher in CCRI-79 than SCRC-28 under P2 treatment during the 2019 and 2020 seasons (Table 5). The cotton bolls on the upper FBP (FB9–12) contributed 26.4, 29.4, and 33.8% (in CCRI-79), and 19.6, 22.5, and 28.2% (in SCRC-28) of the total lint yield under the three soil AP levels (P2, P1, and P0).
The CVs of lint yield and yield components were lower for FB9–12 than FB1–4 and FB5–8 in CCRI-79, and the values were even smaller for SCRC-28. Lint yield was most affected by the interactions of FBP and AP (p < 0.01) (Table 5).

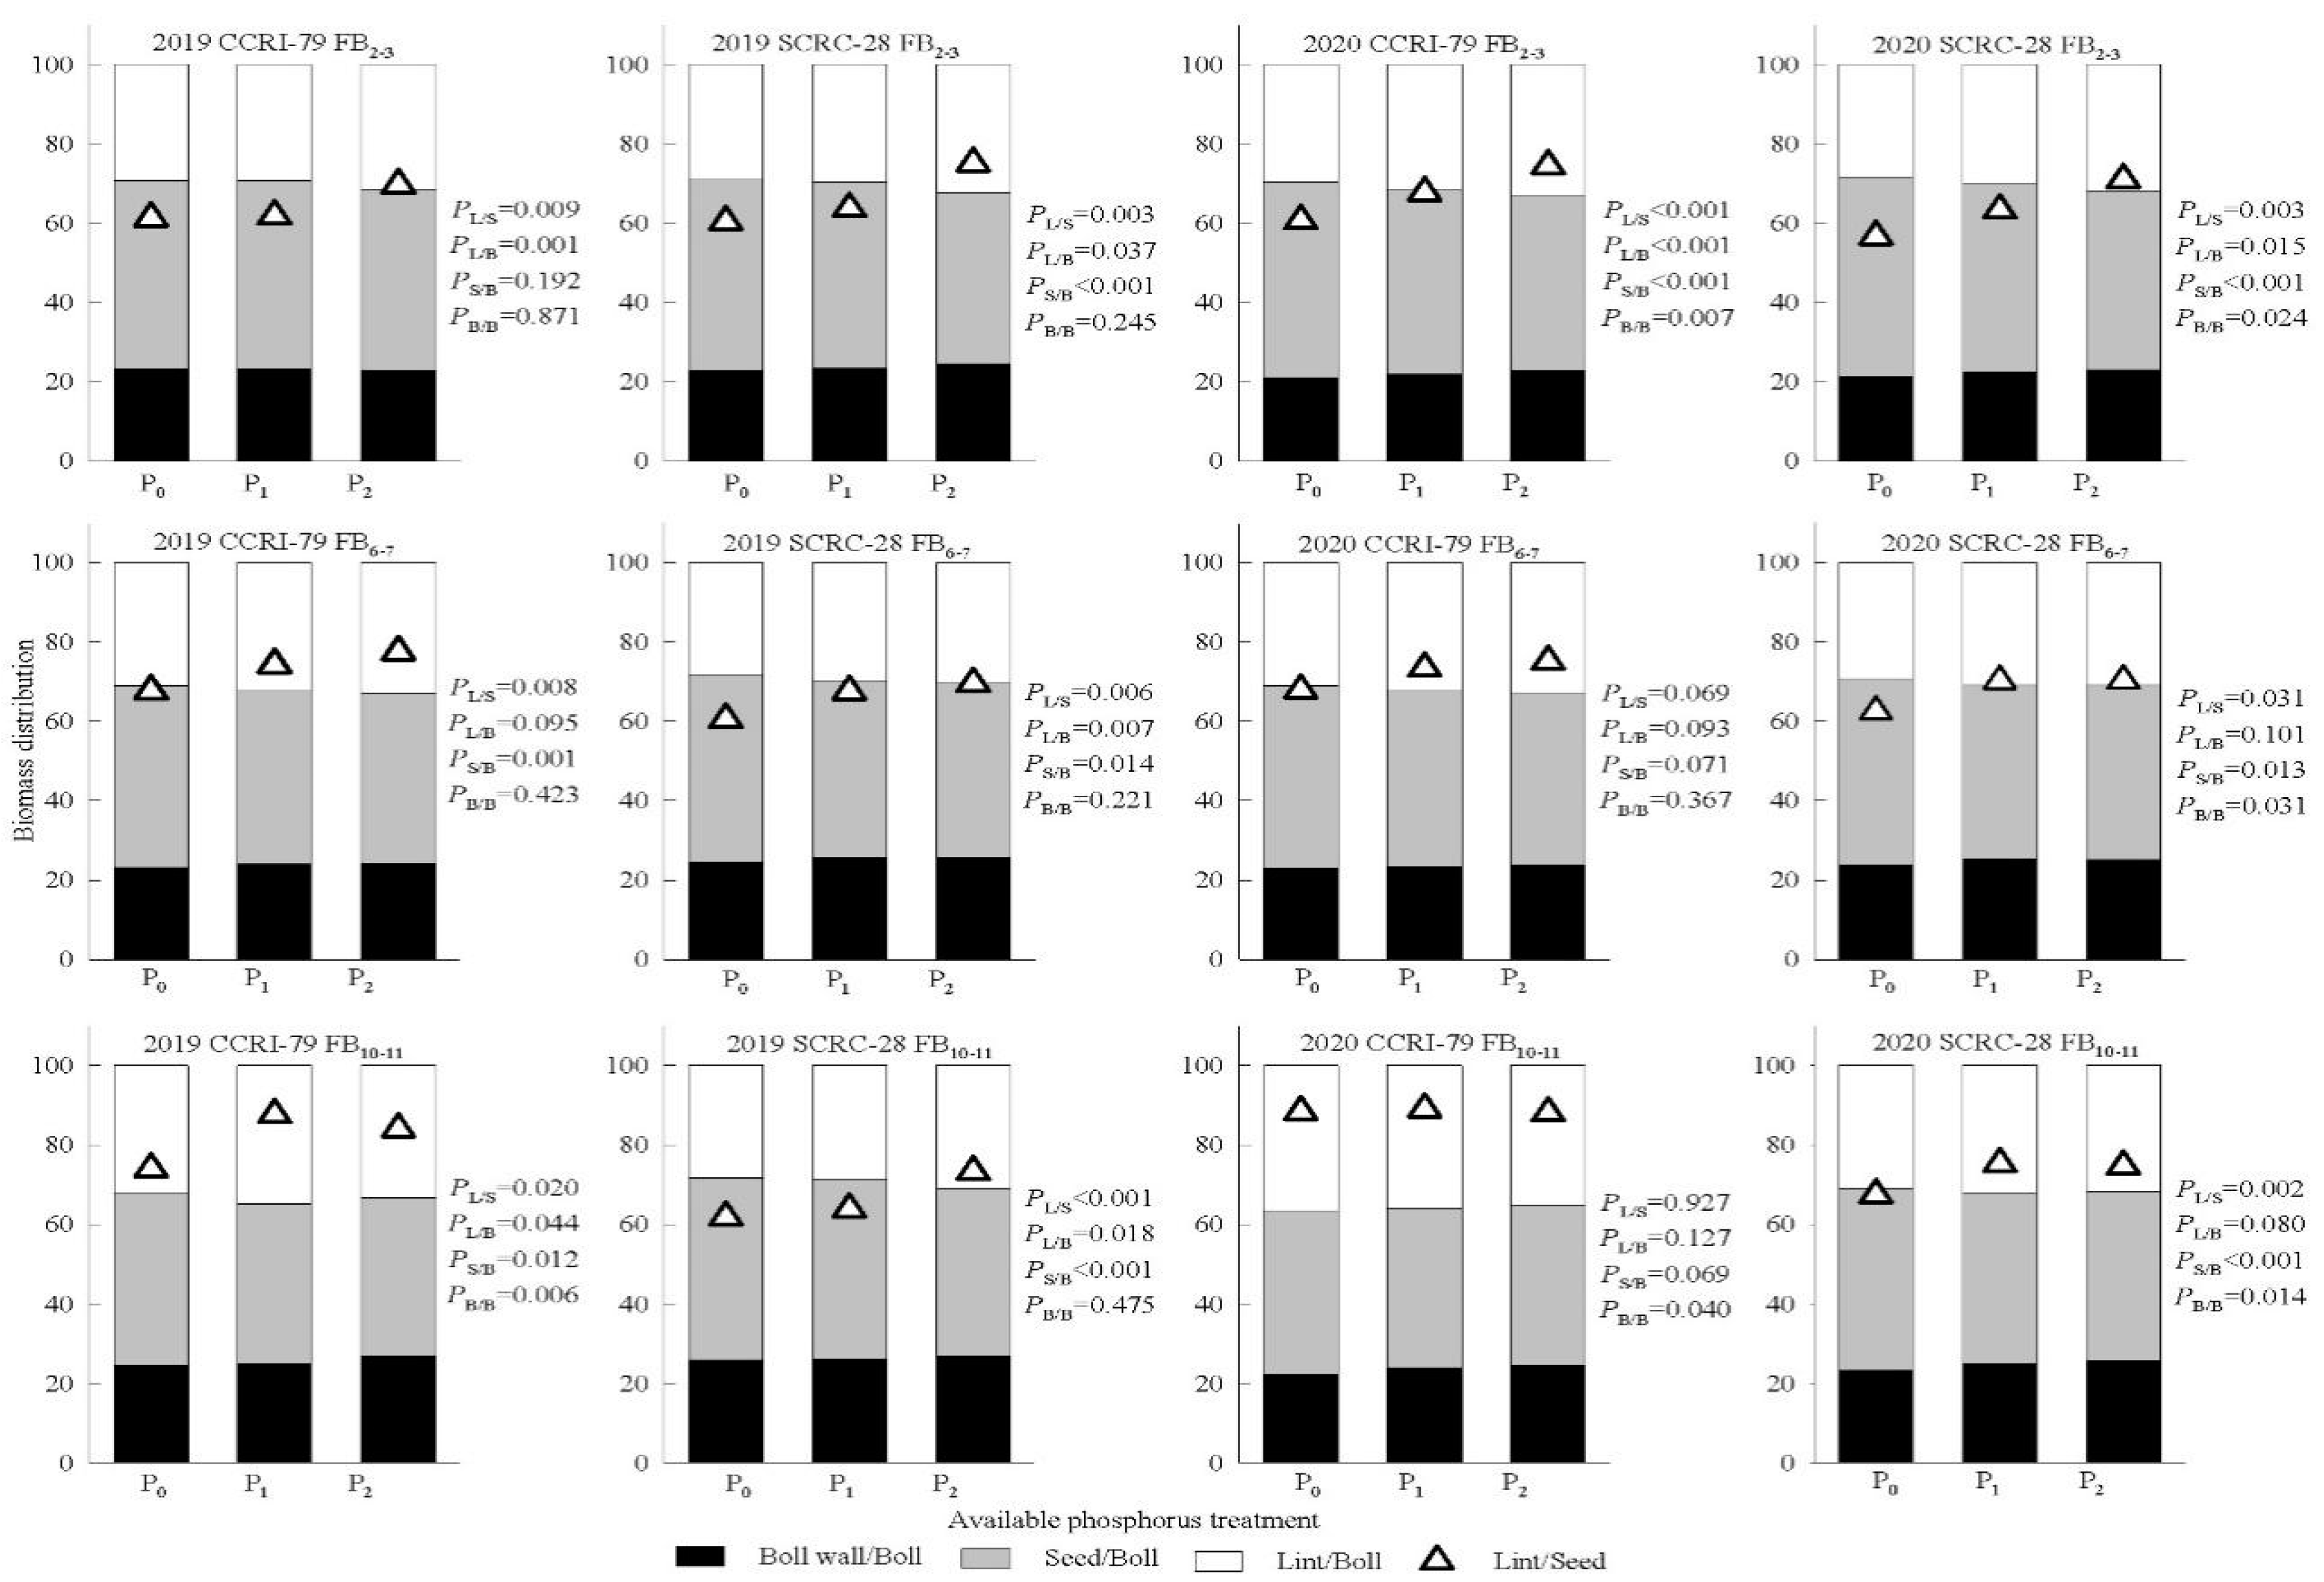
3.7. Cotton Boll Biomass Accumulation and Distribution on Different Fruiting Branches

Low soil AP decreased the boll wall, lint, and seed biomass, thus, reducing the cotton boll biomass (Table 6). Boll wall biomass was most affected in CCRI-79, while lint biomass was most affected in SCRC-28. However, low soil AP least affected the seed biomass of both cultivars. Low soil AP decreased the boll wall:boll, lint:boll, and lint:seed ratios but increased the seed:boll ratio.
Decreasing the lint:seed ratio by −2.3–7.3% and 4.8–11.1% across the FBPs and seasons reduced the boll biomass by 9.5–11.9% and 15.2–22.9% in CCRI-79 under P1 and P0 treatments compared to P2 (Table 6 and Figure 11). In SCRC-28, decreasing the lint:seed ratio by 1.1–9.6% and 8.4–14.5% over the seasons and FBPs reduced the boll biomass by −0.9–11.3% and 14.2–30.9% under P1 and P0 than P2 treatment (Table 6 and Figure 11). For P0, the boll biomass of CCRI-79 was 12.5% higher than SCRC-28 and 8.3% higher than SCRC-28 under P2 in 2019 and 2020 (Table 6). In addition, the lint:seed ratio of FB9–12 was higher than FB1–4 and FB5–8 (Table 6 and Figure 11).
Increasing the FBP decreased the boll biomass CVs (Table 5). Moreover, boll biomass was most affected by the C × FBP and C × AP (p < 0.01) interactions. In contrast, the lint:seed ratio was most affected by the C × FBP and FBP × AP (p < 0.01) interactions (Table 5 and Table 6).

3.8. Correlation of Source Indices to Lint Yield and Yield Components in the Subtending Leaves

This study determined the lint yield and yield components and their relationship with Pn, carbohydrate content, and sucrose-metabolizing enzyme activities (Table 6 and Table 7). The results show that boll biomass negatively correlated with the sucrose and starch contents of the subtending leaves (p < 0.05) but positively correlated with the Tr and SuSy activities (p < 0.01) in CCRI-79 and SCRC-28 (Table 7). However, the boll number had a significant negative correlation with the Pn and soluble sugar contents of the subtending leaves of both cultivars (p < 0.05). The lint:seed ratio was positively correlated with the activities of initial Rubisco and SuSy in the subtending leaves of both cultivars (p < 0.01). In addition, there was a significant negative correlation between the lint yield and soluble sugar content of subtending leaves (p < 0.01). The lint yield was significantly and positively correlated with SuSy activity (p < 0.01) in CCRI-79 and SCRC-28 (Table 7).
Moreover, there was a significant negative correlation between boll biomass and cy-FBPase activity (p < 0.01) and positive correlations between boll biomass, lint yield, and SPS activity (p < 0.01) in CCRI-79. Lint yield also significantly but negatively correlated with cy-FBPase activity (p < 0.01) in SCRC-28. Therefore, higher Tr and activities of initial Rubisco and SuSy increased the boll biomass and lint:seed ratio, eventually increasing the lint yield.

4. Discussion

Numerous studies have focused on the effects of P fertilizer on P uptake and distribution [8], yield, and fiber quality of the whole cotton plant [6,61]. However, P is easily fixed under natural conditions; thus, this study determined the effects of low-P on cotton growth using the soil AP content [26]. Phosphorus deficiency affects leaf carbohydrate metabolism [62] and the distribution of cotton boll biomass [26], but the relationship between the two is unclear. Previous studies showed that leaves subtending cotton bolls impact cotton boll growth and development, providing 60–87% carbon [63,64,65]. Therefore, this study investigated the effect of soil AP on sucrose metabolism in subtending leaves from three fruiting branch positions (FB2–3, FB6–7, and FB10–11) and the relationship between boll biomass and lint yield. Table 1 shows the negligible pre-experimentation differences between the organic matter, total nitrogen, available nitrogen, and available potassium contents of the soils, indicating that soil AP caused the observed experimental differences between treatments.
Subtending leaf photosynthesis synthesizes the required carbohydrates, mainly transported as sucrose to the sink organs [66]. However, the level of sucrose in the leaves depended on the coordination of Pn, sucrose metabolism, and transport [58,67]. Phosphorus is important for crop growth and development, and its nutritional status regulates P concentration and sucrose metabolism in leaves [26]. In this experiment, the contents of soluble sugar, sucrose, and starch were negatively correlated with the P concentration in the subtending leaves from 17 to 31 DPA. This correlation suggests that soil AP deficiency increased the contents of soluble sugar, sucrose, and starch (Table 3), as reported in previous studies [27,68,69]. This may indicate that the carbon distribution between sucrose and other non-structural carbohydrates has changed, so that more fixed carbon was retained in the P deficiency subtending leaves. Therefore, soluble sugar, sucrose, and starch accumulated excessively in the opposite leaves of cotton boll, which hindered the transportation of sucrose to cotton boll under P0 and P1 (Table 2). These results might help to explain why low phosphorus increases boll biomass and lint yield (Table 5). The soluble sugar and sucrose increments improved the plant water holding capacity, which positively correlated with the resistance to low-P [68,70]. For this study, the starch contents of subtending leaves were 21.2 and 49.5% higher in P1 and P0 than in P2 (Figure 6), indicating that soil AP deficiency blocked sucrose transportation from leaves to bolls (Table 2), thus, affecting cotton boll development (Table 5 and Table 6). Previous observations confirmed similar results with rice [23] and soybean leaves [71]. This trend occurred possibly because mesophyll cells lacked P, hampering triose phosphate transportation from the chloroplast to the cytoplasm for sucrose synthesis; thus, the synthesized starch accumulates in the chloroplast [27].
Moreover, the Tr of subtending leaves from FB2–3, FB6–7, and FB10–11 were lower under P0 and P1 than P2 (Table 2), confirming that low soil AP restricted photosynthate transport to cotton bolls. Excessive sugar retention (soluble sugar, sucrose, and starch) (Figure 4, Figure 5 and Figure 6) in the leaf reduces initial Rubisco activity, possibly affecting the Pn (Figure 3 and Figure 7), as reported in previous studies [26,72]. The vacuole phosphorus pool was exhausted during boll development, and more triose phosphate was involved in starch synthesis. Therefore, the starch content increased (10–31 DAP) (Figure 6), but the soluble sugar (17–45 DAP) and sucrose contents (10–45 DAP) of subtending leaves decreased (Figure 4, Figure 5 and Figure 6). Natr et al. [73] suggested that enhanced starch synthesis under low-P promotes phosphate group conversion to inorganic phosphorus. Most likely, starch is converted to sucrose and exported to the boll only when the sucrose content is seriously low [74]. Nonetheless, there were significant positive correlations between Tr and SuSy activity of the subtending leaves and boll biomass (Table 7). These correlations indicate that soil AP deficiency reduces boll biomass by altering sucrose synthesis and distribution (Table 2), as confirmed in previous reports [26].
Low soil AP content altered cotton boll biomass composition by reducing boll wall:boll, lint:boll, and lint:seed and increasing the seed:boll ratios (Table 6). These results suggest that low soil AP limits carbohydrate transport from the seed to the fiber inhibiting fiber development. However, a higher seed:boll ratio improved cotton breeding, positively responding to low-P stress [75]. In addition, the lint:seed positively correlated with the activities of initial Rubisco and SuSy in the subtending leaves (Table 7). The correlations were consistent with cotton boll biomass accumulation (Table 7), indicating that high soil AP was beneficial for lint biomass accumulation and further improved lint yield (Table 5 and Table 6).
Phosphorus deficiency disordered sucrose metabolism because of the changes in key sucrose-metabolizing enzyme activities [23,27]. Previous studies showed that low-P increased sucrose and starch contents in sugar beet [45] and maize [76], positively correlating with cy-FBPase activity. The results confirm these observations since the cy-FBPase activity of the subtending leaves increased by 11.7 and 21.4% under P1 and P0, respectively (Figure 8). In this research, SPS and SuSy activities were opposite to the cy-FBPase activity of the subtending leaves under low soil AP, similar to the observations in citrus [77]. Excessive sucrose (Figure 5) also inhibited the activity of SPS and SuSy (Figure 9 and Figure 10), as reported in a previous study [78]. In this study, low soil AP had a higher impact on the activities of initial Rubisco, SPS, and SuSy in FB2–3 than FB10–11 (Figure 7, Figure 9 and Figure 10). The varied impact is probably because the subtending leaves from FB2–3 and FB10–11 had different durations of low-P exposure. Moreover, older leaves translocate P to young leaves [79], and young leaves generally have stronger stress resistance than old leaves [80]. The SuSy activity, boll biomass, and lint yield was significantly and positively correlated (Table 7), suggesting SuSy as a key enzyme affecting boll biomass and lint yield under low soil AP. However, Liu et al. [26] showed that SPS is a key enzyme in the functional leaves of cotton plants during low-P. These reports may explain the different responses to low-P stress in subtending and functional cotton leaves. Moreover, low soil AP had a higher impact on boll biomass and lint yields of FB1–4 and FB5–8 than FB9–12 (Table 5 and Table 7). The main reason for the varied impact is that the CVs of the Tr and activities of initial Rubisco and SuSy were smaller at FB9–12 than at FB1–4 and FB5–8 (Table 2 and Figure 7 and Figure 10). This variation explains the higher lint:seed ratio and proportion of total lint yield on the upper FBP (FB9–12) under soil AP deficiency (Table 5 and Table 6).
Different cotton varieties are differentially sensitive to low-P [81,82]. In this study, the effects of low soil AP on SCRC-28 and CCRI-79 caused different subtending leaf Tr (Table 2), boll biomass, and lint yield (Table 5). SCRC-28 was more sensitive to low soil AP than CCRI-79. These results suggest that different cultivars present different physiological responses under soil AP deficiency, as reported in cotton seedlings [83]. The average correlation coefficient revealed the strongest correlation between the leaf P concentration and starch content of both cultivars. Moreover, starch, sucrose, and leaf P contents differed between CCRI-79 and SCRC-28. These results may explain why SCRC-28 was more sensitive to low soil AP than CCRI-79 (Table 3). Therefore, achieving higher Tr in the subtending leaves might be critical for boll biomass and lint yield [58].
In this study, the cy-FBPase activity of SCRC-28 subtending leaves was more sensitive to low P concentration than CCRI-79 (Table 4). Meanwhile, the relationship between cy-FBPase activity, boll biomass, and lint yield varied between CCRI-79 and SCRC-28 (Table 7). Cy-FBPase activity increased by 4.0–12.7% in CCRI-79 and 9.8–33.1% in SCRC-28 under P1 and P0 across the three FBPs. Furthermore, the SPS activity in the subtending leaves, boll biomass, and lint yield was significantly and positively correlated (p < 0.01) in CCRI-79 but nonsignificant in SCRC-28. Under P1 and P0 treatments, the SPS activity in the subtending leaves of CCRI-79 decreased by 10.4–28.2% and 15.2–35.6% in SCRC-28 compared with P2 over the FBPs and years. These results show that cy-FBPase and SPS activities in SCRC-28 are more sensitive to soil AP content, possibly explaining the different sensitivities of both cultivars to low soil AP.

5. Conclusions

The research performed in 2019 and 2020 suggests that: (1) Soil AP deficiency (P0 and P1) decreases the P concentration, Tr, and activities of initial Rubisco and SuSy in the subtending leaves; thus, decreasing boll biomass and lint yield. Soil AP deficiency decreased the boll wall:boll, lint:boll, and lint:seed, and increased seed:boll ratio. (2) The decline of Tr and activities of initial Rubisco and SuSy was less on FB10–11 than FB2–3 and FB6–7 under low soil AP. These results suggest that higher lint:seed and the proportion of total lint yield on upper FBP (FB9–12) are positive responses to soil AP deficiency. (3) Soil AP deficiency reduced Pn and sucrose-metabolizing enzyme (initial Rubisco, SPS, and SuSy) activities in the subtending leaves but increased carbohydrate (soluble sugar, sucrose, and starch) contents, reducing the Tr. However, the same conditions were unconducive for boll biomass accumulation and lint yield. (4) The P concentration of SCRC-28 subtending leaves strongly affected sucrose and starch contents, which may explain the higher SCRC-28 sensitivity to low soil AP than CCRI-79. The activities of cy-FBPase and SPS were significantly different between CCRI-79 and SCRC-28, further explaining the different sensitivities to low soil AP.
The results could improve the understanding of the effects of low soil AP on sucrose metabolism in subtending leaves during boll development, providing reliable data and theoretical guidelines for cultivating low-P tolerant varieties.

Author Contributions

Conceptualization, M.S., P.L., X.S. and H.D.; Formal analysis, W.F. and J.S.; Funding acquisition, X.S. and H.D.; Investigation, M.S. and C.Z.; Methodology, M.S. and N.W.; Resources, Y.Z.; Software, H.H.; Writing—original draft, M.S. and P.L.; Writing—review & editing, P.L. All authors have read and agreed to the published version of the manuscript.

Funding

This research was funded by the National Natural Science Foundation of China (31601253), the Modern Agroindustry Technology Research System, China (SDAIT-03), the Central Research Institutes of Basic Research and the Public Service Special Foundation (1610162022044), the China Agriculture Research System (CARS-15-11), and the Agricultural Science and Technology Innovation Program of Chinese Academy of Agricultural Sciences.

Data Availability Statement

Not applicable.

Conflicts of Interest

The authors declare no conflict of interest.

References

  1. Saleem, M.F.; Shakeel, A.; Bilal, M.F.; Shahid, M.Q.; Anjum, S.A. Effect of different phosphorus levels on earliness and yield of cotton cultivars. Soil Environ. 2010, 29, 128–135. [Google Scholar]
  2. Mao, S.C. China Cotton Cultivation, 4th ed.; Shanghai Scientific and Technical Press: Shanghai, China, 2019; pp. 1–319. (In Chinese) [Google Scholar]
  3. National Bureau of Statistics. Available online: http://www.stats.gov.cn/xxgk/sjfb/zxfb2020/202112/t20211214_1825249.html (accessed on 14 December 2021).
  4. Dong, H.L. Research progress on fertilization technology of cotton. Cott. Sci. 2007, 19, 378–384, (In Chinese with English Abstract). [Google Scholar]
  5. Sarkar, R.K.; Majumdar, R.C. Effect of farmyard manure, nitrogen and phosphorus on yield and fibre quality of upland cotton (Gossypium hirsutum) in rice fallow land. Indian J. Agric. Sci. 2002, 72, 607–610. [Google Scholar]
  6. Saleem, M.F.; Cheema, M.A.; Bilal, M.F.; Anjum, S.A.; Khurshid, I. Fiber quality of cotton (Gossypium hirsutum) cultivars under different phosphorus levels. J. Anim. Plant Sci. 2011, 21, 26–30. [Google Scholar] [CrossRef] [Green Version]
  7. Bronson, K.F.; Keeling, J.W.; Booker, J.D.; Chua, T.T.; Lascano, R.J. Influence of landscape position, soil series, and phosphorus fertilizer on cotton lint yield. Agron. J. 2003, 95, 949–957. [Google Scholar] [CrossRef] [Green Version]
  8. Chen, B.L.; Wang, Q.H.; Ye, Z.P.; Stiles, S.; Feng, G. Optimisation of phosphorus fertilisation promotes biomass and phosphorus nutrient accumulation, partitioning and translocation in three cotton (Gossypium hirsutum) genotypes. Crop Pasture Sci. 2020, 71, 56–69. [Google Scholar] [CrossRef]
  9. Aslam, M.; Memon, M.; Khan, P.; Imtiaz, M. Performance of fertigation technique for phosphorus application in cotton. Soil Environ. 2009, 28, 45–48. [Google Scholar]
  10. Singh, V.; Pallaghy, C.K.; Singh, D. Phosphorus nutrition and tolerance of cotton to water stress: II. Water relations, free and bound water and leaf expansion rate. Field Crop. Res. 2006, 96, 199–206. [Google Scholar] [CrossRef]
  11. Sawan, Z.M. Effect of nitrogen, phosphorus fertilization and growth regulators on cotton yield and fiber properties. J. Agron. Crop Sci. 1986, 156, 237–245. [Google Scholar] [CrossRef]
  12. Janaki, P.; Rajan, R.V.A. Phosphorus utilization efficiency in cotton using P-32 Tracer: Effect of different levels of nitrogen and phosphorus. Adv. Plant Sci. 2008, 21, 559–564. [Google Scholar]
  13. Katkar, R.N.; Turkhede, A.B.; Solanke, V.M.; Wankhade, S.T.; Sakhare, B.A. Effect of foliar sprays of nutrients and chemicals on yield and quality of cotton under rainfed condition. Res. Crop. 2002, 3, 27–29. [Google Scholar]
  14. Hearn, A.B. Cotton nutrition. Field Crop Abstr. 1981, 34, 11–33. [Google Scholar]
  15. Gifford, R.M.; Lutze, J.L.; Barrett, D. Global atmospheric change effects on terrestrial carbon sequestration: Exploration with a global C- and N-cycle model (CQUESTN). Plant Soil 1995, 187, 369–387. [Google Scholar] [CrossRef]
  16. Wang, X.J.; Guppy, C.N.; Watson, L.; Sale, P.W.G.; Tang, C. Availability of sparingly soluble phosphorus sources to cotton (Gossypium hirsutumL.), wheat (Triticum aestivumL.) and white lupin (Lupinus albusL.) with different forms of nitrogen as evaluated by a32P isotopic dilution technique. Plant Soil 2011, 348, 85–98. [Google Scholar] [CrossRef]
  17. Ahmad, F.; Uddin, S.; Ahmad, N.; Islam, R. Phosphorus–microbes interaction on growth, yield and phosphorus-use efficiency of irrigated cotton. Arch. Agron. Soil Sci. 2013, 59, 341–351. [Google Scholar] [CrossRef]
  18. Lu, R.K. The phosphorus level of soil and environmental protection of water body. Phos. Comp. Fert. 2003, 1, 4–8, (In Chinese with English Abstract). [Google Scholar]
  19. Xu, W.F.; Zhang, Q.; Yuan, W.; Xu, F.Y.; Aslam, M.M.; Miao, R.; Li, Y.; Wang, Q.W.; Li, X.; Zhang, X.; et al. The genome evolution and low-phosphorus adaptation in white lupin. Nat.Commun. 2020, 11, 1069. [Google Scholar] [CrossRef] [Green Version]
  20. Cordell, D.; Drangert, J.O.; White, S. The story of phosphorus: Global food security and food for thought. Glob. Environ. Chang. 2009, 19, 292–305. [Google Scholar] [CrossRef]
  21. Gao, Y.; Huang, H.Y.; Zhao, H.Y.; Xia, H.Q.; Sun, M.; Li, Z.Y.; Li, P.C.; Zheng, C.S.; Dong, H.L.; Liu, J.R. Phosphorus affects enzymatic activity and chemical properties of cotton soil. Plant Soil Environ. 2019, 65, 361–368. [Google Scholar] [CrossRef] [Green Version]
  22. Yang, J.E.; Jacobsen, J.S. Soil Inorganic Phosphorus fractions and their uptake relationships in calcareous soils. Soil Sci. Soc. Am. J. 1990, 54, 1666–1669. [Google Scholar] [CrossRef]
  23. Cai, J.; Chen, L.; Qu, H.Y.; Lian, J.; Liu, W.; Hu, Y.B.; Xu, G.H. Alteration of nutrient allocation and transporter genes expression in rice under N, P, K, and Mg deficiencies. Acta Physiol. Plant. 2012, 34, 939–946. [Google Scholar] [CrossRef]
  24. Ismail, C.; Christine, H.; Horst, M. Changes in phloem export of sucrose in leaves in response to phosphorus, potassium and magnesium deficiency in bean plants. J. Exp. Bot. 1994, 45, 1251–1257. [Google Scholar] [CrossRef]
  25. Groot, C.; Marcelis, L.F.M.; Boogaard, R.; Kaiser, W.M.; Lambers, H. Interaction of nitrogen and phosphorus nutrition in determining growth. Plant Soil 2003, 248, 257–268. [Google Scholar] [CrossRef]
  26. Liu, J.R.; Peng, J.; Xia, H.Q.; Li, P.C.; Li, Z.Y.; Sun, M.; Zheng, C.S.; Dong, H.L. High soil available phosphorus favors carbon metabolism in cotton leaves in pot trials. J. Plant Growth Regul. 2021, 40, 974–985. [Google Scholar] [CrossRef]
  27. Hermans, C.; Hammond, J.P.; White, P.J.; Verbruggen, N. How do plants respond to nutrient shortage by biomass allocation? Trends Plant Sci. 2006, 11, 610–617. [Google Scholar] [CrossRef]
  28. Zheng, J.F.; Bai, Z.Y.; Li, C.D.; Mi, S.Y.; Liu, Y.X. The effect of phosphorus deficiency stress on soluble sugar content and soluble protein content and chromosome of wheat substitution lines. Acta Agric.Boreali-Sin. 2013, 28, 27–31, (In Chinese with English Abstract). [Google Scholar]
  29. Rao, I.M.; Arulanantham, A.R.; Terry, N. Leaf phosphate status, photosynthesis and carbon partitioning in sugar beet: II. diurnal changes in sugar phosphates, adenylates, and nicotinamide nucleotides. Plant Physiol. 1989, 90, 820–826. [Google Scholar] [CrossRef] [Green Version]
  30. Crafts-Brandner, S.J. Phosphorus nutrition influence on leaf senescence in soybean. Plant Physiol. 1992, 98, 1128–1132. [Google Scholar] [CrossRef] [Green Version]
  31. Crafts-Brandner, S.J.; Salvucci, M.E.; Sims, J.L.; Sutton, T.G. Phosphorus nutrition influence on plant growth and nonstructural carbohydrate accumulation in tobacco. Crop Sci. 1990, 30, 609–614. [Google Scholar] [CrossRef]
  32. Loewe, A.; Einig, W.; Shi, L.; Dizengremel, P.; Hampp, R. Mycorrhiza formation and elevated CO2 both increase the capacity for sucrose synthesis in source leaves of spruce and aspen. New Phytol. 2000, 145, 565–574. [Google Scholar] [CrossRef]
  33. Ciereszko, I.; Zambrzycka, A.; Rychter, A. Sucrose hydrolysis in bean roots (Phaseolus vulgaris L.) under phosphate deficiency. Plant Sci. 1998, 133, 139–144. [Google Scholar] [CrossRef]
  34. Yang, C.Q.; Liu, R.X.; Zhang, G.W.; Xu, L.H.; Zhou, Z.G. Effects of waterlogging on sucrose metabolism of the subtending leaf of cotton boll and boll weight during flowering and boll-forming stage. Acta Agrono Sin. 2014, 40, 908–914, (In Chinese with English Abstract). [Google Scholar] [CrossRef]
  35. Daie, J. Cytosolic fructose-1,6-bisphosphatase: A key enzyme in the sucrose biosynthetic pathway. Photosynth. Res. 1993, 38, 5–14. [Google Scholar] [CrossRef] [PubMed]
  36. Chen, S.A.; Hajirezaei, M.; Peisker, M.; Tschiersch, H.; Sonnewald, U.; Bornke, F. Decreased sucrose-6-phosphate phosphatase level in transgenic tobacco inhibits photosynthesis, alters carbohydrate partitioning, and reduces growth. Planta 2005, 221, 479–492. [Google Scholar] [CrossRef]
  37. Grof, C.P.L.; Knight, D.P.; McNeil, S.D.; Lunn, J.E.; Campbell, J.A. A modified assay method shows leaf sucrose-phosphate synthase activity is correlated with leaf sucrose content across a range of sugarcane varieties. Aus. J. Plant Physiol. 1998, 25, 499–502. [Google Scholar] [CrossRef]
  38. Xu, X.Y.; Yang, Y.S.; Liu, C.X.; Sun, Y.M.; Zhang, T.; Hou, M.L.; Huang, S.Z.; Yuan, H.Y. The evolutionary history of the sucrose synthase gene family in higher plants. BMC Plant Biol. 2019, 19, 566. [Google Scholar] [CrossRef] [Green Version]
  39. Geigenberger, P.; Stitt, M. Sucrose synthase catalyses a readily reversible reaction in vivo in developing potato tubers and other plant tissues. Planta 1993, 189, 329–339. [Google Scholar] [CrossRef]
  40. Liu, J.; Wang, Y.; Chen, J.; Lv, F.; Ma, Y.; Meng, Y.; Chen, B.; Zhou, Z. Sucrose metabolism in the subtending leaf to cotton boll at different fruiting branch nodes and the relationship to boll weight. J. Agric. Sci. 2014, 152, 790–804. [Google Scholar] [CrossRef]
  41. Garcia-Caparros, P.; Lao, M.T.; Preciado-Rangel, P.; Sanchez, E. Phosphorus and carbohydrate metabolism in green bean plants subjected to increasing phosphorus concentration in the nutrient solution. Agronomy 2021, 11, 245. [Google Scholar] [CrossRef]
  42. Brooks, A. Effects of phosphorus nutrition on ribulose-1,5-bisphosphate carboxylase activation, photosynthetic quantum yield and amounts of some Calvin-cycle metabolites in spinach leaves. Aus. J. Plant Physiol. 1986, 13, 221–237. [Google Scholar] [CrossRef]
  43. Usuda, H.; Shimogawara, K. Phosphate deficiency in maize. II. Enzyme activities. Plant Cell Physiol. 1991, 32, 1313–1317. [Google Scholar]
  44. Rao, I.M.; Terry, N. Leaf phosphate status, photosynthesis, and carbon partitioning in sugar beet: I. Changes in growth, gas exchange, and calvin cycle enzymes. Plant Physiol. 1989, 90, 814–819. [Google Scholar] [CrossRef] [Green Version]
  45. Rao, I.M.; Fredeen, A.L.; Terry, N. Leaf Phosphate Status, Photosynthesis, and Carbon Partitioning in Sugar Beet: III. Diurnal Changes in Carbon Partitioning and Carbon Export. Plant Physiol. 1990, 92, 29–36. [Google Scholar] [CrossRef] [PubMed] [Green Version]
  46. Paul, M.J.; Stitt, M. Effects of nitrogen and phosphorus deficiencies on levels of carbohydrates, respiratory enzymes and metabolites in seedlings of tobacco and their response to exogenous sucrose. Plant Cell Physiol. 1993, 16, 1047–1057. [Google Scholar] [CrossRef]
  47. Wang, G. The Effects and Mechanism on the Cotton Growth under the Available Phosphorus Levels. Master’s Thesis, Chinese Academy of Agricultural Sciences, Anyang, China, 2016. [Google Scholar]
  48. Ahmad, I.; Zhou, G.; Zhu, G.; Ahmad, Z.; Ibrahim, M. Response of leaf characteristics of BT cotton plants to ratio of nitrogen, phosphorus and potassium. Pak. J. Bot. 2021, 53, 3. [Google Scholar] [CrossRef]
  49. Wells, R. Response of leaf ontogeny and photosynthetic activity to reproductive growth in cotton. Plant Physiol. 1988, 87, 274–279. [Google Scholar] [CrossRef] [Green Version]
  50. Bondada, B.R.; Oosterhuis, D.M. Canopy photosynthesis, specific leaf weight, and yield components of cotton under varying nitrogen supply. J.Plant Nutr. 2001, 24, 469–477. [Google Scholar] [CrossRef]
  51. Wang, R.; Ji, S.; Zhang, P.; Meng, Y.L.; Zhou, Z.G. Drought effects on cotton yield and fiber quality on different fruiting branches. Crop Sci. 2016, 56, 1265–1276. [Google Scholar] [CrossRef]
  52. Li, X.G. Effect of Controlled Release N Fertilizer on Spatio-Temporal Distribution of Cotton Bolls and Fiber Quality and its Physiological Basis. Master’s Thesis, Shandong Agricultural University, Tai’an, China, 2009. [Google Scholar]
  53. Li, Z.T.; Chen, E.Y.; Song, X.L.; Zhang, M.L.; Zhao, Q.L.; Xu, X.L.; Ji, H.; Sun, X.Z. Effects of the rate and the timing of potassium application on cotton (Gossypium hirsutum L.) yield and on fibre quality of cotton bolls at different fruit positions. Plant Nutr. Fert. Sci. 2012, 18, 123–131, (In Chinese with English Abstract). [Google Scholar] [CrossRef]
  54. Li, P.C.; Dong, H.L.; Zheng, C.S.; Sun, M.; Liu, A.Z.; Wang, G.P.; Liu, S.D.; Zhang, S.P.; Chen, J.; Li, Y.B.; et al. Optimizing nitrogen application rate and plant density for improving cotton yield and nitrogen use efficiency in the North China Plain. PLoS ONE 2017, 12, 15. [Google Scholar] [CrossRef] [Green Version]
  55. Kuai, J.; Zhou, Z.G.; Wang, Y.H.; Meng, Y.L.; Chen, B.L.; Zhao, W.Q. The effects of short-term waterlogging on the lint yield and yield components of cotton with respect to boll position. Eur. J. Agron. 2015, 67, 61–74. [Google Scholar] [CrossRef]
  56. Hendrix, D.L. Rapid extraction and analysis of nonstructural carbohydrates in plant tissues. Crop Sci. 1993, 33, 1306–1311. [Google Scholar] [CrossRef]
  57. Seifter, S.; Dayton, S. The estimation of glycogen with the anthrone reagent. Arch. Biochem. 1950, 25, 191–200. [Google Scholar] [PubMed]
  58. Liu, J.R.; Ma, Y.N.; Lv, F.J.; Chen, J.; Zhou, Z.G.; Wang, Y.H.; Abudurezike, A.; Oosterhuis, D.M. Changes of sucrose metabolism in leaf subtending to cotton boll under cool temperature due to late planting. Field Crop. Res. 2013, 144, 200–211. [Google Scholar] [CrossRef]
  59. Jang, H.K.; Lee, S.W.; Lee, Y.H.; Hahn, T.R. Purification and characterization of a recombinant pea cytoplasmic fructose-1,6-bisphosphatase. Protein Expr. Purif. 2003, 28, 42–48. [Google Scholar] [CrossRef]
  60. Huber, S.C.; Israel, D.W. Biochemical basis for partitioning of photosynthetically fixed carbon between starch and sucrose in soybean (Glycine maxMerr.) leaves. Plant Physiol. 1982, 69, 691–696. [Google Scholar] [CrossRef] [Green Version]
  61. Singh, V.; Pallaghy, C.K.; Singh, D. Phosphorus nutrition and tolerance of cotton to water stress I. Seed cotton yield and leaf morphology. Field Crop. Res. 2006, 96, 191–198. [Google Scholar] [CrossRef]
  62. Ackerson, R.C. Osmoregulation in cotton in response to water stress: III. Effects of phosphorus fertility. Plant Physiol. 1985, 77, 309–312. [Google Scholar] [CrossRef] [Green Version]
  63. Ashley, D.A. 14C-labelled photosynthate translocation and utilization in cotton plants. Crop Sci. 1972, 12, 69–74. [Google Scholar] [CrossRef]
  64. Constable, G.A.; Rawson, H.M. Carbon production and utilization in cotton: Inferences from a carbon budget. Aus. J. Plant Physiol. 1980, 7, 539–553. [Google Scholar] [CrossRef]
  65. Wullschleger, S.D.; Oosterhuis, D.M. Photosynthetic carbon production and use by developing cotton leaves and bolls. Crop Sci. 1990, 30, 1259–1264. [Google Scholar] [CrossRef]
  66. Hu, W.; Dai, Y.; Zhao, W.; Meng, Y.; Chen, B.; Wang, Y.; Zhou, Z. Effects of long-term elevation of air temperature on sucrose metabolism in cotton leaves at different positions. J. Agron. Crop Sci. 2017, 203, 539–552. [Google Scholar] [CrossRef]
  67. Huber, S.C. Biochemical Mechanism for regulation of sucrose accumulation in leaves during photosynthesis. Plant Physiol. 1989, 91, 656–662. [Google Scholar] [CrossRef] [Green Version]
  68. Yu, X.C.; Wang, J.; Zhu, M.Y.; Jiang, J. Molecular mechanism of carbohydrate metabolism participation in tomato response to low phosphorus stress. Mol. Plant Breed. 2015, 13, 2833–2842, (In Chinese with English Abstract). [Google Scholar]
  69. Wasaki, J.; Shinano, T.; Onishi, K.; Yonetani, R.; Yazaki, J.; Fujii, F.; Shimbo, K.; Ishikawa, M.; Shimatani, Z.; Nagata, Y.; et al. Transcriptomic analysis indicates putative metabolic changes caused by manipulation of phosphorus availability in rice leaves. J. Exp. Bot. 2006, 57, 2049–2059. [Google Scholar] [CrossRef] [Green Version]
  70. Jiang, D.; Tao, Q.N.; Cao, W.X. Effects of waterlogging on accumulation and redistribution of water solublecarbohydrate metabolism in culm of wheat. Acta Agron. Sin. 2002, 28, 230–234, (In Chinese with English Abstract). [Google Scholar]
  71. Qiu, J.; Israel, D.W. Diurnal starch accumulation and utilization in phosphorus-deficient soybean plants. Plant Physiol. 1992, 98, 316–323. [Google Scholar] [CrossRef] [Green Version]
  72. Poudyal, S.; Owen, J.S., Jr.; Sharkey, T.D.; Fernandez, R.T.; Cregg, B. Phosphorus requirement for biomass accumulation is higher compared to photosynthetic biochemistry for three ornamental shrubs. Sci. Hortic. 2021, 275, 109719. [Google Scholar] [CrossRef]
  73. Natr, L. Mineral nutrients—A ubiquitous stress factor for photosynthesis. Photosynthetica 1992, 27, 271–294. [Google Scholar]
  74. Hendrix, D.L.; Grange, R.I. Carbon partitioning and export from mature cotton leaves. Plant Physiol. 1991, 95, 228–233. [Google Scholar] [CrossRef] [Green Version]
  75. Lv, F.J.; Liu, J.R.; Ma, Y.N.; Chen, J.; Abudurezikekey, A.K.; Wang, Y.H.; Chen, B.L.; Meng, Y.L.; Zhou, Z.G. Effect of shading on cotton yield and quality on different fruiting branches. Crop Sci. 2013, 53, 2670–2678. [Google Scholar] [CrossRef]
  76. Usuda, H.; Shimogawara, K. Phosphate deficiency in maize. IV. Changes in amounts of sucrose phosphate synthase during the course of phosphate deprivation. Plant Cell Physiol. 1993, 34, 767–770. [Google Scholar] [CrossRef]
  77. Wu, S.; Li, M.; Zhang, C.; Tan, Q.; Yang, X.; Sun, X.; Pan, Z.; Deng, X.; Hu, C. Effects of phosphorus on fruit soluble sugar and citric acid accumulations in citrus. Plant Physiol. Biochem. 2021, 160, 73–81. [Google Scholar] [CrossRef] [PubMed]
  78. Lunn, J.E.; Hatch, M.D. Primary partitioning and storage of photosynthate in sucrose andstarch in leaves of C4 plants. Planta 1995, 197, 385–391. [Google Scholar] [CrossRef]
  79. Schachtman, D.P.; Reid, R.J.; Ayling, S.M. Phosphorus uptake by plants: From soil to cell. Plant Physiol. 1998, 116, 447–453. [Google Scholar] [CrossRef] [PubMed] [Green Version]
  80. Suzuki, S.; Nakamoto, H.; Ku, M.S.; Edwards, G.E. Influence of leaf age on photosynthesis, enzyme activity, and metabolite levels in wheat. Plant Physiol. 1987, 84, 1244–1248. [Google Scholar] [CrossRef] [Green Version]
  81. Li, H.J.; Wang, J.W.; Ali, S.; Iqbal, B.; Zhang, H.; Wang, S.S.; Chen, B.L.; Zhou, Z.G. Agronomic traits at the seedling stage, yield, and fiber quality in two cotton (Gossypium hirsutum L.) cultivars in response to phosphorus deficiency. Soil Sci. Plant Nutr. 2020, 66, 308–316. [Google Scholar] [CrossRef]
  82. Iqbal, B.; Kong, F.; Ullah, I.; Ali, S.; Li, H.; Wang, J.; Khattak, W.A.; Zhou, Z. Phosphorus application improves the cotton yield by enhancing reproductive organ biomass and nutrient accumulation in two cotton cultivars with different phosphorus sensitivity. Agronomy 2020, 10, 153. [Google Scholar] [CrossRef] [Green Version]
  83. Sun, M.; Li, P.C.; Zheng, C.S.; Liu, S.; Liu, A.Z.; Han, H.M.; Liu, J.R.; Dong, H.L. Effects of low phosphorus stress on root morphology and physiological characteristics of different cotton genotypes at the seedling stage. Cott. Sci. 2018, 30, 45–52, (In Chinese with English Abstract). [Google Scholar] [CrossRef]
Figure 1. Monthly meteorological data during the 2019–2020 cotton-growing periods at the test station in Anyang. The meteorological data were obtained from an automatic weather station located ~4 km from the test station.
Agronomy 12 01065 g001
Figure 2. The effect of soil available phosphorus (AP) contents on the phosphorus (P) concentration in the subtending leaves during the 2019–2020 cotton-growing seasons. d: day. FB: fruiting branch. P0: 3 ± 0.5 mg kg−1. P1: 6 ± 0.5 mg kg−1. P2: 15 ± 0.5 mg kg−1.
Agronomy 12 01065 g002
Figure 3. Theeffect of soil available phosphorus (AP) on the net photosynthetic rate (Pn) ofsubtending leaves in 2019 and 2020 cotton-growing seasons. d: day. FB: fruiting branch. P0: 3 ± 0.5 mg kg−1. P1: 6 ± 0.5 mg kg−1. P2: 15 ± 0.5 mg kg−1.
Agronomy 12 01065 g003
Figure 4. The effect of soil available phosphorus (AP) on the soluble sugar content of subtending leaves in 2019 and 2020 cotton-growing seasons. d: day. FB: fruiting branch. P0: 3 ± 0.5 mg kg−1. P1: 6 ± 0.5 mg kg−1. P2: 15 ± 0.5 mg kg−1.
Agronomy 12 01065 g004
Figure 5. The effect of soil available phosphorus (AP) on the sucrose content of subtending leaves in 2019 and 2020 cotton-growing seasons. d: day. FB: fruiting branch. P0: 3 ± 0.5 mg kg−1. P1: 6 ± 0.5 mg kg−1. P2: 15 ± 0.5 mg kg−1.
Agronomy 12 01065 g005
Figure 6. The effect of soil available phosphorus (AP) on the starch content of subtending leaves in 2019 and 2020 cotton-growing seasons. d: day. FB: fruiting branch. P0: 3 ± 0.5 mg kg−1. P1: 6 ± 0.5 mg kg−1. P2: 15 ± 0.5 mg kg−1.
Agronomy 12 01065 g006
Figure 7. The effect of soil available phosphorus (AP) on the initial ribulose-1,5-bisphosphate carboxylase-oxygenase (Rubisco) activity of subtending leaves in 2019 and 2020 cotton-growing seasons. d: day. FB: fruiting branch. P0: 3 ± 0.5 mg kg−1. P1: 6 ± 0.5 mg kg−1. P2: 15 ± 0.5 mg kg−1.
Agronomy 12 01065 g007
Figure 8. The effect of soil available phosphorus (AP) on the cytosolic fructose-1,6-bisphosphatase (cy-FBPase) activity of subtending leaves in 2019 and 2020 cotton-growing seasons. d: day. FB: fruiting branch. P0: 3 ± 0.5 mg kg−1. P1: 6 ± 0.5 mg kg−1. P2: 15 ± 0.5 mg kg−1.
Agronomy 12 01065 g008
Figure 9. The effect of soil available phosphorus (AP) on the sucrose phosphate synthase (SPS) activity of subtending leaves in 2019 and 2020 cotton-growing seasons. d: day. FB: fruiting branch. P0: 3 ± 0.5 mg kg−1. P1: 6 ± 0.5 mg kg−1. P2: 15 ± 0.5 mg kg−1.
Agronomy 12 01065 g009
Figure 10. The effect of soil available phosphorus (AP) on the sucrose synthase (SuSy) activity of subtending leaves in 2019 and 2020 cotton-growing seasons. d: day. FB: fruiting branch. P0: 3 ± 0.5 mg kg−1. P1: 6 ± 0.5 mg kg−1. P2: 15 ± 0.5 mg kg−1.
Agronomy 12 01065 g010
Figure 11. The effect of soil available phosphorus (AP) on cotton boll biomass partitioning in the boll wall, seed, and lint in 2019 and 2020. The subscripts of L/S, L/B, S/B, and B/B represent lint:seed, lint:boll, seed:boll, and boll wall:boll ratios, respectively.
Agronomy 12 01065 g011
Table 1. Nutrient properties of the top 0–20 cm soil from the experimental site during the 2019–2020 cotton-growing periods.
YearOM 1TNANAKpH
(g kg−1)(mg kg−1)
201912.90.8664.4163.67.7
202013.10.8563.3180.47.6
1 OM: organic matter; TN: total nitrogen; AN: available nitrogen; AK: available potassium.
Table 2. The effect of soil available phosphorus (AP) on the maximum and minimum sucrose contents and sucrose transformation rates of subtending leaves in 2019 and 2020.
YearFBP 1AP TreatmentMaximum Sucrose Content
(mg g−1 DW)
Minimum Sucrose Content
(mg g−1 DW)
Sucrose Transformation Rate
(%)
CCRI-79SCRC-28CCRI-79SCRC-28CCRI-79SCRC-28
2019FB2–3P0 321.7 a 221.7 a11.1 a12.4 a48.9 b42.9 c
P117.6 b20.5 b8.9 b10.9 b49.5 b47.0 b
P215.2 c18.6 c7.1 c9.3 c53.3 a49.8 a
CV (%) 418.27.622.214.04.77.4
FB6–7P022.9 a24.8 a11.4 a13.8 a50.1 b44.2 c
P121.1 b24.4 a9.7 b13.0 b53.8 a46.7 b
P217.7 c22.1 b8.0 c11.1 c54.8 a50.1 a
CV (%)12.86.017.611.34.76.3
FB10–11P022.2 a22.7 a10.9 a13.2 a50.9 b42.1 b
P118.9 b21.7 b9.0 b11.8 b52.6 ab45.7 a
P218.7 b19.9 c8.6 b10.5 c54.1 a47.1 a
CV (%)9.76.613.011.03.05.7
2020FB2–3P026.3 a30.1 a14.1 a17.3 a46.3 c42.3 b
P125.0 b26.9 b12.1 b14.1 b51.7 b47.5 a
P222.9 c24.6 c10.6 c11.8 c53.9 a52.0 a
CV (%)6.910.314.619.47.710.3
FB6–7P027.0 a29.8 a13.0 a16.3 a51.9 b45.5 b
P125.3 b26.4 b12.0 b13.8 b52.6 b47.7 b
P224.6 b24.4 c11.0 c11.6 c55.3 a52.7 a
CV (%)4.810.28.217.03.47.6
FB10–11P024.7 a27.6 a11.3 a15.4 a52.0 b44.1 b
P123.7 b25.1 b10.2 b13.6 b54.1 ab45.7 b
P222.2 c22.6 c9.3 c11.6 c58.0 a48.9 a
CV (%)5.49.99.714.35.55.2
1 FBP: fruiting branch position. 2 Different letters in the column represent a significant difference at p = 0.05. 3 P0: 3 ± 0.5 mg kg−1. P1: 6 ± 0.5 mg kg−1. P2: 15 ± 0.5 mg kg−1. 4 CV represents the coefficient of variation.
Table 3. Correlation between carbohydrate content and P concentration of the subtending leaves in 2019 and 2020 cotton-growing periods. (n = 18, R0.05 = 0.468, R0.01 = 0.590).
CultivarComparison withDays Post-Anthesis (d)
101724313845Mean
CCRI-79Soluble sugar0.071−0.538 * 1−0.002−0.0500.077−0.131−0.096
Sucrose−0.002−0.314−0.269−0.0160.0830.066−0.075
Starch−0.312−0.444−0.459−0.146−0.376−0.241−0.330
SCRC-28Soluble sugar−0.251−0.597 **−0.406−0.357−0.201−0.667 **−0.413
Sucrose−0.218−0.565 *−0.715 **−0.220−0.451−0.447−0.436
Starch−0.887 **−0.872 **−0.863 **−0.473 *−0.773 **−0.796 **−0.777
1 * significantly different at p = 0.05. ** significantly different at p = 0.01.
Table 4. Correlation between sucrose-metabolizing enzyme activity and P concentration in the subtending leaves in 2019 and 2020 cotton-growing periods. (n = 18, R0.05 = 0.468, R0.01 = 0.590).
CultivarComparison withDays Post-Anthesis (d)
101724313845Mean
CCRI-79Initial Rubisco 1−0.0140.0460.1610.1990.0210.2370.108
cy-FBPase 2−0.166−0.180−0.212−0.280−0.218−0.423−0.247
SPS 30.0460.760 ** 50.772 **0.2580.495 *0.4520.464
SuSy 40.616 **0.699 **0.678 **−0.089−0.3430.3370.316
SCRC-28Initial Rubisco−0.0530.1730.039−0.042−0.101−0.110−0.016
cy-FBPase−0.771 **−0.573 *−0.783 **−0.811 **−0.884 **−0.880−0.784
SPS0.720 **0.634 **0.861 **−0.0680.2080.738 **0.516
SuSy0.770 **0.3690.553 *−0.1150.2400.641 ** 1.410
1 Rubisco: ribulose-1,5-bisphosphate carboxylase-oxygenase. 2 cy-FBPase: cytosolic fructose-1,6-bisphosphatase. 3 SPS: sucrose phosphate synthase. 4 SuSy: sucrose synthase. 5 * significantly different at p = 0.05. ** significantly different at p = 0.01.
Table 5. The effect of soil available phosphorus (AP) on lint yield and yield components of different fruiting branches in 2019 and 2020.
CultivarFBP 1AP Treatment20192020
Boll Number
(Boll Plant−1)
Boll Biomass (g Boll−1)Lint Percentage
(%)
Lint Yield
(kg ha−1)
Boll Number
(Boll Plant−1)
Boll Biomass (g Boll−1)Lint Percentage
(%)
Lint Yield
(kg ha−1)
CCRI-79FB1–4P0 24.3 b 35.3 c38.0 b349.7 c4.0 b5.4 c37.7 c342.3 c
P15.5 ab6.2 b38.2 b527.1 b6.9 a6.0 b40.4 b681.0 b
P26.3 a6.9 a41.0 a727.4 a7.4 a7.0 a42.7 a885.8 a
CV (%) 418.813.34.435.330.112.86.143.1
FB5–8P03.1 b5.9 c40.3 b295.1 b3.9 b6.1 b40.4 a384.9 c
P13.4 ab6.4 b42.6 a367.2 b4.5 ab6.5 b42.3 a496.1 b
P24.2 a7.1 a43.7 a524.1 a4.8 a7.1 a42.9 a592.2 a
CV (%)16.69.74.029.610.48.13.121.1
FB9–12P03.4 a6.2 b42.5 b332.5 b3.0 a6.5 b46.9 a367.0 b
P13.2 a6.4 b46.7 a396.9 ab3.5 a7.1 a47.1 a464.9 a
P23.7 a7.3 a45.6 a469.1 a3.6 a7.7 a46.8 a510.3 a
CV (%)7.38.74.917.19.58.50.316.4
SCRC-28FB1–4P03.2 b5.0 c37.6 c246.0 c3.5 c4.7 c36.1 b248.1 c
P14.8 a6.3 b38.9 b473.1 b6.5 b6.2 b38.7 ab641.6 b
P25.6 a6.7 a42.9 a633.6 a7.1 a7.2 a41.5 a868.5 a
CV (%)27.014.26.943.233.820.36.953.6
FB5–8P02.2 b5.4 b37.7 b176.8 c3.2 b5.5 c38.4 b268.8 b
P12.9 b6.3 a40.3 a285.9 b3.7 ab6.5 b41.2 a388.5 b
P23.8 a6.7 a41.0 a408.7 a4.6 a7.5 a41.3 a579.6 a
CV (%)27.011.34.439.918.515.34.138.0
FB9–12P02.5 b5.3 b38.2 b196.2 b1.9 b5.5 c40.3 b172.6 b
P13.0 ab6.1 a39.0 b277.5 a2.4 a5.9 b42.9 a241.9 a
P23.3 a6.5 a42.3 a345.3 a2.4 a6.5 a42.7 a262.1 a
CV (%)13.810.35.527.312.98.93.620.8
Significance
Cultivar (C) NS 5**************
FBP ****************
AP ****************
C × FBP ******NSNS******
C × AP ****NSNS**NSNS
FBP × AP NS************
C × FBP × AP NSNS**NSNS*NSNS
1 FBP: fruiting branch position. 2 P0: 3 ± 0.5 mg kg−1. P1: 6 ± 0.5 mg kg−1. P2: 15 ± 0.5 mg kg−1. 3 Different letters in the column represent significant differences at p = 0.05. 4 CV means coefficient of variation. 5 NS means nonsignificance at p = 0.05. * represents significance at p = 0.05. ** represents significance at p = 0.01.
Table 6. The effect of soil available phosphorus (AP) on the cotton boll biomass partitioning across different fruiting branches in 2019 and 2020.
CultivarFBP 1AP Treatment20192020
Boll Dry Mass
(g)
Proportion
(%)
Boll Dry Mass
(g)
Proportion
(%)
Boll WallLintSeedL/S 2Boll WallLintSeedL/S
CCRI-79FB1–4P01.2 b 31.5 c2.5 b61.2 b1.1 c1.6 c2.7 c60.6 c
P11.4 ab1.8 b3.0 a61.8 b1.3 b1.9 b2.8 b67.7 b
P21.6 a2.2 a3.2 a69.6 a1.6 a2.3 a3.1 a74.4 a
CV (%) 412.417.611.27.316.717.07.710.2
FB5–8P01.4 c1.8 c2.7 b67.6 b1.4 b1.9 c2.8 a67.8 a
P11.5 b2.1 b2.8 b74.2 a1.5 b2.1 b2.9 a73.3 a
P21.7 a2.3 a3.0 a77.5 a1.7 a2.4 a3.1 a75.1 a
CV (%)11.713.06.46.99.811.14.85.2
FB9–12P01.5 b2.0 c2.7 ab74.0 b1.5 b2.3 b2.7 b88.3 a
P11.6 b2.2 b2.5 b87.5 a1.7 a2.5 a2.9 ab89.0 a
P22.0 a2.4 a2.9 a84.0 a1.9 a2.7 a3.1 a88.0 a
CV (%)13.99.96.28.612.97.37.90.5
SCRC-28FB1–4P01.1 c1.5 c2.4 b60.3 b1.0 c1.4 c2.4 b56.6 b
P11.5 b1.9 b3.0 a63.6 b1.4 b1.9 b3.0 a63.3 ab
P21.6 a2.2 a2.9 a75.1 a1.7 a2.3 a3.3 a71.0 a
CV (%)17.61910.211.724.426.515.511.3
FB5–8P01.3 b1.5 b2.5 b60.5 b1.3 c1.6 c2.6 c62.5 b
P11.6 a1.9 a2.8 ab67.5 a1.6 b2.0 b2.9 b70.2 a
P21.7 a2.0 a3.0 a69.5 a1.9 a2.4 a3.3 a70.3 a
CV (%)1414.57.77.217.820.011.76.6
FB9–12P01.4 b1.5 c2.4 b61.8 b1.3 cc1.7 c2.5 b67.4 b
P11.6 ab1.8 b2.8 a63.8 b1.5 b1.9 b2.6 b74.7 a
P21.7 a2.0 a2.7 ab73.3 a1.7 a2.1 a2.8 a75.2 a
CV (%)12.314.27.29.213.69.25.36.0
Significance
Cultivar (C) NS 5************
FBP ****************
AP ****************
C × FBP ***NS**********
C × AP NSNS******NS
FBP × AP NS*****NS*****
C × FBP × AP NSNSNS**NSNS**NS
1 FBP: fruiting branch position. 2 L/S: lint:seed ratio. 3 Different letters in the column represent significant difference at p = 0.05. 4 CV represents coeffcient of variation. 5 NS represents nonsignificance at p = 0.05. * represents significance at p = 0.05. ** represents significance at p = 0.01.
Table 7. Correlation between source indices, lint yield, and yield components in 2019 and 2020. (n = 18, R0.05 = 0.468, R0.01 = 0.590).
CultivarCorrelation withPn1Soluble SugarSucroseStarchTr 2Initial Rubisco 3cy-FBPase 4SPS 5SuSy 6
CCRI-79Boll biomass0.466−0.708 ** 7−0.526 *−0.854 **0.780 **0.486 *−0.670 **0.728 **0.804 **
Boll number−0.615 **−0.755 **−0.047−0.3350.095−0.300−0.3830.570*−0.253
Lint/seed ratio0.827 **0.0490.103−0.0610.0650.912 **0.1030.3120.602 **
Lint yield−0.256−0.888 **−0.035−0.4670.1960.083−0.4430.831 **0.633 **
SCRC-28Boll biomass0.470 *−0.129−0.837 **−0.603 **0.723 **0.389−0.2760.4420.715 **
Boll number−0.546 *−0.772 **−0.127−0.643 **0.204−0.053−0.815 **0.1490.325
Lint/seed ratio0.182−0.781 **−0.602 **−0.686 **0.1920.684 **−0.526 *0.746 **0.771 **
Lint yield−0.357−0.814 **−0.324−0.757 **0.3130.161−0.869 **0.3770.499 *
1 Pn: net photosynthetic rate. 2 Tr: sucrose transformation rate. 3 Rubisco: ribulose-1,5-bisphosphate carboxylase-oxygenase. 4 cy-FBPase: cytosolic fructose-1,6-bisphosphatase. 5 SPS: sucrose phosphate synthase. 6 SuSy: sucrose synthase. 7 * represents significant difference at p = 0.05. ** represents significant difference at p = 0.01.
Publisher’s Note: MDPI stays neutral with regard to jurisdictional claims in published maps and institutional affiliations.

