Article

Towards Developing an Epidemic Monitoring and Warning System for Diseases and Pests of Hot Peppers in Guizhou, China

1
Research Center of Information Technology, Beijing Academy of Agriculture and Forestry Sciences/National Engineering Research Center for Information Technology in Agriculture/National Engineering Laboratory for Agri-Product Quality Traceability/Meteorological Service Center for Urban Agriculture, China Meteorological Administration-Ministry of Agriculture and Rural Affairs/Key Laboratory of Cold Chain Logistics Technology for Agro-Product, Ministry of Agriculture and Rural Affairs, Beijing 100097, China
2
Guizhou Chunxin Technology Co., Ltd., Guiyang 550081, China
3
Key Laboratory of Special Fruits and Vegetables Cultivation Physiology and Germplasm Resources Utilization of Xinjiang Production and Construction Corps/Department of Horticulture, Agricultural College of Shihezi University, Shihezi 832003, China
4
Institute of Pepper, Guizhou Academy of Agricultural Sciences, Guiyang 550025, China
*
Authors to whom correspondence should be addressed.
These authors contributed equally to this work.
Agronomy 2022, 12(5), 1034; https://doi.org/10.3390/agronomy12051034
Submission received: 14 March 2022 / Revised: 14 April 2022 / Accepted: 23 April 2022 / Published: 26 April 2022

Abstract

:
Guizhou province is the largest area of hot pepper cultivation and processing in China. However, diseases and pests are major bottlenecks for the sustainable development of the industry. This study proposes a solution that combines intelligent monitoring equipment, a prediction model and decision support system for hot peppers, including a demonstration of the solution in Guizhou province. We scouted hot pepper diseases and pests in Zunyi city, and deployed weather stations and automatic pathogens and pest monitoring equipment. A prediction model was developed to forecast powdery mildew and anthracnose based on long short-term memory, with accuracy of 0.74 and 0.68, respectively. Using big data analysis and an app for pest outbreaks as the front desks, we developed an epidemic monitoring and warning system for hot peppers in Guizhou. The results could effectively serve grass-roots managers, increase productivity, reduce production costs and overall have a high demonstration effect. This concept could be extended to other crops to accelerate the process of agricultural modernization in China.

1. Introduction

During the thirteenth Five-Year Plan period (2016–2020), Guizhou has made remarkable progress in developing modern mountain characteristics and efficient agriculture. As of 2021, hot pepper cultivation covers 0.36 million hm2 in Guizhou, ranking first in China [1]. Severe disease and pest damage are crucial problems affecting the sustainable development of hot pepper agriculture, such as viral disease, anthracnose, powdery mildew, root rot disease, leaf spot disease, aphids, the common cutworm and oriental tobacco budworm. The existing monitoring and early warning methods for disease and pests have many problems, including single method, poor timeliness, low accuracy and weak universality. The development of the Internet of Things (IoT) and big data technology [2] provides higher accuracy and more application methods for predicting the outbreak of agricultural diseases and pests.
Lee [3] used the IoT to establish a pest and disease prediction model by installing a weather station near an orchard to analyze the correlation between weather data. Tripathy [4] explored the implicit relationship between diseases and thrips through data mining technology and monitoring data based on micro-meteorological data, such as temperature, humidity and leaf humidity, obtained by wireless sensor networks, and built a prediction model. Hill [5] used the receiver operating characteristic (ROC) analysis combined with cross-validation and skill score analysis to predict weather prevalence factors based on relative humidity and leaf wet duration in botrytis plants. However, these methods cannot be well correlated with previous data during prediction. Due to a lack of memory, its robustness is limited when predicting data based on the learning process. Long Short-Term Memory (LSTM) is a type of recurrent neural network (RNN) model proposed to solve problems commonly encountered during the prediction of time-series data [6]. It optimizes the gradient disappearance and gradient explosion problems in the iterative RNN process by changing the internal structure. It has been widely used in trajectory prediction [7], air pollution prediction [8], electricity load forecasting [9], traffic flow prediction [10], stock market prediction [11] and other fields with good results. To our knowledge, there are no reports on the application of LSTM to hot pepper disease and pest prediction.
Throughout the development of early warning systems since the mid-1980s, numerous decision support systems and decision rules for the management of diseases in a variety of crops [12] have been developed, including extensive crops (wheat [13] and rice [14]) semi-intensive crops (apple [15] and pear [16]) and intensive crops (tomato [17], potato [18,19], cucumber [20,21], hot pepper [22], grapevine [23] and strawberry [24]). Some of these systems have been used widely, but others have not. Only few studies combine hot pepper disease and pest prediction models with early warning systems for the purpose of troubleshooting.
This paper proposes a solution combined with intelligent monitoring equipment, prediction models and a decision support system for hot peppers, along with a demonstration in Guizhou province. The solution integrates transfer disciplines of vegetable cultivation, plant protection, IoT [25] and information technology [26], and it has the support of a variety of stakeholders, such as research institutes, enterprises and farms. This study aimed to enhance the service capacity of disease and pest forecasting, reduce the use of chemical pesticides and ensure the safe production of high-quality vegetables.

2. Materials and Methods

2.1. Hot Pepper Cultivation

All hot pepper plants (‘QIANJIAO NO.8′ variety, provided by Institute of Pepper, Guizhou Academy of Agricultural Sciences) were transplanted at the end of May on the Guanzhuang base of Xinpu’s new district, Zunyi City, Guizhou Province. The plot area is 546 m2. The border was opened according to a 1.3 m continuous ditch. The width of the ridge was 80 cm, and the height of the ridge was 20 cm. The plants were spaced 40 cm apart in rows 60 cm apart, with a central aisle of 50 cm. Two rows of border planting and single plant planting were arranged.

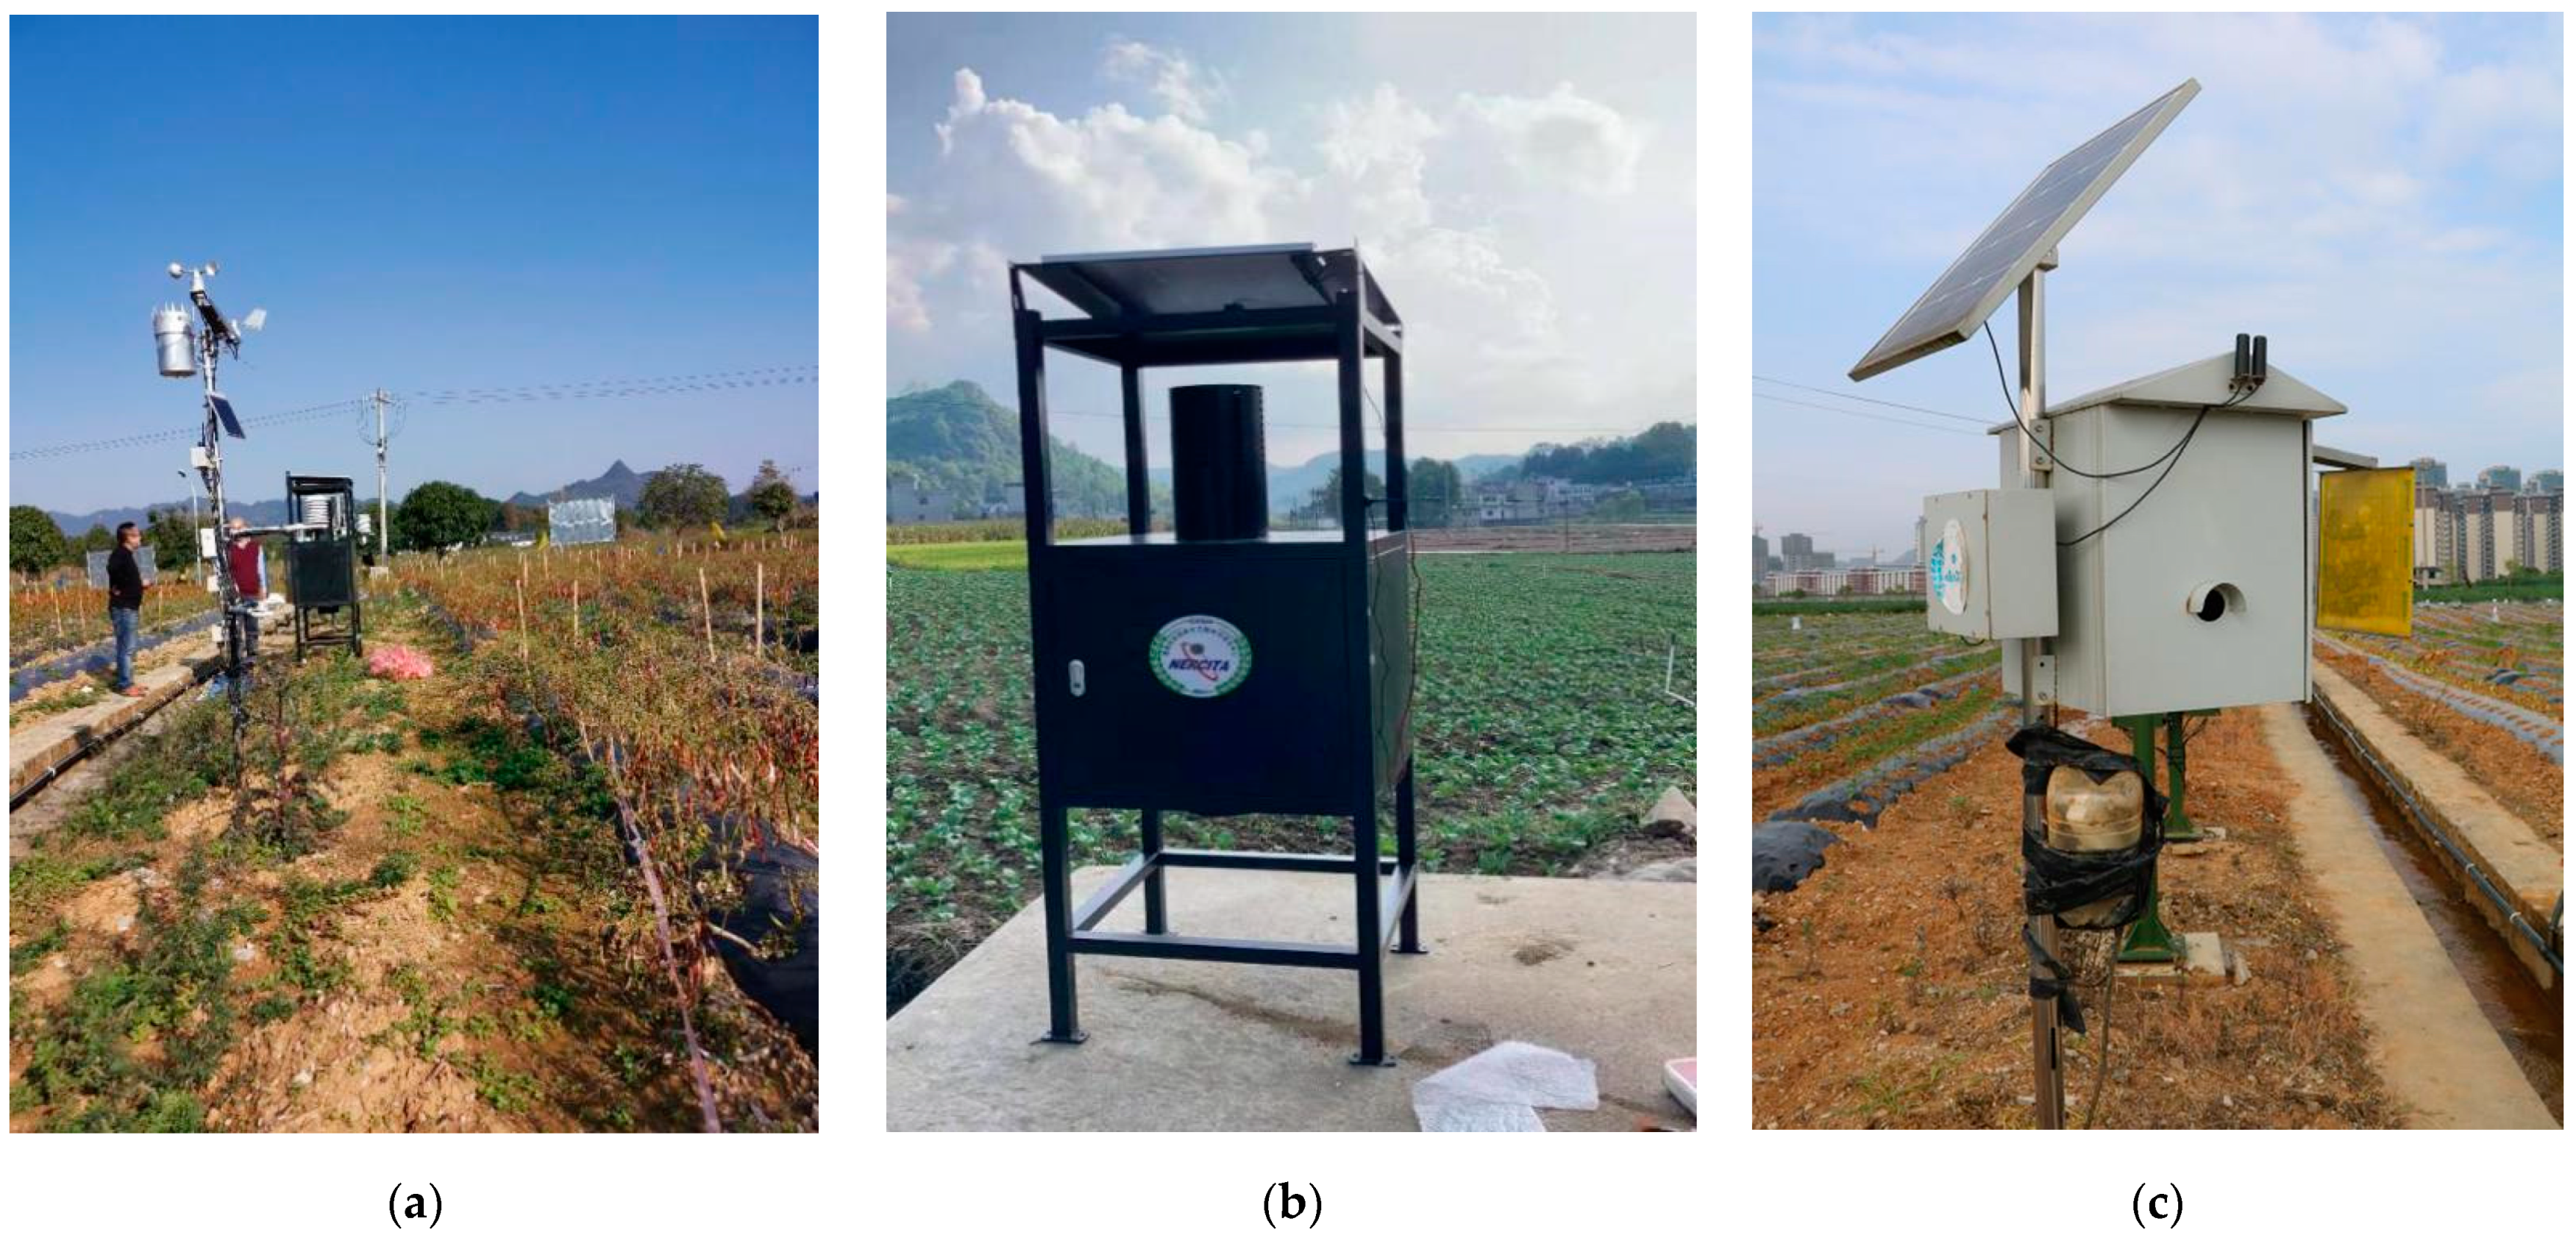
2.2. Disease, Pests, Weather Record-Keeping

Field scouting was conducted every day until disease and pest occurrence. On 22 June, ten traps were deployed for the common cutworm, cotton bollworm and oriental tobacco budworm. Each trap was installed at a crossway 20 cm above the top bud; on 8 August, six beet armyworm traps were added. The traps consisted of the trap itself (sex pheromones and sticky boards), a camera (12 million pixels), a processor and the power supply. Images were captured hourly, and were wirelessly transmitted to the network service platform before pest species identification on the server in the processor. The sex pheromones used were in the form of a capillary hanging lure core (Beijing Pherobio Technology Co., Ltd., Beijing, China), which was replaced monthly. The traps were managed according to convention, but sterilization and insecticide were not used. Traps were checked regularly. Automatic pathogen and pest monitoring equipment was also deployed for demonstration (Figure 1).
The diagonal five-point sampling method was used to mark out five subplots. The northwest, northeast, southeast, southwest and center positions were numbered 1–5, respectively. Within these five sub-plots, 100 hot pepper plants were selected for a general survey and systematic investigation of disease and pests. We selected investigation contents, such as the occurrence time, growth period and incidence of disease and pests for fixed points (fixed plants) at specified times.

2.3. Model Development

2.3.1. Model Variable Selection and Data Preprocessing

The occurrence of disease and pests is closely related to several environmental factors. According to the local climate characteristics and the epidemic rules of disease and pests, temperature, relative humidity, solar radiation, rainfall and wind speed every 30 min were used as the model input variables to predict the occurrence of disease and pests. These data were acquired by the weather station from planting until the end of the growing season; disease and pest occurrence were added to build a model dataset.
We used the linear interpolation equation to process the missing values as follows
Y = Y 0 + Y 1 Y 0 X 1 X 0 ( X X 0 )
where X0, Y0, X1 and Y1 are existing sample data. X is data between X0 and X1. Y is missing data, to be interpolated corresponding to X.
The min-max normalization method was adopted because these environmental data had different dimensional units, differences within each category were small, and the distribution was close. The normalization equation is as follows
X * = X i X m i n X m a x X m i n
where Xi represents all sample data (i = 1, 2, ..., n). Xmin and Xmax are the minimum and maximum values of the variable X in a sampled dataset. X* are the normalized results. Model training was based on 70% of the total data (train dataset), and the remaining 30% (test dataset) was used to test the effectiveness of the validation model.

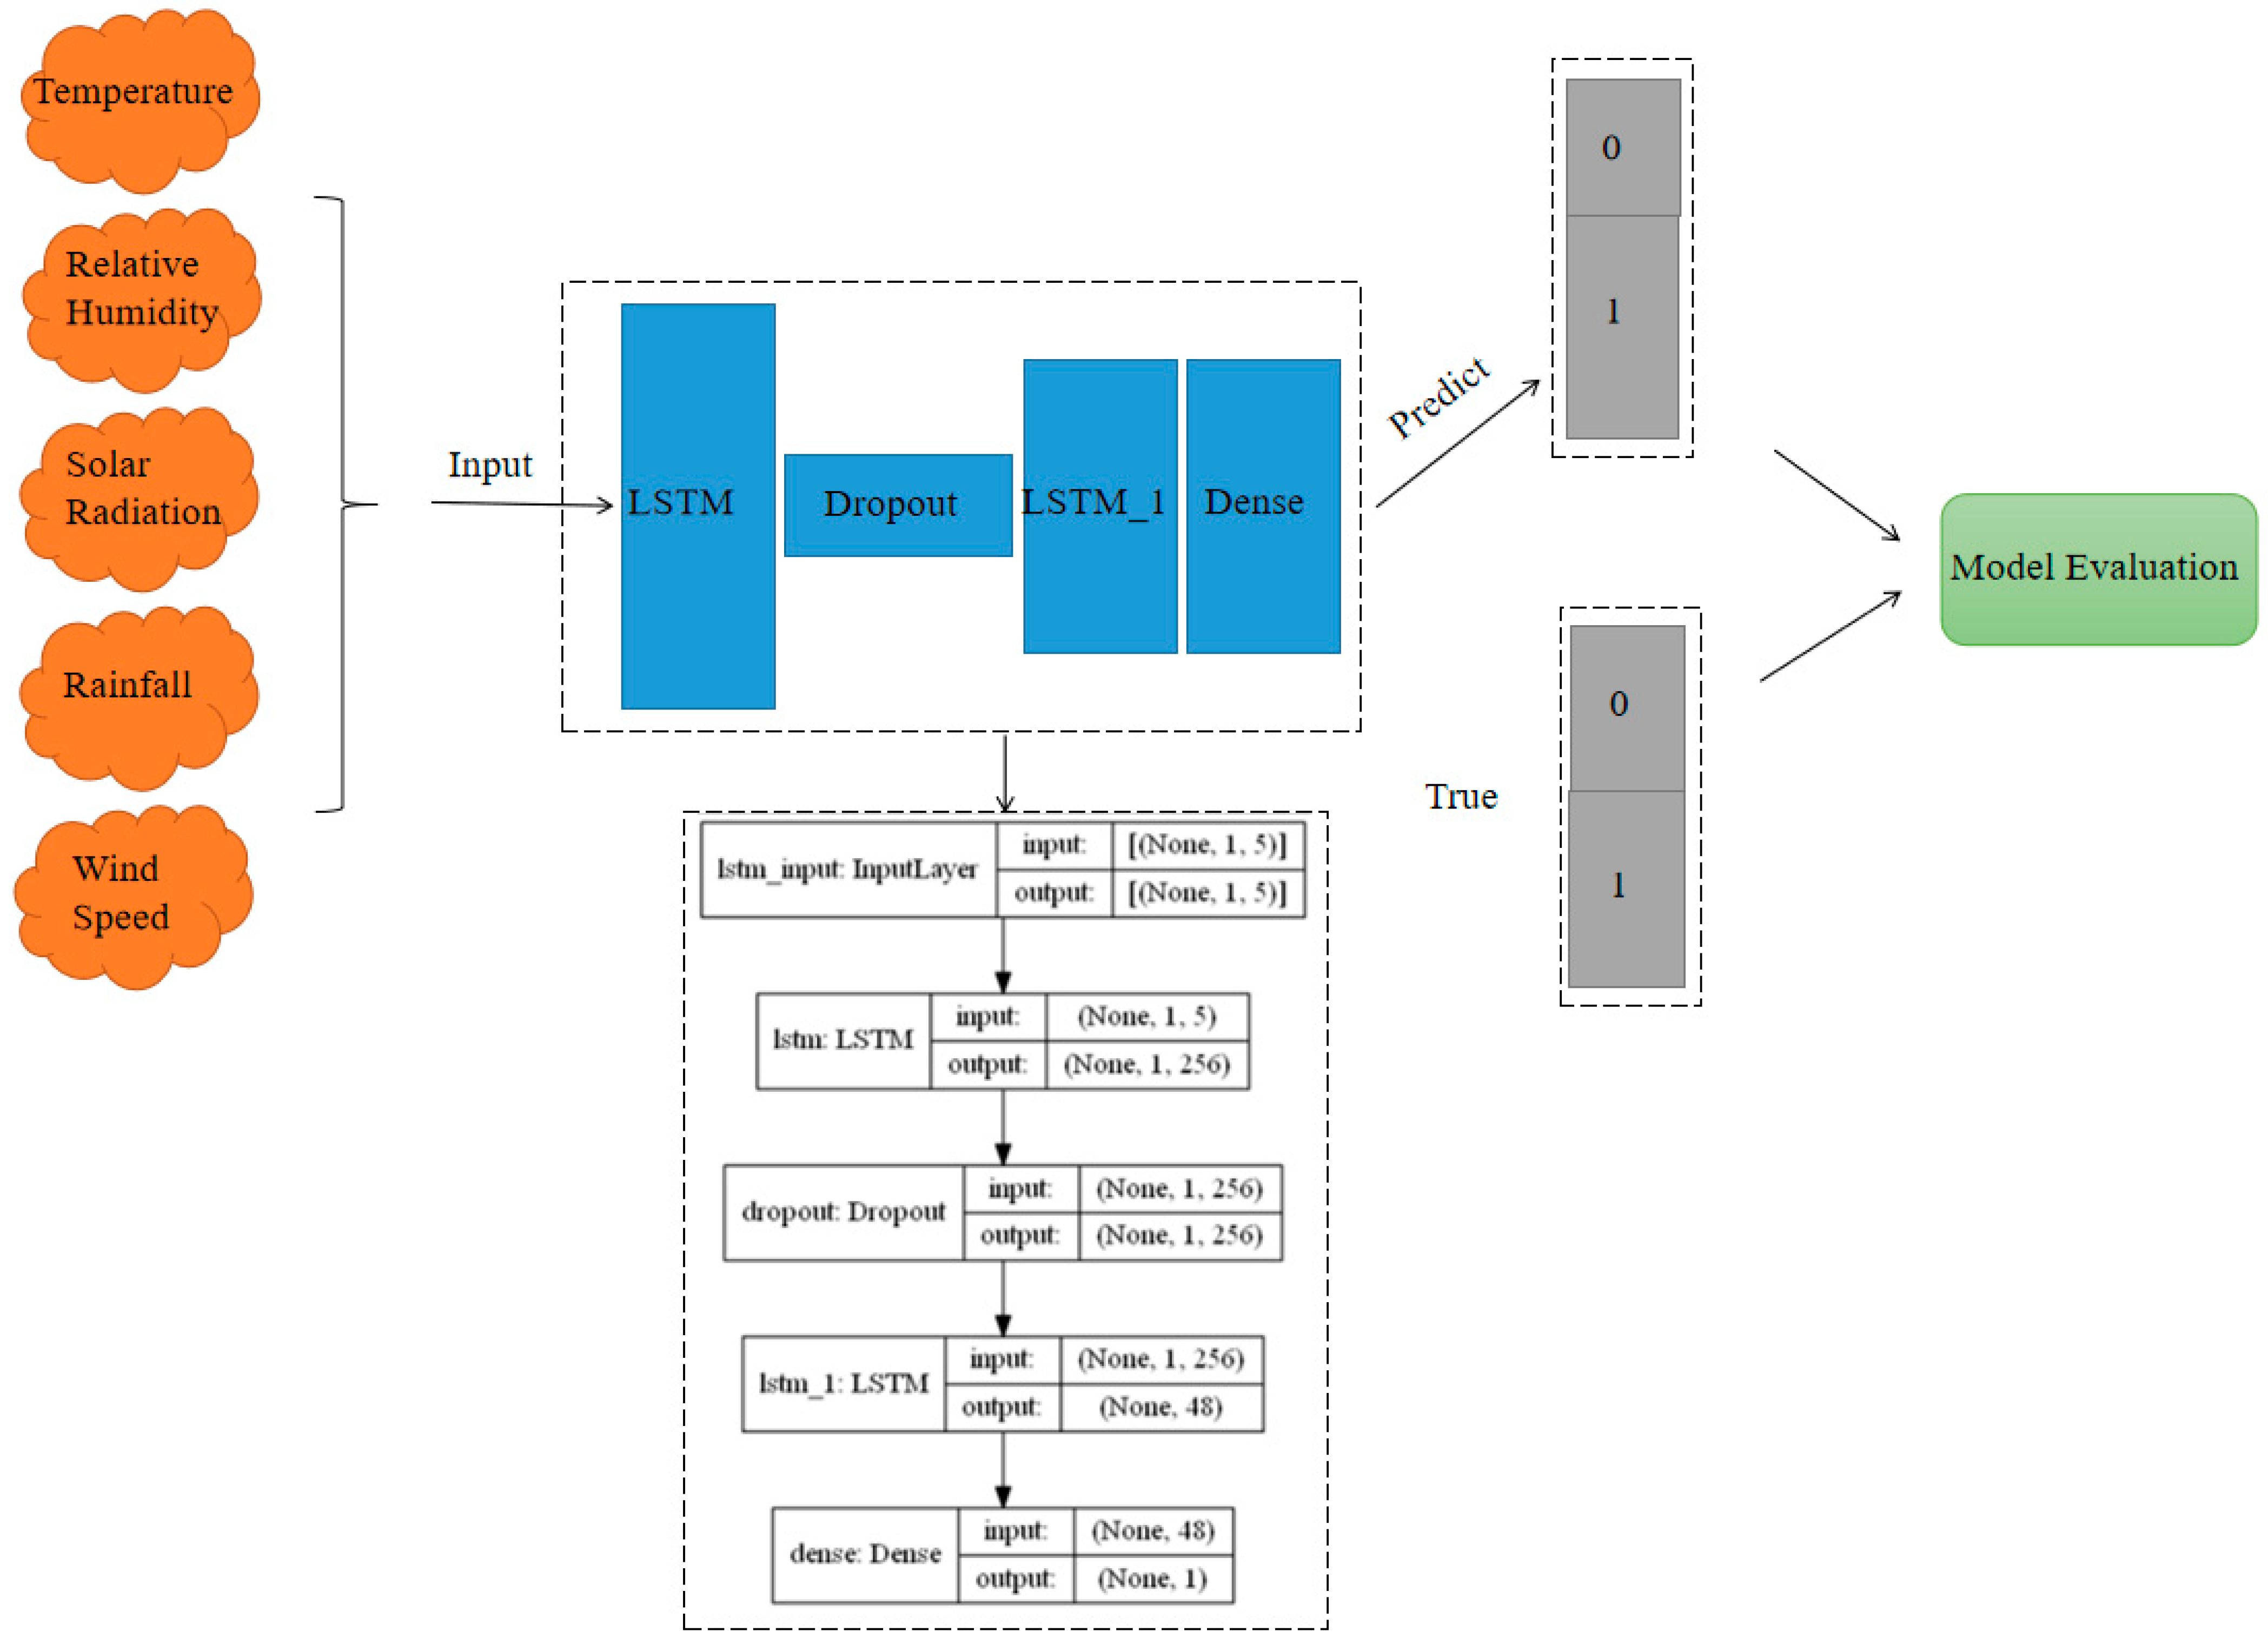
2.3.2. Development of the Disease Occurrence Prediction Model
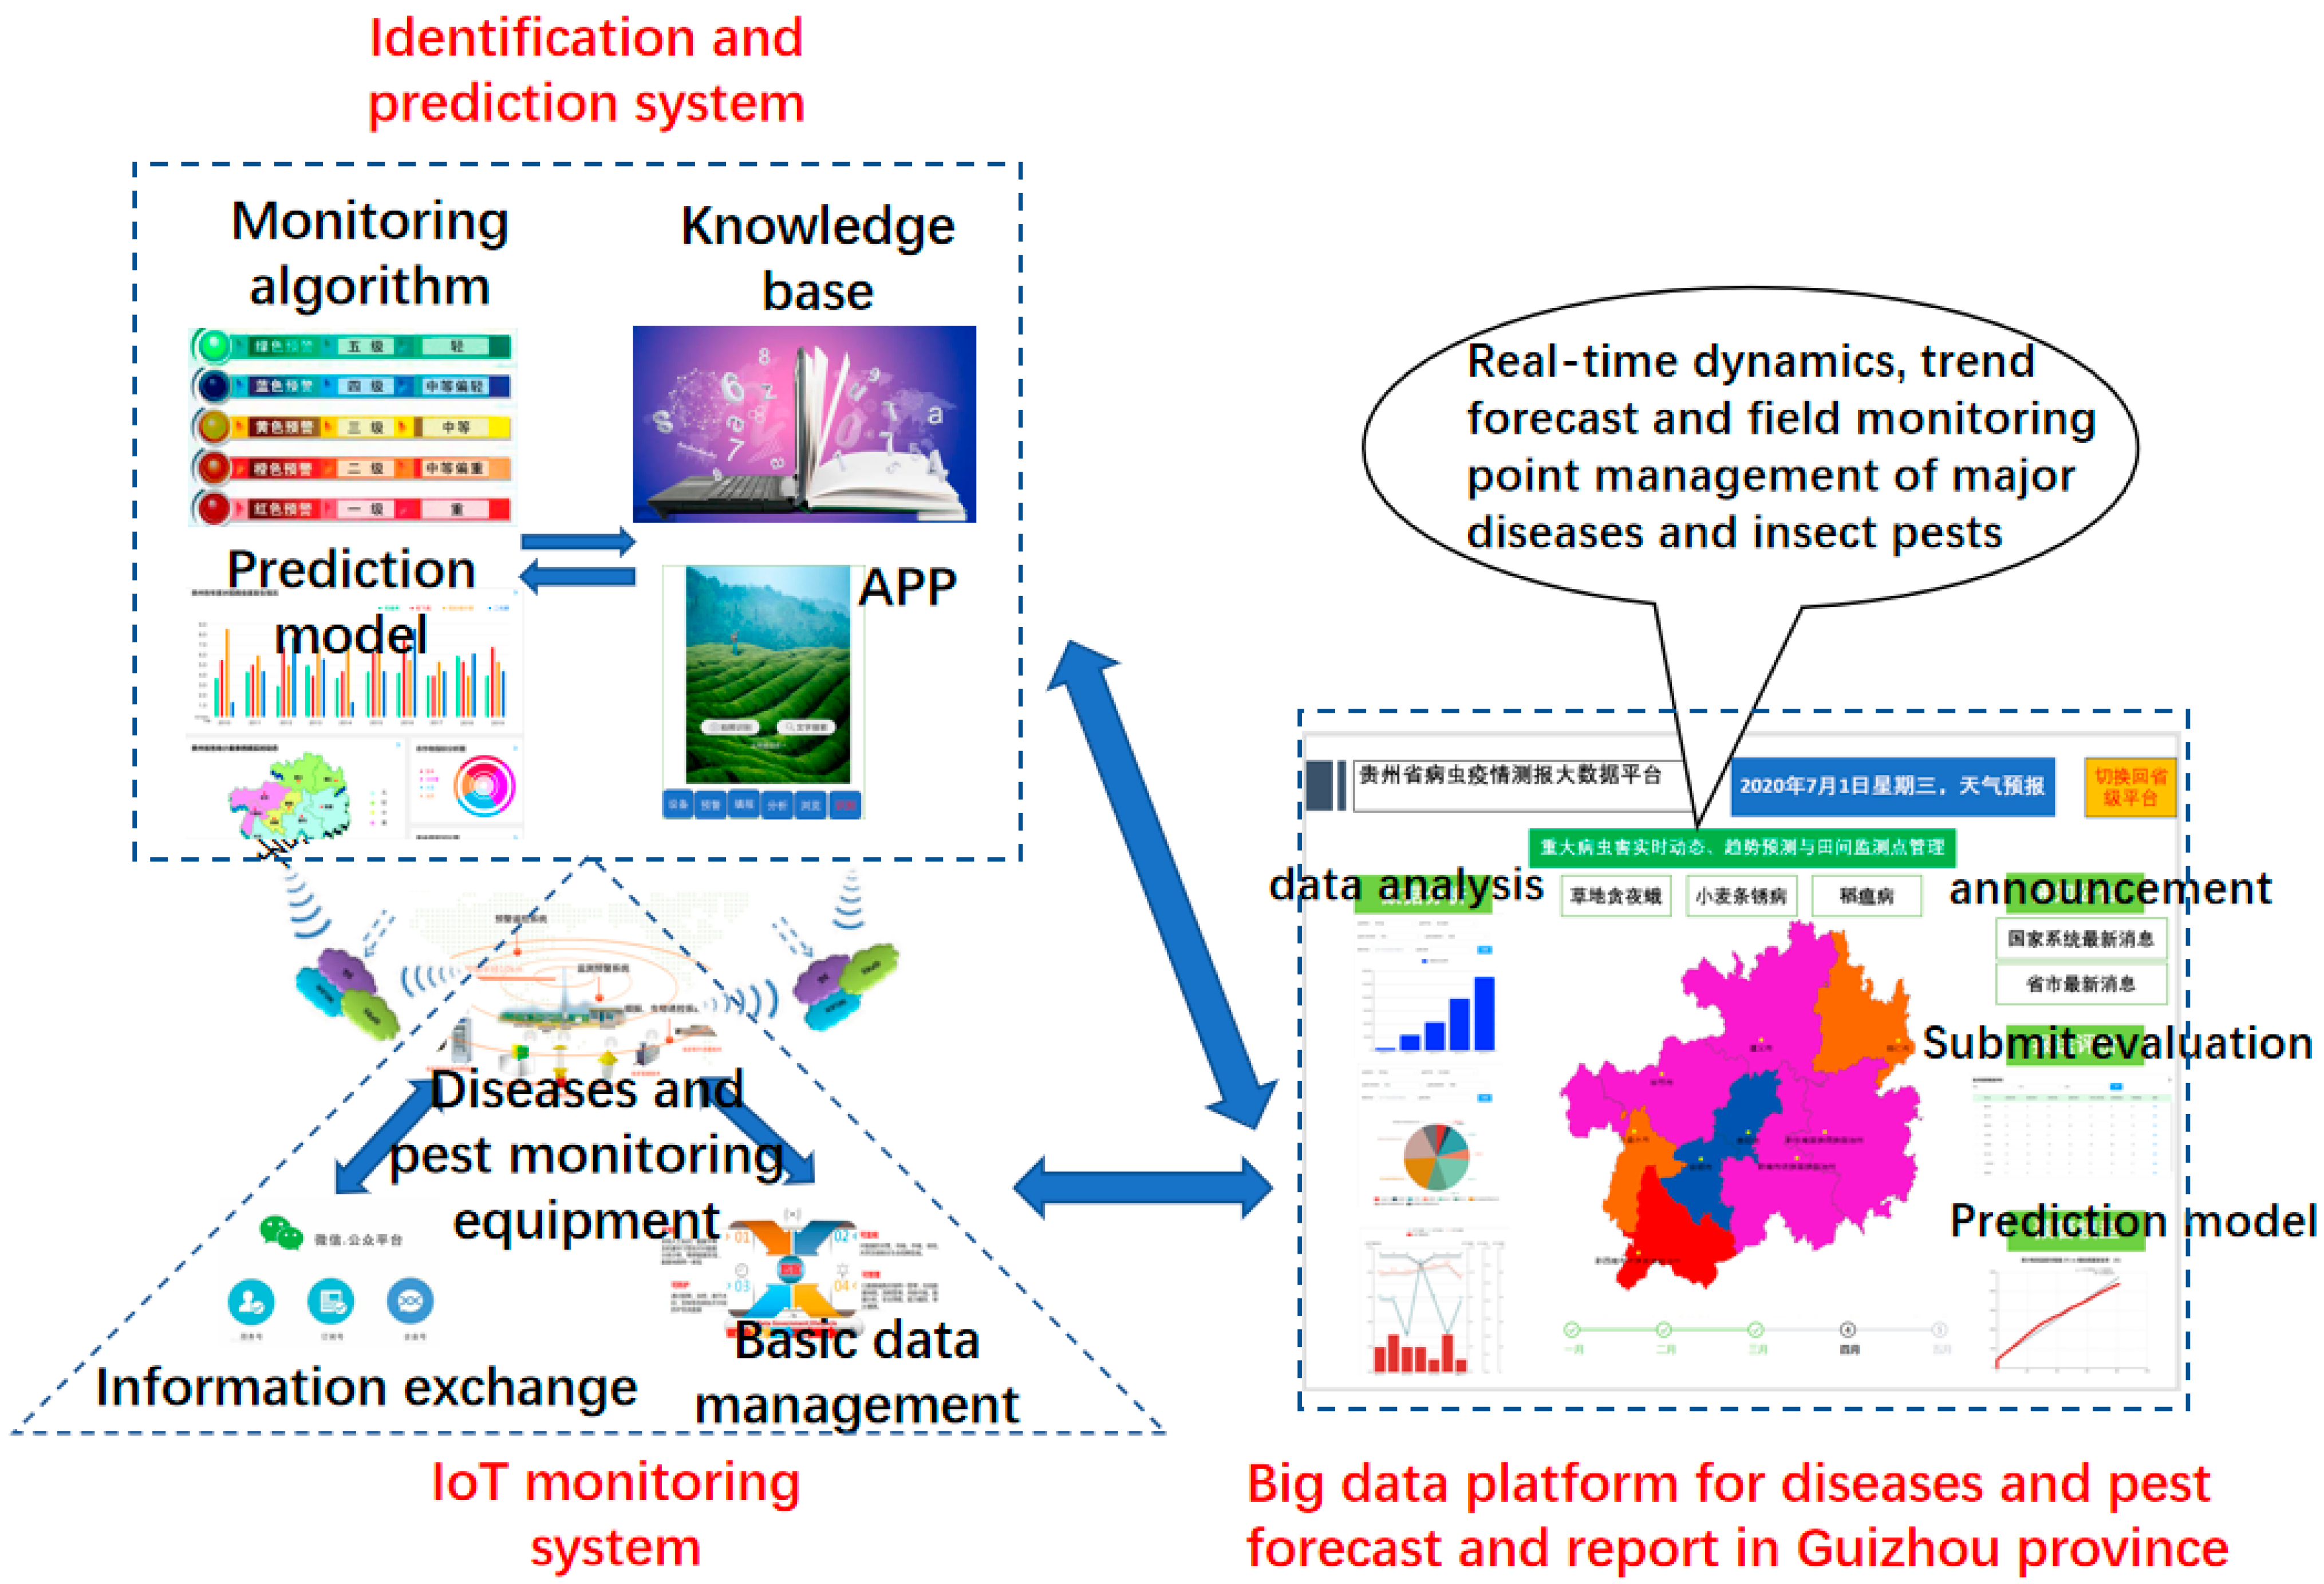
The model consisted of two LSTM layers: a dropout layer and a dense layer [27]. The LSTM defined a three-dimensional shape (none, 1, 5) of the input dataset, and conducted preliminary learning on many input data by increasing the number of neuron nodes (none, 1, 256). None (none, 1, 5) represents the number of each time input datum, 1 represents a label category (disease occurrence or absence) and 5 represents the number of five features (five independent variables we selected). Additionally, 256 represents the number of defined network units. The dropout layer is a regularization operation on the network, which contains useless information network units that are randomly hidden or discarded during the training process to prevent the model from overfitting. The LSTM_1 had the same scale as the LSTM layer after regularization; it stored, memorized and classified information related to the features and labels of the training dataset, and saved the remaining network units for data dimensionality reduction (none, 48). The dense layer is a fully connected layer, which allowed for the mapping of the feature classification results (none, 1) of the upper network through non-linear changes to the output space to improve the classification accuracy of the model. Figure 2 shows the structure of the hot pepper disease occurrence prediction model.
If a method correctly predicted presence within an interval of time, it was placed in the true positive (TP) box. If a method predicted a presence when it did not occur, it was placed in the false positive (FP) box. If a method failed to predict presence when it did occur, it was placed in the false negative (FN) box. Finally, if a method correctly predicted absence, it was placed in the true negative (TN) box. The model predictions were also analyzed, considering each sample using a contingency table (Table 1).
The disease occurrence prediction model was evaluated using Accuracy, the receiver operating characteristic (ROC) curve, the area under curve (AUC value) and a confusion matrix. An ROC curve is a graph obtained using the false positive rate (FPR) as the abscissa and true positive rate (TPR) as the ordinate to show the classification ability of the model. The AUC value is the area under the ROC curve; the closer its value is to 1, the higher the model’s classification performance. The confusion matrix is a visual evaluation indicator that displays the model predictions through a matrix of n rows × n columns. The equation is as follows:
A c c u r a c y = T P + T N T P + F N + F P + T N
F P R = F P T N + F P
T P R = T P T P + F N

2.4. System Design

According to the theory of “gathering points into the net” and “internet plus”, improving the monitoring and early warning, prevention and control of crop disease and pests, as well as public service capacity and serving modern agricultural development, is necessary. Using big data analysis and an app for pest epidemics as the front desks, we developed an epidemic monitoring and warning system for hot peppers in Guizhou. Data was acquired by automated intelligent field monitoring stations to support the development of pest identification algorithms [28] and prediction models. This is a modern pest epidemic monitoring and early warning system connected vertically and horizontally, which is suitable for the development of modern agriculture (Figure 3).
The system consisted of three subsystems: the IoT monitoring system, the identification and prediction system and the big data system (big data platform for disease and pests forecast and reporting in Guizhou province). In the IoT monitoring system, we designed three modules: (1) disease and pest monitoring equipment, which included data collection from automatic equipment for disease and pests through mobile communication networks (4G/5G); (2) basic data management, which meant information management of the field monitoring station name, contact person, equipment type and amount, etc.; and (3) information exchange, which was able to store, retrieve, review, release and browse pest information. For the identification and prediction system, we combined the pest monitoring algorithm developed by National Engineering Research Center for Information Technology in Agriculture (NERCITA, Beijing, China) [28], the disease prediction model, the integrated pest management (IPM) knowledge base and the app. The big data system integrated all the above data.

3. Results

3.1. Disease and Pest Scouting Analysis

3.1.1. Hot Pepper Diseases and Pests in Guizhou Province in 2021

A total of 11 hot pepper diseases and ten pests were collected. There are seven main diseases in the Xinpu’s new district of Zunyi City, including viral disease, anthracnose, powdery mildew, southern blight, root rot disease, leaf spot disease and bacterial wilt. There are three primary pests: aphids; the common cutworm; and the oriental tobacco budworm.

3.1.2. Common Diseases

(1)
Powdery Mildew
The disease field rate, disease plant rate and disease index were 100%, 100% and 96.48, respectively. The first case occurred on 15 August, and the rate of diseased plants reached 100% on 2 September during the late harvest, when fertilizer and water levels were insufficient, resistance was low and the disease was severe.
(2)
Anthracnose
The disease occurred in all survey areas, and the disease incidence was particularly severe. The disease field rate, disease plant rate and disease index were 100%, 94.51% and 58.61, respectively. The disease incidence in subplot no. 3 was particularly severe, at a disease plant rate of 100% and a disease index of 73.33. The first diseased fruit appeared on 8 August during the peak fruiting period. The investigation shows that anthracnose is the primary disease affecting the hot pepper industry in Guizhou, which means that it demands attention from workers involved in plant breeding and protection.

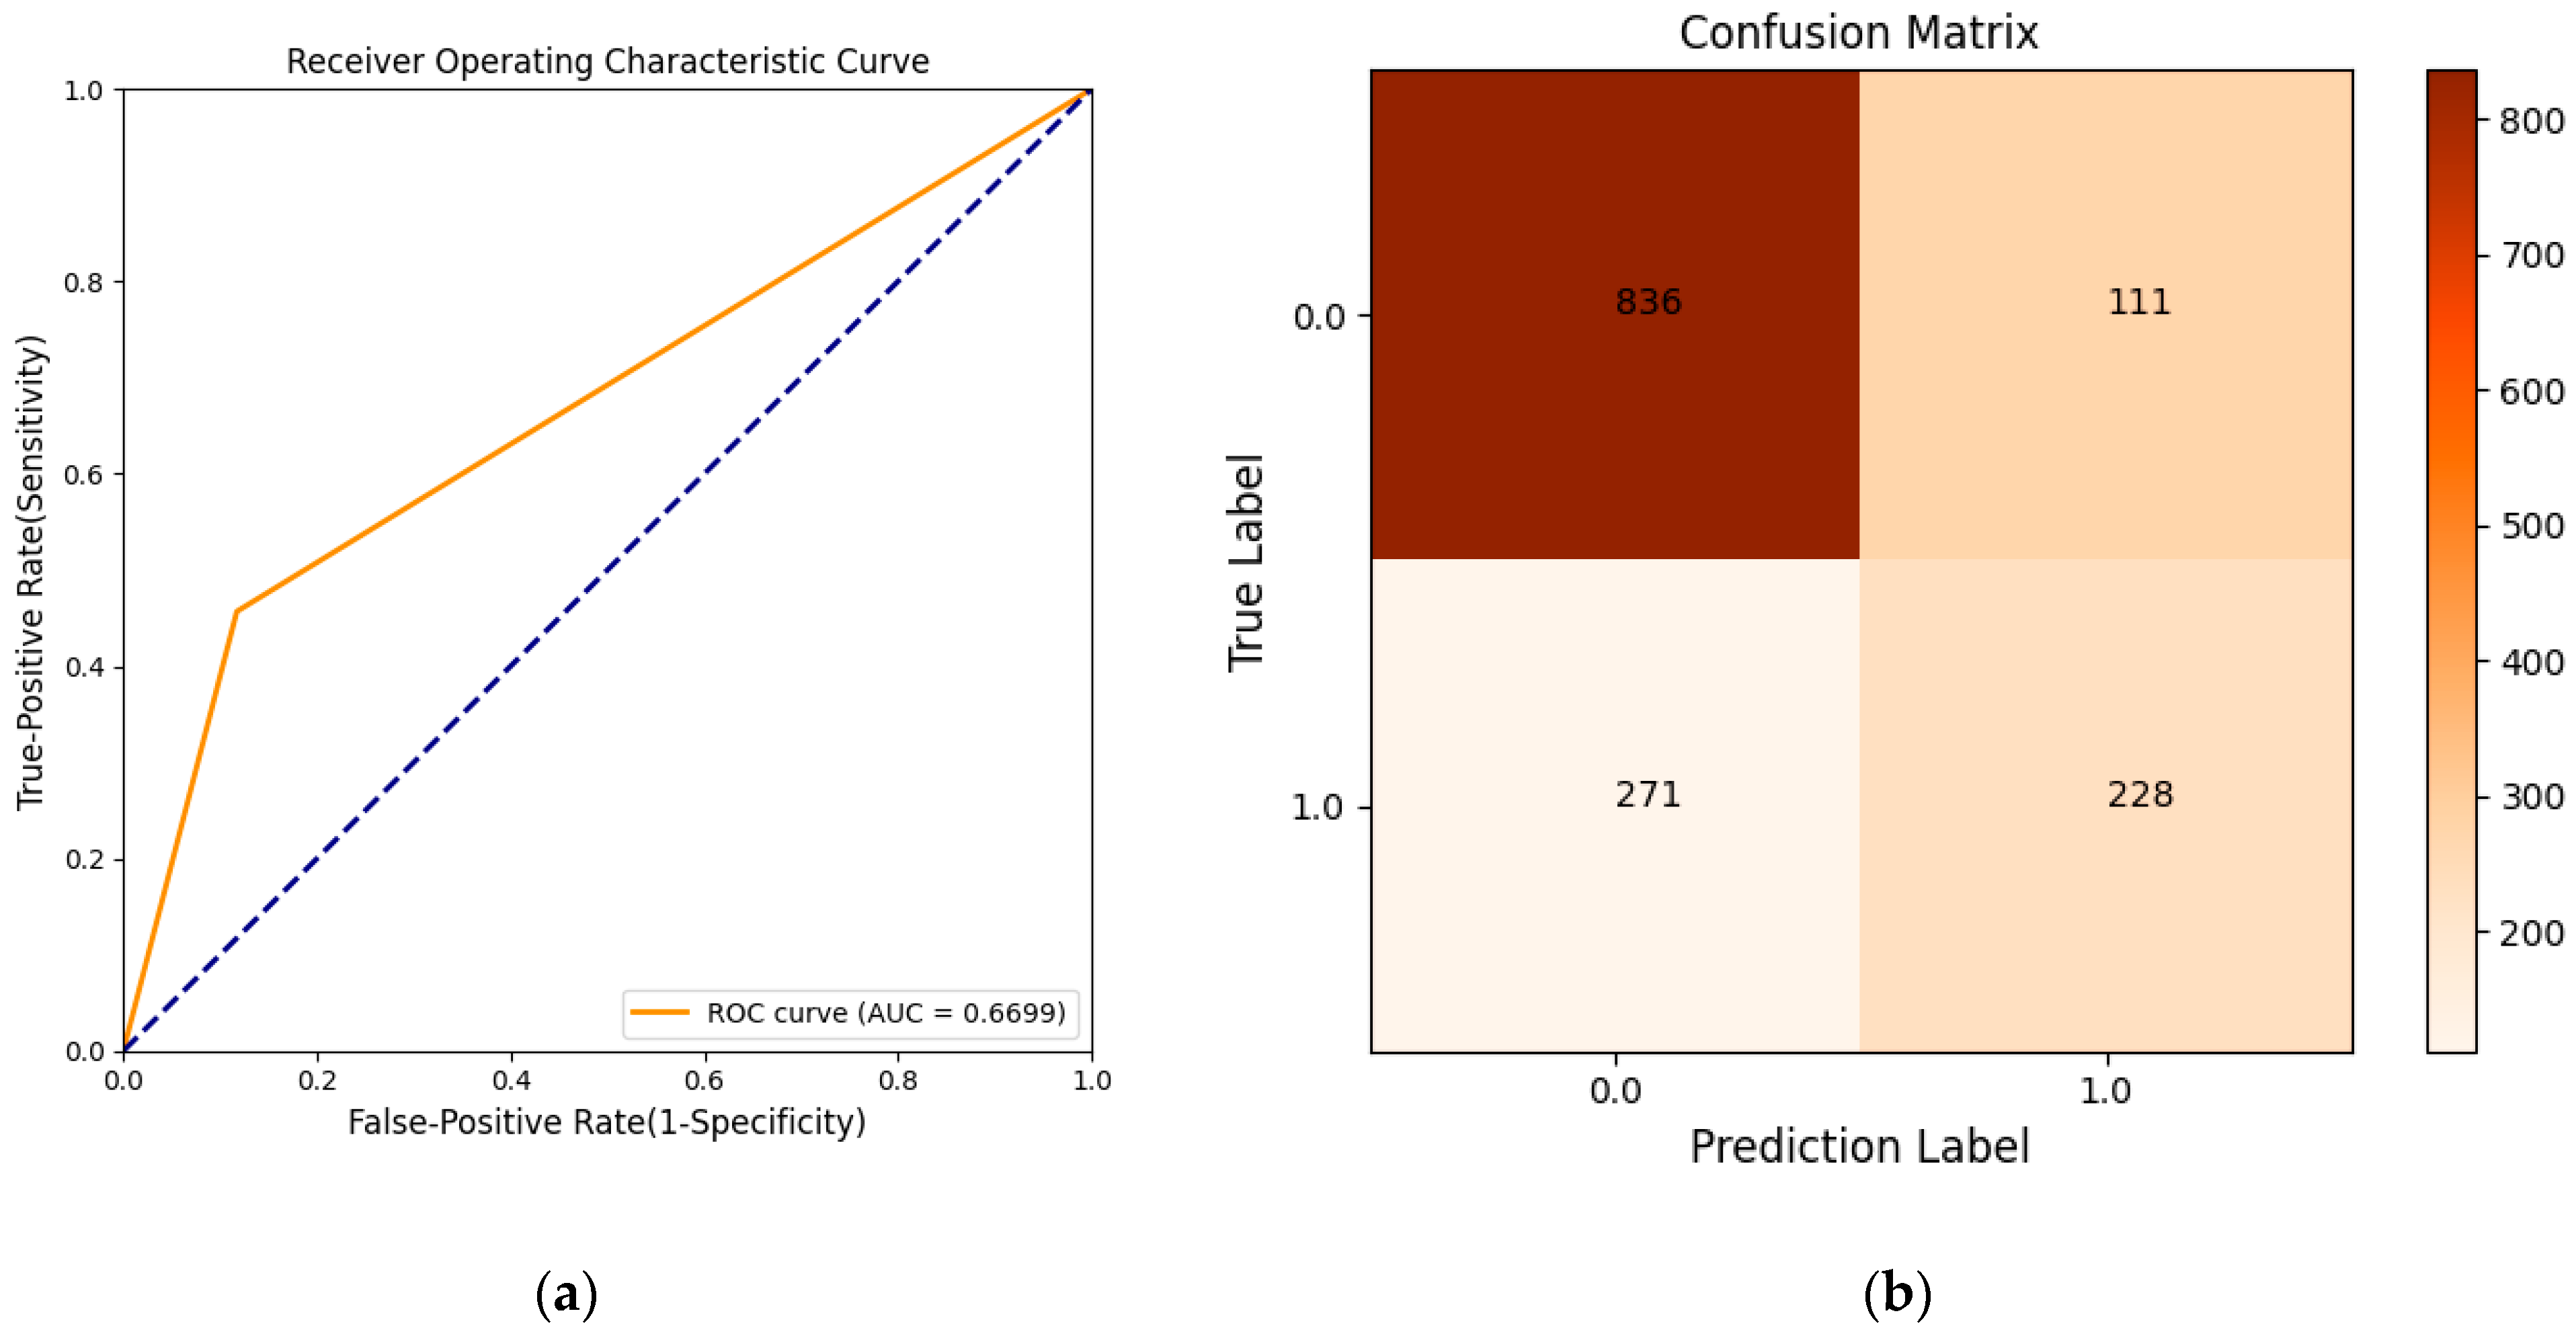
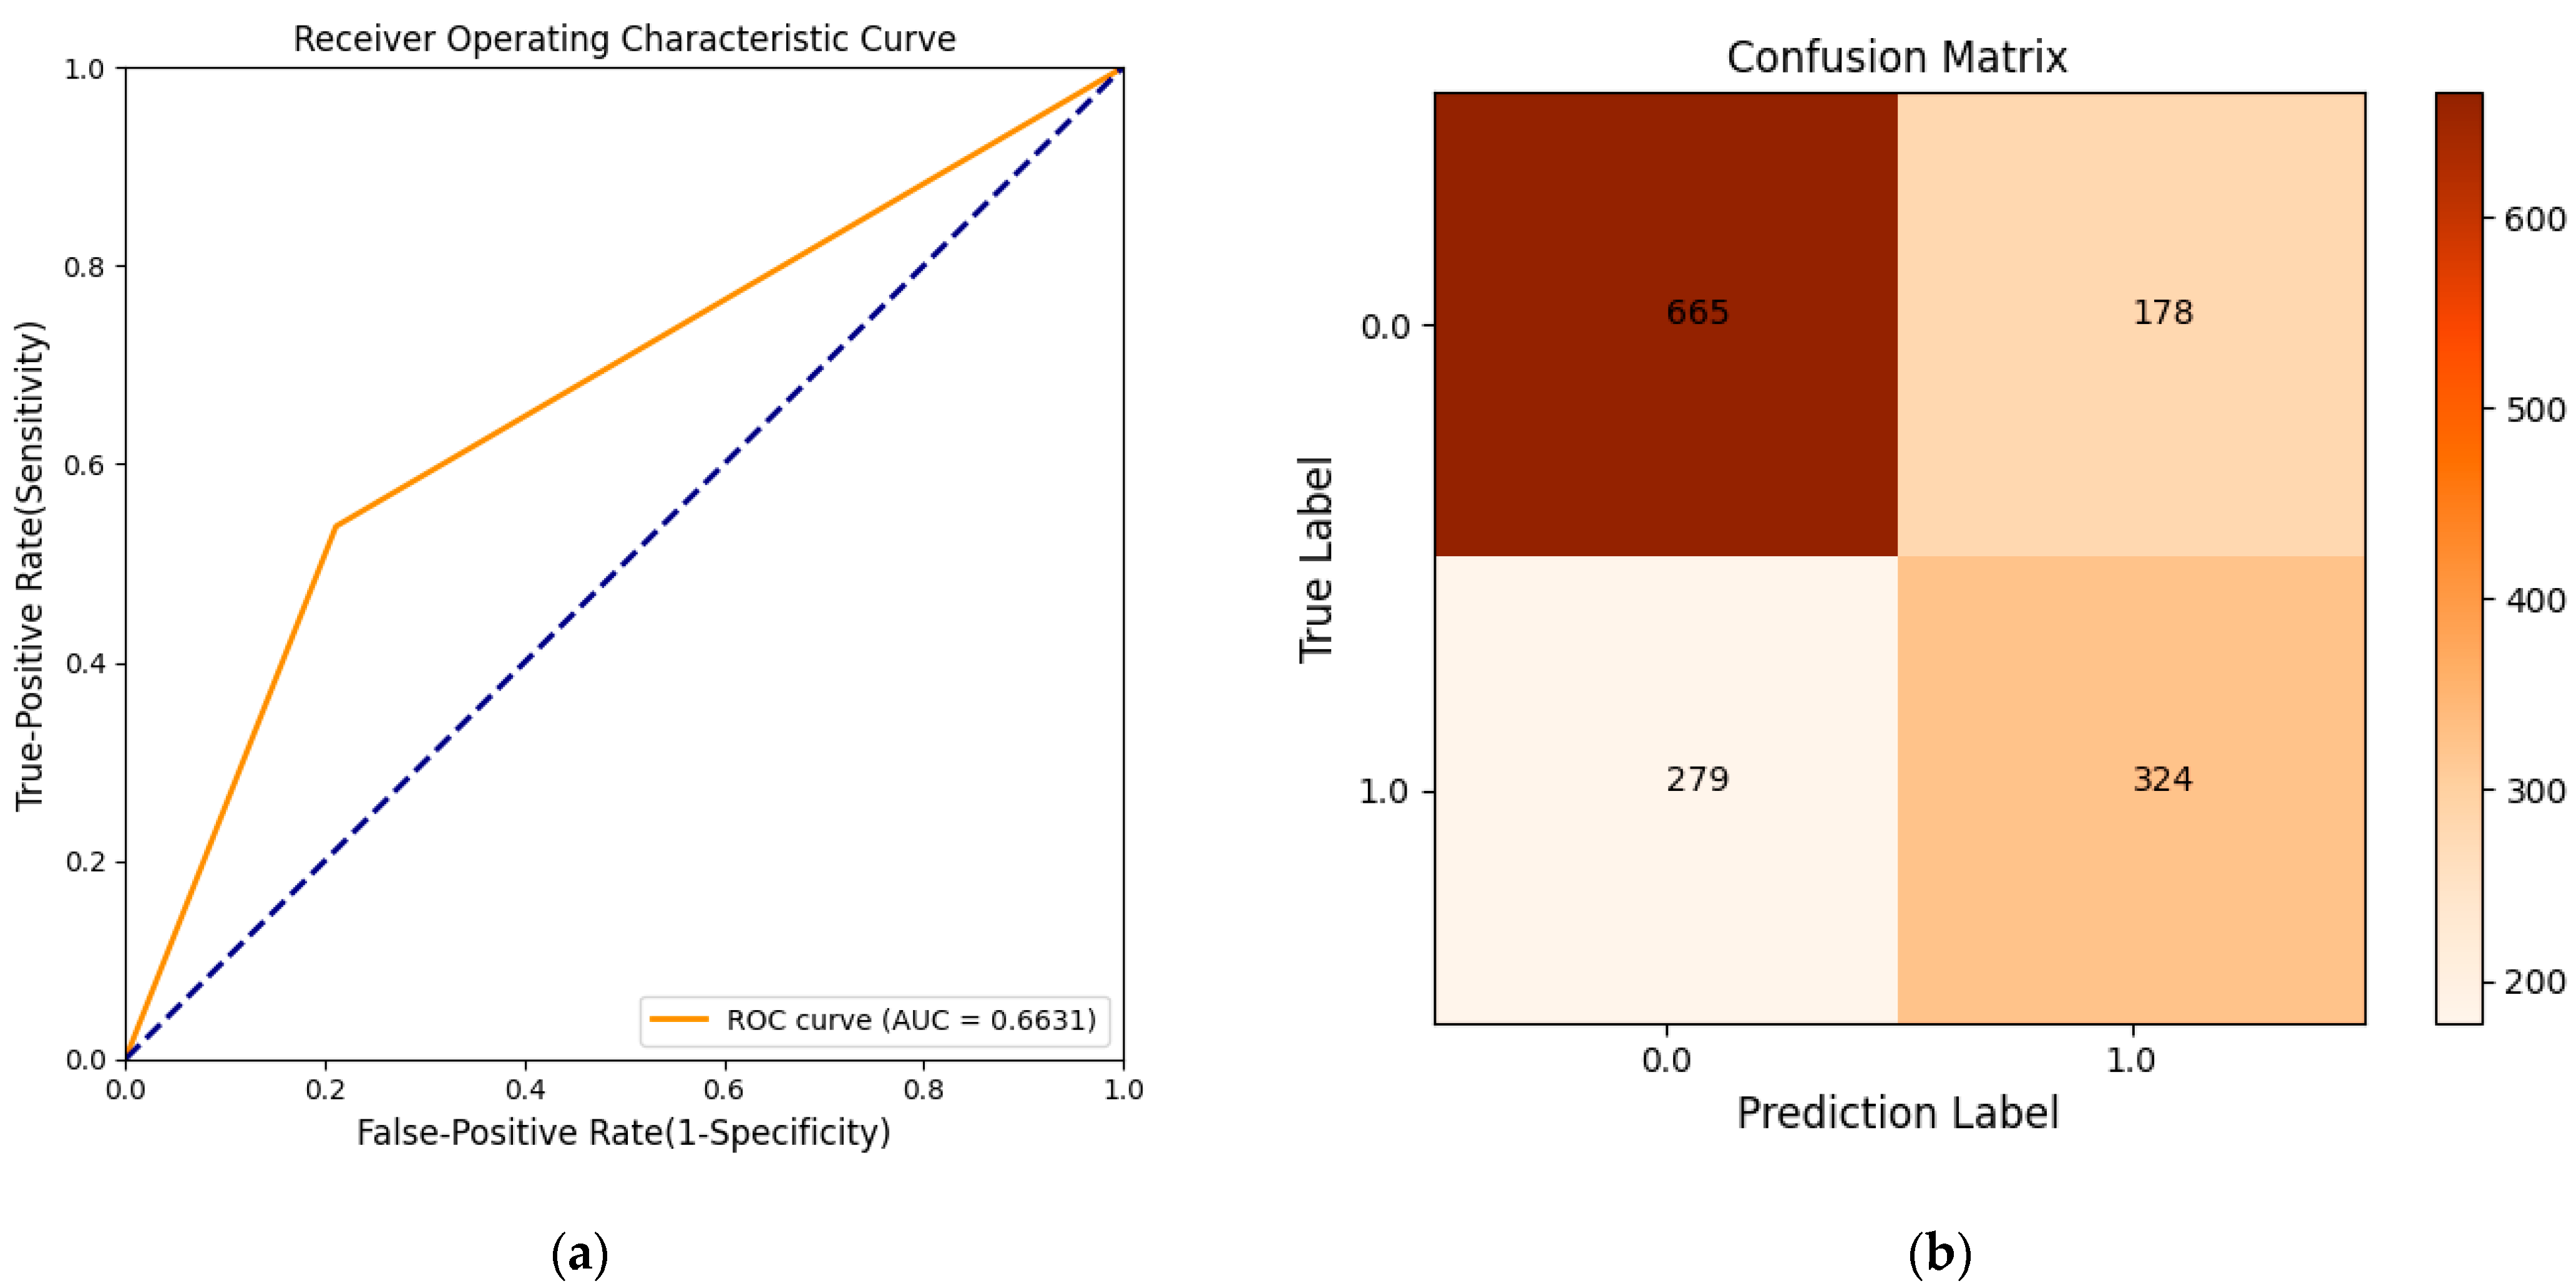
3.2. Model Evaluation

3.2.1. Powdery Mildew Prediction

The classification situation and prediction results were evaluated by drawing the ROC curve and confusion matrix and calculating the AUC value, as shown in Figure 4.
As shown in Figure 4, AUC = 0.6699 indicates that the model classification effect was effective; according to the confusion matrix, the ordinate and abscissa were actual disease absence (0) and disease occurrence (1), and predicted disease absence (0) and disease occurrence (1), respectively. The total number of datasets was 4819 points. The total number in the four matrices was the number of test dataset 1446 points (where TN = 836, TP = 228, FN = 271 and FP = 111). As shown in Table 1, Equation (3) and Figure 4b, the model prediction accuracy was 0.74.

3.2.2. Anthracnose Prediction

As shown in Figure 5, the AUC = 0.6631. As shown in Table 1, Equation (3) and Figure 5b, the model prediction accuracy was 0.68.

3.3. System Deployment

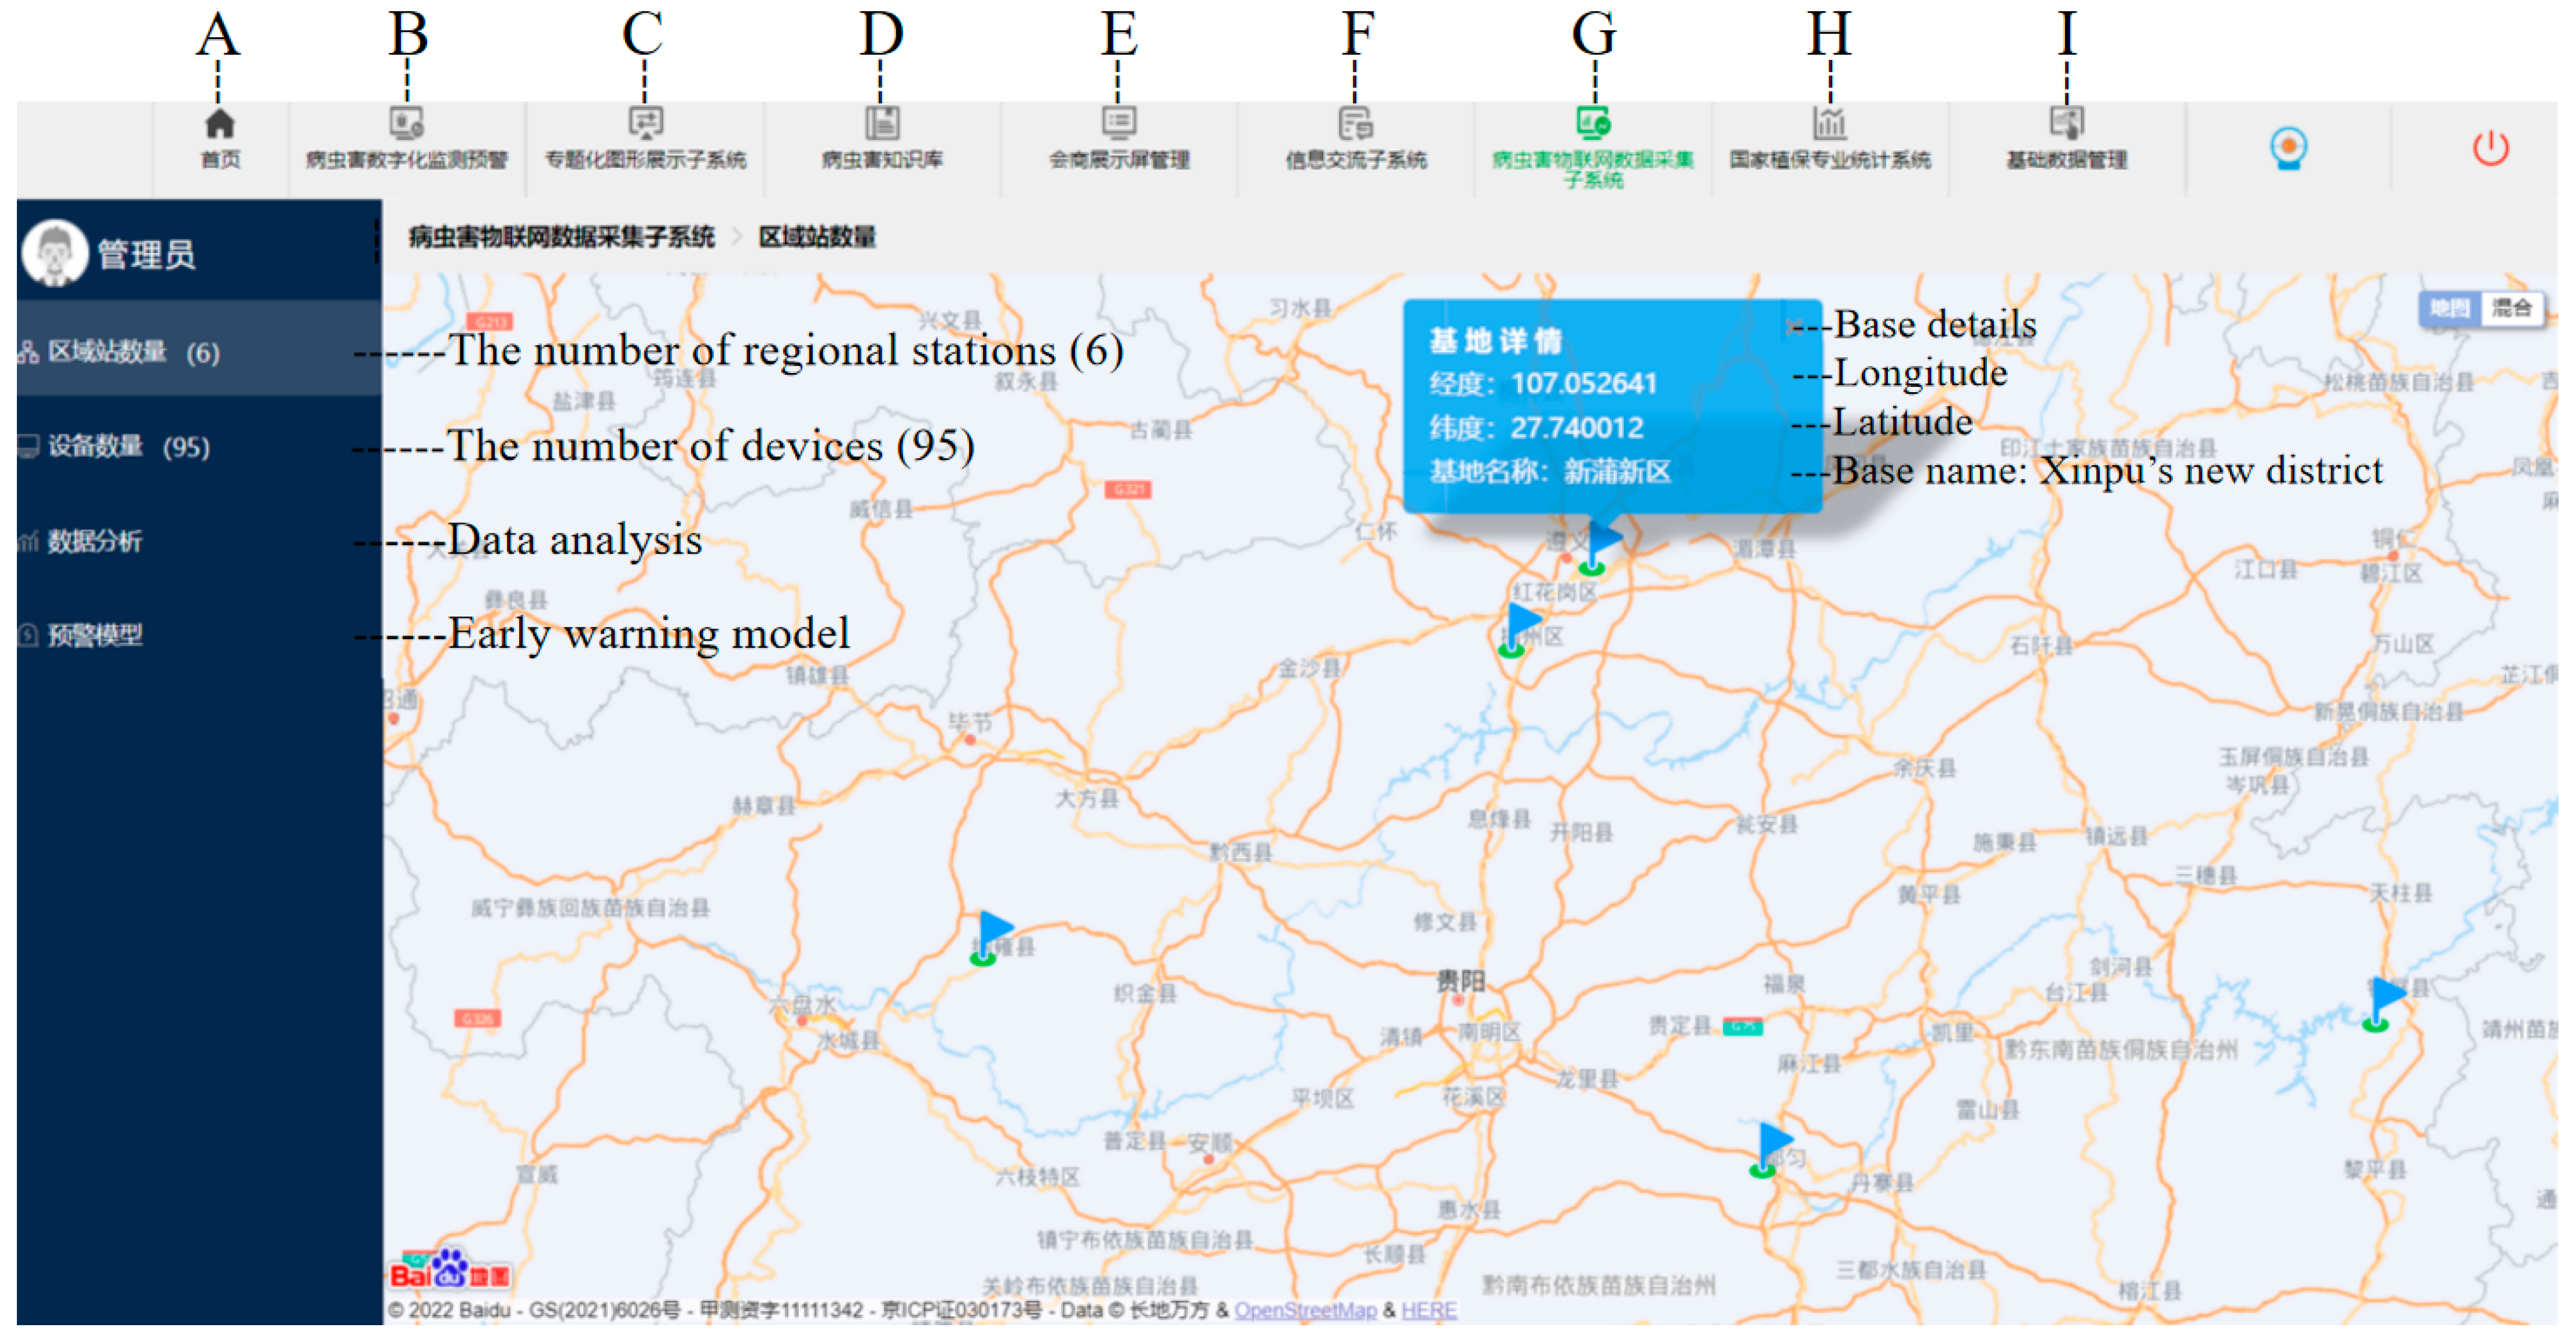
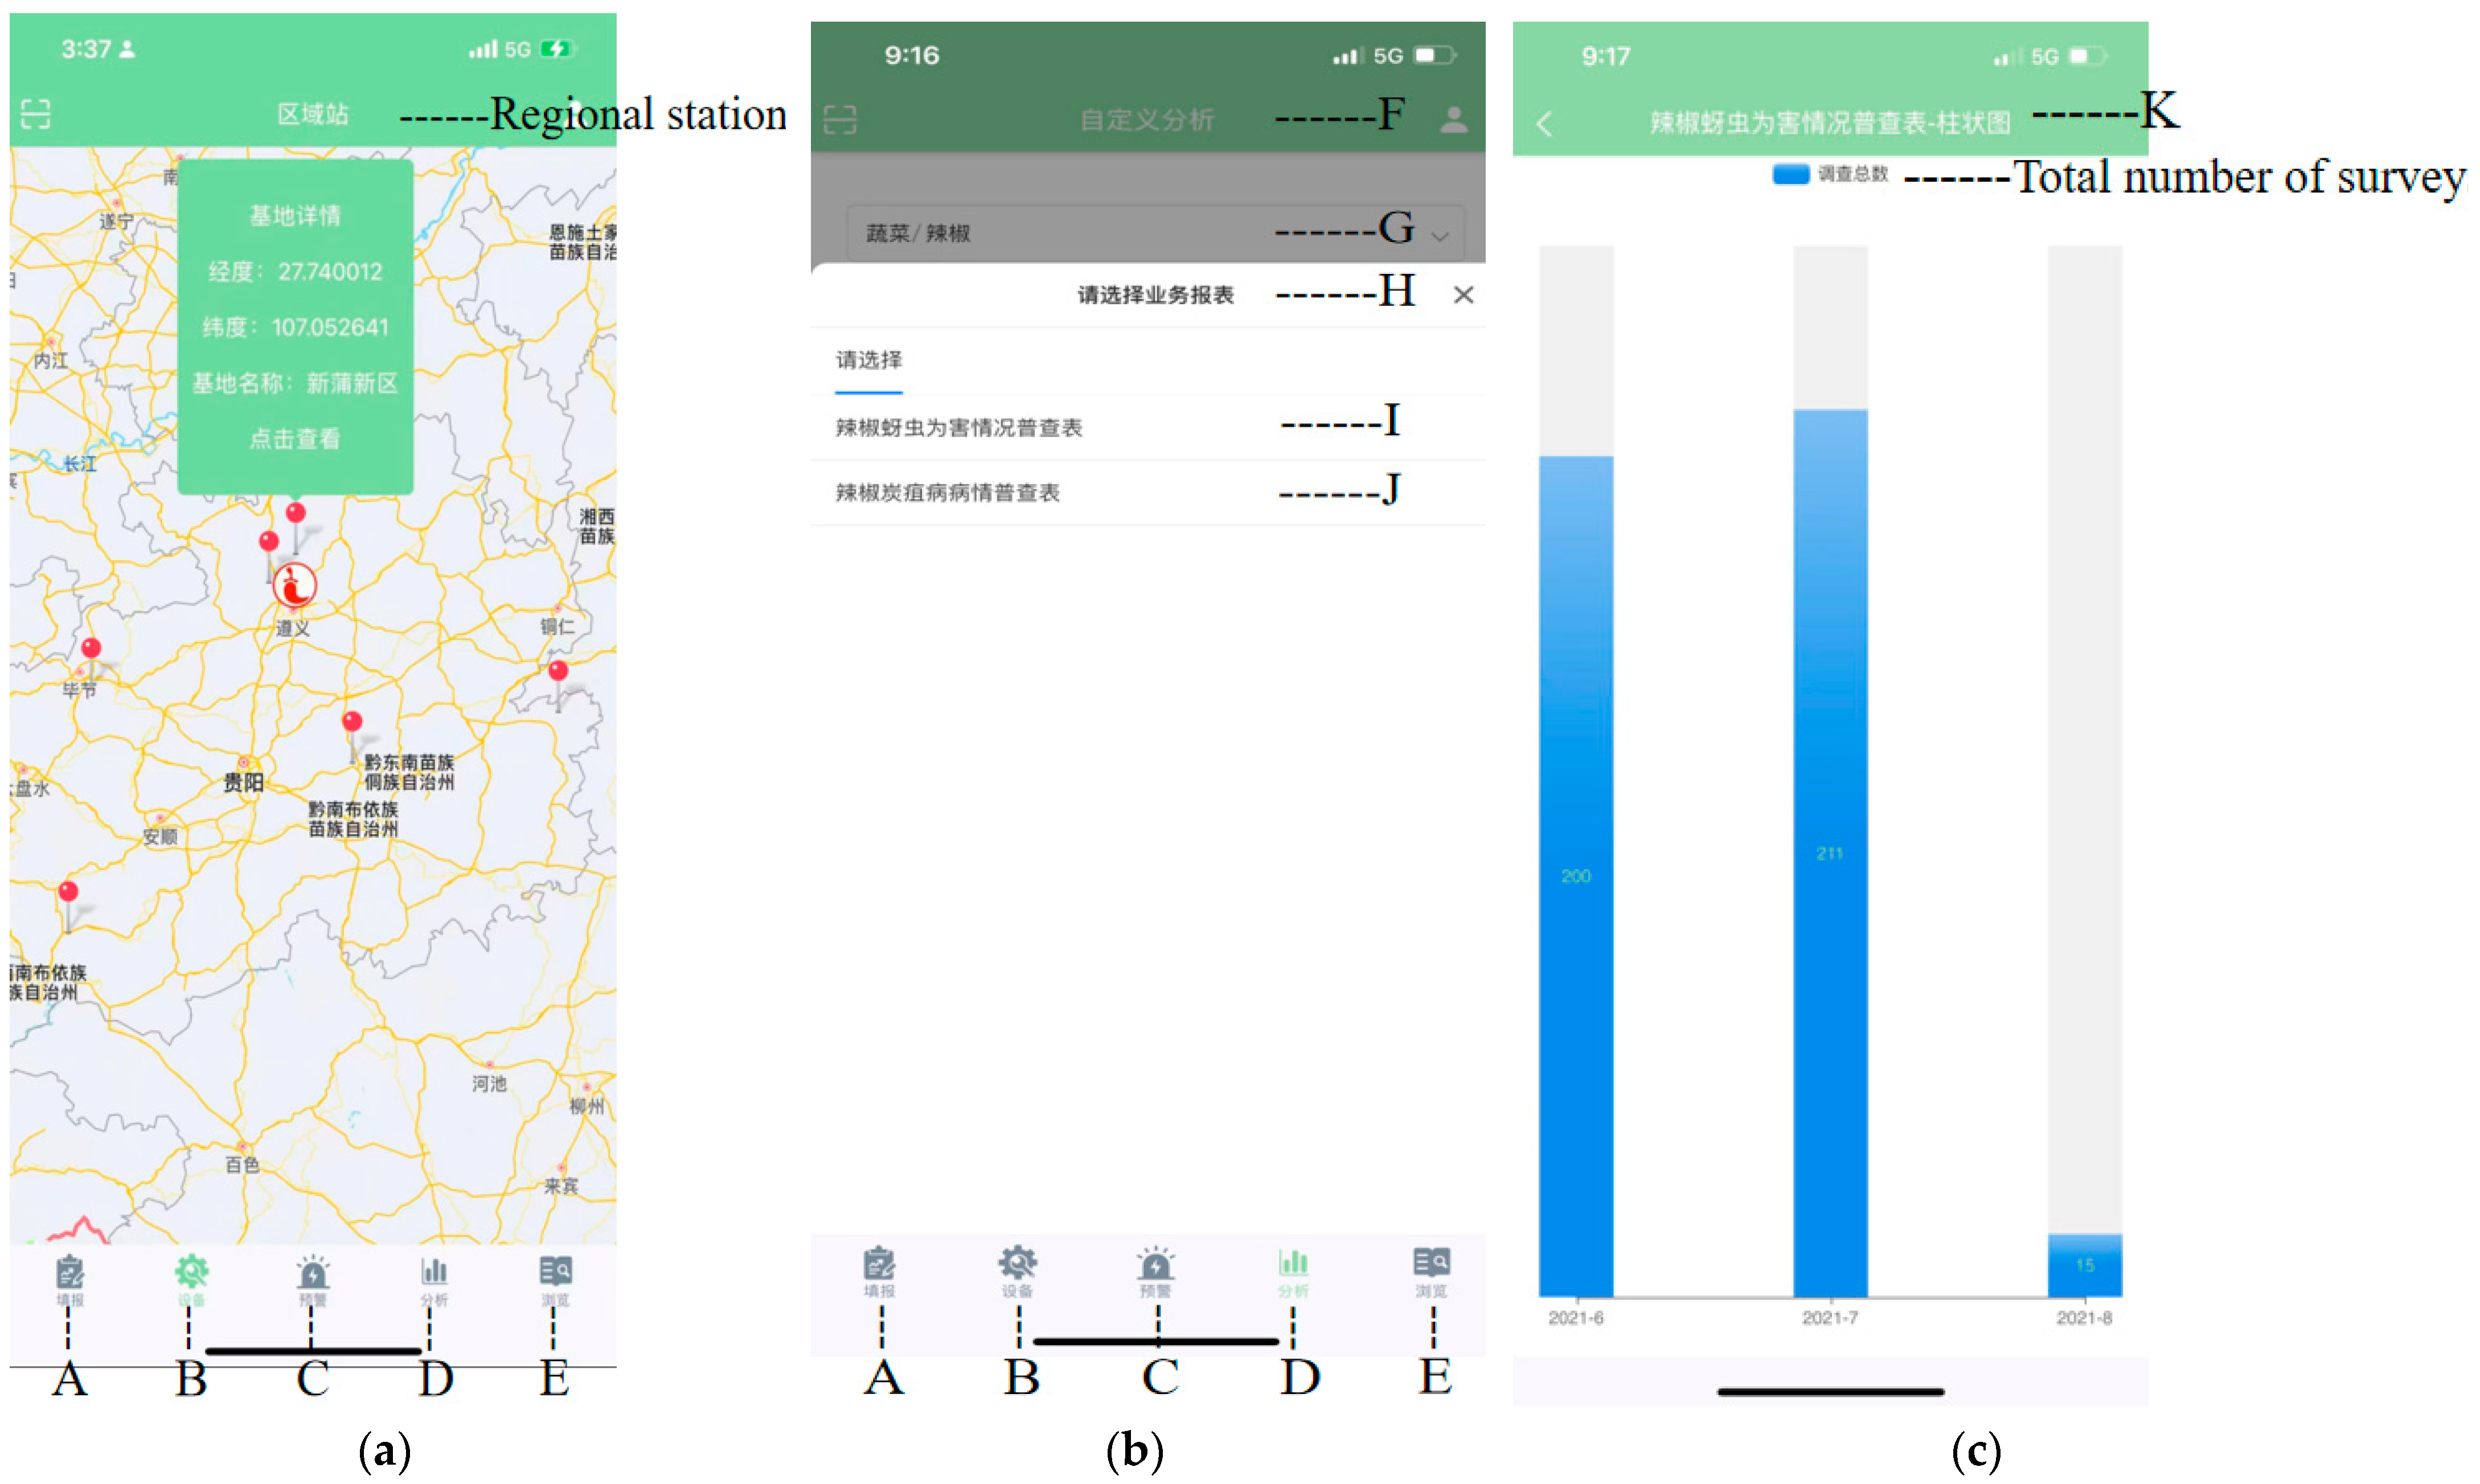
3.3.1. Internet of Things Monitoring System for Hot Pepper Disease and Pests

We deployed an automatic monitoring device for hot pepper diseases and pests, a remote real-time pest monitoring system and an app (Figure 6 and Figure 7), including one sexual color inducer, one set of pathogen monitoring equipment and several environmental monitoring sensors. After planting, long-term images of disease and pests were collected over the whole growth cycle, and uploaded through wireless data communication technology.

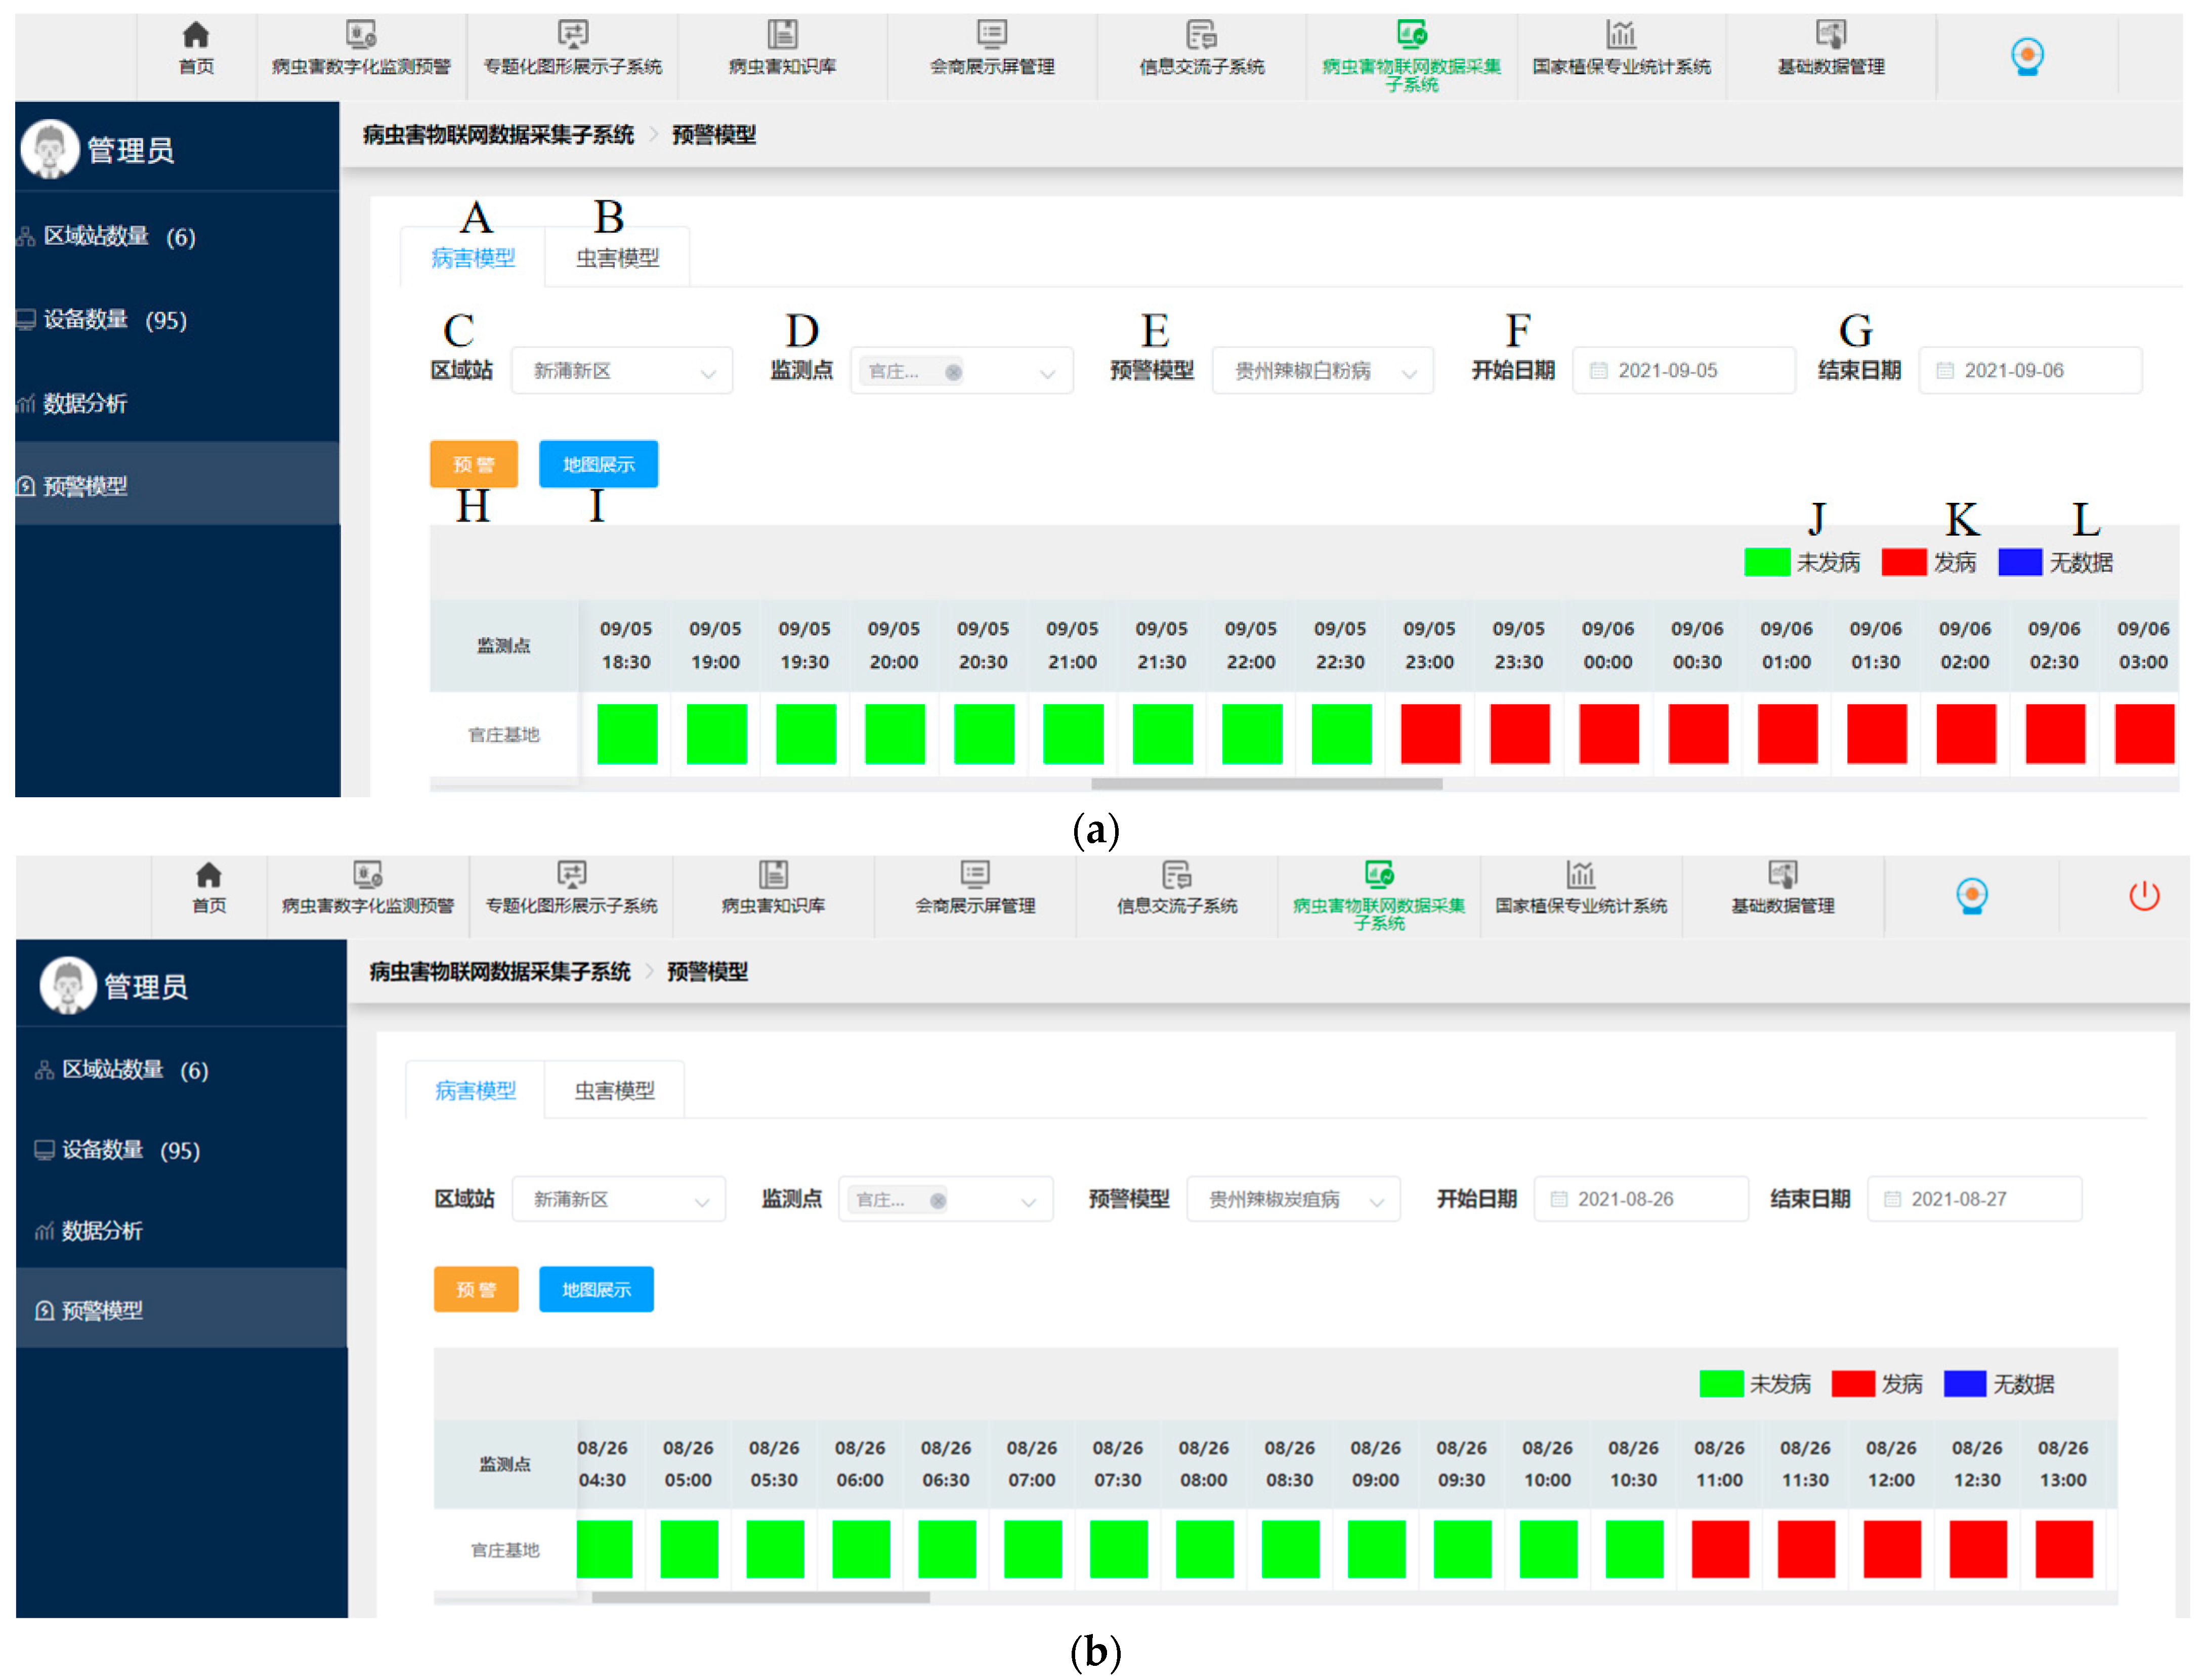
3.3.2. Intelligent Decision-Making Platform for Disease and Pests

Intelligent identification and the accurate counting of disease and pest incidents were realized using artificial intelligence technologies, such as machine vision, artificial neural networks and deep learning. The disaster early warning model was developed through machine learning to evaluate the risk of disease and pest. Big data, cloud computing and other technologies were used to build a “decision knowledge base” to manage different degrees of risk and provide decision support for green prevention and control of hot pepper disease and pests. Figure 8 shows the system display interface for forecasting two diseases.

4. Discussion

This paper proposes a complete solution for a Guizhou hot pepper disease and pest monitoring and early warning decision-making system, combined with the data acquired with automatic monitoring equipment and a prediction model for hot pepper powdery mildew and anthracnose based on deep learning technology. This will help to inform IPM within the Guizhou hot pepper monitoring and warning system. In addition, this paper is the first time LSTM has been applied to Daejeon hot pepper disease prediction, and it is the first time that these models have been combined with a monitoring and warning system. We integrated models into the system so that users can provide farmers with better control decisions to minimize losses caused by disease and pests. However, as this is novel and subject to the evaluation process, there are still improvements to be made. Since the experimental data was acquired by sensors every 30 min, prediction errors may occur because the 30 min interval was too short, meaning the model was not easy to learn or distinguish, resulting in classification errors (Figure 4 and Figure 5). In addition, rapid changes in the environment can cause problems with the data acquired by monitoring equipment, thus decreasing the accuracy.
In future, we will begin experiments in different locations and on different varieties to obtain more data, develop and verify the accuracy of the model and study the fixed mechanism of disease and pest occurrence to adapt to their long-term prevalence. By strengthening system integration at the technical level as well, we can truly realize an unsupervised learning system for farms and provide support for reducing the use of chemical agents and improving crop yield and quality. We will also develop an app to help users manage disease and pests in hot pepper production more safely, scientifically and efficiently. We hope that the concept can be extended to other crops, thereby accelerating the modernization of China’s agriculture.

5. Conclusions

This paper proposes a complete solution for Guizhou hot pepper disease and pest monitoring, and an early warning decision-making system. The following conclusions can be drawn:
(1)
Combined with the data collected via automatic monitoring equipment, prediction models were developed to forecast powdery mildew and anthracnose based on LSTM, with accuracy of 0.74 and 0.68, respectively.
(2)
The development of the monitoring and early warning system and its combination with prediction models can better provide farmers with information on the occurrence of disease and pests, and help farmers make disease control decisions.
(3)
The development of the system, as well as the maintenance and integration of functions, are long-term processes that need to be continually supported by relevant data. Only in this way can production problems truly be solved.

Author Contributions

Conceptualization, M.L.; methodology, M.L., Y.M. and K.L.; software, X.C., Z.D. and K.L.; validation, Y.M., D.X. and M.S.; formal analysis, M.L.; investigation, Y.M., D.X. and M.S.; resources, Y.M., D.X. and M.S.; data curation, Y.M. and K.L.; writing—original draft preparation, M.L.; writing—review and editing, M.L. and K.L.; visualization, K.L.; manuscript revising, Y.M. and D.X.; study design, Y.M. and M.L.; supervision, D.X. and M.S.; project administration, D.X. and M.S.; and funding acquisition, D.X. and M.S. All authors have read and agreed to the published version of the manuscript.

Funding

This work was funded by the National Key R&D Program of China (SQ2020YFF0418305), the Guizhou Provincial Science and Technology Project (2021-264) and the Youth Program of National Natural Science Foundation of China (31401683).

Institutional Review Board Statement

Not applicable.

Informed Consent Statement

Not applicable.

Data Availability Statement

Not applicable.

Conflicts of Interest

The authors declare no conflict of interest.

References

  1. The Planting Area of Rosa Roxburghii and Pepper Ranks first in China! Guizhou’s Characteristic and Advantageous Industries Have Continued to Grow. 2021. Available online: http://nynct.guzhou.gov.cn/ztzl/nccygm/cykx/202111/t20211102_71508406.html (accessed on 1 March 2022).
  2. Liakos, K.G.; Busato, P.; Moshou, D.; Pearson, S.; Bochtis, D. Machine learning in agriculture: A review. Sensors 2018, 18, 2674. [Google Scholar] [CrossRef] [PubMed] [Green Version]
  3. Lee, H.; Moon, A.; Moon, K.; Lee, Y. Disease and pest prediction IoT system in orchard: A preliminary study. In Proceedings of the 2017 Ninth International Conference on Ubiquitous and Future Networks (ICUFN), Milan, Italy, 4–7 July 2017; pp. 525–527. [Google Scholar]
  4. Tripathy, A.K.; Adinarayana, J.; Sudharsan, D.; Merchant, S.N.; Desai, U.B.; Vijayalakshmi, K.; Reddy, D.R.; Sreenivas, G.; Ninomiya, S.; Hirafuji, M.; et al. Data mining and wireless sensor network for agriculture pest/disease predictions. In Proceedings of the 2011 World Congress on Information and Communication Technologies, Mumbai, India, 11–14 December 2011; pp. 1229–1234. [Google Scholar]
  5. Hill, G.N.; Beresford, R.M.; Evans, K.J. Automated analysis of aggregated datasets to identify climatic predictors of botrytis bunch rot in wine grapes. Phytopathology 2019, 109, 84–95. [Google Scholar] [CrossRef] [PubMed] [Green Version]
  6. Hochreiter, S.; Schmidhuber, J. Long short-term memory. Neural. Comput. 1997, 9, 1735–1780. [Google Scholar] [CrossRef]
  7. Xu, L.; Diao, Z.; Wei, Y. Nonlinear target trajectory prediction for robust visual tracking. Appl. Intel. 2021, 1–15. [Google Scholar]
  8. Muthukumar, P.; Cocom, E.; Holm, J.; Comer, D.; Lyons, A.; Burga, I.; Hasenkopf, C.; Pourhomayoun, M. Real-Time Spatiotemporal Air Pollution Prediction with Deep Convolutional LSTM Through Satellite Image Analysis. In Advances in Data Science and Information Engineering; Stahlbock, R., Weiss, G.M., Abou-Nasr, M., Yang, C.Y., Arabnia, H.R., Deligiannidis, L., Eds.; Springer: Cham, Switzerland, 2021; pp. 315–326. [Google Scholar]
  9. Memarzadeh, G.; Keynia, F. Short-term electricity load and price forecasting by a new optimal LSTM-NN based prediction algorithm. Electr. Pow. Syst. Res. 2021, 192, 106995. [Google Scholar] [CrossRef]
  10. Xia, D.; Zhang, M.; Yan, X.; Bai, Y.; Zheng, Y.; Li, Y.; Li, H. A distributed WND-LSTM model on MapReduce for short-term traffic flow prediction. Neural Comput. Appl. 2021, 33, 2393–2410. [Google Scholar] [CrossRef]
  11. Moghar, A.; Hamiche, M. Stock market prediction using LSTM recurrent neural network. Procedia Comput. Sci. 2020, 170, 1168–1173. [Google Scholar] [CrossRef]
  12. Shtienberg, D. Will decision-support systems be widely used for the management of plant diseases? Annu. Rev. Phytopathol. 2013, 51, 1–16. [Google Scholar] [CrossRef]
  13. González-Domínguez, E.; Meriggi, P.; Ruggeri, M.; Rossi, V. Efficacy of fungicides against Fusarium Head Blight depends on the timing relative to infection rather than on wheat growth stage. Agronomy 2021, 11, 1549. [Google Scholar] [CrossRef]
  14. Kim, Y.; Roh, J.H.; Kim, H.Y. Early forecasting of rice blast disease using long short-term memory recurrent neural networks. Sustainability 2018, 10, 34. [Google Scholar] [CrossRef] [Green Version]
  15. Holthusen, H.H.F.; Weber, R.W.S. Infection conditions for Neofabraea perennans and Phacidiopycnis washingtonensis on developing apple fruit in the orchard. Eur. J. Plant Pathol. 2021, 161, 895–906. [Google Scholar] [CrossRef]
  16. Bagheri, N. Application of aerial remote sensing technology for detection of fire blight infected pear trees. Comput. Electron. Agric. 2020, 168, 105147. [Google Scholar] [CrossRef]
  17. Liu, Y.; Langemeier, M.R.; Small, I.M.; Joseph, L.; Fry, W.E.; Ristaino, J.B.; Saville, A.; Gramig, B.M.; Preckel, P.V. A risk analysis of precision agriculture technology to manage tomato late blight. Sustainability 2018, 10, 3108. [Google Scholar] [CrossRef] [Green Version]
  18. Pérez, W.; Arias, R.; Taipe, A.; Ortiz, O.; Forbes, G.A.; Andrade-Piedra, J.; Kromann, P. A simple, hand-held decision support designed tool to help resource-poor farmers improve potato late blight management. Crop Prot. 2020, 134, 105186. [Google Scholar] [CrossRef]
  19. Meno, L.; Escuredo, O.; Rodríguez-Flores, M.S.; Seijo, M.C. Looking for a sustainable potato crop. Field assessment of early blight management. Agric. For. Meteorol. 2021, 308–309, 108617. [Google Scholar] [CrossRef]
  20. Zhao, C.J.; Li, M.; Yang, X.T.; Sun, C.H.; Qian, J.P.; Ji, Z.T. A data-driven model simulating primary infection probabilities of cucumber downy mildew for use in early warning systems in solar greenhouses. Comput. Electron. Agric. 2011, 76, 306–315. [Google Scholar] [CrossRef]
  21. Li, M.; Chen, S.; Liu, F.; Zhao, L.; Xue, Q.; Wang, H.; Chen, M.; Lei, P.; Wen, D.; Sanchez-Molina, J.A.; et al. A risk management system for meteorological disasters of solar greenhouse vegetables. Precis. Agric. 2017, 18, 997–1010. [Google Scholar] [CrossRef]
  22. Ahn, M.I.; Kang, W.S.; Park, E.W.; Yun, S.C. Validation of an anthracnose forecaster to schedule fungicide spraying for pepper. Plant Pathol. J. 2008, 24, 46–51. [Google Scholar] [CrossRef] [Green Version]
  23. Rossi, V.; Salinari, F.; Poni, S.; Caffi, T.; Bettati, T. Addressing the implementation problem in agricultural decision support systems: The example of vite. net®. Comput. Electron. Agric. 2014, 100, 88–99. [Google Scholar] [CrossRef]
  24. Kim, S.; Lee, M.; Shin, C. IoT-based strawberry disease prediction system for smart farming. Sensors 2018, 18, 4051. [Google Scholar] [CrossRef] [Green Version]
  25. Materne, N.; Inoue, M. IoT monitoring system for early detection of agricultural pests and diseases. In Proceedings of the 2018 12th South East Asian Technical University Consortium (SEATUC), Yogyakarta, Indonesia, 12–13 March 2018; Volume 1, pp. 1–5. [Google Scholar]
  26. Cao, W.X. Agricultural Information Science; China Agricultural Press: Beijing, China, 2005; pp. 1–5. [Google Scholar]
  27. Liu, K.; Zhang, C.; Yang, X.; Diao, M.; Liu, H.; Li, M. Development of an Occurrence Prediction Model for Cucumber Downy Mildew in Solar Greenhouses Based on Long Short-Term Memory Neural Network. Agronomy 2022, 12, 442. [Google Scholar] [CrossRef]
  28. Yang, X.; Luo, Y.; Li, M.; Yang, Z.; Sun, C.; Li, W. Recognizing Pests in Field-Based Images by Combining Spatial and Channel Attention Mechanism. IEEE Access 2021, 9, 162448–162458. [Google Scholar] [CrossRef]
Figure 1. Hot pepper disease and pest monitoring equipment in Guizhou. (a) weather station; (b) pathogen monitoring equipment; and (c) pest monitoring equipment.
Agronomy 12 01034 g001
Figure 2. The structure of the hot pepper disease occurrence prediction model.
Agronomy 12 01034 g002
Figure 3. The architecture of the epidemic monitoring and warning system for hot peppers in Guizhou.
Agronomy 12 01034 g003
Figure 4. Disease occurrence prediction model classification indicators for hot pepper powdery mildew. (a) ROC curve; and (b) confusion matrix.
Agronomy 12 01034 g004
Figure 5. Disease occurrence prediction model classification indicators for hot pepper anthracnose. (a) ROC curve; and (b) confusion matrix.
Agronomy 12 01034 g005
Figure 6. Interfaces of the epidemic monitoring system for hot pepper in Guizhou. (A) Front page; (B) Digital monitoring and early warning for disease and pests; (C) Thematic graphic display subsystem; (D) Disease and pest knowledge base; (E) Conference display management; (F) Information communication subsystem; (G) IoT data collection subsystem for disease and pests; (H) National plant protection professional statistical system; and (I) Basic data management.
Agronomy 12 01034 g006
Figure 7. APP interfaces for the hot pepper disease and pest surveillance system in Guizhou. (a) Base details; (b) Custom analysis; and (c) Current disease statistics. (A) Add information; (B) Equipment; (C) Early warning; (D) Analysis; (E) Scan; (F) Custom analysis; (G) Vegetables/Hot peppers; (H) Please select a business report; (I) Census form for hot pepper aphid damage; (J) Census form for the incidence of hot pepper anthracnose; and (K) Census form for hot pepper aphid damage situation: histogram.
Agronomy 12 01034 g007
Figure 8. Interface of the hot pepper disease and pest forecast system in Guizhou. (a) Powdery mildew forecast interface; and (b) Anthracnose forecast interface. (A) Disease model; (B) Pest model; (C) Regional stations; (D) Monitoring points; (E) Early warning model; (F) Start date; (G) End date; (H) Provide an early warning; (I) Map display; (J) Disease will not occur; (K) Disease will occur; and (L) No data.
Agronomy 12 01034 g008
Table 1. Categorization and summary of prediction models for hot pepper disease.
NPredicted—NoPredicted—Yes
Observed—NoTrue negativeFalse positive
Observed—YesFalse negativeTrue positive
Publisher’s Note: MDPI stays neutral with regard to jurisdictional claims in published maps and institutional affiliations.

