Article

Greenhouse Gas Emissions and Yield Production from an Organic and Conventional Fertilization on Quinoa

Department of Agriculture, Food, Environment and Forestry (DAGRI), University of Florence, 50144 Florence, Italy
*
Author to whom correspondence should be addressed.
Agronomy 2022, 12(5), 1015; https://doi.org/10.3390/agronomy12051015
Submission received: 14 March 2022 / Revised: 11 April 2022 / Accepted: 20 April 2022 / Published: 23 April 2022
(This article belongs to the Special Issue Cropping Systems and Agronomic Management Practices of Field Crops)

Abstract

:
The high nutritional properties of quinoa have resulted in a production increase worldwide. The resistance to environmental stresses renders this crop suitable for sustainable farming systems. Few studies have examined the impact of different agricultural management strategies and its contribution to climate change. In this work, we quantify soil greenhouse gas (GHG) emissions, in terms of carbon dioxide (CO2), methane (CH4) and nitrous oxide (N2O), and crop productivity (yields and biomass) under conventional (urea) and organic (digestate) fertilization. Significant differences (p < 0.05) in N2O cumulative emissions are reported between digestate (50–100 kg N ha−1), urea (50–100 kg N ha−1) and the control (0 kg N ha−1). Higher cumulative GHG emissions are observed under 100 kg N ha−1 of digestate (337.8 kg C ha−1 CO2 and 0.23 kg N ha−1 for N2O) compared to treatments with lower nitrogen (N) inputs. However, yield and biomass production do not show significant differences (p > 0.05) with increasing nutrient application. Hence, this study opens the discussion about the pros and cons of increasing fertilization to improve yields besides providing agricultural extension workers with additional information to promote sustainable quinoa production worldwide.

1. Introduction

The use of fertilizers in agriculture are responsible for a large share of anthropogenic emissions [1]. According to the International Panel on Climate Change (IPCC), at global level, 1% of the applied nitrogen (N) in agriculture is lost as nitrous oxide (N2O) emissions [2]. Other studies suggest that N2O losses can range between 0.03 and 14% of the applied N depending on the regions, soil texture, and crops [1]. It is also estimated that N2O emissions from agriculture represent approximately 80% of the global anthropogenic emissions. The magnitude of the environmental issue increases when considering organic fertilizers, which are important sources of nutrients sometimes missing in synthetic fertilizers, and when misused, can become large sources of greenhouse gases (GHG) [3,4]. Generally, due to their own composition, liquid-organic fertilizers provide higher N2O emissions compared to solid-organic fertilizers [1,5]. Organic fertilizers can improve nutrient availability, biodiversity, and microbial activity in the soil. Conversely, as soil organic carbon (C) increases, so does the microbial activity, which consequently accelerates carbon dioxide (CO2) emissions through soil respiration [6]. Recent literature reports a direct effect of organic fertilization, with compost and digestate, on methane (CH4) emission increase [7,8].
Due to its high tolerance to biotic and abiotic stresses, and nutritional properties, the cultivation of quinoa is gaining scientific attention [9]. Much of the scientific efforts have been devoted to the study of quinoa’s resilience to water, salinity, temperature, and nutrient stress, but little is known about the linkages between GHG emissions and increasing fertilization. Hence, the compounded effects of agricultural strategies on improving crop yields represents an area of major interest in agriculture [10]. For quinoa, discrepancies emerge between the actual effect of fertilization on biomass production and seed yields. For example, study [11] observes a positive relationship between yields and N fertilization rates. Similarly, study [12] shows a yield increase of up to 75–100 kg N ha−1. With regards to the type of fertilizer, most of the research on quinoa has assessed the effect of synthetic fertilizers, particularly urea (CO(NH2)2) and ammonium nitrate (NH4NO3), on quinoa yields. Ref. [11] describes an increase in plant height and seed yield with rising NH4NO3 rates. The same study reports an increase in yield from 0.9 to 9.2 g plant−1 under 0 and 122 kg N ha−1, respectively. Similar substantial yield enhancements are displayed when N-fertilization rates are increased from 40 to 120 kg N ha−1 [13], as well as with calcium ammonium nitrate (NH4NO3), with yields increasing from 1.8 to 3.5 Mg ha−1 under 0 and 120 kg N ha−1, respectively [14].
On the contrary, the authors of [15,16] report little to no differences in terms of yield and biomass production up to 25 kg N ha−1. In addition, studies [15,16,17] suggest that N-fertilization has a minor effect on quinoa performance, requiring approximately 25 kg N ha−1 per ton of quinoa seeds produced. Ref. [10] affirm that N splitting is not an advantage for fast-developing species such as quinoa, particularly in terms of seed yield and protein content.
Despite the previous studies, there is still limited information on quinoa’s performance under organic crop-systems. Existing studies have assessed different organic fertilizers, such as compost and cow manure, but do not show notable differences in yields [18]. Instead, Ref. [10] report a yield increase with organic N-fertilization (60, 120, and 180 kg N ha−1 of slurry), observing a yield of 2.20 Mg ha−1 under 180 kg N ha−1 of slurry. Similarly, study [19] report 1.20 Mg ha−1 (Ayacucho) and 1.70 Mg ha−1 (Huancavelica) with 35 Mg ha−1 and 54 Mg ha−1 of poultry fertilizer (guano), respectively. From the former literature review, we conclude that countless factors are responsible on improving yields and, consequently, require additional scientific attention; in particular, on the linkages between fertilization and yields, and the environmental costs associated with higher agricultural inputs [20]. Lastly, recent studies highlight the differences in GHG emissions because of the type of fertilizer (organic and synthetic), pedoclimatic conditions, and agricultural management strategies [1]. This emphasizes the need to conduct case-specific observations to obtain information about emission dynamics from agricultural systems.
In the present study, digestate and urea are assessed at different rates (0, 50, and 100 kg N ha−1) to better understand their effect on quinoa yields, biomass production, and environmental impacts.

2. Materials and Methods

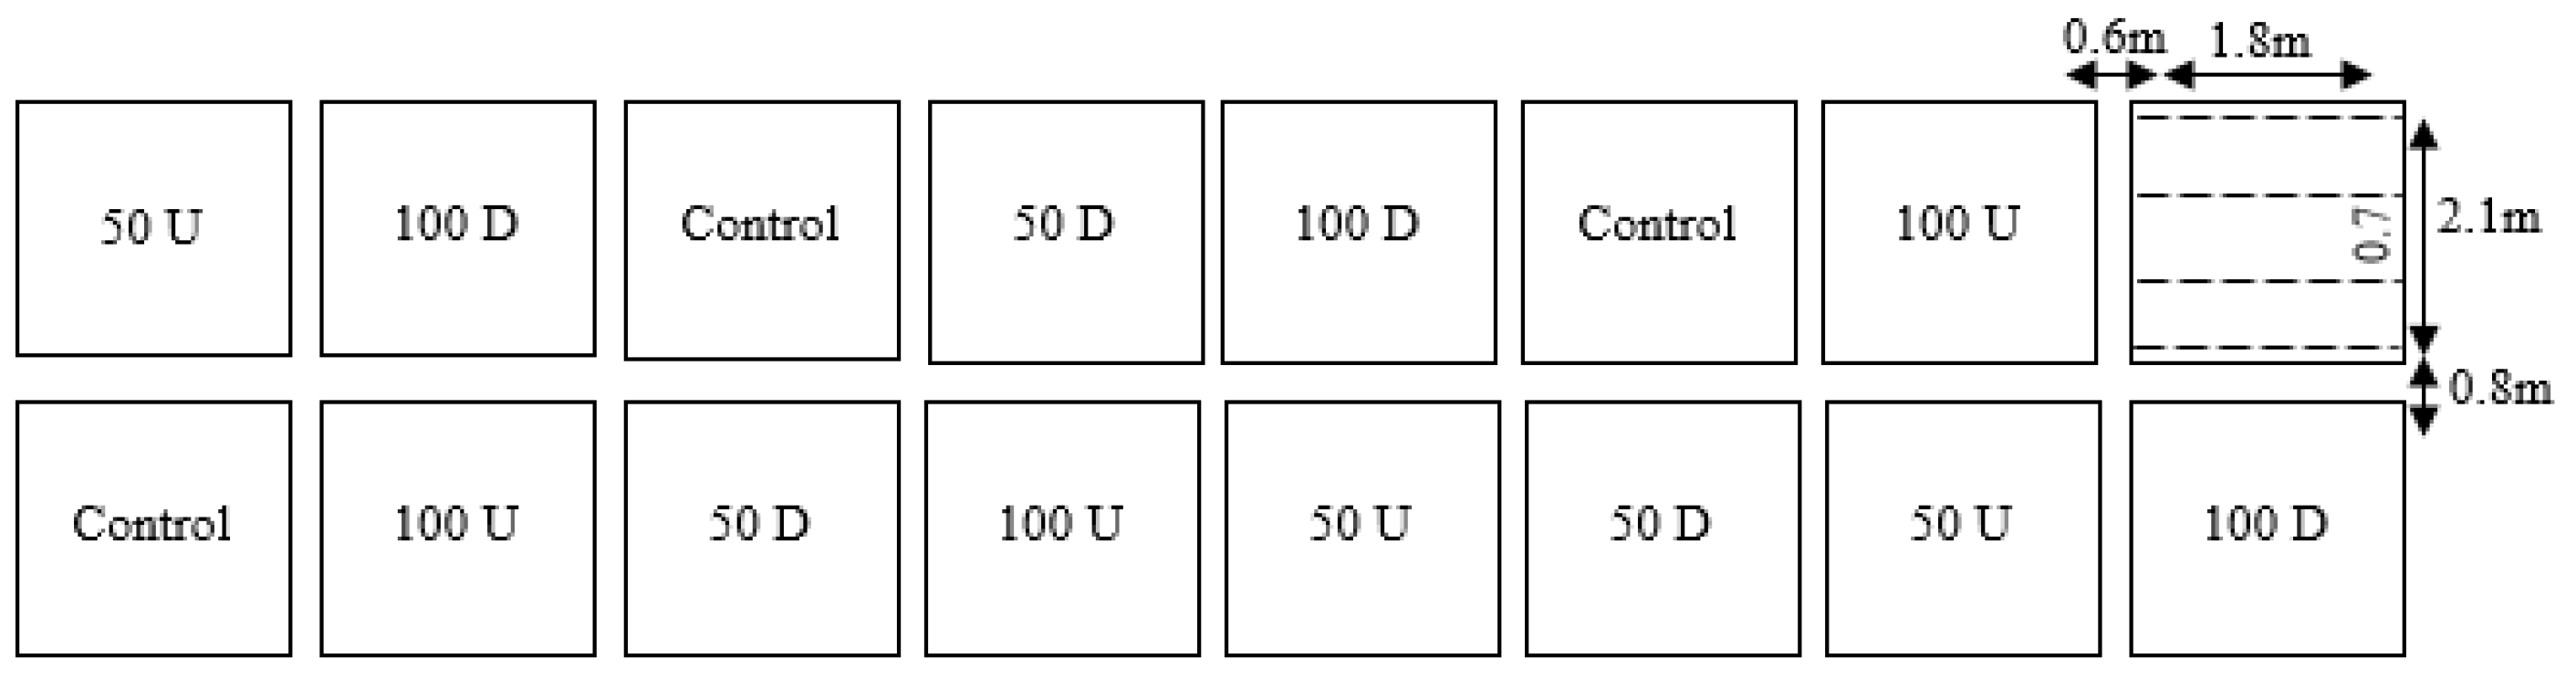
2.1. Experimental Design and Agricultural Management Strategies

This study was run between May and August 2019 at the experimental field of Istituto Tecnico Agrario Statale (ITAS) (43° 47′ 06′′ N and 11° 13′ 06′′ E; 40 m.a.s.l.) in Tuscany, Italy. A randomized complete block design (RCBD) was used, divided in two types of fertilizer (urea (U) and digestate (D)) with two different N-levels (50 and 100 kg N ha−1) and a control (0 kg N ha−1); hereafter referred to as Control, 50D, 100D, 50U, and 100U. Each treatment included three replicates, for a total of 16 plots (Figure 1). Each plot sized ±4 m2 (2.1 m width and 1.8 m length), with four rows spacing 70 cm and plants distancing 10 cm from each other (15–20 plants m−2 and ±75 plants plot−1). Thus, experimental design was: Control (0 kg N ha−1); 50 D (50 kg N ha−1 as digestate); 100 D (100 kg N ha−1 as digestate); 50 U (50 kg N ha−1 as urea); 100 U (100 kg N ha−1 as urea).
The genotype Titicaca was sown on 8 May and harvested on 26 August, with a total cycle duration of 110 days. Urea (CO(NH2)2) and the liquid fraction of digestate from pig slurries (Table 1) were manually spread in two equal doses, and immediately incorporated into the soil (at 20 cm depth) using a tractor (BCS 710 ACTION). Fertilization was carried out 28 and 49 days after sowing (DAS), coinciding with the stem elongation and flowering phase, respectively. Mechanical weeding was done at the same time as fertilizer application using the same walking tractor. The soil texture in the study field was characterized for being sandy-loam (56% sand, 15% clay, and 29% silt) with a total N content of 0.15 g kg soil−1 at 0–20 cm depth.

2.2. Crop and Agrometeorological Measurements

The monitoring of plant’s phenology was performed during the entire growing season. Measurements were taken from the two middle rows to avoid any side effects. For the evaluation of crop performance (yield and biomass production), all the plants in the middle rows (38 plants plot−1) were sampled at physiological maturity and manually harvested using a sickle. Dry weight of grains and biomass (stems and leaves) were determined by drying samples in an oven at 80 °C for 48 h. To standardize the results, yield (grains) and biomass production (stems and leaves) were converted to kg ha−1. Harvest index (%) was calculated as the ratio between yield (grains) and biomass (Table 2). To complete the agrometeorological analysis, weather information (daily average, maximum and minimum temperature, and precipitation) was obtained from both the Regional Hydrological Services of Tuscany (SIR) and the Functional Centre of the Tuscany Region (CFR).

2.3. Greenhouse Gas Measurements

GHG measurements were recorded biweekly from the middle rows during the entire growing season: at 7 DAS (hereafter, M1), 16 DAS (M2), 28 DAS (M3), 33 DAS (M4), 49 DAS (M5), 63 DAS (M6), 77 DAS (M7), 93 DAS (M8), and 110 DAS (M9), respectively. GHG monitoring was performed using 16 static chambers (one per plot) and a portable gas analyzer (XCGM-400, Madur Sensonic). Soil emissions measurements were carried out between the rows avoiding the inclusion of plants inside static chambers. Chambers were assembled following the USDA-ARS GRACEnet Project Protocols [21], as described by [8]. Chambers were made by two parts: chamber lids [8] and chamber collars that were inserted into the soil at 5 cm depth to avoid any mechanical damages to the plant’s root system. The portable gas analyzer used non-dispersive infrared (NDIR) technology for the analysis of CO2 (±0 ppm), CH4 (±10 ppm), and N2O (±1 ppm). Gas concentration inside the chambers (ppm), area (314 cm2), volume (9420 cm3), closing time (one hour), and molecular weight of each gas were considered for computing soil GHG fluxes. Cumulative soil GHG emissions at the end of growing season were expressed as kg C ha−1 for CO2 and CH4, and as kg N ha−1 for N2O.
For the observations on emissions fluxes and yields analysis, a yield-scaled emission calculation was used for each gas. Yield-scaled emissions were expressed as the net contributes of 1 kg of quinoa grains (kg CO2 eq.) The kg CO2 eq. were obtained from gas-specific Global Warming Potentials (GWP) (CH4 and N2O with values of 28 and 298, respectively) [22]. The total impact of each treatment was determined as kg CO2 eq. and computed separately for the cumulative sum of each GHG (Table 3).

2.4. Statistical Analysis

The GHG emissions (CO2, CH4, and N2O), yields, and biomass were examined by analysis of variance (ANOVA). The Tukey HSD test with a critical p value lower than 0.05 was used as pairwise comparison to test the significance between different N-fertilization rates (0, 50, 100 kg N ha−1) and types of fertilizer (digestate and urea). The statistical package used to run the ANOVA analysis was Minitab 19.

3. Results

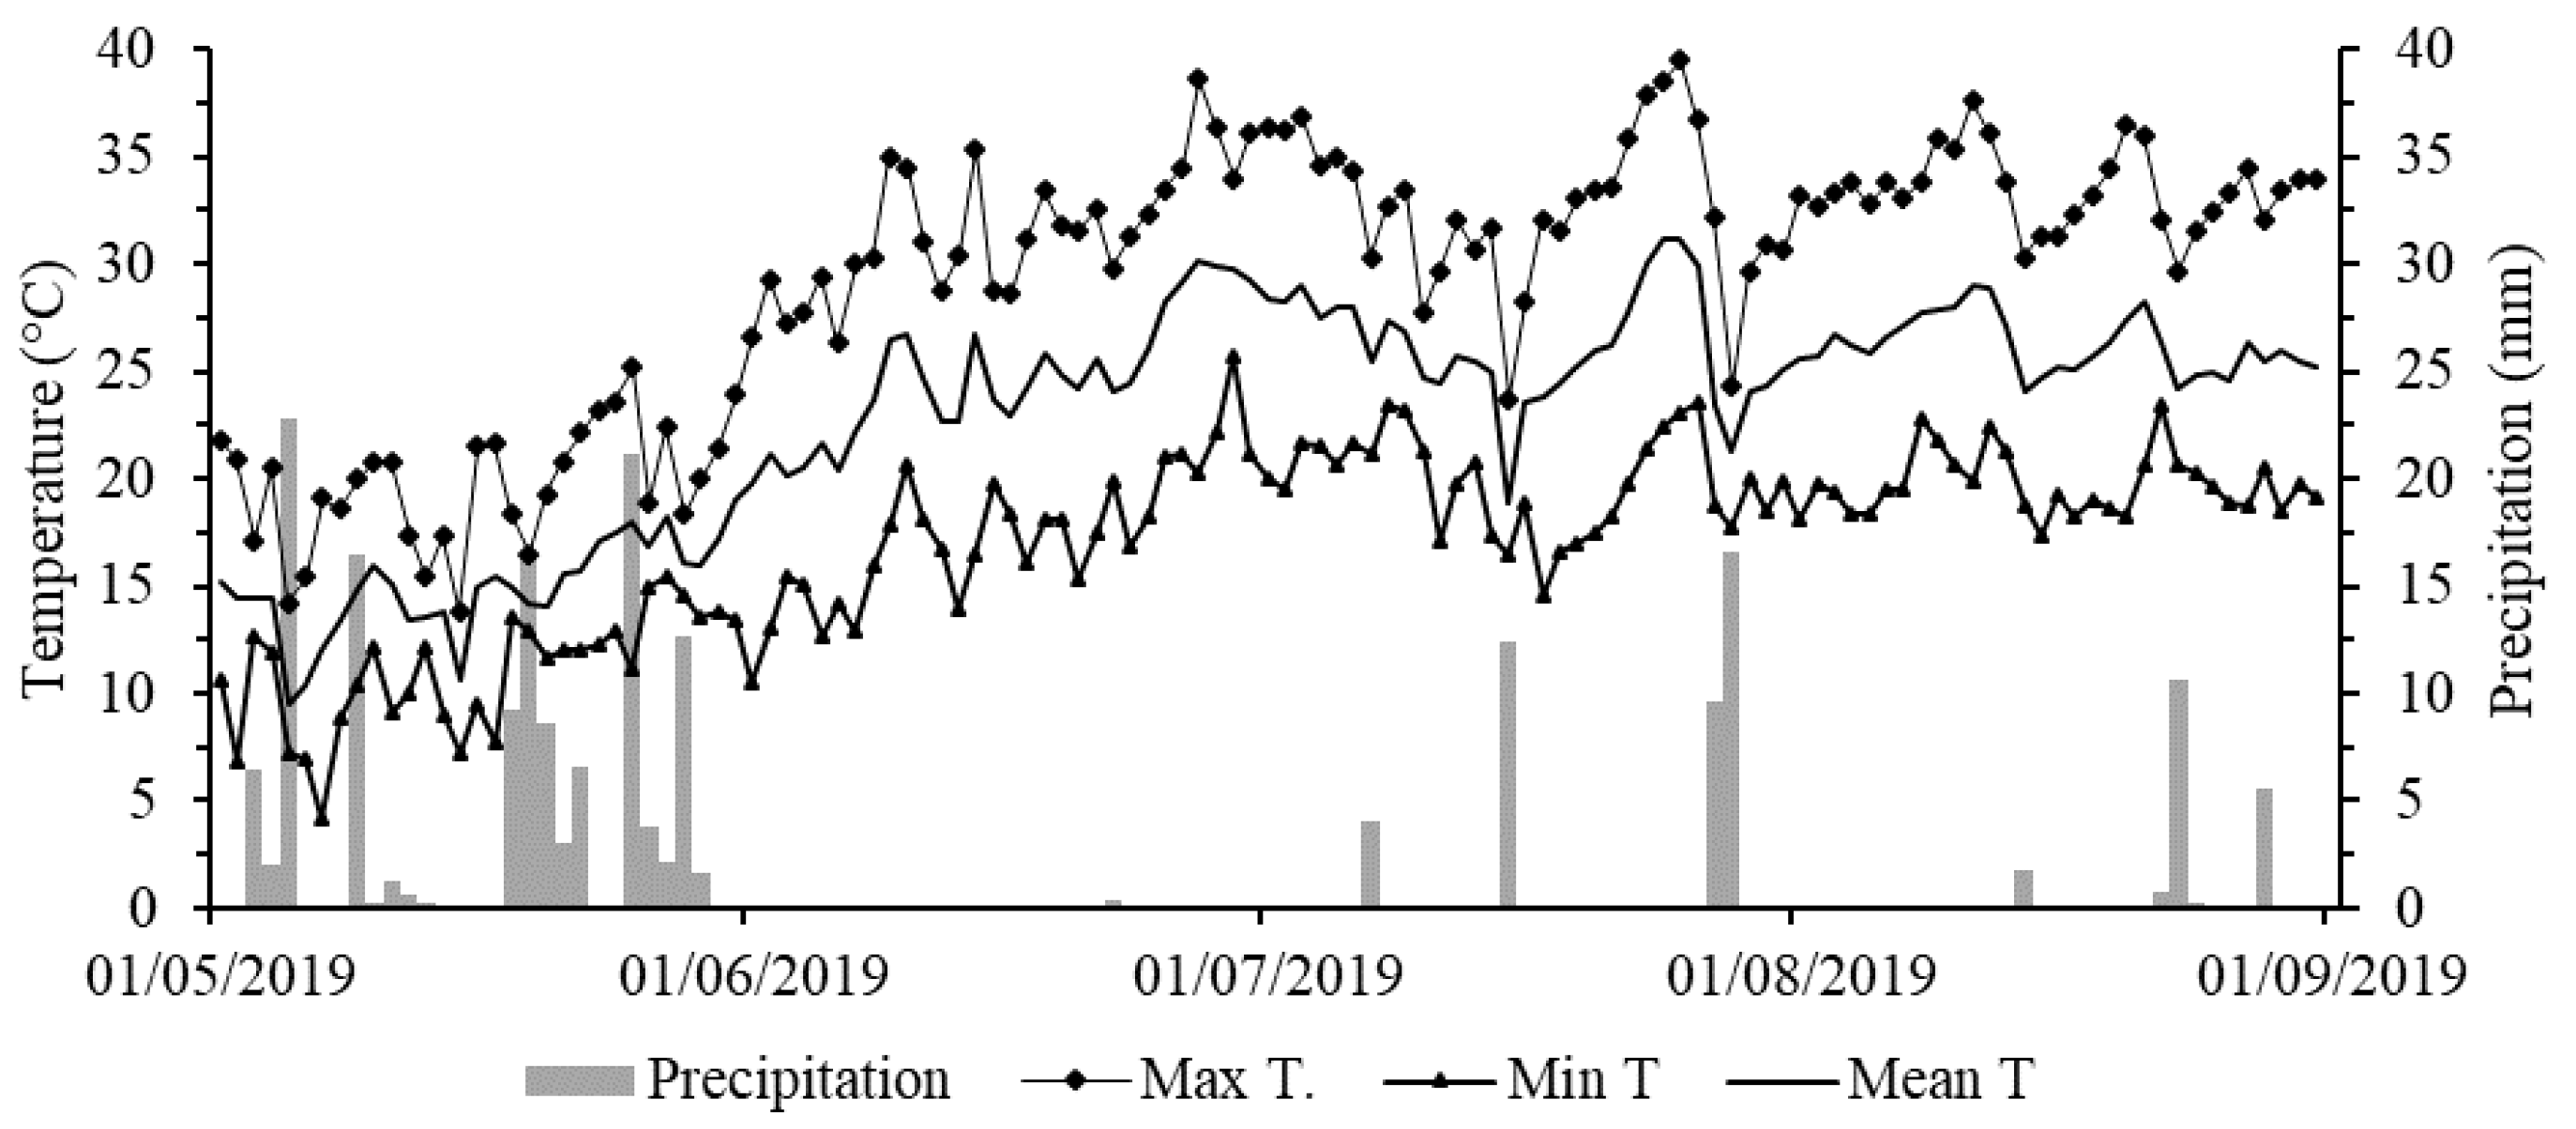
3.1. Meteorological Information

The average temperature recorded during the growing season was 23.0 °C (Figure 2). July and August were the warmest months, with an average temperature of 26.1 °C. Average maximum and minimum temperatures were of 29.3 °C and 17.0 °C, with maximum and minimum absolute values of 39.5 °C and 4.2 °C, respectively. The total amount of precipitation was 197.2 mm, distributed over 28 precipitation events. Most of the precipitation was recorded in May (135.2 mm), with erratic rainfall from June to September.

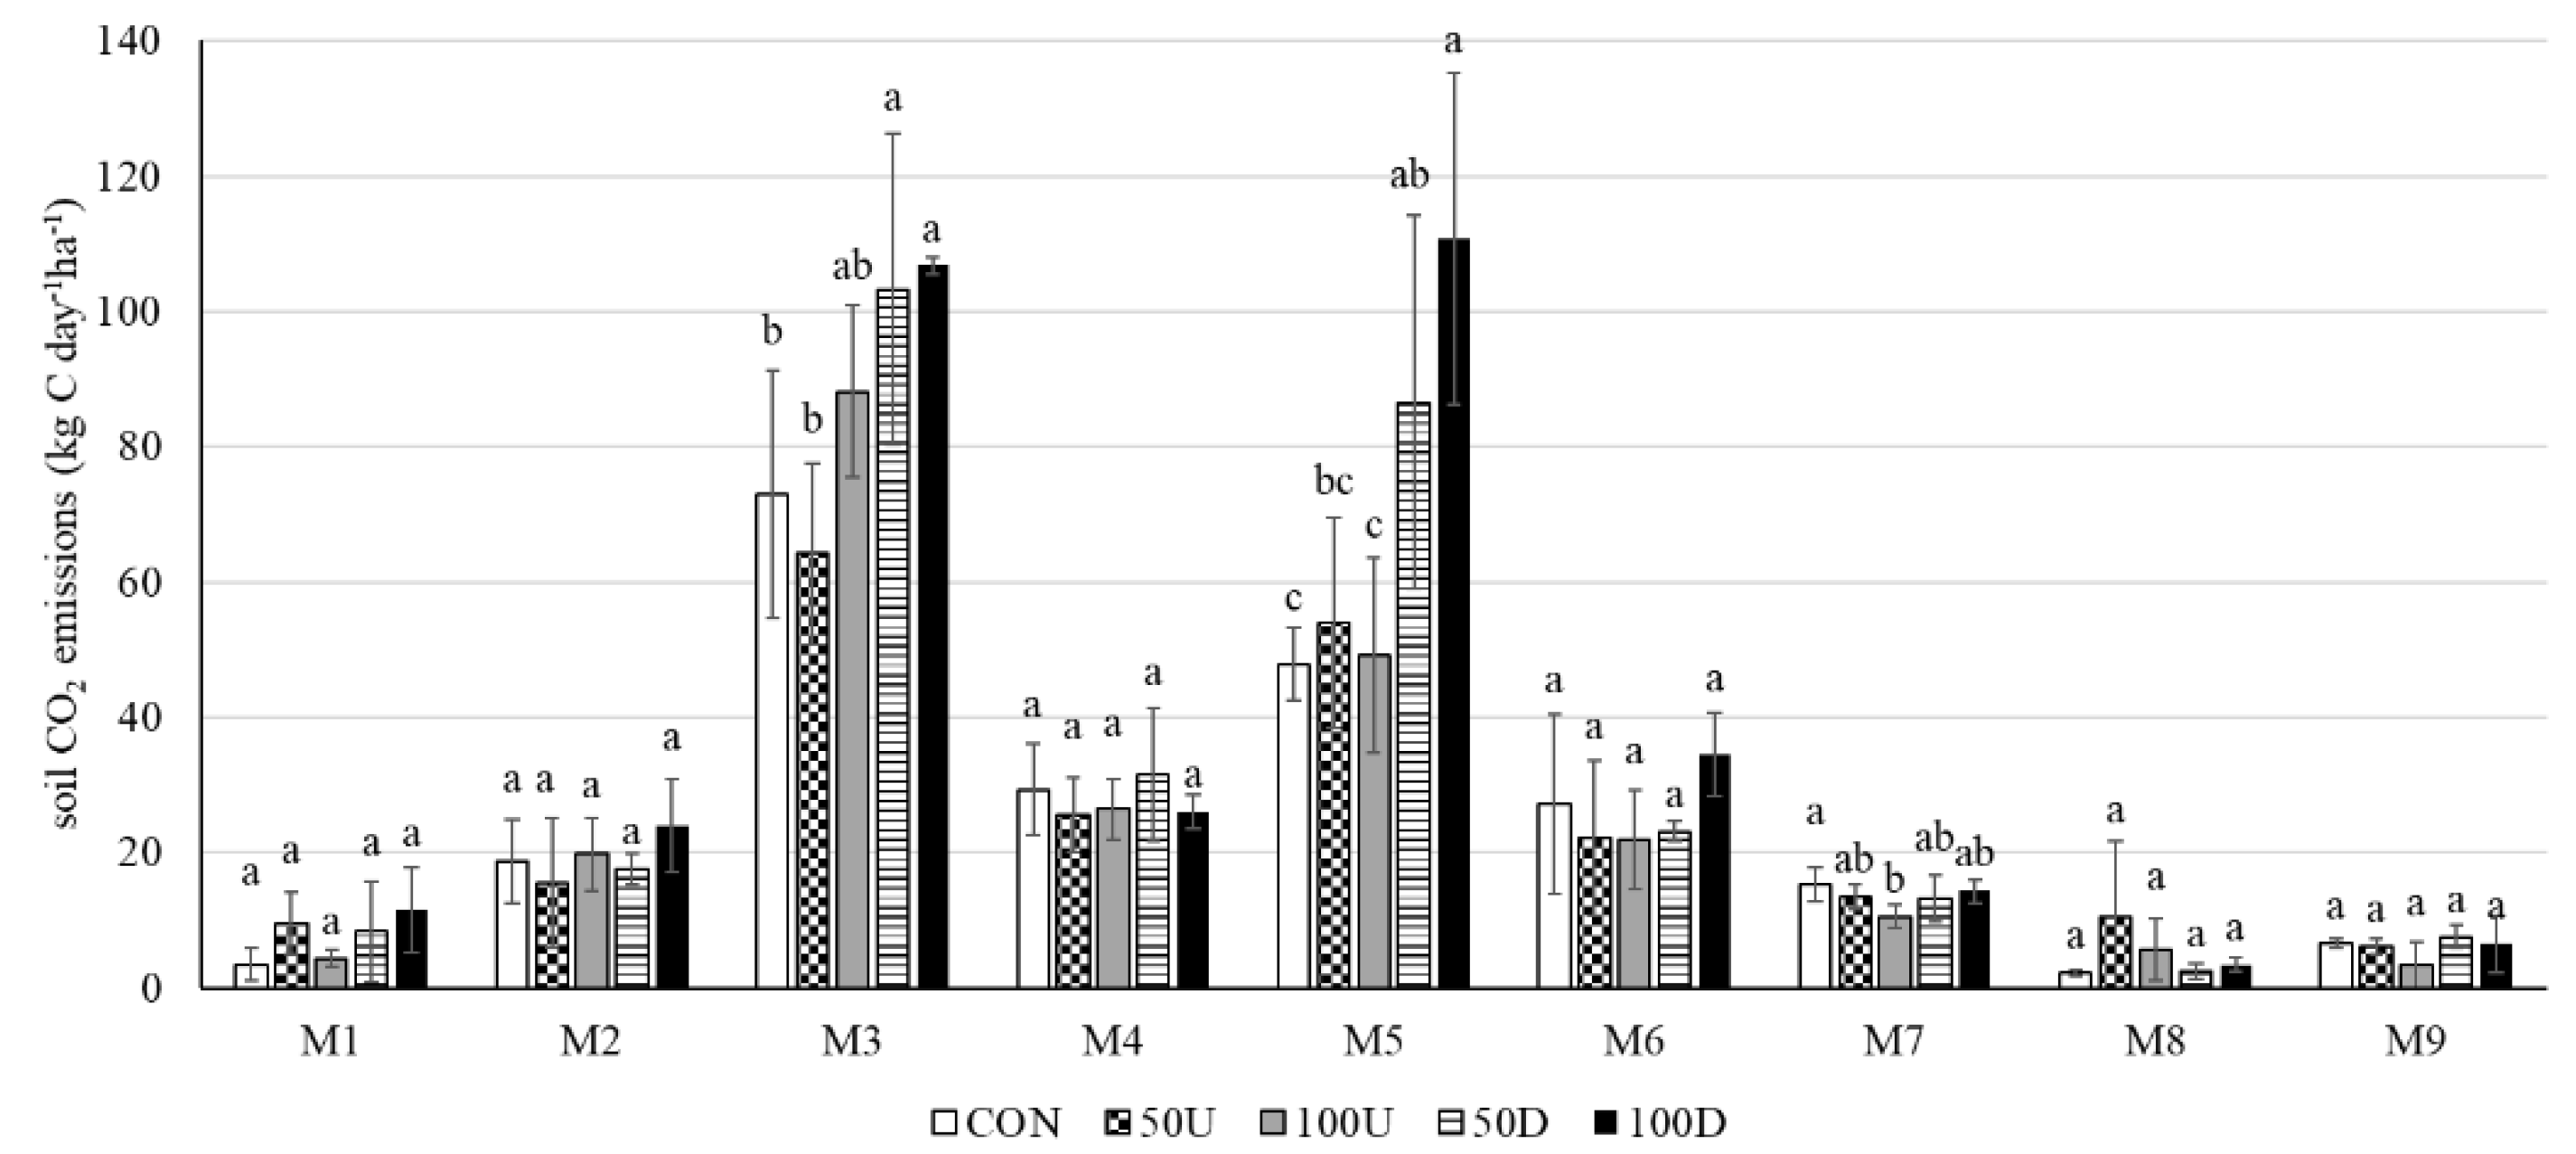
3.2. Carbon Dioxide Emissions

Despite a high variability in the results, soil CO2 emissions during the growing season showed similar trends in all treatments (Figure 3). Emissions increased following crop growth, peaking twice at each fertilization event (at 28 and 49 DAS, corresponding to stem elongation and flowering). Regardless of the N rate (50 and 100 kg N ha−1), treatments with digestate produced higher emissions than synthetic fertilizers and the control (Table 3). Between the two fertilization events, and from M6 to the end of the experiment, soil CO2 emissions experienced a notable decrease with time and, therefore, at harvesting (M9), soil CO2 emissions were close to initial levels. Significantly higher (p < 0.05) cumulative CO2 emissions were observed under 50D and 100D treatments (293.6 and 337.8 kg C ha−1, respectively) than for the other treatments (Table 3). However, no significant emission differences (p > 0.05) were reported between the control, 50U and 100U (Table 3). Similar cumulative CO2 emissions (p < 0.05) were recorded for the control and urea treatments, and these were approximately 30% lower to those of digestate (Table 3). Overall, changes in N fertilization rate (0, 50, and 100 kg N ha−1) did not affect the CO2 emission rate (p > 0.05) (Table 3).

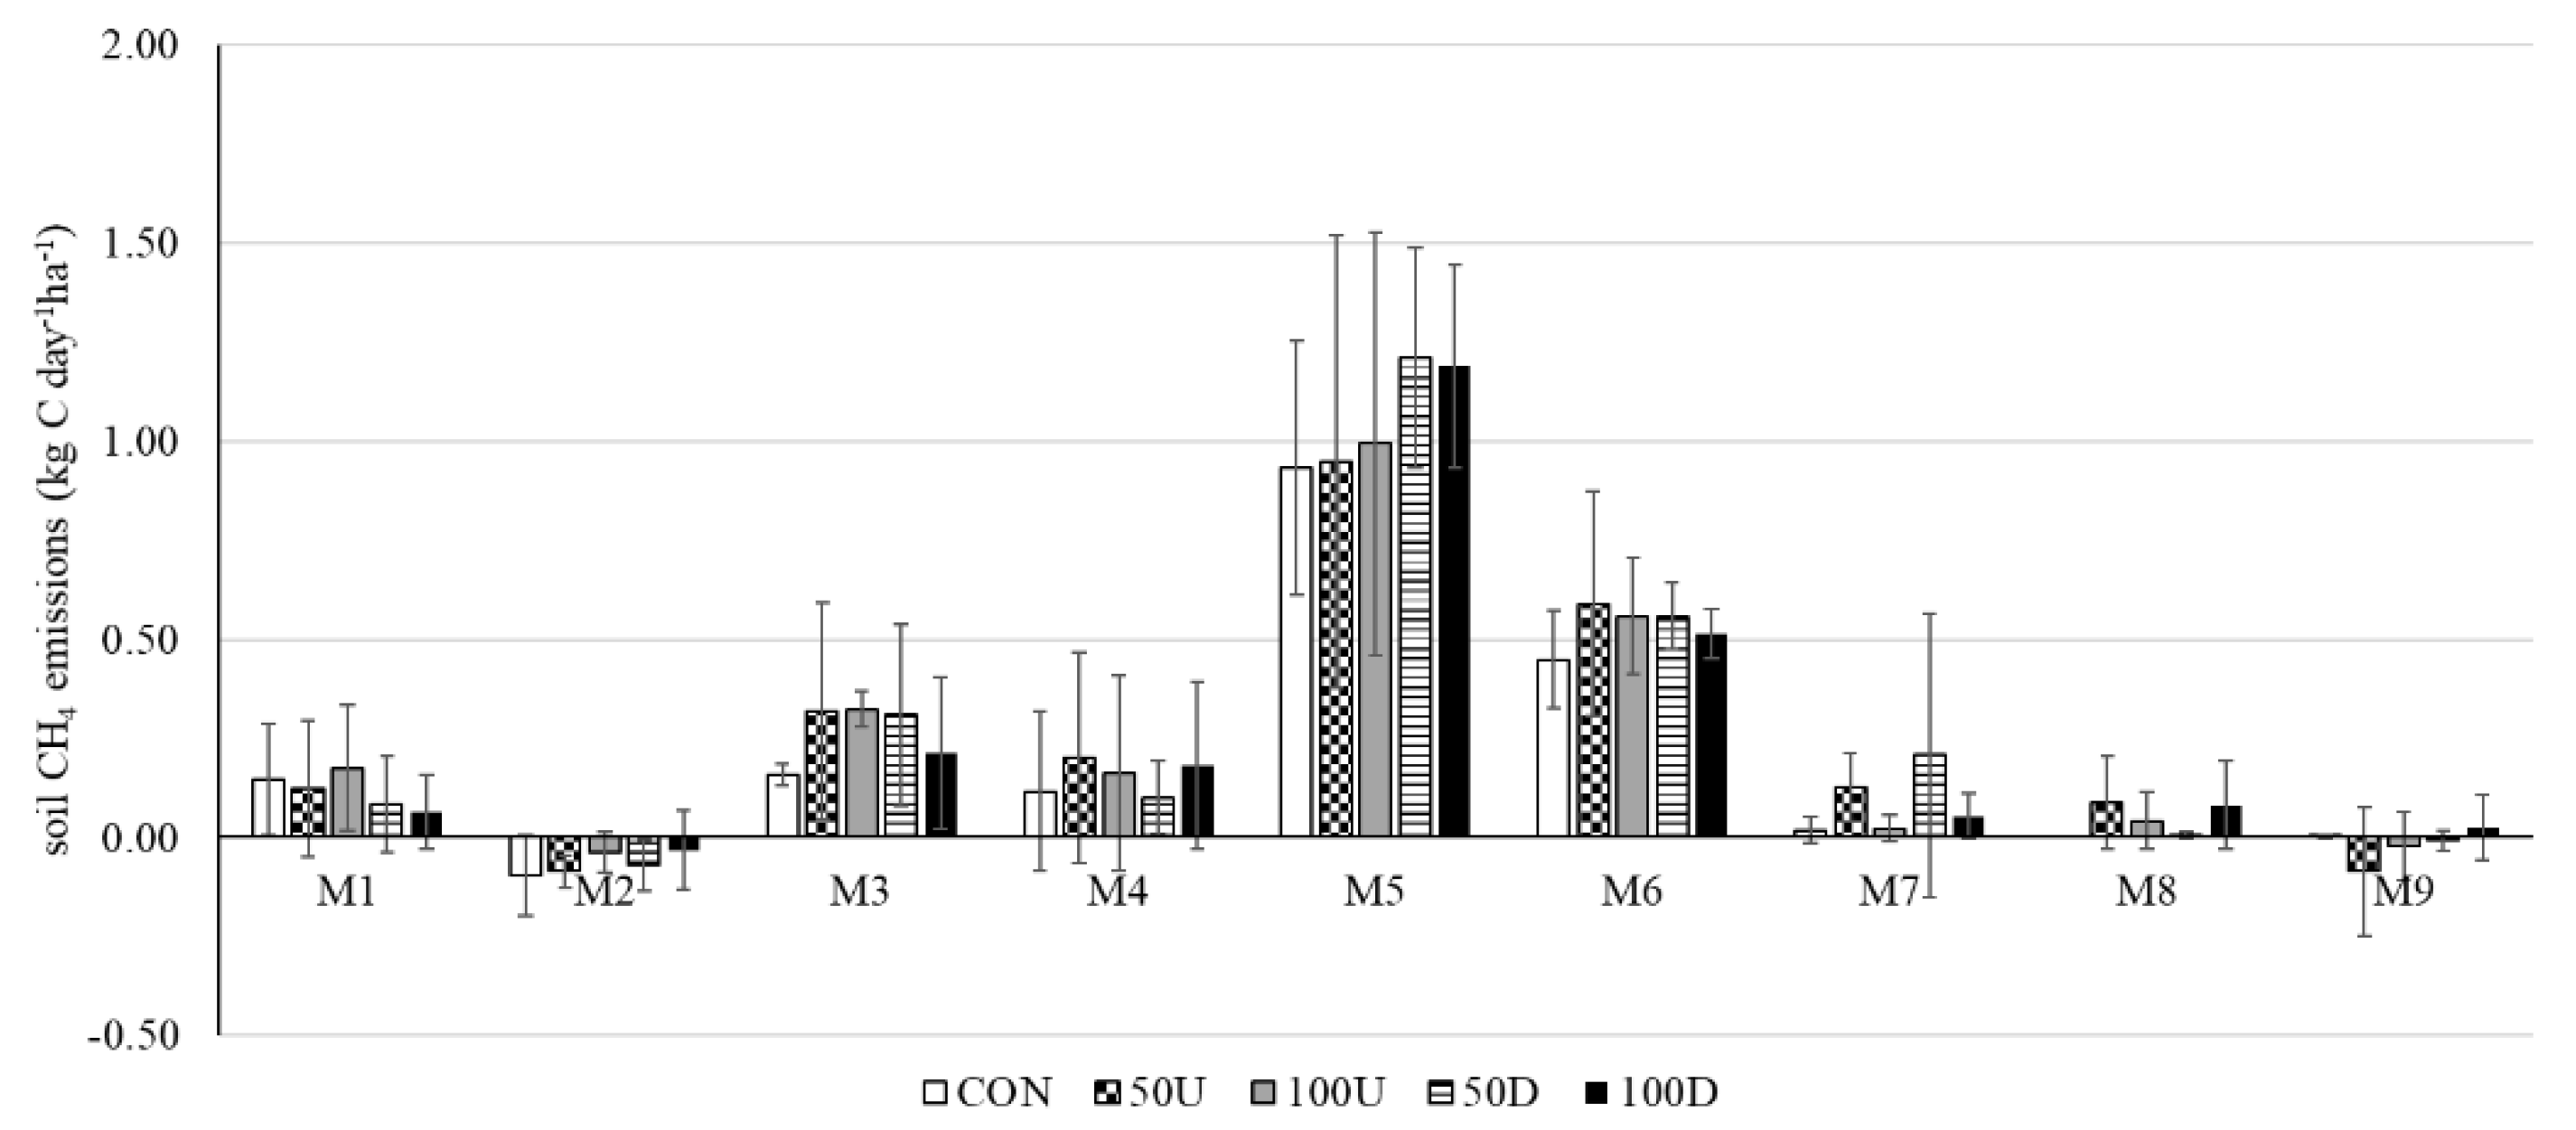
3.3. Methane Emissions

As for CO2, two CH4 emission peaks were observed in all treatments (M3 and M5), coinciding with each fertilization event (Figure 4). Nevertheless, during the second fertilization event (M5), emissions were considerably higher (0.9 to 1.2 kg C day ha−1) to those observed during the first fertilization event (0.1 to 0.3 kg C day ha−1). No significant CH4 emission differences (p > 0.05) were displayed between treatments. However, during the second fertilization treatment, higher CH4 emissions were observed in both digestate treatments, suggesting a marginal effect of water and methanogenic bacteria content on digestate. This was also confirmed by the cumulative CH4 emissions, with higher values detected under 50D and 100D, though without displaying significant differences (p > 0.05) amongst treatments (Table 3). In M2 and M9, the soil acted as a CH4 sink with low levels of CH4 oxidation. Overall, during the growing season, no statistical differences (p > 0.05) were recorded for soil CH4 emissions in all treatments, suggesting that CH4 emissions were neither related to different N rates (0, 50, and 100 kg N ha−1) nor to different types of fertilizer (digestate and urea) (Table 3).

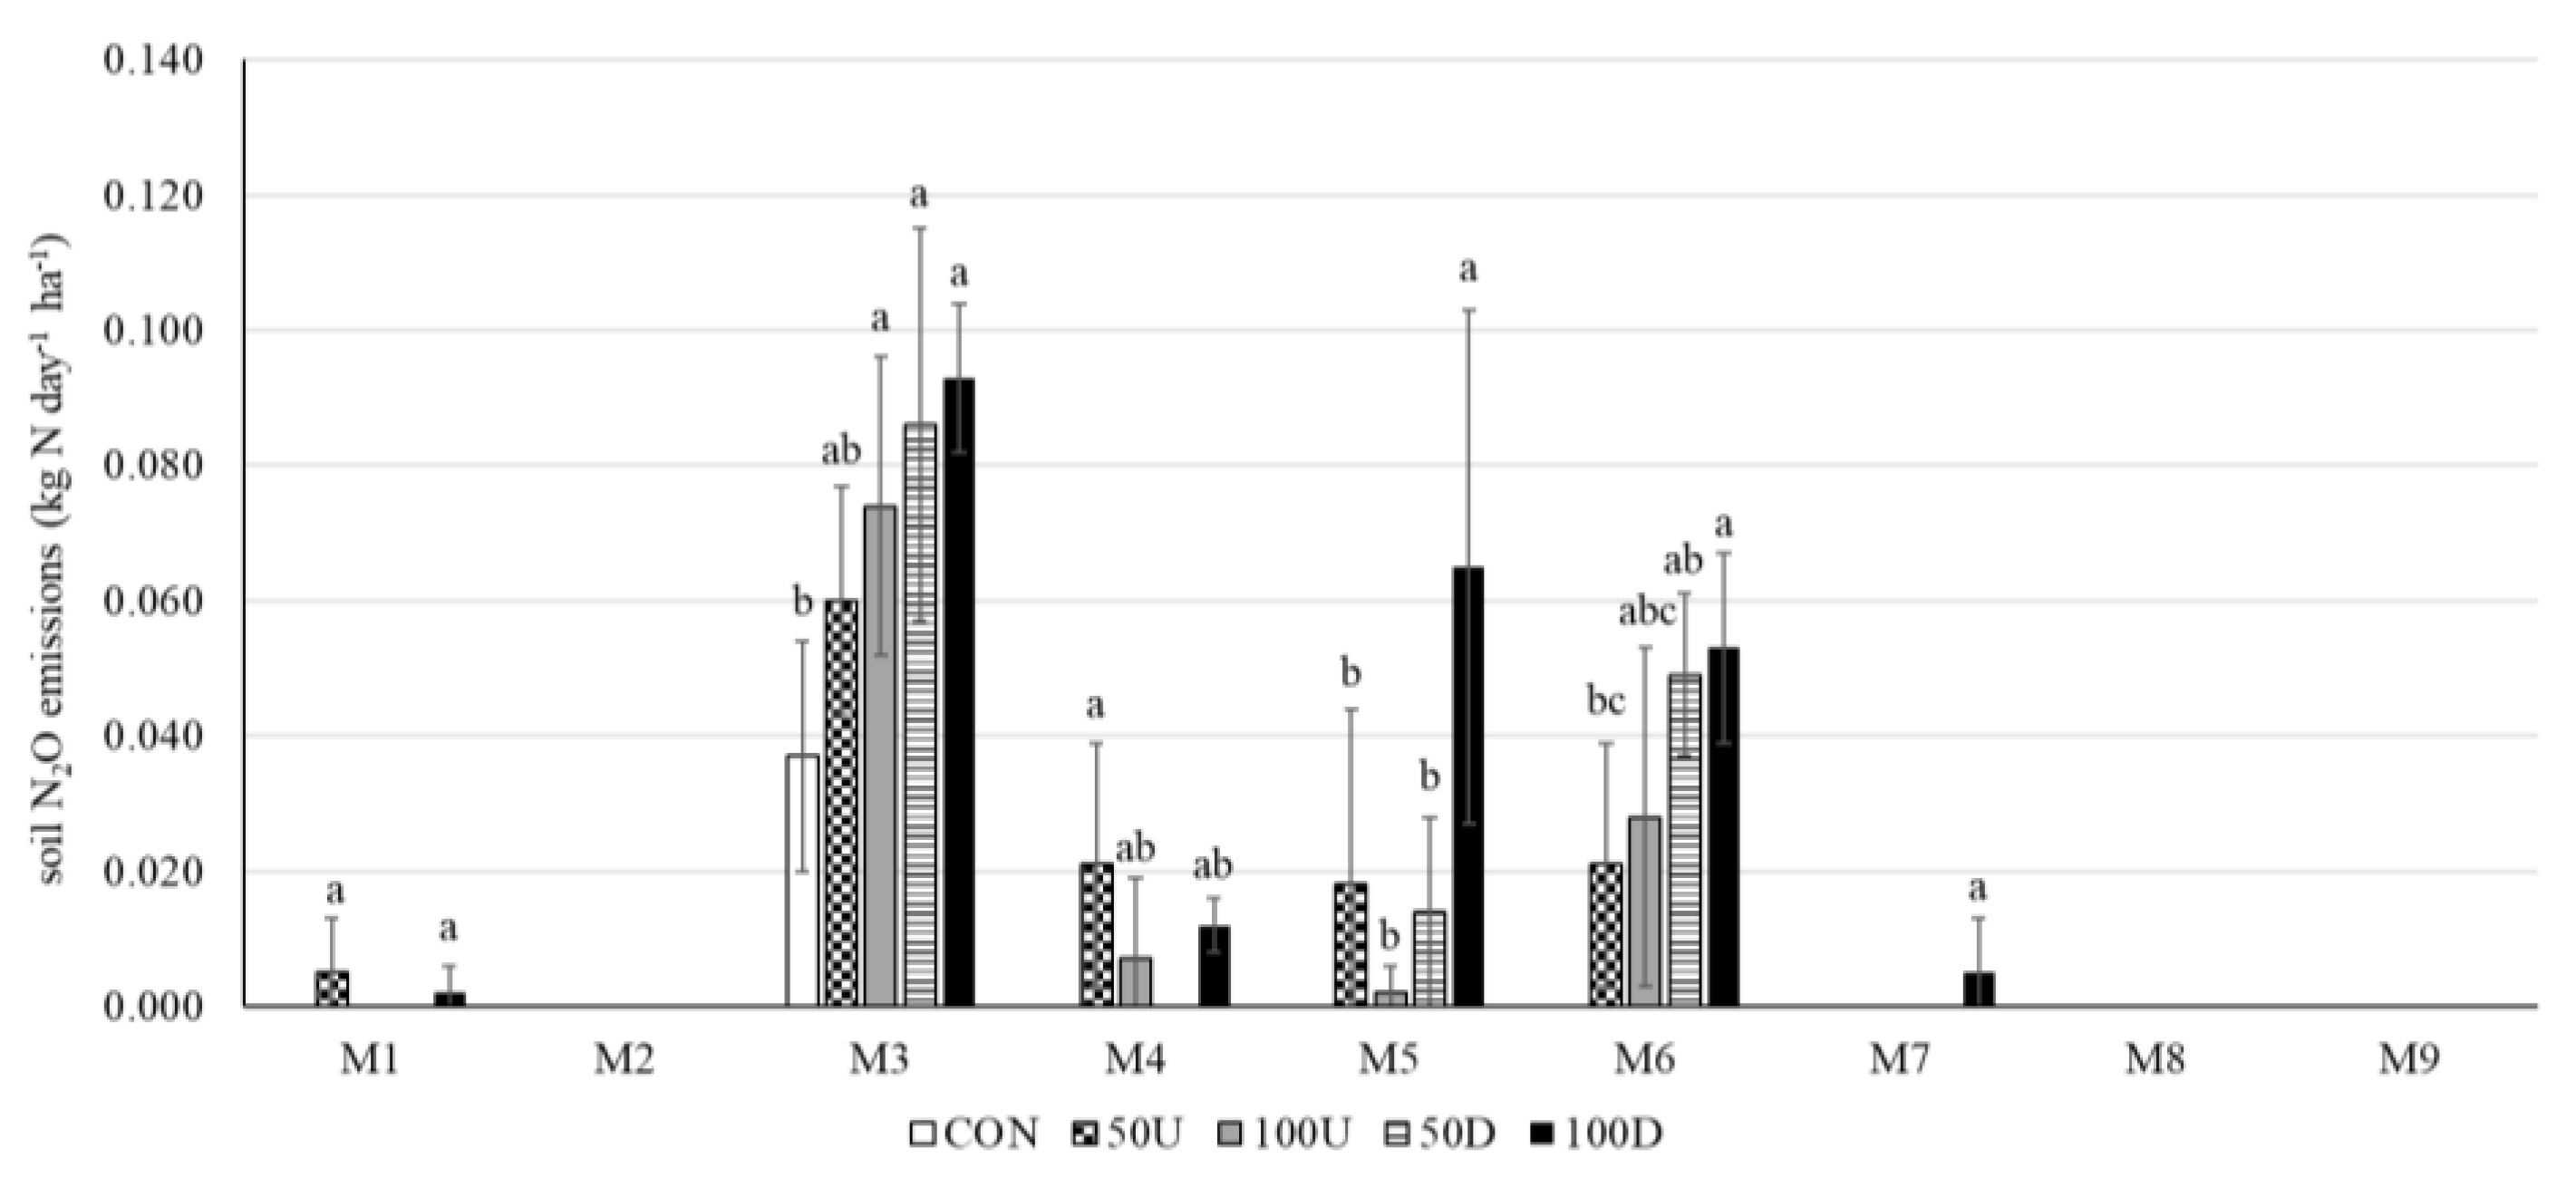
3.4. Nitrous Oxide Emissions

For the N2O emissions fluxes from the soil, similar trends were detected to those of CO2 and CH4, with an N2O increase at each fertilization event (M3 and M5) and following measurement (M6) (Figure 5). Nevertheless, during the second fertilization event (M5), N2O emissions showed a different trend to that of CO2 and CH4, based on the type of fertilizer (digestate and urea) and N rate (50 and 100 kg N ha−1). For the control, N2O emissions were not reported during the entire growing cycle, except for M3. Regardless of the amount of N (50 and 100 kg N ha−1), urea had a longer emission lag-time than digestate and, therefore, higher N2O emissions were observed at M6 than at M5. In fact, digestate was more reactive than urea, showing an emission peak under 50D and 100D immediately after each fertilization event. Nevertheless, only significantly higher (p < 0.05) emissions were observed under 100D. As for CO2 and CH4, N2O emissions decreased between the two fertilization events, with emissions returning to initial levels at the end of the experiment. From the analysis of cumulative N2O emissions (Table 3), results showed higher N2O emissions (p < 0.05) at 100D compared to other treatments (CON and 50D). Significant differences (p < 0.05) were reported between 100D and 100U, 50U and 50D, as well as when comparing 100D, 100U, 50U, and 50D to the control. Regardless of the N supply, N2O emissions were significantly affected by the type of fertilizer (p < 0.05), with digestate producing the highest N2O emissions compared to urea. N2O emissions were affected by different N rates, being 100 kg N ha−1 the treatment (100D and 100U) with highest N2O emissions.

3.5. Quinoa Yields and Biomass Production

From the analysis of results, we observed no differences in yield and biomass neither between different N rates (0, 50, and 100 kg N ha−1) nor types of fertilizers (urea and digestate) (Table 2). Even though the highest seed yields were obtained under 100U and 50U (894 and 852 kg ha−1, respectively), no significant yield differences (p > 0.05) were found when comparing 100D, 50D, and the control. A similar behavior was observed with biomass production, with no significant differences between different N rates nor fertilizers. While the highest dried-biomass production was reported under 100U and 100D with 4064 and 3832 kg ha−1, respectively, the lowest was found both under 50U and the control (3188 kg ha−1). The average harvested index for all the treatments was 23.7%.

3.6. Yield-Scaled Emissions

The ratio between cumulative GHG emissions (Table 3) and observed yields (Table 2) were crucial for determining the environmental impacts of quinoa. Relative CO2, CH4, and N2O emissions, expressed as kg and g of C and N kg seed−1 produced (depending on the gas), showed alike behavior in all treatments (CON, 50D, 100D, 50U, and 100U). For all three gases (CO2, CH4, and N2O), values were highest at 100D followed by 50D, 100U, 50U, and, finally, the control. For N2O, significant differences (p < 0.05) for relative emissions were observed under 100D when compared to the other treatments (Table 3). The gas-specific GWP for each GHG was used to calculate the yield-scaled emission (Table 4) for each treatment. Yield-scaled emissions were significantly higher for digestate (0.075 kg CO2eq kg seed−1) than for the control (0.013 kg CO2 eq. kg seed−1). Despite the different levels of N fertilization, no significant differences were reported between treatments. In addition, the gas-specific emissions per kg of seeds produced for different types of fertilizers showed that digestate had higher N2O emissions than urea.

4. Discussion

4.1. Carbon Dioxide Emissions

Our results showed that CO2 emissions peak at each fertilization event, afterwards, emissions declined in a similar way to that reported by [8,23]. The CO2 emissions peaked in spite of the amount of N (50 and 100 kg N ha−1) and type of fertilizer (urea and digestate), with similar findings as those observed in the control (0 kg N ha−1). Hence, the increase in CO2 emissions was not just attributed to fertilization treatments, but to agricultural practices, in particular, mechanical weeding. Since the control was subjected to the same agricultural practices as that of the other treatments, the peak in CO2 displayed a similar behavior among treatments. Soil CO2 emissions were produced during harrowing, releasing CO2 trapped in the soil pores [24,25]. The destruction of soil aggregates, through harrowing, improved soil aeration and the incorporation of organic matter into the soil. As a result, microorganism activity was enhanced which led to a rapid decomposition of soil organic matter [25]. In addition, CO2 emissions from agricultural soils were affected by a wide range of factors such as soil moisture, temperature, soil organic matter, and pH, among others, thereby rendering emission dynamics highly variable [8,26,27]. The compounded effect of all these factors resulted in a high variability in CO2 emissions.
Furthermore, in this study, we observed higher CO2 emissions under higher N rates of digestate (100D) than under lower N rates of both digestate (50D) and/or urea (100U and 50U). This was probably due to the combined effect of high-water and organic matter content in digestate, which uniformly reached the rhizosphere. Moreover, water played a key role in the development of soil microbial activity. For example, the action of water in digestate, together with high atmospheric temperatures (Figure 1), created optimal microbial growing conditions, thereby increasing metabolic activity and enhancing microbial respiration, which consequently resulted in the release of CO2. Similarly, organic matter in digestate also enhanced the soil microbial growth. Previous studies demonstrated that organic matter represented a fundamental source of carbon (C) for the metabolism of soil bacteria and, thus, further increased CO2 emissions [28,29].
With regards to soil CO2 emissions from urea, our results did not show significant differences on cumulative soil CO2 emissions between the control, 50U, and 100U. Therefore, given that the soil CO2 emissions from urea were triggered by hydrolysis (occurring under the presence of water and urease enzyme), and that the C contained in urea was lost by volatilization, no significant differences were reported among treatments.

4.2. Methane Emissions

The soil CH4 emissions observed in this experiment were negligible compared to those of CO2. Nevertheless, CH4 emission trends were similar to those of CO2, increasing after each fertilization event. Dried conditions during the growing cycle, intercalated by heavy rainfall events, were responsible for low CH4 cumulative emissions (28.9 kg C ha−1, average of all treatments). These values were consistent with the findings of [30,31], affirming that soil water and anaerobic conditions were the main drivers of CH4 emissions. Despite the discrepancies found within the literature, study [32] concluded that N fertilization, and in particular NH4+, inhibit CH4 oxidation due to its similar molecular size and the low specificity of the monooxygenase enzymes of methanotrophic bacteria. This competition was first described by study [33], demonstrating the inhibitory effect of NH4+ on CH4 oxidation. As a result, the CH4 emissions from digestate can be ascribed to the intrinsic content of methanogenic bacteria within digestate [34]. In addition, due to the combined effect of physical disturbances within the soil from harrowing, and the use of different types of fertilizers, CH4 emissions from digestate were similar to those observed in urea and the control. The authors of [24,30] affirmed that land use changes, from natural conditions to agricultural lands, strongly reduced the CH4 oxidation potential of soils, which switched from being a sink to become a CH4 source. In this experiment, CH4 absorption from the soil was observed at M2 and M9, when harrowing did not take place (Figure 4). Hence, tillage was the main factor responsible for CH4 emissions. Tillage was previously shown to have a greater effect on CH4 emissions than the type of fertilizers and N fertilization rates by directly disturbing the methane-oxidizing community at the soil level [35].

4.3. Nitrous Oxide Emissions

The present study revealed the effect of N rate on N2O emissions, with a positive relationship between increasing N rates and N2O emissions, mostly from digestate. Due to the shallowed root system of the selected quinoa genotype, less N was taken up by the root system and, therefore, higher residual N was left in the soil prone to environmental losses (soil leaching and volatilization). As for CO2 and CH4, N2O emissions followed a similar behavior during the growing season, with two emission peaks at each fertilization event. According to studies [29,36], N2O emissions were strongly related to soil moisture conditions and available N-compounds, mostly NH4+. During the first fertilization event, all treatments showed alike trend, though higher emissions under 100D due to a higher water (>98%), NH4+ (>75% of total N), and organic C content present in digestate. The compounded effect of all these factors accelerated soil N2O emissions. Relevant N2O emissions were also reported for 50D as well as for urea treatments. N2O emissions from the latter treatments were associated to heavy precipitation observed before applying fertilizers (Figure 2), which improved soil water content and enhanced urea decomposition. Urea had a high NH4+ content, but as a granular fertilizer, required more water to degrade [30]. Harrowing performed at M5 (43 DAS) disaggregated the soil and ensured homogenous infiltration of water from precipitation. For example, the 4 mm of rain observed at 68 DAS resulted in urea degradation. Thus, the late production of N2O emissions were, to some extent, explained by the delayed response of urea during the second fertilization event. Similarly, other studies showed a strong correlation between soil water content and N2O emissions following the urea fertilization event, even if precipitation occurred several days after fertilization [37,38]. Moreover, a decrease in N2O emissions was observed after the last fertilization event, from M7 to the end of the experiment, and reaching zero at M8 (Figure 5). In agreement with the latter observations were the findings made by [4,36]. N2O emissions from the control were only observed at M3, probably due to the simultaneous effect of weather conditions, harrowing, and the intrinsic soil N content. In this line, study [29] showed a slight increase in N2O emissions when soil pores were filled with more than 60% of water. Study [4] indicated that the physical conditions of fertilizers were responsible for increasing N2O emissions by 23% from digestate when compared to urea. Moreover, the dried climatic conditions occurring after M6, resulted in N2O emission differences between digestate and urea. Hence, the type of fertilizer had an impact on the amount of N2O emissions, which was related to the soil water content, N compounds, and C concentration present in fertilizers. This was consistent with studies [39,40], who reported an increase of NH4+-compounds in the soil with increasing N2O emissions. Overall, the higher water content found on digestate played a key role on N2O emission dynamics and, therefore, showed a significantly higher N2O emissions than in urea.
From the analysis on cumulative N2O emissions, 100D produced the highest N2O emissions because of the higher NH4+, organic C, and water content found in digestate (Table 1). The key role of water was also observed in the cumulative N2O emissions from 100U, showing very little differences when compared to 50U and 50D (Table 3). Due to its intrinsic characteristics of high-water content, N-compounds, and C content, digestate generated higher N2O emissions than urea.

4.4. Quinoa Yields and Environmental Impacts

The herein study did not show statistically significant differences in terms of biomass and yield production, neither for different types of fertilizers (digestate and urea) and N fertilization levels (0, 50, and 100 kg N ha−1). The soil N content was adequate to satisfy the N requirements of quinoa and, consequently, the additional N from fertilizers did not affect the final seed yield. Similar observations were made by studies [15,16,17,41], concluding that N requirements of quinoa were relatively low. However, the present results were discrepant to those of studies [10,19], which reported significant yield differences when applying higher amounts of poultry 1.7 Mg seed ha−1 with 54 Mg ha−1 poultry fertilizer) and slurry fertilizer (2.2 Mg ha−1 with 180 kg N ha−1). The findings of studies [12,13,14] were also in accordance with the latter research, showing a steady yield increase of up to 75–100 kg N ha−1 and 120 kg N ha−1. In addition, study [42] suggested that yields in south Italy were considerably lower (1.4 Mg ha−1) if sowing in May rather than in April. In our experiment, the sowing was delayed to May due to adverse weather conditions of April 2020 and, therefore, lower yields (800 kg ha−1) to those of study [42] were reported. This was due to high temperatures during the flowering stage (end of June) (Figure 2), which had a detrimental effect on seed pollination [43].
From the assessment of quinoa’s environmental impacts, this study reported lower values (0.46 kg CO2eq kg−1 of quinoa seed, average of all treatments) to those of studies [19,44] in Peru (1.03 and 0.88 kg CO2eq kg−1 of quinoa harvested, respectively). While the latter study used a Life Cycle Assessment (LCA) software to estimate GHG emissions, our study was based on field observations. Lastly, the daily CO2 emissions observed in our work (27.4 kg CO2-C ha−1 day−1 kg seed−1, average of all treatments) halved those of maize (40–60 kg CO2-C ha−1 day−1), whereas those of N2O (0.132 kg N2O-N ha−1 average values of all treatments) were notably lower to those of maize (2–7 kg N2O-N ha−1 during the growing season) [4,25,27]. This was invariably the result of higher agricultural inputs (fertilizers, pesticides, water, etc.) of maize compared to those of quinoa.

5. Conclusions

The expansion of crops with a low environmental impact and high nutritional properties, coupled with low-impact agricultural strategies, are increasingly drawing scientific and public attention. In this study, we evaluated GHG emissions of quinoa cultivation using different types of fertilizer and N rates in central Italy, Tuscany. We observed that the direct soil GHG emissions of digestate are higher (30% for CO2 and 40% for N2O) than those of urea. Although we only evaluated the direct emissions from the soil, further impact assessments should consider the indirect emissions from the production and subsequent spreading of fertilizers. However, as a by-product of a renewable resource, digestate is assumed to be a zero-impact fertilizer during the production phase, besides being accepted as an effective strategy for reusing resources within a farm. The former is key when comparing to conventional fertilizers such as urea, which requires less harrowing but has higher production emissions. For this reason, a more in-depth analysis is recommended both in the direct and indirect emissions deriving from different types of fertilizers. To conclude, based on our observations, the low N requirements of quinoa masked the effect of fertilization. Therefore, the actual convenience of fertilization must be regularly evaluated according to the agroclimatic conditions of each site. This study represents a starting point for the definition of low-impact quinoa production with the prospects of developing more sustainable farming systems around the world.

Author Contributions

Conceptualization, L.V. and J.A.-B.; Methodology, L.V., J.A.-B. and R.V.; Formal Analysis, J.A.-B.; Writing, L.V. and J.A.-B.; Writing—Review and Editing, A.D.M. and S.O.; Supervision, A.D.M. and S.O. All authors have read and agreed to the published version of the manuscript.

Funding

This work was partially funded by the project SYSTEMIC “An integrated approach to the challenge of sustainable food systems adaptive and mitigatory strategies to address climate change and malnutrition”, Knowledge hub on Nutrition and Food Security, in a joint action of JPI HDHL, JPI OCEANS and FACCE JPI launched in 2019 under the ERA NET ERA HDHL (n 696295).

Institutional Review Board Statement

Not applicable.

Informed Consent Statement

Not applicable.

Data Availability Statement

Not applicable.

Acknowledgments

The authors acknowledge Euro Pannacci from the Department of Agricultural, Food and Environmental Sciences (University of Perugia) for the provision of quinoa seed. Special recognitions to Azienda Agricola Marchese De’ Frescobaldi—Fattoria di Corte for providing this research with digestate.

Conflicts of Interest

The authors declare no conflict of interest.

References

  1. Walling, E.; Vaneeckhaute, C. Greenhouse gas emissions from inorganic and organic fertilizer production and use: A review of emission factors and their variability. J. Environ. Manag. 2020, 276, 111211. [Google Scholar] [CrossRef] [PubMed]
  2. De Klein, C.; Novoa, R.S.A.; Ogle, S.; Smith, K.A.; Rochette, P.; Wirth, T.C. N2O emissions from managed soils, and CO2 emis-sions from lime and urea application. In 2006 IPCC Guidelines for National Greenhouse Gas Inventories; Eggleston, S., Buendia, L., Miwa, K., Ngara, T., Tanabe, K., Eds.; Institute for Global Environmental Strategies, Tanabe: Hyama, Japan, 2006. [Google Scholar]
  3. Nkoa, R. Agricultural benefits and environmental risks of soil fertilization with anaerobic digestates: A review. Agron. Sustain. Dev. 2014, 34, 473–492. [Google Scholar] [CrossRef] [Green Version]
  4. Verdi, L.; Kuikman, P.J.; Orlandini, S.; Mancini, M.; Napoli, M.; Dalla Marta, A. Does the use of digestate to re-place mineral fertilizers have less emissions of N2O and NH3? Agric. For. Meteorol. 2019, 269, 112–118. [Google Scholar] [CrossRef]
  5. Cayuela, M.L.; Aguilera, E.; Sanz-Cobena, A.; Adams, D.C.; Abalos, D.; Barton, L.; Ryals, R.; Silver, W.L.; Alfaro, M.A.; Pappa, V.A. Direct nitrous oxide emissions in Mediterranean climate cropping systems: Emission factors based on a meta-analysis of available measurement data. Agric. Ecosyst. Environ. 2017, 238, 25–35. [Google Scholar] [CrossRef] [Green Version]
  6. Oertel, C.; Matschullat, J.; Zurba, K.; Zimmermann, F.; Erasmi, S. Greenhouse gas emissions from soils—A review. Geochemistry 2016, 76, 327–352. [Google Scholar] [CrossRef] [Green Version]
  7. Severin, M.; Fuss, R.; Well, R.; Garlipp, F.; Van den Weghe, H. Soil, slurry and application effects on greenhouse gas emissions. Plant Soil Environ. 2015, 61, 344–351. [Google Scholar] [CrossRef] [Green Version]
  8. Verdi, L.; Mancini, M.; Ljubojević, M.; Orlandini, S.; Dalla Marta, A. Greenhouse gas and ammonia emissions from soil: The effect of organic matter and fertilisation method. Ital. J. Agron. 2018, 13, 260–266. [Google Scholar] [CrossRef] [Green Version]
  9. Vega-Gálvez, A.; Miranda, M.; Vergara, J.; Uribe, E.; Puente, L.; Martínez, E.A. Nutrition facts and functional potential of quinoa (Chenopodium quinoa willd.), an ancient Andean grain: A review. J. Sci. Food Agric. 2010, 90, 2541–2547. [Google Scholar] [CrossRef]
  10. Jacobsen, S.-E.; Christiansen, J.L. Some Agronomic Strategies for Organic Quinoa (Chenopodium quinoa Willd.). J. Agron. Crop Sci. 2016, 202, 454–463. [Google Scholar] [CrossRef]
  11. Alandia, G.; Jacobsen, S.-E.; Kyvsgaard, N.C.; Condori, B.; Liu, F. Nitrogen Sustains Seed Yield of Quinoa under Intermediate Drought. J. Agron. Crop Sci. 2016, 202, 281–291. [Google Scholar] [CrossRef]
  12. Iqbal, S.M.B.S.; Afzal, I. Evaluating the Response of Nitrogen Application on Growth Development and Yield of Quinoa Genotypes. Int. J. Agric. Biol. 2014, 16, 886–892. [Google Scholar]
  13. Jacobsen, S.E.; Jørgensen, I.; Stølen, O. Cultivation of quinoa (Chenopodium quinoa) under temperate climatic conditions in Denmark. J. Agric. Sci. 1994, 122, 47–52. [Google Scholar] [CrossRef]
  14. Kaul, H.-P.; Kruse, M.; Aufhammer, W. Yield and nitrogen utilization efficiency of the pseudocereals amaranth, quinoa, and buckwheat under differing nitrogen fertilization. Eur. J. Agron. 2005, 22, 95–100. [Google Scholar] [CrossRef]
  15. Benhalbib, O. Chapter 6.1.5: Status of quinoa production and research in Morocco. In State of the Art Report on Quinoa around the World in 2013; Bazile, D., Bertero, H.D., Nieto, C., Eds.; FAO: Rome, Italy, 2015; pp. 478–491. [Google Scholar]
  16. Alvar-Beltrán, J.; Saturnin, C.; Dao, A.; Dalla Marta, A.; Sanou, J.; Orlandini, S. Effect of drought and nitrogen fertilisation on quinoa (Chenopodium quinoa Willd.) under field conditions in Burkina Faso. Ital. J. Agrometeorol. 2019, 1, 33–43. [Google Scholar]
  17. Moreale, A. In the Quinoa Project: Wageningen University. 1993. Available online: http://edepot.wur.nl/354101 (accessed on 27 August 2018).
  18. Bilalis, D.; Kakabouki, I.; Karkanis, A.; Travlos, I.; Triantafyllidis, V.; Hela, D. Seed and Saponin Production of Organic Quinoa (Chenopodium quinoa Willd.) for different Tillage and Fertilization. Not. Bot. Horti Agrobot. Cluj-Napoca 2012, 40, 42–46. [Google Scholar] [CrossRef] [Green Version]
  19. Cancino-Espinoza, E.; Vázquez-Rowe, I.; Quispe, I. Organic quinoa (Chenopodium quinoa L.) production in Peru: Environmental hotspots and food security considerations using Life Cycle Assessment. Sci. Total Environ. 2018, 637–638, 221–232. [Google Scholar] [CrossRef]
  20. Sellami, M.H.; Pulvento, C.; Lavini, A. Agronomic Practices and Performances of Quinoa under Field Condi-tions: A Systematic Review. Plants 2021, 10, 72. [Google Scholar] [CrossRef]
  21. Parkin, T.B.; Venterea, R.T. USDA-ARS GRACEnet project protocols, chapter 3. In Chamber-Based Trace Gas Flux Measurements; Impedans: Dublin, Ireland, 2010; (Replace Original Version of April 2003). [Google Scholar]
  22. IPCC. Climate Change. The Physical Science Basis. In Contribution of Working Group I to the Fifth Assessment Report of the Intergovernmental Panel on Climate Change; Cambridge University Press: Cambridge, UK; New York, NY, USA, 2013. [Google Scholar]
  23. Maucieri, C.; Barbera, A.C.; Borin, M. Effect of injection depth of digestate liquid fraction on soil carbon dioxide emission and maize biomass production. Ital. J. Agron. 2016, 11, 6–11. [Google Scholar] [CrossRef]
  24. Omonode, R.A.; Vyn, T.J.; Smith, D.R.; Hegymegi, P.; Gál, A. Soil carbon dioxide and methane fluxes from long-term tillage systems in continuous corn and corn–soybean rotations. Soil Tillage Res. 2007, 95, 182–195. [Google Scholar] [CrossRef]
  25. Ussiri, D.A.N.; Lal, R. Long-term tillage effects on soil carbon storage and carbon dioxide emissions in continuous corn cropping system from an alfisol in Ohio. Soil Till. Res. 2009, 104, 39–47. [Google Scholar] [CrossRef]
  26. Paustian, K.; Six, J.; Elliott, E.T.; Hunt, H.W. Management options for reducing CO2 emissions from agricul-tural soils. Biogeochemistry 2002, 48, 147–163. [Google Scholar] [CrossRef]
  27. Zhai, L.-M.; Liu, H.-B.; Zhang, J.-Z.; Huang, J.; Wang, B.-R. Long-Term Application of Organic Manure and Mineral Fertilizer on N2O and CO2 Emissions in a Red Soil from Cultivated Maize-Wheat Rotation in China. Agric. Sci. China 2011, 10, 1748–1757. [Google Scholar] [CrossRef]
  28. Sänger, A.; Geisseler, D.; Ludwig, B. Effects of moisture and temperature on greenhouse gas emissions and C and N leaching losses in soil treated with biogas slurry. Biol. Fertil. Soils 2011, 47, 249–259. [Google Scholar] [CrossRef]
  29. Pezzolla, D.; Bol, R.; Gigliotti, G.; Sawamoto, T.; López, A.L.; Cardenas, L.; Chadwick, D. Greenhouse gas (GHG) emissions from soils amended with digestate derived from anaerobic treatment of food waste. Rapid Commun. Mass Spectrom. 2012, 26, 2422–2430. [Google Scholar] [CrossRef]
  30. Snyder, C.S.; Bruulsema, T.W.; Jensen, T.L.; Fixen, P.E. Review of greenhouse gas emissions from crop production systems and fertilizer management effects. Agric. Ecosyst. Environ. 2009, 133, 247–266. [Google Scholar] [CrossRef]
  31. Le Mer, J.; Roger, P. Production, oxidation, emission and consumption of methane by soils: A review. Eur. J. Soil Biol. 2001, 37, 25–50. [Google Scholar] [CrossRef]
  32. Tiwari, S.; Singh, J.S.; Singh, D.P. Methanotrophs and CH4 sink: Effect of human activity and ecological perturbations. Clim. Chang. Environ. Sustain. 2015, 3, 35–50. [Google Scholar] [CrossRef]
  33. Schimel, J.P.; Holland, E.A.; Valentine, D. Controls on methane flux from terrestrial ecosystems. In Agricultural Ecosystem Effects on Trace Gases and Global Climate Change; Harper, L.A., Mosier, A.R., Duxbury, J.M., Rolston, D.E., Eds.; American Society of Agronomy: Madison, WI, USA, 1993; pp. 167–182. [Google Scholar]
  34. Verdi, L.; Mancini, M.; Napoli, M.; Orlandini, S.; Dalla Marta, A. Soil carbon emissions from maize under different fertilization methods in an extremely dry summer in Italy. Ital. J. Agrometeorol. 2019, 2, 3–10. [Google Scholar]
  35. Ball, B.C.; Scott, A.; Parker, J.P. Field N2O, CO2 and CH4 fluxes in relation to tillage, compaction and soil quality in Scotland. Soil Tillage Res. 1999, 53, 29–39. [Google Scholar] [CrossRef]
  36. Wulf, S.; Maeting, M.; Clemens, J. Application technique and slurry co-fermentation effects on ammonia, nitrous oxide and methane emissions after spreading: II. Greenhouse gas emissions. J. Environ. Qual. 2002, 31, 1795–1801. [Google Scholar] [CrossRef]
  37. Luo, J.; Ledgard, S.; Lindsey, S. Nitrous oxide emissions from application of urea on New Zealand pasture. N. Z. J. Agric. Res. 2007, 50, 1–11. [Google Scholar] [CrossRef]
  38. Soares, J.R.; Cassman, N.A.; Kielak, A.M.; Pijl, A.; Carmo, J.B.; Lourenco, K.S.; Laanbroek, H.J.; Cantarella, H.; Kuramae, E.E. Nitrous oxide emissions related to ammonia-oxidizing bacteria and mitigation options from N fertilization in a tropical soil. Sci. Rep. 2016, 6, 30349. [Google Scholar] [CrossRef] [PubMed] [Green Version]
  39. Mosier, A.R. Exchange of gaseous nitrogen compounds between agricultural systems and the atmosphere. Plant Soil 2001, 228, 17–27. [Google Scholar] [CrossRef]
  40. Signor, D.; Cerri, C.E.P.; Conant, R. N2O emissions due to nitrogen fertilizer applications in two regions of sugarcane cultivation in Brazil. Environ. Res. Lett. 2013, 8, 015013. [Google Scholar] [CrossRef]
  41. Alvar-Beltrán, J.; Dao, A.; Marta, A.D.; Saturnin, C.; Casini, P.; Sanou, J.; Orlandini, S. Effect of Drought, Nitrogen Fertilization, Temperature, and Photoperiodicity on Quinoa Plant Growth and Development in the Sahel. Agronomy 2019, 9, 607. [Google Scholar] [CrossRef] [Green Version]
  42. Pulvento, C.; Riccardi, M.; Lavini, A.; d’Andria, R.; Iafelice, G.; Marconi, E. Field trial evaluation of two chenopodium quinoa genotypes grown under rain-fed conditions in a typical Mediterranean environment in South Italy. J. Agron. Crop Sci. 2010, 196, 407–411. [Google Scholar] [CrossRef]
  43. Alvar-Beltrán, J.; Verdi, L.; Marta, A.D.; Dao, A.; Vivoli, R.; Sanou, J.; Orlandini, S. The effect of heat stress on quinoa (cv. Titicaca) under controlled climatic conditions. J. Agric. Sci. 2020, 158, 255–261. [Google Scholar] [CrossRef]
  44. Vázquez-Rowe, I.; Larrea-Gallegos, G.; Villanueva-Rey, P.; Gilardino, A. Climate change mitigation opportunities based on carbon footprint estimates of dietary patterns in Peru. PLoS ONE 2017, 12, e0188182. [Google Scholar] [CrossRef]
Figure 1. Experimental design with different N-fertilization levels: Control (0 kg N ha−1); 50 D (50 kg N ha−1 as digestate); 100 D (100 kg N ha−1 as digestate); 50 U (50 kg N ha−1 as urea); 100 U (100 kg N ha−1 as urea).
Agronomy 12 01015 g001
Figure 2. Average, maximum and minimum temperatures (°C), and precipitation (mm) observed during the growing season (May–August 2019).
Agronomy 12 01015 g002
Figure 3. CO2 emission fluxes (kg C day−1 ha−1) during the growing cycle for the control (CON), urea 50 kg N ha−1 (50U), urea 100 kg N ha−1 (100U), digestate 50 kg N ha−1 (50D), and digestate 100 kg N ha−1 (100D). Results that do not share letters are significantly different from each other (p < 0.05).
Agronomy 12 01015 g003
Figure 4. CH4 emission fluxes (kg C day−1 ha−1) during the growing cycle for the control (CON), urea 50 kg N ha−1 (50 U), urea 100 kg N ha−1 (100 U), digestate 50 kg N ha−1 (50 D), and digestate 100 kg N ha−1 (100 D). Letters are not displayed since no statistical differences were observed between treatments (p < 0.05)).
Agronomy 12 01015 g004
Figure 5. N2O emission fluxes (kg N day−1 ha−1) during the growing cycle for the control (CON), urea 50 kg N ha−1 (50U), urea 100 kg N ha−1 (100U), digestate 50 kg N ha−1 (50D), and digestate 100 kg N ha−1 (100D). Results that do not share letters are significantly different from each other (p < 0.05).
Agronomy 12 01015 g005
Table 1. Elemental characterization of fertilizers (urea and digestate) used in this experiment.
UnitsUreaDigestate
Organic C%-3.02
N content total%460.39
N-NH4+%-0.30
N-NO3%-<0.01
P content totalmL l−1-452
K content totalmL l−1-2457
Dry matter%1001.89
Table 2. ANOVA test (±Standard Deviation) for seed yield (kg ha−1), aboveground biomass (kg ha−1), and harvest index.
Fertilizer
Type
N-Treatment
(kg ha−1)
Yield
(kg ha−1)
Biomass
(kg ha−1)
Harvest Index
(%)
Control0844 ± 126 a3188 ± 382 a22.4 ± 3.27 a
Digestate50750 ± 154 a3188 ± 382 a23.6 ± 3.46 a
100792 ± 138 a3832 ± 856 a20.9 ± 2.42 a
Urea50852 ± 106 a3410 ± 338 a25.0 ± 3.07 a
100894 ± 422 a4064 ± 2244 a22.7 ± 2.22 a
Control 844 ± 126 a3188 ± 318 a22.4 ± 3.27 a
Digestate772 ± 132 a3510 ± 690 a22.3 ± 3.40 a
Urea874 ± 276 a3738 ± 1480 a23.9 ± 2.72 a
0844 ± 126 a3188 ± 318 a22.4 ± 3.27 a
50800 ± 130 a3298 ± 344 a24.3 ± 3.40 a
100844 ± 286 a3948 ± 1524 a21.8 ± 2.30 a
Means that do not share a letter are significantly different from each other (p < 0.05).
Table 3. Total cumulative GHG emissions during the growing season and daily GHG fluxes.
GHGs during the Growing SeasonGHGs Average Day−1
Fertilizer TypeN-Treatment
(kg ha−1)
CO2
(kg C ha−1)
CH4
(kg C ha−1)
N2O
(kg N ha−1)
CO2
(kg C ha−1 day−1)
CH4
(kg C ha−1 day−1)
N2O
(kg N ha−1 day−1)
Control0223.1 ± 16.4 b1.73 ± 0.270.04 ± 0.02 c23.3 ± 1.6 b0.21 ± 0.030.003 ± 0.001 c
Digestate50293.6 ± 20.9 ab2.40 ± 0.340.15 ± 0.01 b30.6 ± 2.9 ab0.30 ± 0.040.015 ± 0.001 b
100337.8 ± 19.7 a2.29 ± 0.260.23 ± 0.01 a36.1 ± 2.3 a0.28 ± 0.030.025 ± 0.003 a
Urea50220.7 ± 32.4 b2.23 ± 0.940.13 ± 0.04 b 23.4 ± 3.7 b0.27 ± 0.100.012 ± 0.005 b
100229.1 ± 45.5 b2.22 ± 0.660.11 ± 0.03 b23.5 ± 5.1 b0.26 ± 0.080.010 ± 0.003 b
Control223.1 ± 16.4 b1.73 ± 0.270.04 ± 0.02 c23.3 ± 1.6 b0.21 ± 0.030.003 ± 0.001 c
Digestate 315.7 ± 30.3 a2.34 ± 0.280.19 ± 0.05 a33.3 ± 3.8 a0.29 ± 0.030.020 ± 0.006 a
Urea 224.9 ± 35.6 b2.22 ± 0.720.12 ± 0.03 b23.5 ± 4.0 b0.26 ± 0.080.011 ± 0.004 b
0223.1 ± 16.41.73 ± 0.270.04 ± 0.02 b23.3 ± 1.60.21 ± 0.030.003 ± 0.001 b
50257.1 ± 46.82.31 ± 0.640.14 ± 0.03 a 27.0 ± 4.90.28 ± 0.070.013 ± 0.004 a
100283.5 ± 67.32.25 ± 0.450.17 ± 0.07 a29.8 ± 7.80.27 ± 0.060.017 ± 0.008 a
Means that do not share a letter are statistically significantly different from each other (p < 0.05).
Table 4. Yield-scaled emissions (CO2, CH4, and N2O) per kg of quinoa seed produced and Global Warming Potential (GWP) (kg CO2eq kg seed−1) of each treatment.
Fertilizer TypeN-Treatment
(kg ha−1)
CO2
(kg C kg Seed−1)
CH4
(mg C kg Seed−1)
N2O
(mg N kg Seed−1)
CH4
(kg CO2 eq
kg Seed−1)
N2O
(kg CO2 eq
kg Seed−1)
Total
(kg CO2 eq
kg Seed−1)
Control00.266 ± 0.0242.1 ± 0.30.04 ± 0.02 b0.057 ± 0.0070.013 ± 0.006 b0.337 ± 0.024
Digestate500.402 ± 0.0823.2 ± 0.20.21 ± 0.05 a0.090 ± 0.0060.061 ± 0.016 a0.553 ± 0.100
1000.438 ± 0.0973.0 ± 0.70.30 ± 0.06 a0.083 ± 0.0210.089 ± 0.018 a0.609 ± 0.134
Urea500.265 ± 0.0762.7 ± 0.1.50.15 ± 0.05 ab 0.076 ± 0.0420.045 ± 0.016 ab 0.386 ± 0.128
1000.301 ± 0.1453.0 ± 1.90.15 ± 0.08 ab0.084 ± 0.0520.044 ± 0.025 ab0.429 ± 0.213
Control0.266 ± 0.024 b2.1 ± 0.30.04 ± 0.02 b0.057 ± 0.0070.013 ± 0.006 b0.337 ± 0.024 b
Digestate0.420 ± 0.083 a3.1 ± 0.50.25 ± 0.07 a0.087 ± 0.0140.075 ± 0.021 a0.581 ± 0.110 a
Urea0.283 ± 0.105 ab2.9 ± 1.50.15 ± 0.06 b0.080 ± 0.0430.045 ± 0.019 b0.408 ± 0.159 ab
00.266 ± 0.0242.1 ± 0.30.04 ± 0.02 b0.057 ± 0.0070.013 ± 0.006 b0.337 ± 0.024
500.334 ± 0.1033.0 ± 1.00.18 ± 0.06 ab0.083 ± 0.0280.053 ± 0.017 ab0.470 ± 0.137
1000.370 ± 0.1333.0 ± 1.30.22± 0.10 a0.084 ± 0.0350.067 ± 0.031 a 0.519 ± 0.187
Means that do not share a letter are statistically significantly different from each other (p < 0.05).
Publisher’s Note: MDPI stays neutral with regard to jurisdictional claims in published maps and institutional affiliations.

